Embed Size (px)
Citation preview
The State of the Instructional Materials Market: 2018 Report
Spring 2019
EdReports.orgMark LaVenia, Ph.D., Project Lead

iThe State of the Instructional Materials Market: 2018 Report
AcknowledgmentsWe gratefully acknowledge the Overdeck Family Foundation for providing the financial support for Mark LaVenia to conduct this research with EdReports as a Strategic Data Project Fellow through the Center for Education Policy Research at Harvard University. We recognize David Blazar at the University of Maryland for the support and critical review he provided Mark LaVenia as his Strategic Data Project Faculty Mentor.
We extend our appreciation to the RAND Corporation and the Bill & Melinda Gates Foundation for permission to use the American Educator Panels (AEP) data for these analyses. We also thank Kitamba for supporting access to the AEP data and providing guidance on data use and interpretation.
We thank Julia Kaufman at the RAND Corporation, Morgan Polikoff at the University of Southern California, Isabella Velasquez at the Bill & Melinda Gates Foundation, and Leigh Ann West at the Charles and Lynn Schusterman Family Foundation for reviewing and providing critical feedback on early drafts of the report.
Contributors to the production of this report include Eric Hirsch and Lauren Weisskirk for input on study aims, foci, and interpretation of results. Jessica Barrow, Janna Chan, and Lauren Weisskirk all contributed to the writing and editing of this report.
We would also like to thank the hundreds of EdReports educator reviewers who produce comprehensive reports of instructional materials on behalf of teachers and students across the country. It is through their dedication and hard work that the education field has access to credible, evidence-based information to equip teachers with excellent materials nationwide.
About the Project LeadMark LaVenia is a Data Strategist at EdReports and a Strategic Data Project Fellow through the Center for Education Policy Research at Harvard University. Prior to joining EdReports, Mark was a methodologist at the Learning Systems Institute at Florida State University, where his responsibilities consisted of executing experimental research designs, instrument development, statistical analysis, and report writing. His interests in education research and data analysis stem from his early-career experience as an elementary school teacher, serving as a special education teacher and site-based literacy coach, and graduate training as an Institute of Education Sciences Predoctoral Interdisciplinary Research Training Fellow through Florida State University’s Florida Center for Reading Research. Mark earned a Ph.D. in Educational Leadership and Policy from Florida State University.
About EdReports.orgEdReports.org is an independent nonprofit designed to improve K–12 education. EdReports.org increases the capacity of teachers, administrators, and leaders to seek, identify, and demand the highest quality instructional materials. Drawing upon expert educators, our reviews of instructional materials and support of smart adoption processes equip teachers with excellent materials nationwide.
EdReports and associated marks and logos are the trademark property of EdReports.org, Inc.
Limited Print and Electronic Distribution Rights This work is licensed under a Creative Commons Attribution. Licensees may copy, distribute, display and perform only verbatim copies of reports, not derivative works and remixes based on it, and must attribute and link back to EdReports.org.
For more information on this publication, visit www.edreports.org/impact/state-of-the-market
© Copyright 2019 EdReports.org, Inc.

iiThe State of the Instructional Materials Market: 2018 Report
Executive SummaryOur PurposeInstructional materials make a difference for student achievement. Research shows that students learn primarily through their interactions with teachers and content. The U.S. K–12 curriculum market is a $8 billion a year industry, which receives a large portion of its revenue from the public sector. Yet very little is known about curriculum adoption and procurement and even less is known about the materials in use in classrooms. Because of the critical role instructional materials play in student learning, it is vital for all stakeholders to have a better understanding of the materials market—namely, what high-quality, standards-aligned programs are available and how teachers are using them.
Since its founding in 2014, EdReports has worked to identify and increase the demand for high-quality, standards-aligned K–12 instructional materials in service of improved student learning outcomes. Educator review teams evaluate comprehensive, year-long materials for alignment to standards and other characteristics of quality. The purpose of our evidence-rich reviews is to support educators with credible information as they choose and implement quality materials for their communities.
To date, the organization has published more than 500 reports of English language arts (ELA), math, and science materials available for free on EdReports.org. These reports indicate if materials meet, partially meet, or do not meet expectations for standards alignment.
In 2018, we conducted research to better understand the materials landscape and to evaluate the value and impact of our work. We drew upon data from EdReports reviews, information about publisher and copyright dates, and data from the American Teacher Panel (ATP) nationally representative survey on ELA and math curriculum use during the 2017–2018 school year to better understand the following questions:
• What percentage of comprehensive, year-long materials that are published and marketed as being standards-aligned meets EdReports’ criteria for alignment?
• What proportion of the K–12 ELA and mathematics materials used regularly in classrooms meets expectations for alignment?
• Is there a relationship between the length of time that an EdReports review has been available for a product and the percent of market share for that product?
Key FindingsThrough our research, we have identified a series of key findings we believe to be meaningful to the field. This analysis can support future work as organizations seek to ensure that all students have access to the quality materials they need to be college- and career-ready.
Aligned Materials are Available
EdReports has published reports for 98 percent of the known English language arts market and 95 percent of the known math market.1 Of the materials we have reviewed: 49 percent of the ELA market meets EdReports criteria for standards alignment and 28 percent of the math market meets expectations for standards alignment. This means that there are many aligned options available for districts to adopt and for teachers to use.
Most Materials Used in Classrooms are Not Aligned to Standards
Even though nearly half the ELA materials and more than a quarter of the math materials meet expectations for standards-alignment, these materials are not used in classrooms enough. Only 15 percent of ELA materials and 23 percent of math materials regularly used by teachers meet EdReports criteria for alignment. The gap between what is available and what is being used remains one of the largest challenges to ensuring the promise of quality materials.
1 We define the “known market” as comprehensive, year-long programs. This excludes materials that are created directly by teachers or teachers relying on supplemental materials curated from public spaces such as Google or Pinterest. 62 percent of all ELA materials and 84 percent of all math materials used in classrooms qualify as the known market.

iiiThe State of the Instructional Materials Market: 2018 Report
What’s more, 38 percent of materials used in ELA classrooms and 16 percent in math are “unspecified,” content which may include formal published materials, district-created materials, or materials procured online from sources such as Teachers Pay Teachers or Pinterest. Until we learn more about what these products are, we are unable to discuss their alignment and quality.
Information on Alignment Can Shape the Market
Before factoring in how long EdReports reviews have been published, we see that the longer products that meet or partially meets expectations for alignment are in the field, the more likely they are to be used by educators. Materials that do not meet expectations for alignment decrease in use by educators the longer that they are on the market. When we include the length of time that EdReports reviews have been available, there are changes to this predicted use or “market share.”
Our research suggests that, accounting for the effect of the age of the material, there is an association between the length of time an EdReports review has been available for a material and the use of the material in the classroom. This association is seen after reports have been in the field a little over a year.
There is approximately a 1 percent increase of teachers that report using aligned materials for each year that the EdReports review of the program is published. For materials that partially meet or do not meet alignment expectations, we see the reverse. We see a roughly 1 percent decrease in the number of teachers that report using these products.
In short, the information EdReports provides about the products is associated with more teachers using materials that are aligned to college- and career-ready standards in classrooms. EdReports has anecdotal evidence that districts use our reports to inform adoption decisions, but the findings reported in this paper are the first statistical analysis to suggest that there is a possible association between the availability of EdReports reviews and greater use of aligned materials.
A Call to ActionWe are excited by these findings, but also humbled and energized by how much work is left to be done. This report finds that only a small fraction of students are experiencing aligned curriculum even weekly, despite there being many options available to districts as they adopt.
This finding corroborates other recent research by TNTP and EdTrust that both looked closely at the quality of classroom assignments and found that most were off grade level or not aligned to standards. We must do more to ensure that districts are not only choosing great programs, but that teachers have the professional learning and systems support they need to implement those programs well. Improvement to materials will matter little if students do not get the opportunity to experience them.
We also see a critical need for more information about curriculum adoption and procurement. As a field, we must study policies that support the selection of high-quality instructional materials and learn from places that have high rates of aligned materials in use.
For example, our initial findings offer some insights on state adoption practices. We see no association between states with recommended adoption lists and the percentage of aligned materials in use. In states with mandated curriculum adoption lists, we actually see an associated decrease in the percentage of aligned materials in use. We highlight this data as a call for state leaders to consider how adoption lists are created and what additional resources might be consulted to ensure districts are choosing from a slate of quality, aligned materials.

ivThe State of the Instructional Materials Market: 2018 Report
Table of Contents
Tables and Figures
What is the State of the Instructional Materials Market? ..........................................................................................1
Aligned Materials are Available ..............................................................................................................................................1
Most Materials Used in Classrooms are Not Aligned to Standards .......................................................................................2
Information on Alignment is Shaping the Market ..................................................................................................................4
Illustrations of How Reports are Used …………………………… .........................………………………………………………..8
Next Steps ..............................................................................................................................................................................9
How these Analyses were Conducted ..................................................................................................................................10
References ................................................................................................................................................................11
Appendix A...............................................................................................................................................................12
Appendix B ...............................................................................................................................................................16
Table 1 Summary Statistics for EdReports Grade-Level Reports by Standards-Alignment Rating .....................................................2
Table 2 U.S. K-12 Percent Market Share by Standards-Alignment Rating and Review Status ............................................................3
Figure 1 K–12 ELA materials available to teachers and materials in use in classrooms by standards-alignment rating. .....................3
Figure 2 K–12 math materials available to teachers and materials in use in classrooms by standards-alignment rating. ....................3
Figure 3 Plots illustrating the interaction of series age and report age for materials rated “meets expectations” for standards alignment. .........................................................................................................................................................5
Figure 4 Plots illustrating the interaction of series age and report age for materials rated “partially meets expectations” for standards alignment. .........................................................................................................................................................6
Figure 5 Plots illustrating the interaction of series age and report age for materials rated “does not meet expectations” for standards alignment. .........................................................................................................................................................7
Figure A1 Elementary ELA market share by EdReports standards-alignment rating and review status. ..............................................12
Figure A2 Middle grades ELA market share by EdReports standards-alignment rating and review status. .........................................12
Figure A3 High school ELA market share by EdReports standards-alignment rating and review status. .............................................13
vThe State of the Instructional Materials Market: 2018 Report
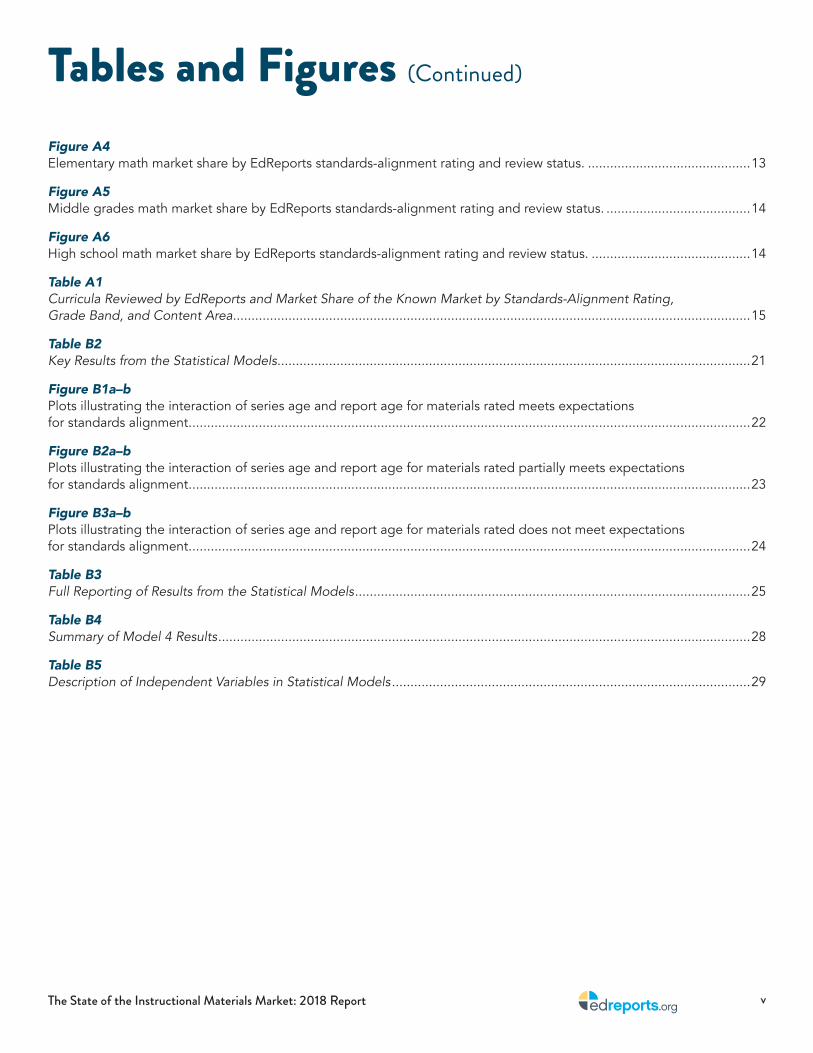
Figure A4 Elementary math market share by EdReports standards-alignment rating and review status. ............................................13
Figure A5 Middle grades math market share by EdReports standards-alignment rating and review status. .......................................14
Figure A6 High school math market share by EdReports standards-alignment rating and review status. ...........................................14
Table A1 Curricula Reviewed by EdReports and Market Share of the Known Market by Standards-Alignment Rating, Grade Band, and Content Area ............................................................................................................................................15
Table B2 Key Results from the Statistical Models ................................................................................................................................21
Figure B1a–b Plots illustrating the interaction of series age and report age for materials rated meets expectations for standards alignment. .......................................................................................................................................................22
Figure B2a–b Plots illustrating the interaction of series age and report age for materials rated partially meets expectations for standards alignment. .......................................................................................................................................................23
Figure B3a–b Plots illustrating the interaction of series age and report age for materials rated does not meet expectations for standards alignment. .......................................................................................................................................................24
Table B3 Full Reporting of Results from the Statistical Models ...........................................................................................................25
Table B4 Summary of Model 4 Results ................................................................................................................................................28
Table B5 Description of Independent Variables in Statistical Models .................................................................................................29
Tables and Figures (Continued)

1The State of the Instructional Materials Market: 2018 Report
What is the State of the Instructional Materials Market?The $8 billion a year K–12 curriculum market is predominantly public dollar expenditures going toward materials used for public school students.2 Therefore, it might come as a surprise to learn that data on school and district curriculum adoption and procurement are not systematically collected and archived for public access.
Studies indicate that the quality of instructional materials has an impact on student learning outcomes and can be a way to improve the quality of students’ overall classroom success.3 For the benefit of the broader public interest and in service of our organizational mission, EdReports seeks to expand our understanding on the state of the instructional materials market and whether, how, and why it is changing.
EdReports is an independent nonprofit designed to improve K–12 education by increasing the capacity of teachers, administrators, and leaders to seek, identify, and demand the highest quality instructional materials. Drawing upon expert educators, our reviews of instructional materials and support of smart adoption processes aim to equip teachers with excellent materials nationwide.
EdReports’ theory of action posits an improvement of K–12 instructional materials by identifying high-quality, college- and career-ready standards-aligned materials and increasing demand for such materials. Across our more than 500 reviews, we have seen that newer materials are more likely to meet EdReports expectations for standards alignment. In this report, we pursue this observation and ask:
• What percentage of comprehensive, year-long materials that are published and marketed as being standards-aligned meets EdReports’ criteria for alignment?
• What proportion of the K–12 ELA and mathematics materials used regularly in classrooms meets expectations for alignment?
• Is there a relationship between the length of time that an EdReports review has been available for a product and the percent of market share for that product?
To address these questions, we draw upon data from EdReports reviews, information about publisher and copyright dates, and data from the American Teacher Panel’s (ATP) nationally representative survey on ELA and math curriculum use during the 2017–2018 school year.4 Our definition of market share is based on the percent of teachers who report using a given curriculum once a week or more in their classroom.
Aligned Materials are AvailableEdReports published 472 reviews for K-12 math and ELA materials between March 2015 and April 2019. We find that 49% of ELA materials and 28% of math materials meet expectations for standards alignment.5 In Table 1, we show EdReports grade-level ELA and math reports by standards-alignment rating and grade level. In the table, we see confirmation of our observation that newer materials are more likely to meet expectations for standards alignment. Aligned, partially aligned, and not aligned materials are on average three, four, and six years of age, respectively.
2 Simba (2018)3 Jackson and Makarin, 2017; Koedel, Li, Polikoff, Hardaway, and Wrabel, 2017; TNTP, 2018.4 RAND Corporation, 2018. See the Appendix <edreports.org/impact/state-of-the-market> for description of our evaluation of available data and
rationale for using the 2018 ATP data for these analyses.5 For these analyses, reports were constrained to materials with a 2018 copyright or older.

2The State of the Instructional Materials Market: 2018 Report
Table 1. Summary statistics for EdReports Grade-Level Reports by Standards-Alignment Rating
Meets Partially Meets Does Not Meet All Ratings
n % n % n % n %
ELA & Math K–12 169 35.8 130 27.5 173 36.7 472 100
Content-Grade Strata
ELA 86 49.1 52 29.7 37 21.1 175 100
K–5 30 37.0 27 33.3 24 29.6 81 100
6–8 32 59.3 16 29.6 6 11.1 54 100
9–12 24 60.0 9 22.5 7 17.5 40 100
Math 83 27.9 78 26.3 136 45.8 297 100
K–5 31 24.6 34 27.0 61 48.4 126 100
6–8 28 34.6 18 22.2 35 43.2 81 100
9–12 24 26.7 26 28.9 40 44.4 90 100
Series Age 2.9 ± 1.3 3.8 ± 1.8 6.0 ± 2.5 4.3 ± 2.4
EdReports’ review process follows a sequence of three gateways, which reflects the importance of standards alignment to the fundamental design elements of the materials and considers other attributes of high-quality curriculum as recommended by educators. This report considers whether expectations were met for Gateways 1 and 2, which attend to characteristics of standards alignment. Are the instructional materials aligned to the standards? Are all standards present and treated with appropriate depth and quality required to support student learning? For more information on EdReports’ rubrics and definitions for standards alignment, please visit www.EdReports.org/reports/rubrics-evidence.
Most Materials Used in Classrooms are Not Aligned to StandardsWhen we incorporate data from the 2017–2018 RAND American Educator Panels Survey into our analysis, we gain insights into how much of the market EdReports has reviewed and what percent of materials regularly used by teachers are aligned.
Teachers were asked in the survey to indicate which year-long, comprehensive materials they use regularly. They were also provided a chance to respond “other.” We categorize the listed materials as comprising the “known market.” We conclude that the 472 EdReports published reviews represent 98% of the known ELA market and 93% of the known math market.
This data also suggests that there is an “unknown market” of materials that EdReports has not reviewed but is used in classrooms at least once a week. Better understanding this unknown market—comprising 38% of ELA and 16% of math materials—is an area of great interest to EdReports. Later in this report, we describe work currently underway to build a database that can support better analysis of the materials procured and in use across the country.
Nearly half of the ELA materials and more than a quarter of the math materials are aligned to standards; however, when we apply the 2017–2018 RAND American Educator Panels Survey data, we find that these materials are not being used at high rates. Only 15 percent of materials regularly used by ELA teachers and 23 percent of the materials used by math teachers meet expectations for standards alignment.
Table 2 presents the percent of the comprehensive K–12 ELA and math materials in use in classrooms that meets, partially meets, and does not meet expectations. The table also shows materials that are under review by EdReports, not yet reviewed, or unspecified. Estimates by content-grade strata are presented in Appendix A Figures A1–A6.

3The State of the Instructional Materials Market: 2018 Report
Table 2. U.S. K–12 Percent Market Share by Standards-Alignment Rating and Review Status
Percent ELA market Percent math market
ELA & Math K-12 Estimate SE Estimate SE
Materials reviewed by EdReports
Meets expectations 14.7 0.2 23.0 0.3
Partially meets expectations 29.1 0.4 28.4 0.3
Does not meet expectations 16.6 0.5 28.4 0.3
Currently under review 1.5 0.2 0.4 0.4
Subtotal 61.8 0.0 80.2 0.2
Other Materials
Known series not reviewed 0.0 0.0 3.5 0.4
Unspecified Materials 38.2 0.9 16.4 0.9
Subtotal 38.2 0.9 19.8 0.6
Figures 1 and 2 present a comparison by EdReports alignment rating between the percentage of materials available to teachers and percentage of materials in use in classrooms.
Figure 1. K–12 ELA materials available to teachers and materials in use in classrooms by standards-alignment rating.
Figure 2. K–12 math materials available to teachers and materials in use in classrooms by standards-alignment rating.
Meets Expectations (materials EdReports has reviewed) 49.1
14.7
29.7
29.1
21.1
16.6
1.5
0.0
38.2
Does Not Meet Expectations (materials EdReports has reviewed)
Meets Expectations (materials teachers report using regularly)
Does Not Meet Expectations (materials teachers report using regularly)
Currently Under Review
Known Series Not Reviewed
Unspecified Instructional Materials
Partially Meets Expectations (materials EdReports has reviewed)
Partially Meets Expectations (materials teachers report using regularly)
Meets Expectations (materials EdReports has reviewed) 27.9
23.0
26.3
28.4
45.8
28.4
0.4
3.5
16.4
Does Not Meet Expectations (materials EdReports has reviewed)
Meets Expectations (materials teachers report using regularly)
Does Not Meet Expectations (materials teachers report using regularly)
Currently Under Review
Known Series Not Reviewed
Unspecified Instructional Materials
Partially Meets Expectations (materials EdReports has reviewed)
Partially Meets Expectations (materials teachers report using regularly)

4The State of the Instructional Materials Market: 2018 Report
Our key takeaway from these comparisons is that, although a substantial proportion of materials available to educators meet expectations for standards alignment, a smaller proportion of the materials used in classrooms across the U.S. meet such expectations. The gap between what is available and what is being used remains one of the largest challenges to ensuring that all students have access to high-quality, standards-aligned materials.
Information on Alignment Can Shape the MarketOur next level of analysis was to fit models to better understand the market and predicted market share, as defined by the percentage of teachers reporting using materials more than once a week in the RAND study. Table B2 in the appendix shows the relationship between percent market share and the copyright year (“series age”) and how long reports for materials have been available (“report age”).
Findings suggest that reviews are affecting the market and supporting conditions that lead teachers to use more aligned materials. These results were revealed through statistical models that found series age and report age to interact in the prediction of percent market share.6
Before factoring in the length of time EdReports reviews have been available, we see that the longer products that meet or partially meet expectations for alignment are in the field, the more likely they are to be used. Materials that do not meet expectations for alignment decrease in market share the longer that they are on the market. When we include the length of time that EdReports reviews have been available, there are changes to this predicted market share.
For a curriculum that meets expectations for standards alignment, the report age was associated with a 1 percent increase in teachers who report using aligned materials at least once a week. Conversely, report age for a curriculum that does not meet expectations for standards alignment was associated with a 1 percent decrease in teachers who report using aligned materials at least once a week.
The plotted interaction in Figure 3 illustrates how the effect of report age varies depending on how long the materials have been in the marketplace for materials that meet expectations for standards alignment. Figure 3 illustrates that the age of an aligned report is associated with a positive effect on the percent of market share for materials that have been on the market for more than one year. Simply put, it appears that EdReports reviews for aligned materials are associated with an accelerated increase in those materials’ market share.
6 Model coefficients for key findings are presented in Appendix B Table B2. Results for all model fixed-effect coefficients are presented in Table B3. Summary of model results for all covariates is presented in Table B4.

5The State of the Instructional Materials Market: 2018 Report
Figure 3. Plot illustrating the interaction of series age and report age for materials rated “meets expectations” for standards alignment.
NOTES: With red lines representing the 95% confidence interval, we observe an estimated effect for report age of approximately 1% market share that is statistically different from zero at p < .05 for materials more than one year in age. The moderating effect of series age produces an increase in the estimated positive effect of report age, resulting in the estimated effect for report age to increase by approximately 1.2% market share for each additional year in age of the series.
Appendix B Figure B1a provides an alternate visualization for the interaction, illustrating how the effects for series age and report age amplify one another for materials that meet expectations for standards alignment. Conceptualizing report age as the moderating factor, Figure B1b indicates that the positive effect of series age becomes statistically different from zero at p < .05 for reports one year in age, estimated at approximately 1% market share with an additional 1.2% for each year in age of the report.

6The State of the Instructional Materials Market: 2018 Report
The plotted interaction in Figure 4 illustrates the effect of report age across values of series age for materials rated “partially meets expectations” for standards alignment. Figure 4 illustrates that for materials that partially meet expectations for standards alignment, the age of a report has a negative effect on the percent of market share for materials more than three and one-half years in age. One possible explanation is that materials that partially meet expectations for standards alignment might need to be on the market long enough for the effect of the report to take hold. After which, series age magnifies the negative effect of report age on percent market share.
Figure 4. Plot illustrating the interaction of series age and report age for materials rated “partially meets expectations” for standards alignment.
NOTES: Using a p < .05 level of significance, we observe an estimated effect for report age of approximately –1% market share for materials more than three and one-half years in age. The moderating effect of series age produces an increase in the estimated negative effect of report age, resulting in the estimated effect for report age to increase in magnitude—though in a negative direction—by approximately 0.6% market share for each additional year in age of the series.
Presenting an alternate visualization for the interaction, Appendix B Figure B2a illustrates that the estimated market share for materials that partially meet expectations for standards alignment is reduced for materials with older reports. Conceptualizing report age as the moderating factor, Figure B2b indicates that the positive effect of series age is reduced to not statistically different from zero for reports more than one year in age and older.

7The State of the Instructional Materials Market: 2018 Report
The plotted interaction in Figure 5 illustrates the effect of report age across values of series age for materials rated “does not meet expectations” for standards alignment. Figure 5 illustrates that for materials that do not meet expectations for standards alignment and are less than four years in age, the age of a report was associated with a negative effect on percent market share. For newer programs, a rating of “does not meet expectations for alignment” may accelerate the pace at which these materials lose their share of the market. However, after several years, these materials appear to lose market share on their own, making the possible effect of the report less of a driving factor as the material persists in the market.
Figure 5. Plot illustrating the interaction of series age and report age for materials rated “does not meet expectations” for standards alignment.
NOTES: Using a p < .05 level of significance, we observe an estimated effect for report age of approximately –1% market share for materials three years in age. The moderating effect of series age produces a decrease in the estimated negative effect by approximately 0.5% market share for each additional year in age of the series, resulting in an estimated effect of report age of approximately –2% market share for materials one years in age and a 0.0% point-estimate for materials five years in age.
Presenting an alternate visualization for the interaction, Appendix B Figure B3a illustrates that the estimated market share for materials that do not meet expectations for standards alignment is reduced for materials with older reports. Conceptualizing report age as the moderating factor, Figure B3b indicates that the negative effect of series age is greatest when reports are first released, estimated at approximately –1% market share for newly released reports with the first year and one-half of the report having a significant negative effect.

8The State of the Instructional Materials Market: 2018 Report
There is an intuitive appeal to these results. Viewed through the lens of existing natural selection processes within the materials market, it makes sense that any positive effect of reports on market share of aligned materials will also be positively enhanced by the age of the series. Likewise, it makes sense that any negative effect of reports on market share of unaligned materials will be greatest for newer materials, for which natural market forces have yet to have an effect. Over time as users of unaligned materials discontinue using and replace these materials, the effect of the reports on market share are diminished and overtaken by the simple effect of the age of the material.
Interpreting the results for the partially aligned materials is less straightforward and will require further study and modeling to better understand how report age and series age interact and what other variables could be in play. Currently, it appears that newer partially aligned materials have an outsized percent of market share. This could be due to updated versions of legacy titles and programs, but more research will be needed to understand this section of the market.
Collectively, these findings illustrate evidence on the potential impact EdReports may be having on the market: driving an increased use of aligned materials and dissuading use of materials that do not meet expectations for standards alignment. We find support for our inference of efficacy of the organization by noting that the observed effects are consistent with what is posited by the EdReports theory of action, whereby efforts to identify excellence and increase demand for excellence appear to be associated with an improvement of the materials market.
Illustrations of How Reports are UsedAccounts from the field support these initial conclusions about how EdReports’ reviews may be impacting the instructional materials market and highlight the ways in which EdReports has had an influence on the improvement of materials.
One mechanism by which EdReports may have an improvement on instructional materials is through the use of reports by school districts to evaluate current programs, winnow adoption choices, and select new materials. A detailed example of this process can be found in a case study of the Newport-Mesa School District in California.7
Having our reports to draw upon can be a huge asset for small districts as well, where limited capacity to examine materials can also be a challenge. A vignette of the experience of Marysville Public Schools in Michigan illustrates how use of EdReports can save time and expand capacity during the curriculum adoption process.8
Secondly, school districts have issued request for proposals (RFPs) that include requirements that only curricula that meet EdReports criteria for standards alignment will be considered for adoption.
7 EdReports, 2018 8 Johnson, 2018
Effects for model covariates. As reported in Appendix B Tables B3 and B4, coefficients statistically different from zero at p < .05, were found for covariates for content area, grade band, publisher size, and state adoption status, controlling for all other variables.
Consistent with what can be observed in the summary statistics reported in Appendix B Table B1, market share estimates for math series were larger than those for ELA series that meet expectations for standards alignment but were smaller than those for ELA series that partially meet or do not meet expectations for standards alignment. This source of variation appears to be associated with the saturation of the given markets, whereby the more series represented in the data for a market segment, the smaller the mean percent per series.
There were no statistically significant differences between the market share for middle grades series and elementary series. However, the market share estimates for high school series were smaller than elementary series meeting expectations for standards alignment and larger than elementary series partially meeting or not meeting expectations for standards alignment.
Publisher size was associated with larger market share estimates across all EdReports rating categories. For series that meet expectations for standards alignment, market share estimates were smaller for states that provide districts a list of programs they are mandated to select from for their adoptions, compared to states that left it completely to the districts to determine which programs they would adopt. For series that partially meet or do not meet expectations for standards alignment, no statistically significant differences were observed for mandated adoption states. No statistically significant differences were observed between market share estimates for states that provided districts a list of programs they are advised to select from for their adoptions, compared to states that left it completely to the districts to determine which programs to adopt.

9The State of the Instructional Materials Market: 2018 Report
For example, Baltimore City Public Schools issued an RFP for a Comprehensive K–12 Literacy Program, stating “City Schools is seeking a comprehensive literacy program that has a copyright date of 2015 or later and has been externally validated by EdReports. Proposals that do not meet these two criteria will not be reviewed.”9
Lastly, publishers themselves have been responsive to our reviews, where, to date, 22 publishers have used EdReports reviews to improve their instructional materials.10 These improvements help explain some of the reasons why we observe that materials with more recent copyrights are more likely to be aligned to standards (see Table 1).
Moreover, our initial research findings appear to support our theory of action. The consistency of the statistical analysis results and the qualitative corroboration of the anecdotal accounts we continue to collect from the field indicates that EdReports is an influencer on the transaction between curriculum suppliers and consumers.
Next Steps and RecommendationsThere are a few areas within the current analyses that warrant further exploration, including how to interpret statistically significant effects for covariates. Although findings such as positive association between publisher size and market share are not surprising, other findings are worthy of investigation.
For example, initial results indicate that there is a negative relationship between market share of aligned materials and mandatory adoption states. Also, systematic differences in market share observed across EdReports rating categories by content area and grade band also warrant additional probing. For content area at least, the differences appear likely to be associated with the number of available series titles, where the more titles available reflects a smaller average market share per title.
Learning More About the Unknown MarketWe are struck by the large percentage of materials in use at least once weekly that are classified as “other.” We need to better understand these materials in order to know what content students are accessing and how well these support them to master college- and career-ready standards.
When teachers don’t have access to great materials they hunt for them online—often leading to inconsistent quality that impacts low-income, students of color the most. Teachers working in schools that have a high proportion of students who receive free and reduced lunch are searching for materials online at higher rates.11 The assignments teachers select or create tend to be lower quality than what the district or state provided.12 Probing the unknown market is an essential next step to better understand what materials teachers are using and why.
Building a More Comprehensive DatabaseThe use of state-level aggregates and a single time-point in the current analyses limit our ability to infer causation. District-level, longitudinal data on curriculum adoption and procurement are needed to gain a robust understanding of the materials market and justify a causal inference between EdReports reviews and changes in market share.
Work is currently underway to build such a database, drawing upon various sources including state education agency use and procurement records, data collected by research partners, and the GovSpend database on procurement of instructional materials by schools and districts. Although initial assessments indicate that there are limitations to these data as well, we believe data on local education agency procurement will provide a more accurate picture of what materials are in schools and what trends are occurring over time.
We believe creating this kind of database is particularly important to larger research questions in the field, specifically on how materials are impacting student learning outcomes. One of the major barriers to better understanding the effect of curriculum on student achievement is the collection of data and understanding what is purchased and what is used in classrooms nationwide. We are excited to make this initial contribution to the field and look forward to supporting others’ research through this endeavor.
9 Institute for Education Policy, 2018, p. 1110 EdReports, 201911 Opfer, Kaufman, and Thompson., 201612 TNTP, 2018

10The State of the Instructional Materials Market: 2018 Report
How these Analyses were ConductedAnalyses reported under the heading, Aligned Materials are Available, drew upon information available of on the EdReports.org website for Reports <https://www.edreports.org/reports>. Data for series reviewed by EdReports were based on all reports published between March 4, 2015 and April 17, 2019 for materials with a 2018 copyright or older. Each high school math report is counted as three reports, corresponding with a traditional or integrated three-course sequence. All other reports are counted as one report each, corresponding with the specific grade-level of the report. For these analyses, series age is calculated as 2019 minus copyright year and reported as mean ± standard deviation.
Analyses reported under the heading, Most Materials Used in Classrooms are Not Aligned to Standards, made use of the weighted national estimates and standard errors produced by RAND Corporation. Interpret the standard error as the reliability of the point estimate, representing how accurate the estimate for the sample is in relation to the true value for the population.
The ATP survey permitted teachers to report on all series that they used regularly. Because estimates of use were not based on exclusive series use, sums across series exceeded 100%. For our calculation, percent of use for each series was rescaled to the proportion of the sum of all percentages. Thus, the percentages for this portion of analyses are scaled to sum to 100% and should be interpreted as the percent of materials, rather than the percent of teachers as was the interpretation for the data as originally scaled.
For materials to be coded as meets expectations or does not meet expectations, all relevant grade-level reports needed to receive that particular rating. Materials were coded as partially meets expectations if there was at least one relevant grade that received a rating higher than does not meet expectations and at least one relevant grade received a rating less than meets expectations. Rubrics and evidence guides are all available on the EdReports.org website.
Analyses reported under the heading, Information on Alignment is Shaping the Market, used the 2018 ATP series by grade band state-level weighted estimates, which include data for the following 24 states: AL, AR,
13 R Development Core Team, 201814 Pinheiro, Bates, DebRoy, and Sarkar, 201815 Preacher, Curran, and Bauer, 2006
CA, CO, DE, FL, IL, KY, LA, MD, MA, MS, NE, NM, NY, NC, OK, RI, SC, TN, TX, VA, WV, and WI.
Survey respondents were presented a list of series titles that corresponded with the grade level (K–5, 6–8, or 9–12) and content area (ELA or math) of their teaching assignment. Across all grade bands, a total of 30 unique ELA and 67 unique math series titles were presented, for which respondents indicated the materials they used regularly (once a week or more) during the 2017–2018 school year. Summary statistics for the 2018 ATP state-level data are presented in Appendix B table B1.
For these analyses, we employed a multivariate, multilevel analytic framework, where three outcome variables—constituting market share of materials in each of EdReports standards-alignment ratings—were analyzed in tandem, with random effects by state. All statistical models were fit using the R nlme package.13,14 Interaction plots were generated using R-based tools.15
We fit a sequence of models to systematically inspect the individual and combined effects associated with different predictors. To account for the structure of the data, we include content area and grade band as covariates in all models. The predictors of primary interest were curriculum series age, EdReports report age, and the series age by report age interaction, which were sequentially added, whereby,
• Model 1 adds series age;
• Model 2 comprises Model 1 plus report age;
• Model 3 comprises Model 2 plus the series age by report age interaction; and
• Model 4 comprises Model 3 plus covariates for publisher size, adoption state status, textbook expenditure per student, number of students, student minority percent, state poverty percent.
Appendix B table B5 provides a description of the independent variables used in the statistical models. Although we believe we have assembled a robust set of covariates to account for extraneous sources variation in market share, we recognize that there may be important factors that we have not accounted for. Future efforts will seek to expand and improve upon this list of model covariates in order maximize on the efficiency of our models and precision of our estimates.

11The State of the Instructional Materials Market: 2018 Report
ReferencesEdReports. (2018, March 19). Building capacity and consensus through a teacher-led materials adoption: A case study
from Newport-Mesa Unified School District. Retrieved from https://www.edreports.org/resources/article/building-capacity-and-consensus-through-a-teacher-led-materials-adoption
EdReports. (2019, May 13). 2018 Annual Report. Retrieved from https://www.edreports.org/impact/annual-reports
Jackson, C. K. & Makarin, A. (2018). Can online off-the-shelf lessons improve student outcomes? evidence from a field experiment. American Economic Journal: Economic Policy, 10(3), 226–254. Retrieved from https://works.bepress.com/c_kirabo_jackson/31/
Johnson, J. (2018, May 22). 3 Ways a Small District Can Harness the Power of EdReports.org (web log). https://www.edreports.org/resources/article/dreaming-big-in-marysville-how-small-districts-can-harness-the-power-of-edreports-org
Johns Hopkins Institute for Education Policy (2018). Policy Brief: Using the RFP Process to Drive High-Quality Curriculum: Findings from the Field – Revised edition. http://edpolicy.education.jhu.edu/using-the-rfp-process-to-drive-high-quality-curriculum-findings-from-the-field/
Koedel, C., Li, D., Polikoff, M. S., Hardaway, T., & Wrabel, S. L. (2017). Mathematics curriculum effects on student achievement in California. AERA Open, 3(1), 1–22. doi: 10.1177/2332858417690511
Koedel, C., & Polikoff, M. (2017, January 5). Big bang for just a few bucks: The impact of math textbooks in California (Economic Studies at Brookings, Evidence Speaks Reports, Vol 2, #5). Washington, DC: Center on Children & Families at Brookings. Retrieved from https://www.brookings.edu/research/big-bang-for-just-a-few-bucks-the-impact-of-math-textbooks-in-california/
National Center for Education Statistics. The Common Core of Data. Retrieved from https://nces.ed.gov/ccd/
Opfer, V., Kaufman, J., & Thompson, L. (2016). Implementation of K–12 State Standards for Mathematics and English Language Arts and Literacy. Santa Monica, CA: RAND Corporation. Retrieved from: https://www.rand.org/pubs/research_reports/RR1529-1.html
Pinheiro, J., Bates, D., DebRoy, S., & Sarkar, D. (2018). Linear and nonlinear mixed effects models (R package version 3.1-137). Retrieved from https://CRAN.R-project.org/package=nlme
Preacher, K. J., Curran, P. J., & Bauer, D. J. (2006). Computational tools for probing interactions in multiple linear regression, multilevel modeling, and latent curve analysis. Journal of Educational and Behavioral Statistics, 31(4), 437-448.
RAND Corporation. (2018). The American Teacher Panel and the American School Leader Panel. Santa Monica, CA.
R Development Core Team (2018). R: A language and environment for statistical computing. Vienna, Austria: R Foundation for Statistical Computing. Retrieved from http://www.R-project.org
Simba. (2018, August 31). Publishing for prek-12 market 2018-2019 (Pub ID: CURP15565344). Rockaway Park, NY: Education Market Research/Simba Information. Retrieved from https://www.simbainformation.com/Publishing-PreK-11362680/
TNTP. (2018, September 25). The opportunity myth: What students can show us about how school is letting them down—and how to fix it. New York, NY: Author. Retrieved from https://tntp.org/publications/view/student-experiences/the-opportunity-myth
United States Census Bureau. Income and poverty in the United States. Retrieved from https://www.census.gov/library/publications/2018/demo/p60-263.html

12The State of the Instructional Materials Market: 2018 Report
Appendix A
0 10 20 30 40 50
Meets Expectations
Does Not Meet Expectations
Currently Under Review
Known Series Not Reviewed
Unspecified Instructional Materials
Percent of Market
Partially Meets Expectations
0 10 20 30 40 50
Meets Expectations
Does Not Meet Expectations
Currently Under Review
Known Series Not Reviewed
Unspecified Instructional Materials
Percent of Market
Partially Meets Expectations
Figure A1. Elementary ELA market share by EdReports standards-alignment rating and review status.
Figure A2. Middle grades ELA market share by EdReports standards-alignment rating and review status.
Percentages and standard errors are based on weighted estimates from the RAND Corporation (2018) American Teacher Panel nationally representative sample. Values were rescaled to sum to 100%, constituting the percentage of all materials not the percentage of the sample. Materials in the unspecified materials category may represent formal published materials or informal teacher/district-created materials.

13The State of the Instructional Materials Market: 2018 Report
0 10 20 30 40 50
Meets Expectations
Does Not Meet Expectations
Currently Under Review
Known Series Not Reviewed
Unspecified Instructional Materials
Percent of Market
Partially Meets Expectations
0 10 20 30 40 50
Meets Expectations
Does Not Meet Expectations
Currently Under Review
Known Series Not Reviewed
Unspecified Instructional Materials
Percent of Market
Partially Meets Expectations
Figure A3. High school ELA market share by EdReports standards-alignment rating and review status.
Figure A4. Elementary math market share by EdReports standards-alignment rating and review status.
Percentages and standard errors are based on weighted estimates from the RAND Corporation (2018) American Teacher Panel nationally representative sample. Values were rescaled to sum to 100%, constituting the percentage of all materials not the percentage of the sample. Materials in the unspecified materials category may represent formal published materials or informal teacher/district-created materials.

14The State of the Instructional Materials Market: 2018 Report
0 10 20 30 40 50
Meets Expectations
Does Not Meet Expectations
Currently Under Review
Known Series Not Reviewed
Unspecified Instructional Materials
Percent of Market
Partially Meets Expectations
0 10 20 30 40 50
Meets Expectations
Does Not Meet Expectations
Currently Under Review
Known Series Not Reviewed
Unspecified Instructional Materials
Percent of Market
Partially Meets Expectations
Figure A5. Middle grades math market share by EdReports standards-alignment rating and review status.
Figure A6. High school math market share by EdReports standards-alignment rating and review status.
Percentages and standard errors are based on weighted estimates from the RAND Corporation (2018) American Teacher Panel nationally representative sample. Values were rescaled to sum to 100%, constituting the percentage of all materials not the percentage of the sample. Materials in the unspecified materials category may represent formal published materials or informal teacher/district-created materials.
15The State of the Instructional Materials Market: 2018 Report
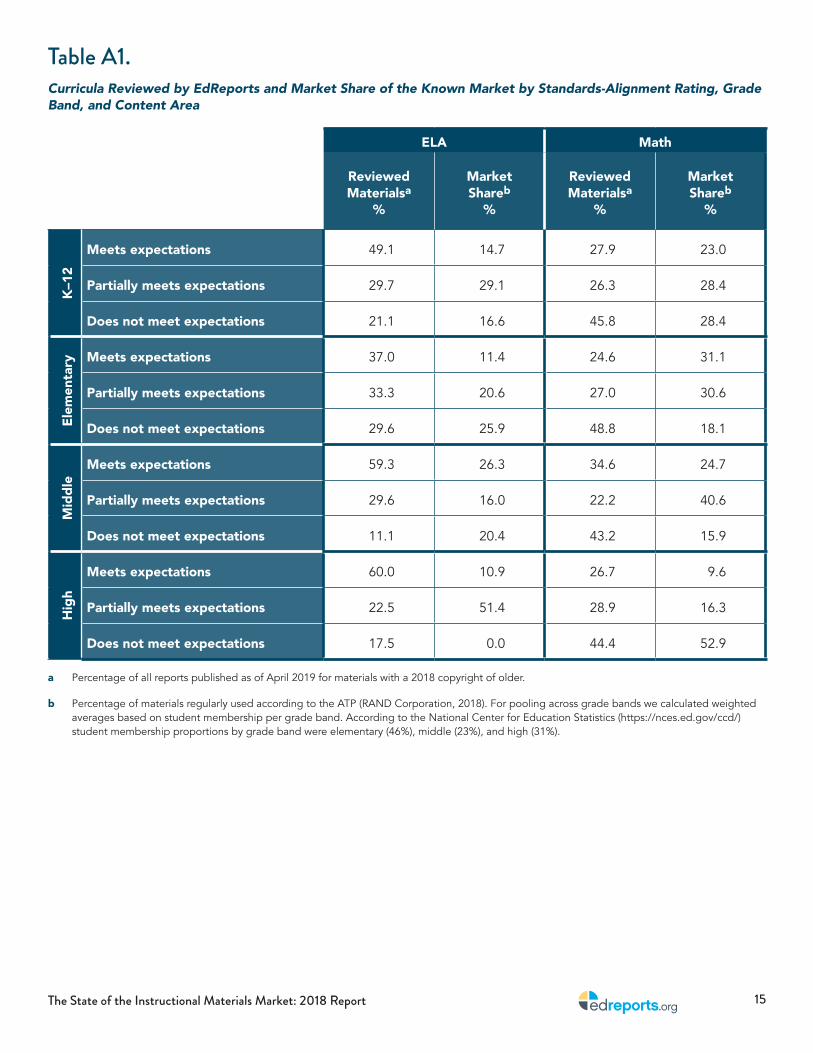
Table A1. Curricula Reviewed by EdReports and Market Share of the Known Market by Standards-Alignment Rating, Grade Band, and Content Area
ELA Math
ELA & Math K-12Reviewed Materialsa
%
Market Shareb
%
Reviewed Materialsa
%
Market Shareb
%
K–1
2
Meets expectations 49.1 14.7 27.9 23.0
Partially meets expectations 29.7 29.1 26.3 28.4
Does not meet expectations 21.1 16.6 45.8 28.4
Elem
enta
ry Meets expectations 37.0 11.4 24.6 31.1
Partially meets expectations 33.3 20.6 27.0 30.6
Does not meet expectations 29.6 25.9 48.8 18.1
Mid
dle
Meets expectations 59.3 26.3 34.6 24.7
Partially meets expectations 29.6 16.0 22.2 40.6
Does not meet expectations 11.1 20.4 43.2 15.9
Hig
h
Meets expectations 60.0 10.9 26.7 9.6
Partially meets expectations 22.5 51.4 28.9 16.3
Does not meet expectations 17.5 0.0 44.4 52.9
a Percentage of all reports published as of April 2019 for materials with a 2018 copyright of older.
b Percentage of materials regularly used according to the ATP (RAND Corporation, 2018). For pooling across grade bands we calculated weighted averages based on student membership per grade band. According to the National Center for Education Statistics (https://nces.ed.gov/ccd/) student membership proportions by grade band were elementary (46%), middle (23%), and high (31%).

16The State of the Instructional Materials Market: 2018 Report
Appendix BTable B1. Summary Statistics for 2018 ATP State-level Data
M SD Min Max
Meets Expectations
ELA & math K–12 (series n = 41)
Market share 4.495 8.490 0.000 73.095
Curriculum series age 2.976 1.260 1 6
EdReports report age 1.881 0.886 0.005 3.915
ELA series
Elementary (series n = 7)
Market share 2.311 4.545 0.000 36.353
Curriculum series age 2.714 1.033 1 4
EdReports report age 1.501 0.745 0.005 2.422
Middle grades (series n = 11)
Market share 2.830 6.059 0.000 59.365
Curriculum series age 2.636 0.482 2 3
EdReports report age 1.763 0.581 0.806 2.422
High school (series n = 4)
Market share 2.870 4.624 0.000 19.823
Curriculum series age 2.000 0.711 1 3
EdReports report age 1.266 0.267 0.806 1.419
(Continues on next page)

17The State of the Instructional Materials Market: 2018 Report
M SD Min Max
Meets Expectations
Math series
Elementary (series n = 5)
Market share 11.368 12.429 0.000 65.600
Curriculum series age 4.200 1.607 2 6
EdReports report age 2.715 1.093 1.288 3.915
Middle grades (series n = 7)
Market share 7.706 11.769 0.000 73.095
Curriculum series age 3.286 1.755 2 6
EdReports report age 2.064 1.213 0.806 3.915
High school (series n = 7)
Market share 2.103 4.926 0.000 45.998
Curriculum series age 3.143 0.835 2 4
EdReports report age 2.021 0.486 1.288 2.595
Partially Meets Expectations
ELA & math K–12 (series n = 37)
Market share 6.383 9.712 0.000 75.433
Curriculum series age 4.324 1.726 1 8
EdReports report age 2.270 1.022 0.786 3.915
ELA series
Elementary (series n = 4)
Market share 5.739 8.271 0.000 37.607
Curriculum series age 2.250 0.435 2 3
EdReports report age 1.493 0.656 0.880 2.422
(Continues on next page)

18The State of the Instructional Materials Market: 2018 Report
M SD Min Max
Partially Meets Expectations
Middle grades (series n = 4)
Market share 5.496 8.243 0.000 52.599
Curriculum series age 2.250 1.095 1 4
EdReports report age 1.781 0.564 0.880 2.422
High school (series n = 3)
Market share 20.400 13.040 0.000 64.420
Curriculum series age 4.333 2.069 2 7
EdReports report age 1.425 0.008 1.419 1.436
Math series
Elementary (series n = 7)
Market share 5.868 9.922 0.000 75.433
Curriculum series age 4.429 1.404 2 6
EdReports report age 2.915 0.986 1.288 3.915
Middle grades (series n = 10)
Market share 6.162 8.376 0.000 40.229
Curriculum series age 5.500 1.120 4 8
EdReports report age 3.047 0.865 1.288 3.915
High school (series n = 9)
Market share 3.039 6.365 0.000 54.550
Curriculum series age 4.778 1.318 2 7
EdReports report age 1.749 0.712 0.786 2.595
(Continues on next page)

19The State of the Instructional Materials Market: 2018 Report
M SD Min Max
Does Not Meet Expectations
ELA & math K–12 (series n = 35)
Market share 5.894 8.643 0.000 78.166
Curriculum series age 6.057 2.427 2 11
EdReports report age 2.440 1.173 0.156 3.915
ELA series
Elementary (series n = 4)
Market share 8.746 10.727 0.000 57.066
Curriculum series age 7.500 3.795 2 11
EdReports report age 1.293 0.879 0.156 2.422
Middle grades (series n = 3)
Market share 8.754 11.538 0.000 78.166
Curriculum series age 5.000 2.175 2 7
EdReports report age 1.832 0.469 1.285 2.422
High school (series n = 0)
Market share
Curriculum series age
EdReports report age
Math series
Elementary (series n = 8)
Market share 3.552 5.544 0.000 27.730
Curriculum series age 6.125 2.427 2 11
EdReports report age 3.195 1.198 0.271 3.915
(Continues on next page)

20The State of the Instructional Materials Market: 2018 Report
M SD Min Max
Does Not Meet Expectations
Middle grades (series n = 8)
Market share 3.900 5.802 0.000 38.658
Curriculum series age 5.750 1.718 3 9
EdReports report age 3.049 1.171 0.271 3.915
High school (series n = 12)
Market share 7.120 9.587 0.000 59.878
Curriculum series age 6.000 2.085 4 10
EdReports report age 2.065 0.737 0.504 2.595
Note. Data comprise 2,712 series by grade band market share estimates within 24 states from the RAND Corporation (2018) American Teacher Panel and characteristic data from EdReports records. Curriculum series age = difference in years between 2019 and the series copyright year. EdReports report age = difference in years between January 31, 2019 and the report published date.

21The State of the Instructional Materials Market: 2018 Report
Table B2. Key Results from the Statistical Models
Model 1 Model 2 Model 3 Model 4
Estimate (SE) p Estimate
(SE) p Estimate (SE) p Estimate
(SE) p
Meets Expectations
Curriculum series agea 1.921(0.213) <.001 1.072
(0.419) .011 1.568(0.413) <.001 1.577 <.001
EdReports report ageb 1.354(0.576) .019 2.409
(0.579) <.001 <.001
Curriculum series agea x EdReports reports ageb <.001 <.001
Covariatesc - - - - - - - -
Constant 6.250(0.670) <.001 7.065
(0.753) <.001 5.978(0.757) <.001 12.217
(6.185) .048
Partially Meets Expectations
Curriculum series agea 0.956(0.228) <.001 0.562
(0.231) .015 –0.575(0.341) .092 0.242
(0.335) .470
EdReports report ageb 2.572(0.392) <.001 3.070
(0.403) <.001 –0.110(0.502) .826
Curriculum series agea × EdReports reports ageb
–1.014(0.227) <.001 –0.630
(0.219) .004
Covariatesc - - - - - - - -
Constant 10.489(0.832) <.001 13.096
(0.905) <.001 14.257(0.934) <.001 7.183
(5.470) .189
Does Not Meet Expectations
Curriculum series agea –0.588(0.119) <.001 –0.563
(0.120) <.001 –0.131(0.146) .370 –0.366
(0.145) .012
EdReports report ageb 0.435(0.295) .141 –1.226
(0.437) .005 –1.488(0.426) <.001
Curriculum series agea
x EdReports reports ageb0.537(0.105) <.001 0.470
(0.103) <.001
Covariatesc - - - - - - - -
Constant 10.328(0.804) <.001 10.910
(0.896) <.001 10.472(0.888) <.001 5.304
(5.538) .338
Note. Data comprise 2,712 series by grade band market share estimates within 24 states.
a The variable for curriculum series age was centered at copyright year 2015.
b The variable for EdReports report age was centered at published date of January 31, 2016.
c All models include content area and grade band as covariates. Model 4 also included covariates for publisher size, adoption state status, textbook expenditure per student, student membership, student minority percent, state poverty percent. Covariate parameter estimates are not presented for visual simplicity. See Appendix B Table B3 for all fixed effect parameter estimates.

22The State of the Instructional Materials Market: 2018 Report
Figure B1a-bPlots illustrating the interaction of series age and report age for materials rated meets expectations for standards alignment.
In Plot (b), red lines are 95% confidence interval upper and lower bounds for the simple slope of percent market share on series age.
(a)
(b)

23The State of the Instructional Materials Market: 2018 Report
Figure B2a-bPlots illustrating the interaction of series age and report age for materials rated partially meets expectations for standards alignment.
In Plot (b), red lines are 95% confidence interval upper and lower bounds for the simple slope of percent market share on series age.
(a)
(b)

24The State of the Instructional Materials Market: 2018 Report
Figure B3a-bPlots illustrating the interaction of series age and report age for materials rated does not meet expectations for alignment.
In Plot (b), red lines are 95% confidence interval upper and lower bounds for the simple slope of percent market share on series age.
(a)
(b)

25The State of the Instructional Materials Market: 2018 Report
Table B3. Full Reporting of Results from the Statistical Models
Model 1 Model 2 Model 3 Model 4
Estimate (SE) p Estimate
(SE) p Estimate (SE) p Estimate
(SE) p
Meets Expectations
Curriculum series age 1.921(0.213) <.001 1.072
(0.419) .011 1.568(0.413) <.001 1.577
(0.414) <.001
EdReports report age 1.354(0.576) .019 2.409
(0.579) <.001 2.209(0.586) <.001
Curriculum series age × EdReports reports age
1.248(0.170) <.001 1.216
(0.171) <.001
Math curriculum 2.677(0.539) <.001 2.598
(0.539) <.001 1.992(0.531) <.001 2.521
(0.577) <.001
Middle grades market –0.430(0.580) .459 –0.636
(0.586) .277 –0.337(0.571) .556 –0.850
(0.678) .210
High school market –3.126(0.675) <.001 –3.271
(0.676) <.001 –2.333(0.670) <.001 –2.969
(0.724) <.001
Publisher size 0.126(0.053) .018
Mandated adoption state –2.676(1.039) .010
Advisory adoption state –0.108(1.567) .945
Textbook expenditure per students
0.023(0.019) .237
Student membership –0.589(0.513) .251
Student minority percent 0.029(0.030) .320
State poverty percent 0.260(0.170) .127
Constant 6.250(0.670) <.001 7.065
(0.753) <.001 5.978(0.757) <.001 12.217
(6.185) .048
(Continues on next page)

26The State of the Instructional Materials Market: 2018 Report
Model 1 Model 2 Model 3 Model 4
Partially Meets Expectations
Curriculum series age 0.956(0.228) <.001 0.562
(0.231) .015 –0.575(0.341) .092 0.242
(0.335) .470
EdReports report age 2.572(0.392) <.001 3.070
(0.403) <.001 –0.110(0.502) .826
Curriculum series age × EdReports reports age
–1.014(0.227) <.001 –0.630
(0.219) .004
Math curriculum –6.789(0.835) <.001 –8.673
(0.865) <.001 –8.783(0.856) <.001 –4.488
(0.924) <.001
Middle grades market –0.214(0.790) .787 –0.440
(0.772) .569 –0.158(0.767) .837 –1.287
(0.799) .107
High school market 1.344(0.820) .101 3.783
(0.883) <.001 3.774(0.873) <.001 1.730
(0.873) .048
Publisher size 0.520(0.053) <.001
Mandated adoption state 0.317(0.901) .725
Advisory adoption state 0.514(1.359) .705
Textbook expenditure per students
0.027(0.017) .108
Student membership –0.256(0.445) .565
Student minority percent 0.033(0.026) .195
State poverty percent 0.009(0.148) .951
Constant 10.489(0.832) <.001 13.096
(0.905) <.001 14.257(0.934) <.001 7.183
(5.470) .189
(Continues on next page)

27The State of the Instructional Materials Market: 2018 Report
Model 1 Model 2 Model 3 Model 4
Does Not Meet Expectations
Curriculum series age –0.588(0.119) <.001 –0.563
(0.120) <.001 –0.131(0.146) .370 –0.366
(0.145) .012
EdReports report age 0.435(0.295) .141 1.226
(0.437) .005 –1.488(0.426) <.001
Curriculum series age × EdReports reports age
0.537(0.105) <.001 0.470
(0.103) <.001
Math curriculum –5.288(0.765) <.001 –5.973
(0.895) <.001 –6.401(0.886) <.001 –2.787
(0.999) .005
Middle grades market –0.350(0.714) .624 –0.349
(0.713) .624 –0.716(0.706) .311 0.030
(0.764) .969
High school market 3.256(0.734) <.001 3.716
(0.797) <.001 3.516(0.786) <.001 2.339
(0.804) .004
Publisher size 0.312(0.044) <.001
Mandated adoption state 1.274(0.916) .165
Advisory adoption state 0.419(1.381) .762
Textbook expenditure per students
–0.017(0.017) .302
Student membership –0.008(0.452) .985
Student minority percent –0.026(0.026) .328
State poverty percent –0.013(0.150) .933
Constant 10.328(0.804) <.001 10.910
(0.896) <.001 10.472(0.888) <.001 5.304
(5.538) .338
Note. Data comprise 2,712 series by grade band market share estimates within 24 states.

28The State of the Instructional Materials Market: 2018 Report
Table B4. Summary of Model 4 Results
Meets Expectations
Partially Meets Expectations
Does Not Meet Expectations
Estimate p Estimate p Estimate p
Curriculum series age 1.577 <.001 0.242 .470 –0.366 .012
EdReports report age 2.209 <.001 –0.110 .826 –1.488 <.001
Curriculum series age × EdReports reports age 1.216 <.001 –0.630 .004 0.470 <.001
Math curriculum 2.521 <.001 –4.488 <.001 –2.787 .005
Middle grades market –0.850 .210 –1.287 .107 0.030 .969
High school market –2.969 <.001 1.730 .048 2.339 .004
Publisher size 0.126 .018 0.520 <.001 0.312 <.001
Mandated adoption state –2.676 .010 0.317 .725 1.274 .165
Advisory adoption state –0.108 .945 0.514 .705 0.419 .762
Textbook expenditure per students 0.023 .237 0.027 .108 –0.017 .302
Student membership –0.589 .251 –0.256 .565 –0.008 .985
Percent student minority (state) 0.029 .320 0.033 .195 –0.026 .328
Percent poverty 0.260 .127 0.009 .951 –0.013 .933
Constant 12.217 .048 7.183 .189 5.304 .338

29The State of the Instructional Materials Market: 2018 Report
Table B5. Description of Independent Variables in Statistical Models
Independent Variable Description
Curriculum series age Age of series, calculated as 2019 minus the copyright year and centered at copyright year 2015.
EdReports report age
Age of report for series, calculated at January 31, 2019 minus date of published report in year units, centered at January 2016. Given the data pertain to school year 2017–2018, the zero point for report age can be interpreted as a report that was published 1.5 years prior to the start of the pertaining school year.
Math curriculum Indicator for math content area: 0 (ELA), 1 (math)
Middle grades market Indicator for middle grades grade band: 0 (elementary), 1 (middle grades)
High school market Indicator for high school grade band: 0 (elementary), 1 (high school)
Publisher size The number of series titles per publisher, centered at the sample median of 2.
Mandated adoption state Indicator for mandated adoption state list: 0 (non-adoption), 1 (mandated adoption)
Advisory adoption state Indicator for advisory adoption state list: 0 (non-adoption), 1 (advisory adoption)
Textbook expenditure per students Textbook expenditure per student by state in dollars, based on a 2014–2016 three-year average (NCES). Missing values for Illinois were mean imputed at 54.6.
Student membership Number of students per state by grade band for school year 2016–2017 (NCES). Values were natural log transformed.
Percent student minority Percent of minority students per state by grade band for school year 2016–2017 (NCES). Values for grade bands K–5, 6–8, and 9–12 were mean centered at 44.0, 42.1, and 41.4, respectively.
Percent poverty State percent below poverty based on a 2015–2017 three-year average (U.S. Census Bureau).
Note. NCES = Data source is National Center for Education Statistics <https://nces.ed.gov/ccd/>. U.S. Census Bureau = Data sources is United States Census Bureau <https://www.census.gov/library/publications/2018/demo/p60-263.html>