Embed Size (px)
Citation preview

The State of the Estatein 2016–17

The State of the Estate in 2016–17
Presented to Parliament pursuant to section 86 of the Climate Change Act 2008
HM Government

© Crown copyright 2018
You may reuse this information (not including logos) free of charge in any format or medium, under the terms of the Open Government Licence.
To view this licence, go to: www.nationalarchives.gov.uk/doc/open-government-licence or write to: The Information Policy Team, The National Archives, Kew, Surrey TW9 4DU. email: [email protected]
Where we have identified any third party copyright information you will need to obtain permission from the copyright holders concerned.
If you have an enquiry regarding this publication, please contact: 0845 000 4999 or [email protected]
This publication is available from www.official-documents.gov.uk and www.cabinetoffice.gov.uk

Contents 1
Contents
Ministerial Foreword 3
Chapter 1 Introduction 5
Chapter 2 The estate 11
Chapter 3 Office performance 23
Chapter 4 A sustainable estate 35
Chapter 5 Forward look 41
Appendices 46
Appendix A – Climate Change Act 2008 (extract) 47
Appendix B – Size of the Central Estate in 2016–17 48
Appendix C – Machinery of Government changes in 2016–17 55
Appendix D – Total running costs of the Central Estate in 2016–17 56
Appendix E – How benchmarking was measured in 2016–17 57
Appendix F – Benchmarked offices: efficiency data in 2016–17 (summary) 58
Appendix G – Benchmarked offices: efficiency data in 2016–17 (departmental breakdown) 60
Glossary 68
Organisations 68Definitions 69

2 The State of the Estate in 2016–17
List of figures and tablesFigure 1.1: The scope of the government estate structure 7
Figure 1.2: Departments with a central estate over 10,000 sq.m and their families, as at March 2017* 8
Figure 2.1: Total size (sq.m) of the Central Estate against Civil Service headcount, 2013 to 2017* 12
Figure 2.2: Total floor area of the Central Estate by parent department, as at March 2017* 13
Figure 2.3: Total size (sq.m) of the Central Estate by region, as at March 2017* 14
Figure 2.4: Vacancy rates in the Central Estate and the private sector in 2016–17 15
Figure 2.5: Total size of the Central Estate by tenure, as at March 2017 15
Figure 2.6: Central Estate operating costs for the last five years 15
Figure 2.7: Central Estate annual operating costs by parent department 16
Figure 2.8: Coverage of areas with an OPE presence 18
Figure 3.1: Utilisation rates in the benchmarked estate and the private sector 25
Figure 3.2: Space per person by parent department in the benchmarked office estate, as at March 2017 25
Figure 3.3: Space per person by region in the benchmarked office estate, as at March 2017 26
Figure 3.4: Average space per person in the South West region, as at March 2017 27
Figure 3.5: Average space per person in the London region, as at March 2017 27
Figure 3.6: Structure and size of the benchmarked office estate, as at March 2017 29
Table 3.1: Size of the benchmarked estate by region, as at March 2017 26
Table 3.2: Changes in benchmarked properties 29
Table 3.3: Age breakdown of participating buildings in the 2016–17 benchmarking programme 30
Table 4.1: Buildings procured outside the top quartile of energy performance, 2016–17 38

Ministerial Foreward 3
Ministerial Foreword
Oliver Dowden CBE, Parliamentary Secretary (Minister for Implementation)
Our work to transform how the government approaches and manages its property to drive efficiencies, savings and productivity has taken important strides forward since 2010. This work has never been more critical as we look to introduce even more innovative ways of working.
The size of the estate and our running costs have continued to fall and 2016-17 was no exception. We are making ever more efficient use of our estate and our space per person ratio in offices is down to 9.9 sq.m, which means we are outperforming much of the private sector. The work does not stop there however - the modern, innovative workspaces delivered by the Government Hubs programme will help drive this efficiency even further. It is our ambition to achieve 6 sq.m in these locations.
Our focus on making our estate more efficient has resulted in a further £620 million in capital receipts, this is money that will be reinvested into supporting local and national services. This highlights the innovative approach to property management and ways of working that will benefit everyone.
But cost and efficiencies are not the only reasons we are transforming our estate. Our end goal is to enable better outcomes for the public and to help make our vision of a Brilliant Civil Service a reality. Our people will be developed and surrounded by a working environment that works for them, a truly inclusive environment, in open, modern workplaces, that help them deliver the best public service.
We are committed to creating modern, flexible workplaces that encourage us to work differently: sharing space with other departments, making it easier to work across boundaries and giving our people the most up-to-date equipment for the job.
Through the Government Property Agency (GPA) we will bring commercial expertise to the management of the government’s office portfolio, while delivering benefits to the taxpayer through cost savings and increased productivity.
The Government Hubs programme has gone from strength to strength. Eleven Government Hubs have already been announced across the UK. These multi-departmental hubs are an investment in the future of our city centres and also in the future of the Civil Service. The relocation of civil service roles and public bodies out of London will also play an important role in spreading economic growth, wealth and opportunity across the UK.
Through the One Public Estate programme, we are changing the approach to public sector property, helping to support national and local priorities in a way that works for everyone. Now working with over 90% of local authorities and 13 major government departments, we are boosting local growth by delivering more jobs and homes, making government services more accessible for citizens through the co-location of services, and supporting the public sector to work more effectively and efficiently as a whole.
I am proud of what we have already achieved in making the government estate more modern and efficient. I look forward to seeing the numerous benefits realised as we deliver these exciting programmes.
OLIVER DOWDEN CBE Minister for Implementation

4 The State of the Estate in 2016–17
The total size of the Central Estate has reduced by over 100,000 sq.m since 2015–16

Chapter 1: Introduction 5
Chapter 1:
Introduction
Aim of this reportThis annual State of the Estate report describes progress throughout the 2016–17 financial year in reducing the overall size and improving the efficiency of central government property that make up the Central Estate.1
The report focuses on three areas:
• the cost and size of the Central Estate2 (Chapter 2);• the efficient use of office space3 (Chapter 3); and• environmental sustainability (Chapter 4).
The State of the Estate series of reports fulfills the requirement in the Climate Change Act 2008
‘…to lay before Parliament… an assessment of the progress made in the year towards improving the efficiency and contribution to sustainability of buildings that are part of the civil estate’ (Appendix A).
1
See Figure 1.1 for full details.2
The size of the estate is measured as Net Internal Area (NIA) in square metres (sq.m).3
The measure of space efficiency is the amount of office space per person, calculated as occupied usable space (sq.m NIA) divided by the total number of full-time equivalent (FTE) staff and contractors.
4
The operating cost is the total net cost including annual property occupation costs, building operation costs, business support costs, property management costs and utilities. A full definition of total annual operating cost can be found in the Glossary.
5
GDP deflators at market prices, and GDP December 2017 (Quarterly National Accounts), HM Treasury.
The reporting periodThis report covers the financial year 2016–17 (1 April 2016 to 31 March 2017). Performance during 2016–17 will be compared with the previous year, 2015–16.
Key findingsEstate operating costsThe operating cost4 of the estate during the financial year 2016–17 was £2.57 billion.
Adjusted for inflation, this represents a 1.4% reduction in real terms5 on the previous year’s total of £2.55 billion.
Estate sizeDuring 2016–17, the Central Estate continued to reduce, falling from 8.0 million sq.m to 7.9 million sq.m – a reduction of the size of 435 tennis courts. The vacancy rate was 1.5%, which is one fifth of the private sector average of 7.5%.

6 The State of the Estate in 2016–17
Estate performanceOffice use continued to improve and space per person for 2016–17 was 9.9 sq.m – representing a 5% reduction on the 2015–16 figure of 10.4 sq.m. The improvements are primarily a result of a 3% reduction in office space and the growth in number of civil servants by 0.3%.
The cost of office space per person on a consistent year-on-year basis, was £4,602 in 2016–17, an increase of 0.3% and the cost of office space per sq.m was £467 – a 6% increase on 2015–16. However, due to reclassification of certain costs by two departments, additional costs were included for the first time and taking that effect into account, the cost per person has increased by 6% to £4,859 and cost per sq.m by 11% to £493.
The Government continues to outperform the private sector in all performance metrics.
The Central EstateThis State of the Estate report focuses on the Central Estate, which is made up of the ‘core’ property holdings of organisations from the Civil Estate, and does not include specialist property. For example, it does not include museums, royal parks or port facilities.
See Figure 1.1 for a full illustration of where the Central Estate sits within the Civil Estate and the wider government estate.
e-PIMSTM and data collectionGovernment organisations in the Central Estate are required to record their property information on the Government’s central database, the Electronic Property Information Mapping Service (e-PIMSTM).
e-PIMSTM is available for the entire public sector estate and enables organisations to record data on their properties, including details of size, leases, the energy rating of the building and other performance data.
Government organisations are accountable for the property they own or occupy and are responsible for the property data contained within this report.
Measuring performanceThe Key Performance Indicators (KPIs) used in this report measure:
• the overall size of the Central Estate;• the total cost of the Central Estate;• the utilisation of office space per person;• compliance with the commitments to procure
buildings in the top quartile of energy performance; and
• sustainable performance for greenhouse gas emissions, waste and water consumption.
Datasets used in this reportSize A snapshot of e-PIMSTM data was taken on 31 March 2017 to inform the size of the Central Estate by department.
Cost Parent departments provided the actual net costs of running the properties that make up the Central Estate during 2016–17. A definition of total annual operating cost is included in the Glossary.
Performance The Government Property Unit (GPU) collects performance data on offices in the Central Estate annually. Occupations under 500 sq.m can be excluded from this exercise, although most organisations choose to include them. Cost and utilisation data are reported for the full 2016–17 financial year; properties that have been occupied for only part of this period are excluded from the benchmarking reporting.
Sustainability Organisations submit data to report against the Greening Government Commitments targets to the Department for Environment, Food and Rural Affairs (Defra). Defra’s annual report publishes this data, which appears in Chapter 4 of this report. Individual organisations also report on the energy rating of newly procured buildings – also summarised in this report.

Chapter 1: Introduction 7
The Central Estate comprises the properties that are owned, leased or occupied by government organisations, including ministerial and non-ministerial departments, executive agencies and executive non-departmental public bodies.
Figure 1.1: The scope of the government estate structure
Wider Public Sector Estate
Wider Government Estate
Civil Estate
Central Estate
General
Specialist
Government departments Executive agenciesExecutive non-departmental public bodies (NDPBs)Special health authoritiesForeign and Commonwealth Office (FCO) estate in the UKHistoric England administrative estateDefence administrative estate GovernmentCompanies (GovCos)
Her Majesty’s Courts and Tribunals Service (HMCTS)National Offender Management Service (NOMS) non-custodial estateLaboratories
Other specialist facilities owned, leased and occupied by central government departments, agencies and NDPBs, including museums, galleries, power stations, port facilities, flood defences, roads, canals, railwaysNOMS custodial estate
Defence military estateNHS estate (e.g. hospitals)Department for Environment, Food and Rural Affairs rural estate (e.g. farms)FCO and Home Office overseas estate Historic England estateHistoric Royal Palaces
GP surgeries and clinics Local government estateSchools Devolved assembliesHigher/further education Parliament’s estatePoliceFire and rescue
The Crown EstatePublic corporations
Property owned,occupied or leased by
Offices withingeneral property
Benchmarkedestate

8 The State of the Estate in 2016–17
Figure 1.2: Departments with a central estate over 10,000 sq.m and their families, as at March 2017*
Department for Energy andClimate Change 10,578
Intellectual PropertyOffice 18,484
LLT VehicleDisposals 10,275
MedicalResearch Council100,642
Met Office 26,650
National PhysicalLaboratory 46,221
Natural EnvironmentResearch Council 105,523
Ordnance Survey14,004
Science &TechnologyFacilitiesCouncil 218,918
UK AtomicEnergyAuthority98,294
13 others52,669
Companies House30,068
Biotechnologyand BiologicalSciencesResearchCouncil197,219
Innovate UK 39,615
Residual Estate45,450
CrownCommercialService 2,743
Financial &EstateManagement32,902
BUSINESS, ENERGY & INDUSTRIAL STRATEGY CABINET OFFICE
COMMUNITIES ANDLOCAL GOVERNMENT
Centre86,532
Land RegistryAED 84,453
GovernmentOffice residualestate24,416
QEIIConferenceCentre16,560
2 others5,344
CULTURE, MEDIA AND SPORT
Centre9,149
Centre13,872
BigLotteryFund15,944
Historic England17,147
National Archives65,355
7 others18,495
5 others11,610
ConstructionIndustry TrainingBoard 59,360
Skills FundingAgency 10,599
StudentLoansCompany Ltd22,343
EDUCATION
UK HydrographicOffice30,609
Centre267,601
DEFENCE (CIVIL)
NHS Blood andTransplant122,711
NHS Business ServicesAuthority 32,170
NHS Digital15,448
NHS England 35,213
Public HealthEngland 78,691
5 others16,815
HealthEducationEngland18,938
Medicines, Healthcareproducts and RegulatoryAgency 14,180
HEALTH
Centre57,960
FOREIGN AND COMMONWEALTH OFFICE
British Council12,388
3 others2,576
Centre72,855
FOOD STANDARDS AGENCY 12,906
Centre57,649
ENVIRONMENT, FOOD AND RURAL AFFAIRS
7 others22,054
EnvironmentAgency(All Regionsinc Head Office)137,198
Centre247,437
* All figures represent total size in sq.m (owned holdings only)

Chapter 1: Introduction 9
HMRC
Valuation OfficeAgency 21,387
HMRC959,784
Crown ProsecutionService 61,087
Government LegalDepartment 11,118
2 others4,947
Centre362,782
LAW OFFICERS' DEPARTMENT
ROYAL MINT 32,091
UK STATISTICS AUTHORITY (ONS) 60,202OFFICE OF GAS AND ELECTRICITY MARKETS 12,643
Operations1,293,071
CMG 67,9581 other 3,366
Health and SafetyExecutive 65,499
Centre131,710
WORK AND PENSIONS
DVLA 64,399
DVSA146,777
Highways Agency216,917
British TransportPolice Authority 45,917
2 others 3,177
Maritime andCoastguardAgency 48,214
Centre42,145
JUSTICE
Legal Aid Agency (previouslyLegal Services Commission)12,516
HM Courts and Tribunal Service 1,086,100
3 others12,540
Lodgings11,442
National Offender Management Probation(previously Noms (Non-Custodial)) 195,089
Centre42,139
TRANSPORT
HM TREASURY HOME OFFICE
1 other1,679
Centre22,861
INTERNATIONAL DEVELOPMENT 19,358
College ofPolicing 30,317
3 others 14,178

10 The State of the Estate in 2016–17
The vacancy rate in the Central Estate has fallen by 40% in five years

Chapter 2: The estate 11
Chapter 2:
The estate
The Central EstateThe Central Estate is made up of the core property holdings of government organisations. These are buildings where the organisation owns or has responsibility for the head lease. Departments may share some of their space with other government organisations in a Memorandum of Terms of Occupation (MOTO) agreement. For the purposes of this report, however, space is attributed to departments at the head lease level (known as owned holdings), and therefore any space of minor occupations is not shown against organisational totals. This is because the responsibility for the lease, and therefore the space, remains that of the holding department.
The size of the Central Estate has decreased from 8,006,894 sq.m in 2015–16 to 7,893,499 sq.m in 2016–17 – a reduction of 1.42%. This reduction of 113,395 sq.m is equivalent to 435 tennis courts and should be viewed in the context of a reduction of over 1.3 million sq.m in the last four years.
Reflecting the Government’s Estate Strategy to minimise surplus, Figure 2.1 shows the decline in size over the last four years and an increase in Civil Servant headcount.
The Government’s Estate Strategy to create an efficient estate delivered substantial reductions in the Central Estate. The rate of reduction has slowed as the Civil Service Headcount rose, as shown in Figure 2.1. It
6
See https://www.epims.ogc.gov.uk/government-property-finder/Home.aspx
remains to be seen if the Civil Service headcount will continue to rise, especially given the additional demands on departments from Brexit. However, as happened in this reporting period, some rise in headcount is expected to be offset by continued focus on efficient estate management, the Government Hubs programme and increasing Smart Working in the Civil Service.
What is e-PIMSTM?e-PIMSTM is the Electronic Property Information Mapping Service, the central government property database. e-PIMSTM contains over 250,000 land and property records. It is used across central government as well as by local authorities and the devolved governments.
Across the e-PIMSTM platform there are more than 13,000 active users. e-PIMSTM is free to registered users, and has a built-in mapping tool and dedicated service delivery team.
Government Property FinderThe online Government Property Finder provides public access to all land and buildings owned by central government. This includes those records that have been allocated for sale or for rent and is currently available online in a beta version6.

12 The State of the Estate in 2016–17
Figure 2.1: Total size (sq.m) of the Central Estate against Civil Service headcount, 2013 to 2017*
Sq
.m (m
illio
ns)
9.5
9.0
8.5
8.0
7.5
7.0
7.9
8.0
8.3
8.6
9.2
Mar 2017
Mar 2016
Mar 2015
Mar 2014
Jan 2013
* In 2013–14, the reporting cycle changed from calendar year to financial year
Hea
dco
unt
(Tho
usan
ds)
450
445
440
435
430
425
420
415
410
405
400
419
418
439
440
449
Mar 2017
Mar 2016
Mar 2015
Mar 2014
Jan 2013
Total floor area by parent departmentFigure 2.2 shows the total floor area held by departments in 2016–17. The Department for Work and Pensions (DWP), Ministry of Justice (MOJ) and Business, Enterprise and Industrial Strategy (BEIS) combined continue to own over half of the Central Estate. All three departments continue to focus on estate rationalisation and reported a decrease in size from last year.
MOJ led the way, reducing its holding area by 49,644 sq.m (4%) This was mainly as a result of the Courts and Tribunal Service Estates Reform Project delivering reductions of nearly 42,000 sq.m.
In addition, the Attorney General’s Office (LOD) reduced its holding area by 3,338 sq.m (5%) due to Crown Prosecution Service (CPS) rationalisation.
Some departments recorded an increase in their estate. However, the vast majority of that increase (44,483 sq.m of the 58,965 sq.m) was not additional occupied estate, but rather improved data coverage. For example, NHS England reported assets previously marked as assets excluded from central estate. When this is taken into account, the decrease in size from 2015-16 is 2%, rather than the 1.42% reported in Figure 2.1.
Departmental Estates strategies can cause their estate to expand temporarily as part of longer term rationalisation plans. This occurred in 2016-17 for Department of Health (DH) who reported an increase of 3.3% as a result of move into their new Victoria Street Headquarters whilst still in occupation of Richmond House. DH has now fully vacated Richmond House, significantly reducing their London estate.
Not only has the estate reduced in size, the number of holdings (excluding land) has also marginally fallen, decreasing from 4,653 in 2015–16 to 4,638 in 2016–17. This was mainly due to reductions in Private Finance Initiatives (PFI).

Chapter 2: The estate 13
Figure 2.2: Total floor area of the Central Estate by parent department, as at March 2017*
Sq
.m (m
illio
ns)
1.6
1.4
1.2
1.0
0.8
0.6
0.4
0.2
WO
1,1
41
SO
2,6
13
GA
D 2
,874
OR
R 2
,907
NC
A 5
,464
NS
&I 8
,083
GLD
11,
118
Ofg
em 1
2,64
3
FSA
12,
906
DFI
D 1
9,35
8
HM
T 24
,540
RM
32,
091
DC
LG 6
0,19
1
UK
SA
60,
202
AG
O 6
6,03
4
CO
81,
095
FCO
87,
818
DC
MS
126
,090
DFE
161
,561
MO
D 2
98,2
10
DH
392
,125
Def
ra 4
06,6
88
HO
407
,096
DFT
567
,903
HM
RC
981
,171
BE
IS 1
,140
,145
MO
J 1,
359,
826
DW
P 1
,561
,604
*See Glossary for full Department namesDepartment
Total area by regionFigure 2.3 shows the regional distribution of the estate. London and the South East continue to dominate, accounting for over 34% of the central estate.
These regions will see significant transformation, with c.8,000 civil servants and public sector workers starting to move to new Government Hubs in Canary Wharf and Croydon this year. This will include staff from Revenue and Customs, the Department of Work and Pensions and energy regulator, Ofgem.
Longer term, London could see a reduction in civil servants through the gradual relocation of public service jobs into other regions. This will drive further efficiencies in London and also support economic growth in other parts of England.
Across the Central Estate in the UK, 75% of the 12 regions reduced their floor area by between 1 and 9%. Three regions – London, North East and Wales – increased their floor area but these increases were limited to between 1-2%.

14 The State of the Estate in 2016–17
Figure 2.3: Total size (sq.m) of the Central Estate by region, as at March 2017*S
q m
(mill
ions
)
1.6
1.4
1.2
1.0
0.8
0.6
0.4
0.2
Lond
on, 1
,561
,341
Sou
th E
ast 1
,131
,137
Nor
th W
est,
991,
392
Sou
th W
est,
709,
299
York
shire
and
the
Hum
ber,
584,
194
Eas
t of E
ngla
nd, 5
73,7
66
Wes
t Mid
land
s, 5
13,3
55
Wal
es, 5
10,1
74
Nor
th E
ast,
483,
201
Sco
tland
426
,342
Eas
t Mid
land
s, 3
77,4
14
Nor
ther
n Ire
land
, 28,
302
* Charts exclude International region
Lorem ipsum
Vacant spaceSpace that is vacated, ready for release and reuse by other occupiers or for disposal is known as vacant space. Increased efficiency in the use of the estate is typically demonstrated by low rates of vacancy. Some vacant space is necessary to provide flexibility in estate utilisation, meeting short term fluctuations in demand and implementing short term programmes.
The regions with the lowest rates of vacant space were also those with highest property values, London at 0.1% and South East at 0.7%, delivering maximum value for money for the tax payer. There continues to be high demand for space in London that also drives low vacancy rates.
7 Source: Knight Frank, average vacancy rate for 2016-17
Region
Total vacant space for the Central Estate in 2016–17 was 117,884 sq.m. This reflects an increase of 6% during the reported financial year and represents 1.5% of the total Central Estate. The government vacancy rate however remains one fifth of the private sector average of 7.5%7. In the last four years the vacancy rate in the Central Estate has fallen by 40% compared to a fall of 26% in the private sector average, reflecting better use of the estate.
Figure 2.4 shows the percentage of vacant space in the Central Estate compared with the private sector for the last five years.

Chapter 2: The estate 15
Figure 2.4: Vacancy rates in the Central Estate and the private sector in 2016-17%
of
vaca
nt s
pac
e
12.0
10.0
8.0
6.0
4.0
2.0
2012-13
10.2
2.5
8.8
2.4
8.0
2.01.4
7.5
1.5
Private sector average
2013-14 2014-15 2015-16 2016-17
YearCentral Estate
8.9
Tenure breakdownThe distribution of freehold, leasehold and PFI holding area across the Central Estate remains unchanged at 39%, 29% and 32% respectively.
Figure 2.5 shows that the Government continues to prefer to own its Estate. The biggest reduction in tenure was in the number of PFI holdings which fell by 32, compared to leaseholds which increased by a total of 43.
DWP accounts for 59% of the PFI estate and as its main property PFI contract comes to a conclusion in March 2018, there will be a change in the tenure mix. Through the Government Property Agency, the Government will adopt a more commercial approach to use of its Freehold estate.
Figure 2.5: Total size of the Central Estate by tenure, as at March 2017
Freehold3,066,158
39%
Leasehold2,297,429
29%
PFI2,529,912
32%
8 Total net cost includes annual property occupation costs, building operation costs, business support costs, property management costs and utilities. A full definition of total annual operating cost can be found in the Glossary.
Operating costsThe total annual operating cost8 of running the Central Estate in the financial year 2016–17 was £2.57 billion. This represents a 1.4% reduction in real terms on the previous year’s total of £2.55 billion. This reflects continued consolidation of estates across departments and improved space utilisation, despite pressures from a rise in civil service headcount.
Parent departments have reduced operating costs by 14% in 5 years (19% in real terms). In 2016–17:
• 50% of departments reduced their costs• 45% of departments had increases below 10%
Figure 2.6 shows the annual operating cost of the Central Estate by parent department. Two major departments report a material cost increase, however this was mainly due to more comprehensive reporting of costs. When this is accounted for total costs were £2.5 billion.
Figure 2.6: Central Estate running costs for the last five years
£ b
illio
ns
3.1
3.0
2.9
2.8
2.7
2.6
2.5
2.4
2.32012-13
£3.0£2.9
£2.7
£2.5 £2.6
2013-14 2014-15 2015-16 2016-17Year

16 The State of the Estate in 2016–17
The largest savings were made by:
Charity Commission Cut costs by 40%, citing significant savings from an office move in Taunton.
National Savings and Investments Cut costs by 33% as a result of gradual consolidations and building closures.
Department for Education Cut costs by 19% by sharing more of their space with other government departments and by disposing of properties in London, Nottingham, Sheffield, Bristol, Peterborough, Cambridge and Runcorn.
There were increases in cost for two departments:
Ministry of Defence (MOD) Reported costs increased by 23%. The MOD identify the main reason for the increase as more comprehensive cost reporting.
Ministry of Justice Costs increased by 10%. Two major contributory factors were reduced income from the Community Rehabilitation Company and implementation of the HMCTS Estates Reform Project.
Capital receipts in 2016–17In the first two years of the Asset Efficiency programme, around £1.66 billion was raised in capital receipts from disposals: £1.04 billion from 534 sites in 2015–16, and £0.62 billion from 523 sites in 2016–17.
Figure 2.7: Central Estate annual operating costs by parent department9
Over £100 million Up to £100 million Less than £10 million
DWP £630,470,888 CO £44,236,949 Ofgem £8,686,712
MOJ £506,905,380 DCMS £36,035,000 UKSA £7,813,061
HMRC £238,930,281 FCO £35,632,584 CMA £7,240,841
HO £190,489,023 CO £30,151,674 DFID £6,560,287
BEIS £183,822,878 DFE £28,443,610 RM £5,847,787
DH £166,411,361 DCLG £17,216,985 FSA £5,712,282
MOD £152,234,119 HMT £15,204,312 NS&I £5,019,710
DFT £139,858,283 Total £206,921,114 ECGD £2,473,908
Defra £101,456,311 GAD £1,690,355
Total £2,310,578,524 ORR £1,657,745
SO £1,112,353
CHAR £972,708
NIO £800,538
WO £348,759
Total £55,937,046
9
See Glossary for full Department names.
Chapter 2: The estate 17
Disposals of land and property for housingGPU has central oversight of all government land and property. It works across government to create a more effective, efficient and better value estate. As part of this GPU oversees and coordinates the release of government land and property, leading on the commitment to release £5 billion of surplus government land in 2015–20 and supporting the Ministry for Housing, Communities and Local Government to release land for housing. Our aim is for government to only hold land which is vital for operational use and to release surplus land and property in a way that delivers value for the taxpayer and boosts economic growth.
GPU is supporting a number of major transformation programmes across government with significant implications for the government estate:
• Health: Following the Naylor Review into the NHS estate, GPU is working with the Department of Health and Social Care and NHS bodies to transform the health estate in support of the NHS 5-Year Forward View. This includes optimal allocation of the £3.5 billion capital investment announced in Autumn Budget 2017, as well as ensuring Sustainability and Transformation Plan areas are supported to manage and transform their estates efficiently and effectively.
• Defence:Following publication of the Better Defence Estate Strategy in November 2016, GPU is working with the MOD and Defence Infrastructure Organisation to release 91 sites in a way which supports land for housing and wider economic growth.
• Justice: GPU is supporting Her Majesty’s Courts and Tribunal Services to transform the court estate alongside a major programme to digitise court services. We are also supporting the MOJ to transform the Prison estate, including providing 10,000 new prison places and releasing surplus sites.
In March 2017, GPU published ‘Making commercial terms of government land disposals more transparent’10. This committed to publishing an annual Transparency Report, giving details of all government land sales in the previous financial year and will make it easier to access information in one place on government land and property disposals. The first Transparency Report including all central government asset sales in financial years 2015–16 and 2016–17 is due to be published in early 2018.
10 See https://www.gov.uk/government/publications/making-commercial-terms-of-government-land-disposals-more-transparent11 See https://www.gov.uk/government/uploads/system/uploads/attachment_data/file/599778/Guide_for_the_Disposal_of_Surplus_Land.pdf12 See https://www.gov.uk/government/uploads/system/uploads/attachment_data/file/454191/Managing_Public_Money_AA_v2_-jan15.pdf
In March 2017, GPU also published ‘The Guide for the Disposal of Surplus Government Land’11. This sets out the principles and technical processes for the disposal of surplus land and buildings alongside the policy context. It supplements the ‘Managing public money’12 guidance published by HMT.
Whilst the government is taking steps to ensure its estate is managed efficiently and effectively, GPU also encourages external challenge. The Right to Contest was introduced in 2014 to allow the public to challenge government to sell land or property if it is believed to be potentially surplus or could be put to better economic use, including for housing. This has already resulted in seven successful cases, including part of the 19th century Dulwich Hospital site in Southwark (NHS Property Services), land at Canada Docks, Liverpool (Homes England), and part of the Howe Barracks site in Canterbury (MOD).
Case studiesRight to Contest example – Canada Docks, Liverpool• The 0.64ha brownfield site at Canada Docks,
Liverpool (2 miles to the north west of the city centre) was acquired by Merseyside Development Corporation in 1998 and had been vacant, being held for potential freight rail route to the port.
• The site was deemed suitable for industrial or business uses (B1, B2, B8).
• The Right to Contest application triggered a review of the feasibility study of the freight rail route options in partnership with Liverpool City Region Local Economic Partnership and the Combined Authority. This concluded that an alternative route was more appropriate, and the Combined Authority agreed to remove the policy barrier safeguarding this site from development.
• Homes England marketed the site on an open and competitive basis in May 2016 and it was sold in November 2016. It was redeveloped for commercial use.

18 The State of the Estate in 2016–17
One Public EstateFrom its inception as a pilot in 2013, the One Public Estate (OPE) programme set out to occupy a unique position across the public sector – the space in between public sector partners. The aim was to transform the way we manage our assets by creating a public sector-wide mindset on property.
The ethos of OPE is reflected in its own partnership between the GPU in Cabinet Office and the Local Government Association (LGA). This strong relationship is based on a shared agenda to deliver national and local priorities in a way that works for communities. GPU’s role leading the government estate Strategy and position at the centre of Government, alongside the LGA’s role as representative body for local government, puts the partnership in an ideal position to facilitate cross-public sector collaboration.
With £31m awarded at Autumn Statement 2015, the programme has expanded rapidly. The latest expansion in December 2017 saw OPE supporting 319 councils (over 90%) in England.
Partnerships joining the programme up to November 2017 expect to deliver significant benefits by 2020: 44,000 new jobs, unlock land for 25,000 new homes, £615m capital receipts, and £158m running cost savings. We are already seeing the benefits of the hard work by partnerships joining as part of early pilot phases. By March 2017, OPE partnerships had delivered £63m in capital receipts, £18m running cost savings, created 5,462 jobs and released land for 2,203 new homes.
But the benefits of this collaborative programme go further than these property-based outputs. OPE partnerships are now seeing land and property not just as a cost but as an enabler for growth and service transformation. Indeed, the programme has successfully delivered 73 co-locations so far, surpassing our target of 45 by 2020. These range from combined emergency service headquarters to multi-service community hubs. Partnerships now expect to deliver near to 200 co-locations by 2020, making public services more accessible to communities.
OPE is also playing an important role in supporting wider government agendas. Working with 13 major government departments, the programme has provided expertise to help unlock projects and break down barriers at the local level. This includes supporting the delivery of the housing agenda, health and social care integration, and courts and prisons reform. The programme has also worked closely with the MOD to support the resizing of its estate. The Department’s strategy ‘A Better Defence Estate’ 13 was published in November 2016, and was informed by its active engagement with OPE
13 MOD, https://www.gov.uk/government/uploads/system/uploads/attachment_data/file/576401/Better_Defence_Estate_Dec16_Amends_Web.pdf%20%20
partnerships. It recognised the value of sharing forward plans with local authorities to enable long-term economic growth from the use of vacant Defence sites.
Figure 2.8: Coverage of areas with an OPE presence
In 2017, OPE expanded its partnership to the Ministry for Housing, Communities and Local Government to support delivery of the £45m Local Authority Land Release Fund (LRF). The LRF will provide capital funding for councils to bring forward sites for housing that would otherwise not have been developed, contributing to the local government ambition to release land for 160,000 new homes by 2020. Coupled with OPE revenue funding and practical support, this joined-up working is making it easier for local authorities to access support and funding from across government.

Chapter 2: The estate 19
Case studiesWaltham Forest – a new town hall campusThe London Borough of Waltham Forest is transforming its historic town hall campus in north east London. The OPE Partnership plans to transfer services from several existing council offices to a new 6,600 sq.m civic centre developed to house the Council, MOJ and private businesses.
OPE has funded a dedicated Project Manager, and the programme has successfully brought together the MOJ and the Council to align the interests of local and central government in the area, achieving the best outcome for local residents. The MOJ has sold Waltham Forest Magistrates’ Court to the Council, which will optimise the provision of affordable housing, and is currently co-locating in Council offices.
Waltham Forest and MOJ staff will move into the new, modern office accommodation, offering more joined-up services for the public including a one-stop-shop for health and wellbeing. Nine of the Council’s older, less efficient offices will close, freeing up land for 350 new homes (of which at least 35% will be affordable) and commercial space. They expect to raise significant receipts from selling these surplus and outdated properties. Taxpayers are set to benefit from an extra £1m a year in business rents, council tax and reduced running costs.14
New design for Waltham Forest Town Hall Campus incorporating the civic centre
14 Some of this info comes from the LBWF web site at https://www.walthamforest.gov.uk/content/walthamstow-town-hall-campus-plans-unveiled

20 The State of the Estate in 2016–17
Rutland OPE: North Luffenham – St George’s BarracksWith OPE support, Rutland County Council and the MOD are exploring options for the future use of St George’s Barracks. The MOD intends to release this large site covering 300 hectares (over 700 acres) in 2021. Built as a training airfield during World War II, it was adapted for use as a base for heavy bombers before it was taken over by the Army. The site presents a number of significant challenges in developing it for civilian use and partners need to balance its transformation with the needs of existing communities, the region and the environment.
The Council has high ambitions for the site, including a garden village with up to 3,000 new homes and an enterprise park that would create 4,700 jobs, mainly in the construction and commerce sectors. As well as generating new homes and jobs, the project would produce substantial capital receipts.
OPE is supporting the critical early master planning stages of the project, facilitating discussion between partners, and helping to coordinate bids for capital funding from across Government to accelerate these development proposals.
The MOD’s St George’s Barracks site in Rutland

Chapter 2: The estate 21
Staffordshire County Council – Enterprise Campus: Co-location and regeneration between Health, Police and CouncilSouth Staffordshire Council – part of the wider Staffordshire OPE partnership – is embarking on an ambitious OPE project to increase the scale and range of public services operating from its Community Hub. The Hub will integrate a GP surgery, pharmacy, NHS Clinic, private businesses and voluntary organisations alongside existing library and Council offices. This state-of-the-art development will commence with the arrival of the police force in early 2018 and aims to transform local residents’ experiences of public services.
OPE has funded the crucial business case development stage of this ambitious project. This will allow the partnership to continue with the momentum gained so far, and secure
the confidence of their co-location partners. Staffordshire Council recognise that they need to work closely with partners to develop creative solutions to integrating existing and new services at the campus. The dedicated OPE regional team are providing support to the partnership by sharing expertise of nearby OPE partnerships.
This consolidation of services will allow closure of inefficient, disparate sites including the existing GP surgery and police stations, subsequently releasing land for 50 homes and generating around £3m in capital receipts. The relocation to a more modern and efficient workspace is also forecast to reduce ongoing operating costs by around £1.2m and increase productivity for the public bodies involved.

22 The State of the Estate in 2016–17
Space per person across the office estate decreased by 5% in 2016–17

Chapter 3: Office performance 23
.Chapter 3:
Office performance
Government departments in 2016–17 continued to use their office space more effectively and efficiently in line with Government policy, particularly through smarter working, investment in technology and flexible working. The performance metric of space occupied per staff member has improved over the year, continuing the trend seen in previous years. The government continues to outperform the private sector through these initiatives and the strategic use of its estate.
Structure of the benchmarked estateThe 2016–17 office benchmarking programme included 971 occupations participating across 29 parent departments. The number of occupations reduced by 6% from the previous programme. This was mainly due to disposals and rationalisation initiatives across the office estate, with DWP and Defra having the largest reductions in benchmarked occupations.
Further information about the structure and size of the benchmarked estate is provided at the end of this chapter.
Definition of benchmarked estateThe benchmarked estate consists of office space occupied by government organisations. It does not include specialist property such as courts, tribunals or jobcentres.
Some organisations benchmark their entire office estate but the majority continue to focus on office space over 500 sq.m (75% of occupations that were benchmarked in the 2016–17 programme were 500 sq.m or over).

24 The State of the Estate in 2016–17
Example of office rationalisation strategiesThe number of DWP occupations fell by 31 in this benchmarking programme.
The transformative People and Locations Programme has been the vehicle for deciding the Department’s property strategy. Implementation of the strategy will result in an overall improvement of the Department’s use of space, improving benchmarking results for 2017–18 and beyond. Further reductions in occupancies are expected for 2017–18 and 2018–19 benchmarking programmes for residual projects.
Defra has also seen a reduction in the number of benchmarked occupations as the Department has reduced its estate by vacating several properties.
In addition, Defra has reviewed and updated existing data and records on the ePIMSTM database to improve the quality of the data that is captured.
In line with the reduction of occupations, the amount of space benchmarked in the programme has fallen by 74,033 sq.m, which equates to a drop of 2.6%.
Space per personThe average space per person (sq.m per full time equivalent (FTE)) across the office estate is 9.9 sq.m. This is an improvement of 5% on the figure of 10.4 sq.m reported in the preceding two years. This shows progress has been made against the 8 sq.m per FTE target for government offices by March 2018. Analysis of this KPI over the last three years (see Figure 3.1) indicates that the long-term ways of working are embedded in government.
The Government has outperformed the private sector for the 4th consecutive year. The 2016–17 private sector benchmark is 11.2 sq.m per FTE – 12% higher than the government rate. Commercial property research indicates that the private sector has been less successful than the public sector in rationalising their estate in line with reduction in staff numbers.
The Government Hubs Programme will have a significant impact on the government estate by facilitating the move to more modern and efficient buildings.
In contrast to these reductions, there has been an increase in FTEs and workstations. This reflects the first increase in 6 years to Civil Service staff numbers15 and the Government’s commitment to accommodate recruitment by maximising the efficiency of existing properties.
Approximately 21% of departments have met or are within 0.5 sq.m per FTE of the 8 sq.m target, and improvements in performance were made by 24 out of 29 (83%) of departments – with the most significant improvements being achieved by:
Departments reporting on over 20,000 sq.m of space
• Department for Education – from 8.3 sq.m per FTE to 7.2 (13% improvement)
• Attorney General’s Office – from 10.1 sq.m per FTE to 8.9 (12% improvement)
Departments reporting on under 20,000 sq.m of space
• Export Credits Guarantee Department – from 7.1 sq.m per FTE to 6.2 (12%)
• Charities Commission – from 6.2 sq.m per FTE to 5.7 (9%)
15 Civil Service employment on 31 March 2017 was 419,399, up 1,056 (0.3%) on 31 March 2016. Office for National Statistics, Civil Service statistics, UK: 2017

Chapter 3: Office performance 25
Figure 3.1: Utilisation rates in the benchmarked estate and the private sectorS
q.m
per
FT
E
13.0
12.5
12.0
11.5
11.0
10.5
10.0
9.52013-14
Benchmarked estate JLL private sector
2014-15 2015-16 2016-17Year
12.6
10.710.9
11.2
11.3
10.4 10.4
9.9
The 8 sq.m targetThe current target for space utilisation is 8 sq.m per FTE. Progress has been made towards this with 10% of departments having already exceeded the target and a further 28% that are within 1 sq.m of the target as at March 2017.
The previous target was of 10 sq.m per FTE and the majority (69%) of departments have achieved that. Departmental performance against the 8 sq.m target is illustrated in figure 3.2.
Figure 3.2: Space per person by parent department in the benchmarked office estate, as at March 2017
Sq
.m p
er F
TE
25
20
15
10
5
8 sq.m per person target
WO
21.5
13.2
12.3
11.9
11.1
11.0
10.4
10.2
10.1
9.8
9.8
9.7
9.6
9.4
9.3
9.3
9.3
9.2
8.9
8.9
8.9
8.7
8.6
8.5
8.2
8.1
7.2
6.2
5.7
SO
DW
P
ON
S
NS
&I
FC
MO
D
HM
RC
BE
IS
GA
D
Def
ra
DC
LG CO
HO
Ofg
em
DC
MS
OR
R
DFI
D
AG
O
DFT
FSA
MO
J
DH
HM
T
FCO
DFE
CH
AR
EC
GD
NIO
DepartmentSee Glossary for full Department names
Regional performance
Performance regarding the use of office space per person on the benchmarked estate improved in 83% (10 out of 12) of the regions and ranged from 12.3 sq.m in the South East to 8.8 sq.m per FTE in the South West.

26 The State of the Estate in 2016–17
Figure 3.3: Space per person by region in the benchmarked office estate, as at March 2017
E Midlands,10.8
N Ireland,8.9
London,9.1
NE, 9.0
Scotland,11.3
Wales, 10.6
Yorkshire,9.6
SW, 8.8
East ofEngland, 12.0
NW, 10.0
SE, 12.3
W Midlands,9.8
Significant improvement was seen in the South West Region, with a 12% improvement at 8.8 sq.m per FTE from last year’s 10 sq.m – achieved across an estate of almost 260,000 sq.m and over 29,000 staff.
Table 3.1: Size of the benchmarked estate by region, as at March 2017
Region Net Internal
Area
Number of FTEs
Sq.m per FTE
South East 211,436 17,220 12.3
East of England 100,242 8,352 12.0
Scotland 207,892 18,431 11.3
East Midlands 107,776 9,954 10.8
Wales 196,811 18,645 10.6
North West 400,837 40,204 10.0
West Midlands 187,630 19,057 9.8
Yorkshire and the Humber 217,665 22,642 9.6
London 632,742 69,592 9.1
North East 219,168 24,271 9.0
Northern Ireland 18,228 2,052 8.9
South West 258,910 29,333 8.8
South West performanceIn the South West, over 60% of departments improved their performance. MOD, who occupy 38% of the region’s benchmarked estate, achieved a space utilisation of 7.6 sq.m per FTE. This was achieved by accommodating staff into existing accommodation at the Abbey Wood sites in Bristol and vacating offices at Kestrel Court in Gloucester
Approximately 65% of the benchmarked office estate in the region is occupied by three departments: MOD, BEIS (including substantial Met Office and Land Registry occupations) and DWP.

Chapter 3: Office performance 27
Figure 3.4: Average space per person in the South West region, as at March 2017 (includes only those departments with an office estate over 50 sq.m)
Sq
.m p
er F
TE
15
10
5
8 sq.m per person target
MOJ HO AGO DWP HMRC DH DCMS DFT Defra BEIS DCLG MOD DFE FCDepartment
15.8
14.5
12.8
12.8
11.9
11.0
9.2
8.7
8.5
8.3
7.8
7.6
7.4
7.2
London performanceDH increased the size of their London estate by 4% but operated it more efficiently to achieve a 6% improvement in the utilisation rate – down from 8.3 to 7.8 sq.m per FTE in London.
Both the number of benchmarked occupations and number of FTEs were in line with figures for the previous year. However, the size of space benchmarked has reduced from approximately 671,000 sq.m to 632,000 sq.m – a drop of 6%.
Figure 3.5: Average space per person in the London region, as at March 2017
Sq
.m p
er F
TE
25
20
15
10
5
8 sq.m per person target
WO
20.7
15.8
14.2
12.3
11.0
10.5
9.9
9.8
9.8
9.8
9.5
9.5
9.5
9.2
9.2
8.5
8.4
8.1
8.0
7.8
7.8
7.7
7.7
7.6
7.3
6.5
6.2
SO
MO
D
DW
P
NIO HO
GA
D
DC
LG
Ofg
em
BE
IS
NS
&I
HM
RC
CO
OR
R
FSA
DC
MS
HM
T
DFT
FCO
DH
MO
J
DFE
CH
AR
AG
O
DFI
D
EC
GD
Def
ra
Department

28 The State of the Estate in 2016–17
Cost of space on the benchmarked estateThe average cost per person16 was £4,859 – an increase of 6% on the previous year’s figure of £4,587. The government continues to significantly out-perform the private sector benchmark of £5,828 per person by nearly £1,000 per person.
The average cost of space across the benchmarked estate in 2016–17 was £493 per sq.m- an increase of 11% on the previous year’s figure of £443 per sq.m. The private sector equivalent in 2016–17 for cost per sq.m was £53217 – 7% more than the benchmarked estate.
There were significant increases in costs reported by both HMRC and MOD, explained by improvements in the reporting of their costs.
Both MOD operating costs and office utilisation have seen significant changes compared to the previous financial year. This is as a result of improvements in data capture which has provided a more complete and realistic picture of the sites included in scope.
MOD data supplied for 2016–17 represents an increase of 23% on the previous financial year. There has been an increase in the amount of data being supplied to GPU. This means that, whilst some costs across some sites have decreased, new costs that had not been previously provided by MOD have been accounted for in this year’s exercise. This has mainly been experienced in security (staffing) costs and utilities.
When the improvements in cost reporting for both departments are factored in to provide a more consistent year-on-year comparison, the revised cost per person of £4,602 remains static compared to last year, with an increase of 0.3% per person. This is similar to the cost per sq.m which is adjusted to £467, an increase of 6%.
The increased cost of the office estate and associated metrics is due to the fact that departments, in general, have had to accommodate the rise in FTEs from 273,499 to 279,752 (2.3%) within an estate that reduced by 3% (74,033m2). There have been costs required to achieve improved reconfiguration of the estate to better utilise available space.
16 Cost per person (£/FTE) is the annual operating cost of a building divided by the number of FTE staff and contractors based in the building17 © 2017 Jones Lang LaSalle IP, Inc. All rights reserved.
Benchmarking Programme updateThe State of the Estate 2015-16 outlined the intention to gather a comprehensive set of efficiency and performance metrics for 85% of the Central Estate. The increased scope will be achieved by including science space (e.g. laboratories), public caller space (e.g. jobcentres), storage space (e.g. warehouses) and courts, in addition to increased coverage of the office space as the new GPA becomes established.
Expanding the collection of data to include these other asset types will ensure greater accuracy of reported results, a truer reflection of the government estate and will also offer a larger data source in which to identify further opportunities to deliver value for money. The focus will be tightened as the scope increases with reductions in the number of mandatory data fields for the office estate.
Over the next year performance of the wider estate will be measured and benchmarked by:
• piloting the benchmarking of KPIs for the public caller estate;
• trialling KPIs for the science estate by running several pilots; and
• developing a benchmarking programme for the storage, courts and defence estate.
Developments in the office estate benchmarking, as set out in State of the Estate 15-16, included:
• building performance scorecards which will be launched for inclusion in the 2017–18 benchmarking programme;
• Building User survey implemented for departments to capture qualitative performance data on their buildings;
• building condition will be reported using the user survey that will be included in the 2017–18 programme;
• refinement of the benchmarking programme methodology, process and systems to ensure the programme is as efficient as possible and focuses on key metrics to drive data quality; and
• reporting on sustainability will also be improved for 2017–18 with the mandatory requirement of Energy Performance Certificates and Display Energy Certificates.

Chapter 3: Office performance 29
Space per workstationThe number of workstations recorded is 289,356 – an increase of 3% on the previous year although office space has reduced, illustrating better reconfiguration
of the estate. The performance in terms of sq.m per workstation is 9.5 for 2016–17, compared to 10.1 in the previous year – this continues the trend of an overall reduction of 19% since 2012 when the average use was 11.8 sq.m
Structure and size of the benchmarked office estate
Table 3.2: Changes in benchmarked properties
Year Net Internal Area (sq.m) Number of FTEs Number of workstations
2015–16 2,833,371 273,499 279,990
2016–17 2,759,338 279,752 289,356
Figure 3.6 shows that although the size has reduced, the structure of the government estate, in terms of size of buildings, has remained consistent over the last 5 years. There has been a slight movement towards larger offices over the last year, a trend expected to continue due to the multi-occupancy buildings within the Government Hubs Programme and co-locations promoted by the One Public Estate programme.
Figure 3.6: Structure and size of the benchmarked office estate, as at March 2017
Year
Tota
l per
cent
age
by
size
gro
up
55% 54% 54% 54% 56%
40% 40% 39% 39%37%
5% 5% 5% 6% 5%1% 1% 2% 2% 2%
2012-13
0-499 sq.m 500-999 sq.m 1,000-4,999 sq.m 5,000+ sq.m
2013-14 2014-15 2015-16 2016-17

30 The State of the Estate in 2016–17
The age of participating buildings in the benchmarked estate
The age of the benchmarked estate has an impact on how it performs across government in terms of utilisation and sustainability.
The age of buildings is reported optionally; where data is available, the majority were built between 1950 and 1999 – the age of benchmarked properties has not changed materially in 2016–17.
Table 3.3: Age breakdown of participating buildings in the 2016–17 benchmarking programme
Year Pre 1900 1900–1949 1950–1999 2000 onwards Unknown Total
2015–16 2% 3% 41% 7% 47% 1,034
2016–17 2% 3% 38% 8% 49% 926
Case studiesHome Office Smart WorkingModernising IT, rationalising estates and introducing shared services have been central to introducing smarter working at the Home Office.
The Smarter Working Programme has designed new office spaces that support and encourage smart working, in accordance with the Smart Working – Code of Practice (PAS 3000:2015). The new buildings offer staff flexibility in terms of how, where and when they work and modern space design supporting collaborative and flexible use. Efficient and sustainable workspaces have been created to meet the demanding needs of the business. The Home Office Programme has gained wider recognition, winning the Leadership category in the 2017 The Way We Work (TW3) awards.
The Manchester Soapworks project, led by the Justice, Law & Home Affairs Estates Cluster, consolidated four fragmented offices into one strategic site. This reduced space from 14 sq.m to 8 sq.m per FTE and improved efficiencies by equipping people with modern technology to increase productivity.
A change network was created - bringing together staff from across all Home Office business areas and all grades - to drive the delivery of the smarter working plans, coordinate engagement, embed change and share lessons learnt and good practice.
This change network drove smarter working initiatives through effective communications and outcome-based thinking. A smarter working change portal was created on the intranet, enabling staff to receive the latest updates. A smarter working blog was set up to encourage staff to share best practice methods.
The Manchester project is now an exemplar of how senior staff, managers and staff have worked closely together to embrace change. Surveys have measured increased staff satisfaction, motivation and engagement and business areas continue to actively promote smart working arrangements to attract new talent and retain experienced staff.
A network of skilled smarter working champions has been established to drive cultural change across the business and offer support at team level.

Chapter 3: Office performance 31
Government Hubs ProgrammeThe Government Hubs programme, being delivered by the Government Property Agency, is transforming the Civil Service into a modern employer by providing staff with modern, fit-for-purpose office space. Working with departments it is reforming how government uses property, removing artificial barriers to collaboration between departments.
The programme is an example of the Civil Service in collaboration, working across departmental workforce plans to create shared modern workplaces that allow staff to work efficiently from a variety of locations and in a number of ways. The intention is to work in ways that minimise the need for office space while ensuring that existing space is used more efficiently. The space needed for each civil servant to work to is set to reduce to 6 sq.m within the strategic hubs.
A network of shared, regional hubs and supporting office estate is being created. The hubs will include:
• Strategic hubs: There will be around 20 hubs in strategic locations with good public transport connectivity, local amenities and a modern working environment, including technology that supports smart working. As a result, staff can operate more efficiently, be more productive, and deliver the best possible service to the public.
• Mini-hubs: There will be around 200 mini-hubs across the UK in secondary towns and cities close to public transport infrastructure.
• Touchdown spaces: These might be located in operational buildings (e.g. jobcentres, depots) or other public sector spaces (e.g. libraries), with five to ten desks and limited facilities.
18 See Chapter 5, page 43 for a more details on PBRP.
Plans are not static and evolve to reflect the changes from individual workforce strategies and emerging from new initiatives such as the Public Bodies Relocation Programme (PBRP)18.
The hubs will be rolled out in controlled phases across the country and will bring more parts of the UK Government together under one roof in the different home nations. The first phase, delivered jointly by HMRC and GPA, is well underway. To date, 11 multi-departmental hubs have been announced - investing in each of the UK capital cities of London, Edinburgh, Cardiff and Belfast. By 2020, up to 35,000 people will be settled into these first 11 hubs, where teams from different departments will share accommodation and facilities to encourage more joined-up working.
Improving the quality of office accommodation outside London and the South East will help spread wealth and opportunity to all areas of the country. Core buildings in Whitehall will be retained and staff will be relocated to well-connected hubs in London and beyond. By summer 2018 nearly 6,000 civil and public servants from eight different organisations will move out of Whitehall to 10 South Colonnade, the new government hub in Canary Wharf. Better use will be made of the central London estate not least through greater sharing of buildings between departments. The strategy remains flexible to accommodate workforce fluctuations over time and to support wider government initiatives: for example, in early 2018, the GPA acquired additional short term space at Windsor House in Westminster, which will house teams from seven departments from large departments of state to smaller arm’s-length bodies.

32 The State of the Estate in 2016–17
More hubs are in the pipeline across the country. Over the next year, the focus of the programme will shift to the fit-out of further phase one hubs ready for occupation and to the roll-out of phase two which will see further acquisitions and refurbishments.
The programme is on course to reduce the number of office buildings by 75% to around 200 principal buildings from 800 today by 2025, generating savings of around £2 billion over 20 years.
The changes to the physical environment are being complemented by the increased use of smart working. The ambition is for government to consistently operate in line with PAS3000: Smart Working code of practice. This will help to provide a flexible, modern way of working which better matches the needs of society and will consequently help to attract and retain high quality civil servants. In line with what many other organisations have achieved, smart working is expected to increase productivity, reduce costs and improve wellbeing, whilst contributing to wider objectives such as localism, sustainability and reducing pressure on the transport system. The combination of smart working and a modern estate is critical to the success of departments’ workforce transformation plans and delivery of their operational objectives.

Chapter 3: Office performance 33
Case studiesHM Government, 1 Ruskin Square, CroydonThe Croydon government hub was the first new hub to be announced in August 2016. Less than 12 months later - in July 2017 - the first teams moved in and currently over 1,800 full time equivalent (FTE) staff are based there. By the end of March 2018, more than 2,000 FTEs will be working in the hub.
The Croydon hub is a new build office, over eight floors, which has been designed to enable teams to work more flexibly and collaboratively. The layout includes different types of workspaces, from shared spaces to quiet zones which, together with the modern technology available, will really change the way the Civil Service does things. The major occupier is HMRC.
The hub is one of 14 hubs, including 13 HMRC regional centres that are being delivered by a joint HMRC and GPA team.
The design of the Croydon hub has been influenced by HMRC’s extensive research and trials of new ways of work in its existing offices. The hub has several different zones for different types of work activity – in addition to the core space where teams can sit together, there are areas of collaboration space, designated learning facilities and quiet space for activities that require concentration. The hub also has bright and airy amenity spaces for staff to relax, as well as a café. Feedback from staff has been overwhelmingly positive - over 90% of staff working in the hub rate the working environment as “Ok, good or excellent”.
When asked for his views, HMRC’s South East Change Lead, Mike Hamilton said “our people have really adapted well to the new facilities. The layout of the building is great, with an abundance of different areas and types of workspaces to choose from, and state-of-the-art IT. It’s a building quite unlike anything that our people have experienced before, and many have commented on the high standard of the design and the professional feel of the environment and surroundings”.
Croydon is the first hub to go live and the lessons learned from Croydon together with the information provided from HMRC staff surveys are being used to inform the design of other hubs. The government hub policy, standards and specifications across the UK will be reviewed to ensure provision of the best possible working environment to users at the best value to the taxpayer.

34 The State of the Estate in 2016–17
In 2016–17, the Government reported a 33% reduction in carbon emissions
Chapter 4: A sustainable estate 35
Chapter 4:
A sustainable estate
The two principal measures that are used to assess progress on the environmental impact of both new and existing buildings are:
• Energy Performance Certificates (EPCs) for government buildings; and
• Greening Government Commitments.
Energy Performance CertificatesEPCs were introduced in 2008 and show the energy efficiency rating of a non-dwelling. The rating is shown on an A–G rating scale similar to those used for fridges and other electrical appliances. The EPC includes recommendations on how to improve energy efficiency, although there is no statutory requirement to carry out the recommended measures stated.
EPCs are valid for 10 years and are displayed in commercial premises larger than 500 sq.m that are frequently visited by the public, and where one has previously been produced for the sale, construction or renting out of the building.
SustainabilityThe Climate Change Act 2008 placed a legal duty on Government to reduce the carbon footprint by 80%. Property has a big part to play in achieving this reduction, with 40% of the UK’s energy consumption and carbon emissions coming from our buildings.
The Government Hubs programme will play a major part in making the office estate greener. As older buildings are replaced or refurbished, any new stock will have to meet tough sustainability standards and fall into the top 25% of energy performance for their building type.
New acquisitions of government buildingsThe Government has pledged to procure buildings that are more energy efficient.
The EPC rating of all new procurements are monitored and departments are asked to provide an explanation of any procurements of buildings that have a performance rating that falls outside the top quartile for energy performance. During 2016–17, buildings in the top quartile of energy performance (rating A to C) achieved efficiency ratings ranging from 0 to 74.

36 The State of the Estate in 2016–17
All new acquisitions/refurbishments will continue to meet the standards as detailed in the Common Minimum Standards for Construction:
• Building Research Establishment Environmental Assessment Method – Excellent for all new projects and Very Good for refurbishments.
• Any new procurement project (whether new build, refurbishment, purchased, leased or the procurement of a service – e.g. managed workspace) must fall into the upper quartile of energy performance for the building type, except where specific operational requirements prevent this.
In 2016–17, the Government reported 10 acquisitions that had an EPC rating above 74 (A-C), and these therefore fell outside the top quartile for energy performance.
A summary and justification for the procurement are given in Table 4.1.
Greening Government CommitmentsGreening Government Commitments19 are overall government targets, set by Defra, to reduce greenhouse gas emissions, and the use of water and waste across the estate.
A new set of targets20 has been agreed for 2016 to 2020. Performance by government organisations against these targets for 2015–16 is published by Defra in the Greening Government Commitments annual report.21
19 Greening Government Commitments report on the Central Estate plus the Defence military estate and NOMS custodial estates20 www.gov.uk/government/publications/greening-government-commitments-2016-to-2020/greening-government-commitments-2016-to-202021 www.gov.uk/government/collections/greening-government-commitments
Reducing carbon emissions• The government reported a 33% reduction in
emissions in 2016–17, exceeding the 2020 target by 1%.
• Nine departments are still working towards their individual 2020 target, but the remaining 13 have met or exceeded their target early.
Reducing paper• Paper consumption fell by 50% in 2016–17 thereby
meeting the 2020 target early. Ten departments exceeded the 50% target.
Reducing waste • The Government reported departments diverted
87% of waste from landfill in 2016–17, maintaining the same level as last year.
• Four departments sent no waste to landfill. 59% of waste was recycled – up 3% on last year.
Reducing water consumption• Water consumption rose in 2016–17 compared to
the previous year but overall consumption is still lower than in the baseline year of 2009–10.
• The main reason for increased water consumption was a dry summer. This effected departments with large estates, particularly Defra, which includes Forestry Commission and Kew Garden sites in its estate; and MOD. MOD made slightly less reductions in its water consumption in 2016/17 compared to 2015/16. MOD water consumption was almost 66% of all government water consumption and therefore this had a material impact on figures.

Chapter 4: A sustainable estate 37
Case studyFCO — office water efficiencyThe FCO has struggled in recent years to significantly reduce its water use and last year did not meet the Construction Industry Research and Information Association’s (CIRIA) good practice benchmark for water consumption of 6m3 per FTE. To drive efficiency, the department had to look beyond straightforward sustainability projects.
Much of the FCO’s UK estate’s toilets were over 30 years old and in need of refurbishment, and analysis in a number of buildings across the estate had identified that urinal flushing controls were failing and contributing to significant leakage. Aligning business-as-usual maintenance and refurbishment with the Department’s sustainability aims helped to drive better long-term value for money. The toilet refurbishment programme allowed FCO to innovate and install waterless urinals across the estate.
The phased roll-out across FCO buildings was successful and minimised the impact of the daily running of the estate. Where waterless urinals have been installed, future unnecessary wastage of water has been prevented.
The impact in water use has been significant – driving 40% reductions in some of the FCO’s buildings, contributing to an overall reduction of 15% across the UK Estate, and a staggering 24% reduction across our office estate compared to 2015–16.
Facilities management has proactively contributed to the achievement of the ministerial targets and the Environmental Policy aim of continuous improvement. While innovation in a Grade I listed building can be particularly challenging, this initiative has been driven by experienced staff on the ground with an innate understanding of the estate.

38 The State of the Estate in 2016–17
Table 4.1: Buildings procured outside the top quartile of energy performance, 2016–17
Department and property centre Property name EPC rating Justification for procurement
Department for Culture, Media and Sport
DCMS – Big Lottery Fund Apex House, Birmingham
115 Big Lottery Fund were already based in Apex House and other property solutions were a greater cost.
Department for Environment, Food and Rural Affairs
Defra – Department for Environment, Food and Rural Affairs
National Agri-Food Innovation Campus
86 The Sand Hutton site is a laboratory & science campus previously owned by Defra for 20+ years. A sale & leaseback was agreed in mid-2016, with Defra retaining a very small area under lease for businesses needing to remain on site. This is a laboratory site, with a very high energy usage to support the science & a number of more unusual building types / requirements i.e. glass houses, high cooling requirements.
Defra – Department for Environment, Food and Rural Affairs
National Agri-Food Innovation Campus
137
Department of Health
DH – Health Education England Regent House, Stockport SK4 1BS
77 Short-term solution to providing accommodation for a small amount of staff who are hosted by HEE and needed to be in Stockport to fulfil their duties. We will be exiting the premises at the end of this financial year.
DH – NHS Blood & Transplant Kenburgh House, Part First Floor, Bradford BD1 4QL
79 We had been searching for a property suitable to accommodate a Donor Centre and a Teambase with associated parking in an acceptable location in Bradford for quite some time. Kenburgh House was the option which suited all our operational requirements.
DH – NHS Digital 2 Whitehall Quay, Leeds LS1 4HG
98 Short term acquisition to meet demand but aligned to the government hub programme for Leeds. At the time of acquisition there was a lack of available stock at around 25,000 sq.ft in Leeds city centre for immediate occupation.
DH – Public Health England Civic Offices, Fareham PO16 7AZ
117 PHE’s relocation with Fareham Borough Council followed its vacation of private sector premises in November 2016. There were no other Public sector property alternatives available in Fareham.

Chapter 4: A sustainable estate 39
Department and property centre Property name EPC rating Justification for procurement
Department for Work and Pensions
DWP – Operations Phoenix House, Tiverton EX16 6QF
112 Divesting a building and co-locating with the Local Authority has reduced DWP’s overall costs and sq.m occupied; it is also consistent with the One Public Estate initiative. Recent and planned energy saving measures are expected to improve the EPC rating.
Ministry of Justice
MOJ – HMCTS (South East) Council Chamber – Tunbridge Wells Town Hall, Tunbridge Wells TN1 1RS
99 Closure of Tunbridge Wells County Court required alternative hearing provision within the TW area.
MOJ – NOMS PROBATION Capital House, 134-138 Romford Road, London E15 4LD
102 NPS occupied 4 Romford Road. This was redeveloped by the landlord into a major housing scheme and NPS were served a s25 notice. The property provides an important service and needs to be situated within the immediate locality.

40 The State of the Estate in 2016–17
The transformation of the government estate has also transformed the Civil Service into a great place to work

Chapter 5: Forward look 41
Chapter 5:
Forward look
The Government continues to make good progress in making the government estate more efficient – reducing its size, annual operating costs, vacancy rate and improving its use to ensure value for money for the taxpayer from the government estate.
A key highlight is the sustained improvements in vacant space and utilisation. This reflects the work undertaken by government to strategically manage its estate in line with its business commitments. The continued disposal of surplus property continues to help boost economic growth and the creation of new homes.
By transforming the government estate, departments are also providing great places to work in buildings that attract, develop and retain a highly skilled and motivated workforce. By removing boundaries between departments, local authorities and other public bodies, productivity will be increased within buildings and in the Civil Service as a whole.
This puts the Government in a strong position as it looks to develop a new Government Estate Strategy.
The sections below outline the forward look for some of the key initiatives for government property over the next year.
A new Government Estate StrategyThe GPU will produce a Government Estate Strategy that will seek to build on the strong foundations detailed within this document. This strategy will represent a step-change in government’s property ambitions to deliver the best possible public services, release land for housing and boost growth across the UK.
This will result in a comprehensive narrative – outlining the ambitious steps to be taken across the Civil Service to ensure that the estate delivers objectives that go far beyond efficiencies and capital receipts.
The revised Government Estate Strategy is due for publication in spring 2018.

42 The State of the Estate in 2016–17
Government Property Profession (GPP)Property professionals lead on or are involved in policies that have significant consequences for the delivery of central government priorities, from major infrastructure programmes to providing valuations for local and national taxation.
Key to the development of the property function is the ability to attract, develop and retain the skilled professionals needed to deliver business objectives efficiently and effectively. As part of government’s wider commitment to the development of its workforce, the property profession will continue to deliver against the ambitions of the Civil Service Workforce Plan:
• Attracting and retaining people of talent and experience from a range of sectors and backgrounds;
• Building career paths that encourage a breadth of experience and a depth of expertise;
• Developing world-class leaders who are inspiring, confident and empowering;
• Becoming the most inclusive employer in the UK and championing diversity; and
• Developing cost-effective and flexible reward structures that enable the Civil Service to attract, retain and develop the very best talent.
Asset EfficiencyReleasing surplus public sector land efficiently and effectively supports a number of Government objectives:
• It delivers value for the taxpayer through raising receipts and cutting running costs.
• It makes an important contribution to fixing the housing market by boosting land supply.
• And it supports local growth, by providing land for other uses such as commercial and community use.
GPU will continue to support departments to strategically ensure that surplus land is identified and used to meet objectives above. GPU has a Government Property Finder website to help rent or sale surplus government property. GPU will improve this website to support better commercial outcomes and enable earlier discussions on the potential use of specific sites.

Chapter 5: Forward look 43
Government Property Agency (GPA)• The GPA is due to be formally established in 2018
as an Executive Agency of the Cabinet Office. Within the next 3 years, GPA will manage government offices including those of departments such as Cabinet Office and BEIS. Over the next 10 years, the GPA expects to generate over £1bn of financial savings for the tax payer.
• The GPA will partner with government departments to provide property and workplace solutions. More broadly, it will be an enabler for the delivery of Civil Service transformation, regional growth and the Government’s vision to strengthen the Union. Its objectives will be to:
• improve the efficiency and effectiveness of the government estate;
• manage the government property portfolio strategically to realise benefits that departments cannot achieve on their own;
• bring commercial expertise to government for more efficient, effective and productive use of government property;
• provide innovative and flexible property solutions to support departments in business change and workforce transformation;
• improve working environments, supporting new ways of working, driving productivity and engagement; and
• create a centre of expertise for property in government.
The GPA will transform the way property is managed in the Civil Estate. It will do so through a number of programmes including the Government Hubs programme and programmes promoting Smarter Working.
The savings and more broadly, improved service delivery to departments, will be delivered through new ways of working which include:
• partnering with departments as property professionals and trusted advisors to bring innovation and solutions that position real estate as an enabler of business delivery;
• taking a strategic portfolio approach to the non-specialist assets that are transferred to the agency from departments, through maximising utilisation and reducing costs, developing and delivering place-based strategies;
• deploying commercial property expertise in supplier negotiations to enhance value for Government and the taxpayer;
• delivering an effective fully integrated corporate real estate service, including estates and facilities management;
• developing and sharing specialist asset management and commercial advisory services with departments;
• improving the quality and transparency of data on the asset portfolio managed by GPA to better inform asset management and commercial decision-making; and
• administration of the National Property Controls, providing the professional advice to support Cabinet Office Ministers in their decision-making.
44 The State of the Estate in 2016–17
One Public Estate (OPE)OPE has established itself as a national programme, supporting over 90% of English councils and working with 13 major government departments. But there is an opportunity to go further – to embed a collaborative way of working that creates the long-term conditions between partners to deliver the best outcomes for the public sector, the taxpayer and local communities.
OPE is looking to encourage a more sustainable funding model, with OPE partnerships at the centre of this. OPE will gradually encourage the transfer of responsibility for funding to local partners. Recyclable grant funding will be part of this picture and we will work with the private sector to seek investment opportunities, bringing capital funding and expertise to local OPE programmes.
OPE will also look to increase co-location opportunities across the public sector, and to think more ambitiously about service integration to support better citizen interactions with government. The more joined-up we can be, the more we can get from our assets.
Digital National Asset Register (DNAR)There are over 200,000 land and property records with GPU. These have allowed the government to monitor performance and facilitate strategic asset management across the public estate.
It is anticipated that strategic estates data (land and property) for all government and public sector bodies in the UK will be available to the Unit. This will be enabled by a central DNAR.
The development of DNAR will be guided by the 2018 Government Estate Strategy that is due to be published this year.
Places for GrowthOne way in which economic growth across the UK could be more balanced in different regions is by creating or strengthening government institutions that are or could be based there. This catalyst for investment can help revive underperforming areas and drive productivity in areas with lower wage costs, cheaper property and less congested infrastructure.
Therefore – as part of the Government’s Industrial Strategy – the plan is to move public sector jobs out of London and the surrounding area to specialist clusters across the whole of the UK as part of the Places for Growth programme. These moves will be based on robust analysis, aligned with the strategic plans of departments and their Arm’s Length Body families, and will accord with the expertise and needs of destination locations.

Chapter 5: Forward look 45

46 The State of the Estate in 2016–17
Appendices

Appendices 47
Appendix AClimate Change Act 2008 (extract)
Section 86 Report on the civil estate1. It is the duty of the Minister for the Cabinet Office
to lay before Parliament in respect of each year, beginning with the year 2008, a report containing an assessment of the progress made in the year towards improving the efficiency and contribution to sustainability of buildings that are part of the civil estate.
2. The report must, in particular, include an assessment of the progress made in the year to which it relates towards:
a. reducing the size of the civil estate, and
b. ensuring that buildings that become part of the civil estate fall within the top quartile of energy performance.
3. If a building that does not fall within the top quartile of energy performance becomes part of the civil estate in the year to which the report relates, the report must state the reasons why the building has nevertheless become part of the civil estate.
4. A report under this section must be laid before Parliament not later than 1st June in the year following the year to which it relates.
5. In this section ‘building’ means a building that uses energy for heating or cooling the whole or any part of its interior.
6. For the purposes of this section, a building is part of the civil estate if it is:
a. used for the purposes of central government administration, and
b. of a description of buildings for which, at the passing of this Act, the Minister for the Cabinet Office has responsibilities in relation to efficiency and sustainability.
7. The Minister for the Cabinet Office may by order provide for buildings of a specified description to be treated as being, or as not being, part of the civil estate for the purposes of this section.
Any such order is subject to affirmative resolution procedure.

48 The State of the Estate in 2016–17
Appendix BSize of the Central Estate in 2016–17
Department/organisation at 01/04/2016
NIA (sq.m) at 31/03/2016
NIA (sq.m) at 31/03/2017
Change (sq.m)
Change (%)
Department/organisation at 31/03/2017
Attorney General’s Office (AGO)
AGO – Attorney General's Office
1,157 1,157 0 0.0% AGO – Attorney General's Office
CPS – CPS (All Property Centres)
64,425 61,087 -3,338 -5.2% CPS – CPS (All Property Centres)
SFO – Serious Fraud Office 3,790 3,790 0 0.0% SFO – Serious Fraud Office
Cabinet Office
CO – Crown Commercial Service
2,964 2,743 -221 -7.5% CO – Crown Commercial Service
CO – Financial and Estate Management
60,926 32,902 -28,024 -46.0% CO – Financial and Estate Management
CO – Residual Estate 18,481 45,450 26,969 145.9% CO – Residual Estate
Department for Business, Energy & Industrial Strategy
CMA – Competition and Markets Authority
8,258 8,258 0 0.0% CMA – Competition and Markets Authority
BIS – Advisory Conciliation and Arbitration Service
5,362 5,526 164 3.1% BEIS – Advisory Conciliation and Arbitration Service
BIS – Arts and Humanities Research Council
850 850 0 0.0% BEIS – Arts and Humanities Research Council
BIS – Biotechnology and Biological Sciences Research Council
266,808 197,219 -69,589 -26.1% BEIS – Biotechnology and Biological Sciences Research Council
3,565 N/A N/A BEIS – Civil Nuclear Constabulary (previously recorded under 'DECC – Civil Nuclear Constabulary')
4,379 N/A N/A BEIS – Coal Authority (previously recorded under 'DECC – Coal Authority')
BIS – Companies House 30,068 30,068 0 0.0% BEIS – Companies House
BIS – Construction Industry Training Board
59,360 N/A N/A BEIS – Construction Industry Training Board Now recorded under 'DFE -Construction Industry Training Board'
BIS – Core 94,469 86,532 -7,937 -8.4% BEIS – Core
10,578 N/A N/A BEIS – Department of Energy and Climate Change (previously recorded under 'DECC – Department of Energy and Climate Change')
BIS – Economic and Social Research Council
1,325 1,325 0 0.0% BEIS – Economic and Social Research Council
BIS – Engineering and Physical Sciences Research Council
3,633 3,633 0 0.0% BEIS – Engineering and Physical Sciences Research Council
BIS – Higher Education Funding Council for England
3,313 N/A N/A BEIS – Higher Education Funding Council for England Now recorded under 'DFE – Higher Education Funding Council for England'
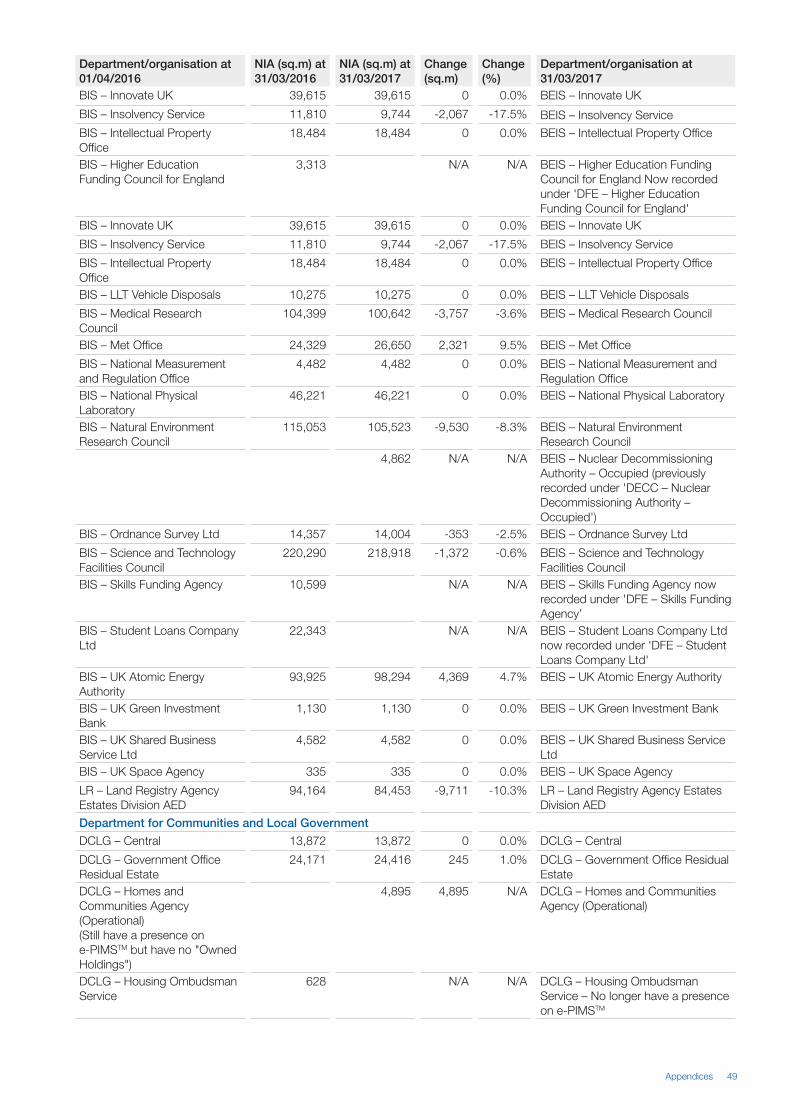
Appendices 49
Department/organisation at 01/04/2016
NIA (sq.m) at 31/03/2016
NIA (sq.m) at 31/03/2017
Change (sq.m)
Change (%)
Department/organisation at 31/03/2017
BIS – Innovate UK 39,615 39,615 0 0.0% BEIS – Innovate UK
BIS – Insolvency Service 11,810 9,744 -2,067 -17.5% BEIS – Insolvency Service
BIS – Intellectual Property Office
18,484 18,484 0 0.0% BEIS – Intellectual Property Office
BIS – Higher Education Funding Council for England
3,313 N/A N/A BEIS – Higher Education Funding Council for England Now recorded under 'DFE – Higher Education Funding Council for England'
BIS – Innovate UK 39,615 39,615 0 0.0% BEIS – Innovate UK
BIS – Insolvency Service 11,810 9,744 -2,067 -17.5% BEIS – Insolvency Service
BIS – Intellectual Property Office
18,484 18,484 0 0.0% BEIS – Intellectual Property Office
BIS – LLT Vehicle Disposals 10,275 10,275 0 0.0% BEIS – LLT Vehicle Disposals
BIS – Medical Research Council
104,399 100,642 -3,757 -3.6% BEIS – Medical Research Council
BIS – Met Office 24,329 26,650 2,321 9.5% BEIS – Met Office
BIS – National Measurement and Regulation Office
4,482 4,482 0 0.0% BEIS – National Measurement and Regulation Office
BIS – National Physical Laboratory
46,221 46,221 0 0.0% BEIS – National Physical Laboratory
BIS – Natural Environment Research Council
115,053 105,523 -9,530 -8.3% BEIS – Natural Environment Research Council
4,862 N/A N/A BEIS – Nuclear Decommissioning Authority – Occupied (previously recorded under 'DECC – Nuclear Decommissioning Authority – Occupied')
BIS – Ordnance Survey Ltd 14,357 14,004 -353 -2.5% BEIS – Ordnance Survey Ltd
BIS – Science and Technology Facilities Council
220,290 218,918 -1,372 -0.6% BEIS – Science and Technology Facilities Council
BIS – Skills Funding Agency 10,599 N/A N/A BEIS – Skills Funding Agency now recorded under 'DFE – Skills Funding Agency’
BIS – Student Loans Company Ltd
22,343 N/A N/A BEIS – Student Loans Company Ltd now recorded under 'DFE – Student Loans Company Ltd'
BIS – UK Atomic Energy Authority
93,925 98,294 4,369 4.7% BEIS – UK Atomic Energy Authority
BIS – UK Green Investment Bank
1,130 1,130 0 0.0% BEIS – UK Green Investment Bank
BIS – UK Shared Business Service Ltd
4,582 4,582 0 0.0% BEIS – UK Shared Business Service Ltd
BIS – UK Space Agency 335 335 0 0.0% BEIS – UK Space Agency
LR – Land Registry Agency Estates Division AED
94,164 84,453 -9,711 -10.3% LR – Land Registry Agency Estates Division AED
Department for Communities and Local Government
DCLG – Central 13,872 13,872 0 0.0% DCLG – Central
DCLG – Government Office Residual Estate
24,171 24,416 245 1.0% DCLG – Government Office Residual Estate
DCLG – Homes and Communities Agency (Operational) (Still have a presence on e-PIMSTM but have no "Owned Holdings")
4,895 4,895 N/A DCLG – Homes and Communities Agency (Operational)
DCLG – Housing Ombudsman Service
628 N/A N/A DCLG – Housing Ombudsman Service – No longer have a presence on e-PIMSTM

50 The State of the Estate in 2016–17
Department/organisation at 01/04/2016
NIA (sq.m) at 31/03/2016
NIA (sq.m) at 31/03/2017
Change (sq.m)
Change (%)
Department/organisation at 31/03/2017
DCLG – Local Government Ombudsman
2,371 N/A N/A DCLG – Local Government Ombudsman (Still have a presence on e-PIMSTM but have no "Owned Holdings")
DCLG – Queen Elizabeth II Conference Centre
16,560 16,560 0 0.0% DCLG – Queen Elizabeth II Conference Centre
DCLG – Valuation Tribunal Service
449 449 0 0.0% DCLG – Valuation Tribunal Service
Department for Culture, Media and Sport
DCMS – Arts Council England 7,280 7,280 0 0.0% DCMS – Arts Council England
DCMS – Big Lottery Fund 16,190 15,944 -246 -1.5% DCMS – Big Lottery Fund
DCMS – Churches Conservation Trust
197 222 25 12.7% DCMS – Churches Conservation Trust
DCMS – Department for Culture, Media and Sport
9,149 9,149 0 0.0% DCMS – Department for Culture, Media and Sport
DCMS – Gambling Commission
2,414 2,414 0 0.0% DCMS – Gambling Commission
DCMS – Historic England 15,193 17,147 1,954 12.9% DCMS – Historic England
DCMS – Information Commissioners Office
2,930 2,930 N/A N/A DCMS – Information Commissioners Office
DCMS – National Heritage Memorial Fund
3,795 3,795 0 0.0% DCMS – National Heritage Memorial Fund
DCMS – Sport England 1,346 1,319 -27 -2.0% DCMS – Sport England
DCMS – Visit Britain 536 536 0 0.0% DCMS – Visit Britain
TNA – The National Archives (Previously recorded under MOJ, ‘TNA – The National Archives’)
65,355 65,355 0 0.0% TNA – The National Archives
Department for Education
59,360 N/A N/A DFE – Construction Industry Training Board (previously recorded under 'BEIS – Construction Industry Training Board')
DFE – Equality and Human Rights Commission
1,872 1,872 0 0.0% DFE – Equality and Human Rights Commission
3,621 N/A N/A DFE – Higher Education Funding Council for England (previously recorded under 'BEIS – Higher Education Funding Council for England')
DFE – Office of Qualifications and Examinations Regulation (OFQUAL)
1,989 1,883 -106 -5.3% DFE – Office of Qualifications and Examinations Regulation (OFQUAL)
DFE – Operational Properties 58,809 57,649 -1,160 -2.0% DFE – Operational Properties
10,599 N/A N/A DFE – Skills Funding Agency (previously recorded under 'BEIS – Skills Funding Agency')
22,343 N/A N/A DFE – Student Loans Company Ltd (previously recorded under 'BEIS – Student Loans Company Ltd')
DFE – Sublet and Surplus Properties
16,232 2,709 -13,523 -83.3% DFE – Sublet and Surplus Properties
Ofsted – Office for Standards in Education
1,230 1,524 294 23.9% OFSTED – Office for Standards in Education

Appendices 51
Department/organisation at 01/04/2016
NIA (sq.m) at 31/03/2016
NIA (sq.m) at 31/03/2017
Change (sq.m)
Change (%)
Department/organisation at 31/03/2017
Department for Environment, Food and Rural Affairs
Defra – Agriculture and Horticulture Development Board
5,810 5,810 0 0.0% Defra – Agriculture and Horticulture Development Board
Defra – Consumer Council for Water
792 N/A N/A Defra – Consumer Council for Water (Still have a presence on e-PIMSTM
but have no "Owned Holdings")Defra – Department for Environment, Food and Rural Affairs
257,045 247,437 -9,608 -3.7% Defra – Department for Environment, Food and Rural Affairs
Defra – Environment Agency (All Regions incl Head Office)
138,784 137,198 -1,586 -1.1% Defra – Environment Agency (All Regions incl Head Office)
Defra – Environment Agency National Lab. Service
5,875 5,875 0 0.0% Defra – Environment Agency National Lab. Service
Defra – Joint Nature Conservation Committee
1,329 1,329 0 0.0% Defra – Joint Nature Conservation Committee
Defra – National Forest Company
372 372 0 0.0% Defra – National Forest Company
Defra – Sea Fish Industry Authority
3,652 3,652 0 0.0% Defra – Sea Fish Industry Authority
FC – Forestry Commission England
3,679 3,679 0 0.0% FC – Forestry Commission England
WSRA – Water Services Regulation Authority
2,688 1,338 -1,350 -50.2% WSRA – Water Services Regulation Authority
Department for Environment, Food and Rural Affairs
DFID – Department for International Development
19,358 19,358 0 0.0% DFID – Department for International Development
Department for Transport
DFT – British Transport Police Authority
43,601 45,917 2,316 5.3% DFT – British Transport Police Authority
DFT – DFT Central 42,145 42,145 0 0.0% DFT – DFT Central
DFT – Driver and Vehicle Licensing Agency
104,902 64,399 -40,503 -38.6% DFT – Driver and Vehicle Licensing Agency
DFT – Driver and Vehicle Standards Agency
64,578 146,777 82,199 127.3% DFT – Driver and Vehicle Standards Agency
DFT – Highways Agency (Office and Operational Estate)
202,320 216,917 14,597 7.2% DFT – Highways Agency (Office and Operational Estate)
DFT – Highways/DVSA 714 714 0 0.0% DFT – Highways/DVSA
DFT – Maritime and Coastguard Agency
48,214 48,571 357 0.7% DFT – Maritime and Coastguard Agency
DFT – Vehicle Certification Agency
2,463 2,463 0 0.0% DFT – Vehicle Certification Agency
Department for Work and Pensions
DWP – CMG 67,958 67,958 0 0.0% DWP – CMG
DWP – Corporate Centre 131,710 131,710 0 0.0% DWP – Corporate Centre
DWP – Health and Safety Executive
65,964 65,499 -464 -0.7% DWP – Health and Safety Executive
DWP – Operations 1,293,912 1,293,071 -841 -0.1% DWP – Operations
DWP – Pensions Regulator 3,366 3,366 0 0.0% DWP – Pensions Regulator
DWP – Residual Rent Service Estate
275 0 -275 -100.0% DWP – Residual Rent Service Estate (now closed)

52 The State of the Estate in 2016–17
Department/organisation at 01/04/2016
NIA (sq.m) at 31/03/2016
NIA (sq.m) at 31/03/2017
Change (sq.m)
Change (%)
Department/organisation at 31/03/2017
Department of Energy and Climate Change
DECC – Civil Nuclear Constabulary
3,565 N/A N/A DECC – Civil Nuclear Constabulary Now recorded under 'BEIS – Civil Nuclear Constabulary'
DECC – Coal Authority 4,379 N/A N/A DECC – Coal Authority Now recorded under 'BEIS – Coal Authority'
DECC – Department of Energy and Climate Change
11,656 N/A N/A DECC – Department of Energy and Climate Change Now recorded under 'BEIS – Department of Energy and Climate Change'
DECC – Nuclear Decommissioning Authority – Occupied
4,862 N/A N/A DECC – Nuclear Decommissioning Authority – Occupied Now recorded under 'BEIS – Nuclear Decommissioning Authority – Occupied'
Department of Health
DH – Care Quality Commission 4,924 2,498 -2,426 -49.3% DH – Care Quality Commission
DH – Health Education England 14,596 18,938 4,341 29.7% DH – Health Education England
DH – Health Research Authority 1,260 1,260 0 0.0% DH – Health Research Authority
DH – HQ 49,073 57,960 8,888 18.1% DH – HQ
DH – Medicines, Healthcare Products and Regulatory Agency
14,757 14,180 -577 -3.9% DH – Medicines, Healthcare Products and Regulatory Agency
DH – National Institute for Health and Care Excellence
4,365 4,365 0 0.0% DH – National Institute for Health and Care Excellence
DH – NHS Blood and Transplant
122,647 122,711 64 0.1% DH – NHS Blood and Transplant
DH – NHS Business Services Authority
33,927 32,170 -1,757 -5.2% DH – NHS Business Services Authority
DH – Health and Social Care Information Centre
15,404 15,448 44 0.3% DH – NHS Digital (formerly DH – Health and Social Care Information Centre)
DH – NHS England 23,889 35,213 11,324 47.4% DH – NHS England
DH – NHS Trust and Development Authority
1,097 1,115 18 1.6% DH – NHS Improvement (formerly DH – NHS Trust and Development Authority and DH – Monitor)
DH – Other (Still have a presence on e-PIMSTM but have no "Owned Holdings")
N/A N/A DH – OTHER – No longer have a presence on e-PIMSTM
DH – Public Health England 80,947 78,691 -2,257 -2.8% DH – Public Health England
DH – Retained Estate 12,545 7,578 -4,967 -39.6% DH – Retained Estate
Food Standards Agency
FSA – Food Standards Agency 13,306 12,906 -400 -3.0% FSA – Food Standards Agency
Foreign & Commonwealth Office
FCO – British Council 12,388 12,388 0 0.0% FCO – British Council
FCO – Foreign & Commonwealth Office
75,801 72,855 -2,946 -3.9% FCO – Foreign & Commonwealth Office
FCO – Great Britain-China Centre (GBCC)
73 63 -10 -13.1% FCO – Great Britain-China Centre (GBCC)
FCO – Westminster Foundation for Democracy (WFD)
186 186 0 0.0% FCO – Westminster Foundation for Democracy (WFD)
FCO – Wilton Park 2,326 2,326 0 0.0% FCO – Wilton Park
Government Actuary's Department
GAD – Government Actuary's Department
2,874 2,874 0 0.0% GAD – Government Actuary's Department

Appendices 53
Department/organisation at 01/04/2016
NIA (sq.m) at 31/03/2016
NIA (sq.m) at 31/03/2017
Change (sq.m)
Change (%)
Department/organisation at 31/03/2017
Government Legal Department
GLD – Government Legal Department (previously recorded under Attorney General's Office (AGO), 'AGO – Treasury Solicitor')
11,118 11,118 N/A N/A GLD – Government Legal Department
HM Revenue and Customs
HMRC – HM Revenue and Customs
964,677 959,784 -4,893 -0.5% HMRC – HM Revenue and Customs
HMRC – Valuation Office Agency
22,690 21,387 -1,303 -5.7% HMRC – Valuation Office Agency
HM Treasury
HMT – HM Treasury 22,861 22,861 0 0.0% HMT – HM Treasury
HMT – UK Debt Management Office
1,679 1,679 0 0.0% HMT – UK Debt Management Office
Home Office
HOPG – Core Home Office 363,404 362,782 -623 -0.2% HOPG – Core Home Office
HO – College of Policing 30,137 30,137 0 0.0% HO – College of Policing
HOPG – Disclosure and Barring Service
6,393 6,393 0 0.0% HOPG – Disclosure and Barring Service
HOPG – Independent Police Complaints Commission
6,688 6,688 0 0.0% HOPG – Independent Police Complaints Commission
HOPG – Security Industry Authority
1,096 1,096 0 0.0% HOPG – Security Industry Authority
Ministry of Defence
MOD – Ministry of Defence 269,702 267,601 -2,100 -0.8% MOD – Ministry of Defence
MOD – United Kingdom Hydrographic Office
35,000 30,609 -4,391 -12.5% MOD – United Kingdom Hydrographic Office
Ministry of Justice
MOJ – Children & Family Court Advisory & Support Service
9,830 7,867 -1,963 -20.0% MOJ – Children & Family Court Advisory & Support Service
MOJ – Criminal Injuries Compensation Authority
2,813 2,813 0 0.0% MOJ – Criminal Injuries Compensation Authority
MOJ – HMCTS (All Property Centres)
1,128,055 1,086,100 -41,955 -3.7% MOJ – HMCTS (All Property Centres)
MOJ – Legal Aid Agency (formerly MOJ – Legal Services Commission)
13,706 12,516 -1,190 -8.7% MOJ – Legal Aid Agency
11,442 N/A N/A MOJ – Lodgings (property centre set up in Feb 2017, holdings formerly in various MOJ property centres)
MOJ – Ministry of Justice HQ 42,627 42,139 -488 -1.1% MOJ – Ministry of Justice HQ
MOJ – NOMS HQ 1,860 1,860 0 0.0% MOJ – NOMS HQ
MOJ – NOMS Probation (formerly MOJ – NOMS (Non Custodial Property))
210,580 195,089 -15,491 -7.4% MOJ – NOMS Probation
National Crime Agency
NCA – National Crime Agency (NCA)
3,746 5,464 1,718 45.9% NCA – National Crime Agency (NCA)
National Savings and Investments
NS&I – National Savings and Investments (still have a presence on e-PIMS but now have no "Owned Holdings")
0 8,083 8,083 N/A NS&I – National Savings and Investments

54 The State of the Estate in 2016–17
Department/organisation at 01/04/2016
NIA (sq.m) at 31/03/2016
NIA (sq.m) at 31/03/2017
Change (sq.m)
Change (%)
Department/organisation at 31/03/2017
Office of Gas and Electricity Markets
Ofgem – Office of Gas and Electricity Markets
12,643 12,643 0 0.0% OFGEM – Office of Gas and Electricity Markets
Office of Rail and Road
ORR – Office of Rail and Road (Formerly ORR – Office of Rail Regulation HQ)
2,907 2,907 0 0.0% ORR – Office of Rail and Road
Royal Mint
RM – Royal Mint 32,091 32,091 0 0.0% RM – Royal Mint
Scotland Office
SO – Scotland Office 2,613 2,613 0 0.0% SO – Scotland Office
UK Statistics Authority
ONS – Office for National Statistics
60,340 60,202 -137 -0.2% ONS – Office for National Statistics
Wales Office
WO – Wales Office 1,141 1,141 0 0.0% WO – Wales Office

Appendices 55
Appendix CMachinery of Government changes in 2016–17
Organisation Details of change
BEIS - Committee on Climate Change Formerly DECC – Committee on Climate Change
BEIS - Department for Business, Energy and Industrial Strategy
Formerly Department for Business, Innovation and Skills. Includes property centre DECC
BEIS - Civil Nuclear Constabulary Formerly DECC – Civil Nuclear Constabulary
BEIS - Coal Authority Formerly DECC – Coal Authority
BEIS - Department of Energy and Climate Change Formerly DECC – Department of Energy and Climate Change
BEIS – Direct Rail Services Ltd BEIS – Nuclear Decommissioning Authority – Occupied
Formerly DECC – Direct Rail Services Ltd Formerly DECC – Nuclear Decommissioning Authority – Occupied
BIS – UK Commission for Employment and Skills Closed March 2017
DFE – Construction Industry Training Board DFE – Higher Education Funding Council for England
Formerly BIS – Construction Industry Training Board Formerly BIS – Higher Education Funding Council for England
DFE – Skills Funding Agency Formerly BIS – Skills Funding Agency
DFE – Student Loans Company Ltd DH – NHS Digital
Formerly BIS – Student Loans Company Ltd Formerly DH – Health & Social Care Information Centre
DH – NHS Improvement Formerly DH – NHS Trust Development Authority and DH – Monitor
HOPG – Forensic Archive Ltd Formerly HOPG – Forensic Science Service

56 The State of the Estate in 2016–17
Appendix DTotal running costs of the Central Estate in 2016–17
Reported costs are for the Central Estate and exclude depreciation
Organisation 2016–17 Costs (excluding cost of capital charge and depreciation)
Business, Energy & Industrial Strategy £183,822,878
Cabinet Office £30,151,674
Charity Commission £972,708
Communities and Local Government £17,216,985
Competitions and Markets Authority £7,240,841
Culture, Media and Sport £36,035,000
Defence* £152,234,119
Education £28,443,610
Environment, Food and Rural Affairs £101,456,311
Export Credits Guarantee Department £2,473,908
Food Standards Agency £5,712,282
Foreign and Commonwealth Office £35,632,584
Government Actuary’s Department £1,690,355
Health £166,411,361
HM Revenue and Customs £238,930,281
HM Treasury Group £15,204,312
Home Office £190,489,023
International Development £6,560,287
Justice £506,905,380
Law Officers’ Departments £44,236,949
National Savings and Investment £5,019,710
Northern Ireland Office £800,538
Office of Gas and Electricity Markets £8,686,712
Office of Rail Road £1,657,745
Royal Mint £5,847,787
Scotland Office £1,112,353
Transport £139,858,283
UK Statistics Authority £7,813,061
Wales Office £348,759
Work and Pensions £630,470,888
Total reported operating costs (£) £2,573,436,684
*Estimate based on the actual cost of the benchmarked estate
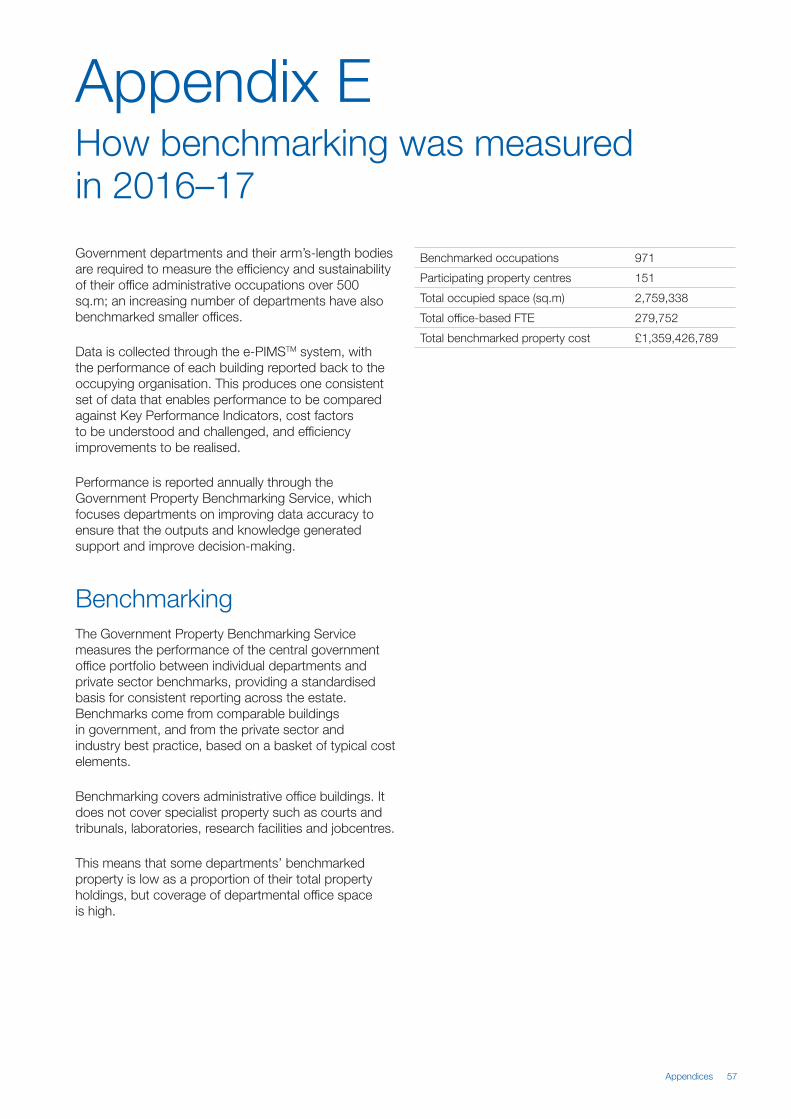
Appendices 57
Appendix EHow benchmarking was measured in 2016–17
Government departments and their arm’s-length bodies are required to measure the efficiency and sustainability of their office administrative occupations over 500 sq.m; an increasing number of departments have also benchmarked smaller offices.
Data is collected through the e-PIMSTM system, with the performance of each building reported back to the occupying organisation. This produces one consistent set of data that enables performance to be compared against Key Performance Indicators, cost factors to be understood and challenged, and efficiency improvements to be realised.
Performance is reported annually through the Government Property Benchmarking Service, which focuses departments on improving data accuracy to ensure that the outputs and knowledge generated support and improve decision-making.
BenchmarkingThe Government Property Benchmarking Service measures the performance of the central government office portfolio between individual departments and private sector benchmarks, providing a standardised basis for consistent reporting across the estate. Benchmarks come from comparable buildings in government, and from the private sector and industry best practice, based on a basket of typical cost elements.
Benchmarking covers administrative office buildings. It does not cover specialist property such as courts and tribunals, laboratories, research facilities and jobcentres.
This means that some departments’ benchmarked property is low as a proportion of their total property holdings, but coverage of departmental office space is high.
Benchmarked occupations 971
Participating property centres 151
Total occupied space (sq.m) 2,759,338
Total office-based FTE 279,752
Total benchmarked property cost £1,359,426,789

58 The State of the Estate in 2016–17
Appendix FBenchmarked offices: efficiency data in 2016–17 (summary)
Organisation Occ
upat
ion
coun
t
Occ
upie
d u
sab
le
NIA
(sq
.m)
Tota
l off
ice-
bas
ed
FT
E s
taff
and
co
ntra
cto
rs
Sq
.m p
er F
TE
Ran
k sq
.m p
er F
TE
AGO 33 63,905 7,189 8.9 10
BEIS 55 172,057 17,474 9.8 20
CHAR 2 1,429 252 5.7 1
CO 7 27,377 2,910 9.4 16
DCLG 21 21,944 2,275 9.6 17
DCMS 35 39,115 4,202 9.3 13
Defra 138 144,378 14,871 9.7 18
DFE 35 73,745 10,189 7.2 3
DFID 4 16,685 1,866 8.9 11
DFT* 53 224,433 25,262 8.9 9
DH 142 186,389 21,856 8.5 6
DWP 128 558,155 45,503 12.3 27
ECGD 1 1,798 288 6.2 2
FC 2 2,463 237 10.4 23
FCO 9 37,095 4,596 8.1 4
FSA 4 4,372 502 8.7 8
GAD 1 1,624 165 9.8 19
HMRC 144 606,964 60,157 10.1 21
HMT 12 14,106 1,715 8.2 5
HO 59 209,454 22,501 9.3 15
MOD 13 196,313 19,308 10.2 22
MOJ 60 95,964 11,129 8.6 7
NIO 1 493 45 11.0 24
NS&I 3 10,138 915 11.1 25
Ofgem 2 9,485 1,019 9.3 14
ONS 2 34,922 2,942 11.9 26
ORR 1 2,212 241 9.2 12
SO 2 1,180 89 13.2 28
WO 2 1,141 53 21.5 29
Grand Total 971 2,759,338 279,752 9.9
* Department for Transport benchmarked estate included properties acquired for operational transport purposes
Appendices 59
Tota
l pro
per
ty c
ost
Tota
l pro
per
ty c
ost
p
er F
TE
Ran
k to
tal p
rop
erty
co
st p
er F
TE
Tota
l pro
per
ty c
ost
p
er s
q.m
Ran
k to
tal p
rop
erty
co
st p
er s
q.m
Sq
.m p
er
wo
rkst
atio
n
Num
ber
of
wo
rkst
atio
ns
£36,722,956 £5,109 12 £575 11 9.9 6,464
£100,361,832 £5,743 13 £583 12 9.6 17,838
£838,156 £3,326 4 £587 13 7.9 180
£25,996,655 £8,934 23 £950 23 12.0 2,276
£23,898,224 £10,504 25 £1,089 26 9.3 2,370
£26,151,226 £6,223 16 £669 14 9.5 4,123
£49,335,524 £3,317 3 £342 3 9.6 14,988
£41,995,143 £4,122 7 £569 10 8.2 9,010
£14,406,452 £7,720 20 £863 21 10.7 1,566
£87,320,984 £3,457 5 £389 5 10.1 22,174
£103,592,740 £4,740 10 £556 9 8.6 21,786
£213,315,647 £4,688 9 £382 4 9.2 60,715
£2,473,908 £8,590 22 £1,376 27 7.0 257
£743,838 £3,144 2 £302 2 11.5 215
£26,579,615 £5,784 14 £717 16 10.1 3,666
£6,293,948 £12,538 26 £1,440 28 8.9 491
£1,713,401 £10,384 24 £1,055 25 9.8 165
£243,341,348 £4,045 6 £401 6 9.0 67,149
£10,996,582 £6,412 17 £780 19 9.0 1,574
£108,239,408 £4,811 11 £517 8 10.2 20,598
£144,993,950 £7,509 19 £739 18 12.7 15,505
£67,043,555 £6,024 15 £699 15 9.3 10,307
£800,539 £17,790 28 £1,624 29 7.1 69
£4,288,864 £4,687 8 £423 7 11.0 920
£8,017,197 £7,868 21 £845 20 9.6 984
£6,102,191 £2,074 1 £175 1 9.8 3,556
£1,593,352 £6,611 18 £720 17 9.5 232
£1,204,325 £13,494 27 £1,020 24 9.4 125
£1,065,231 £20,099 29 £934 22 21.5 53
£1,359,426,789 £4,859 £493 9.5 289,356

60 The State of the Estate in 2016–17
Appendix GBenchmarked offices: efficiency data in 2016–17 (departmental breakdown)
Organisation Occ
upat
ion
coun
t
Occ
upie
d u
sab
le N
IA (s
q.m
)
Tota
l off
ice-
bas
ed F
TE
sta
ff
and
co
ntra
cto
rs
Tota
l pro
per
ty c
ost
Sq
.m p
er F
TE
Tota
l pro
per
ty c
ost
per
FT
E
Tota
l pro
per
ty c
ost
per
sq
.m
Sq
.m p
er w
ork
stat
ion
Num
ber
of
wo
rkst
atio
ns
AGO – Attorney General’s Office
AGO – Attorney General's Office
1 723 63 £1,107,087 11.5 £17,573 £1,531 10.3 70
CPS – East Midlands 4 4,074 372 £1,227,891 11.0 £3,301 £301 10.2 400
CPS – East of England 2 3,251 266 £1,728,742 12.2 £6,496 £532 14.0 232
CPS – Headquarters 3 12,053 1,543 £8,986,331 7.8 £5,823 £746 9.2 1,303
CPS – London 1 1,031 202 £453,678 5.1 £2,246 £440 5.1 203
CPS – Merseyside & Cheshire
1 2,530 256 £1,982,073 9.9 £7,742 £783 11.0 230
CPS – North East 2 3,690 284 £1,533,624 13.0 £5,404 £416 16.3 226
CPS – North West 2 4,139 453 £1,979,317 9.1 £4,368 £478 9.6 430
CPS – South East 3 2,796 211 £1,212,539 13.3 £5,756 £434 8.5 329
CPS – South West 1 997 112 £575,560 8.9 £5,153 £577 8.2 122
CPS – Thames & Chiltern 2 2,503 272 £917,304 9.2 £3,372 £367 7.6 328
CPS – Wales 2 2,207 194 £762,481 11.4 £3,934 £345 8.7 255
CPS – Wessex 3 2,486 200 £999,303 12.4 £4,992 £402 12.7 195
CPS – West Midlands 1 2,838 457 £2,491,236 6.2 £5,457 £878 6.9 410
CPS – Yorkshire & Humberside
3 6,284 633 £1,725,357 9.9 £2,728 £275 13.7 458
GLD – Government Legal Department
1 8,514 1,067 £5,371,262 8.0 £5,034 £631 10.3 830
SFO – Serious Fraud Office 1 3,790 605 £3,669,171 6.3 £6,065 £968 8.6 443
AGO Total 33 63,905 7,189 £36,722,956 8.9 £5,109 £575 9.9 6,464
BEIS – Business, Energy & Industrial Strategy
BEIS – Advisory Conciliation and Arbitration Service
4 4,131 436 £3,461,999 9.5 £7,940 £838 11.6 357
BEIS – Arts & Humanities Research Council
1 643 54 £71,070 11.9 £1,310 £111 9.5 68
BEIS – Biotechnology & Biological Sciences Research Council
1 1,730 194 £202,290 8.9 £1,041 £117 9.3 186
BEIS – British Business Bank 2 1,145 166 £585,991 6.9 £3,530 £512 6.9 165

Appendices 61
Organisation Occ
upat
ion
coun
t
Occ
upie
d u
sab
le N
IA (s
q.m
)
Tota
l off
ice-
bas
ed F
TE
sta
ff
and
co
ntra
cto
rs
Tota
l pro
per
ty c
ost
Sq
.m p
er F
TE
Tota
l pro
per
ty c
ost
per
FT
E
Tota
l pro
per
ty c
ost
per
sq
.m
Sq
.m p
er w
ork
stat
ion
Num
ber
of
wo
rkst
atio
ns
BEIS – Civil Nuclear Constabulary
1 1,454 204 £553,776 7.1 £2,721 £381 9.0 162
BEIS – Coal Authority 1 1,870 191 £293,702 9.8 £1,538 £157 10.9 172
BEIS – Companies House 2 12,672 870 £8,244,903 14.6 £9,477 £651 14.5 873
BEIS – Competition Appeals Tribunal
1 1,574 44 £1,816,464 35.8 £41,283 £1,154 54.3 29
BEIS – Core 6 34,572 3,250 £29,924,221 10.6 £9,207 £866 10.4 3,338
BEIS – Economic and Social Research Council
1 1,051 146 £110,664 7.2 £756 £105 7.2 145
BEIS – Engineering & Physical Sciences Research Council
1 1,728 184 £393,116 9.4 £2,133 £228 8.5 203
BEIS – Innovate UK 1 1,215 285 £451,066 4.3 £1,583 £371 8.2 149
BEIS – Insolvency Service 7 10,081 1,317 £7,410,401 7.7 £5,627 £735 8.7 1,154
BEIS – Intellectual Property Office
2 12,830 1,129 £8,098,807 11.4 £7,170 £631 11.1 1,154
BEIS – Medical Research Council
2 2,381 245 £778,796 9.7 £3,175 £327 8.5 280
BEIS – Met Office 1 12,461 1,698 £7,860,958 7.3 £4,631 £631 7.6 1,630
BEIS – Natural Environment Research Council
1 1,314 176 £527,170 7.4 £2,988 £401 6.3 210
BEIS – Nuclear Decommissioning Authority – Occupied
2 4,117 216 £924,984 19.1 £4,282 £225 13.8 299
BEIS – Ordnance Survey Ltd 1 11,819 920 £4,522,077 12.8 £4,915 £383 9.8 1,206
BEIS – Science & Technology Facilities Council
1 925 102 £98,045 9.1 £963 £106 8.2 113
BEIS – UK Shared Business Service Ltd
1 1,267 98 £105,507 12.9 £1,077 £83 12.9 98
CMA – Competition and Markets Authority
1 5,064 641 £11,654,997 7.9 £18,183 £2,302 9.9 513
LR – Land Registry Agency Estates Division AED
14 46,014 4,907 £12,270,828 9.4 £2,501 £267 8.6 5,334
BEIS Total 55 172,057 17,474 £100,361,832 9.8 £5,743 £583 9.6 17,838
CHAR – Charity Commission
CHAR – Charity Commission 2 1,429 252 £838,156 5.7 £3,326 £587 7.9 180
CHAR Total 2 1,429 252 £838,156 5.7 £3,326 £587 7.9 180
CO – Cabinet Office
CO – Crown Commercial Service
2 3,950 371 £584,065 10.6 £1,574 £148 11.7 339
CO – Financial and Estate Management
5 23,427 2,539 £25,412,590 9.2 £10,009 £1,085 12.1 1,937
CO Total 7 27,377 2,910 £25,996,655 9.4 £8,934 £950 12.0 2,276
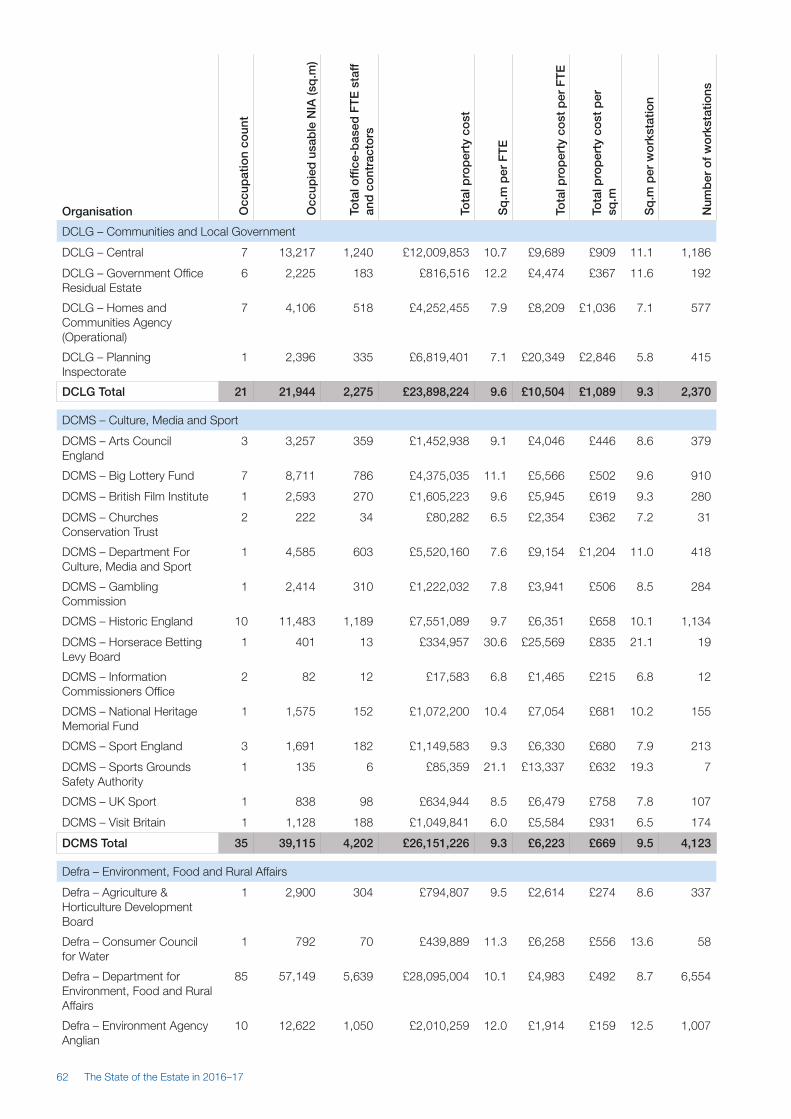
62 The State of the Estate in 2016–17
Organisation Occ
upat
ion
coun
t
Occ
upie
d u
sab
le N
IA (s
q.m
)
Tota
l off
ice-
bas
ed F
TE
sta
ff
and
co
ntra
cto
rs
Tota
l pro
per
ty c
ost
Sq
.m p
er F
TE
Tota
l pro
per
ty c
ost
per
FT
E
Tota
l pro
per
ty c
ost
per
sq
.m
Sq
.m p
er w
ork
stat
ion
Num
ber
of
wo
rkst
atio
ns
DCLG – Communities and Local Government
DCLG – Central 7 13,217 1,240 £12,009,853 10.7 £9,689 £909 11.1 1,186
DCLG – Government Office Residual Estate
6 2,225 183 £816,516 12.2 £4,474 £367 11.6 192
DCLG – Homes and Communities Agency (Operational)
7 4,106 518 £4,252,455 7.9 £8,209 £1,036 7.1 577
DCLG – Planning Inspectorate
1 2,396 335 £6,819,401 7.1 £20,349 £2,846 5.8 415
DCLG Total 21 21,944 2,275 £23,898,224 9.6 £10,504 £1,089 9.3 2,370
DCMS – Culture, Media and Sport
DCMS – Arts Council England
3 3,257 359 £1,452,938 9.1 £4,046 £446 8.6 379
DCMS – Big Lottery Fund 7 8,711 786 £4,375,035 11.1 £5,566 £502 9.6 910
DCMS – British Film Institute 1 2,593 270 £1,605,223 9.6 £5,945 £619 9.3 280
DCMS – Churches Conservation Trust
2 222 34 £80,282 6.5 £2,354 £362 7.2 31
DCMS – Department For Culture, Media and Sport
1 4,585 603 £5,520,160 7.6 £9,154 £1,204 11.0 418
DCMS – Gambling Commission
1 2,414 310 £1,222,032 7.8 £3,941 £506 8.5 284
DCMS – Historic England 10 11,483 1,189 £7,551,089 9.7 £6,351 £658 10.1 1,134
DCMS – Horserace Betting Levy Board
1 401 13 £334,957 30.6 £25,569 £835 21.1 19
DCMS – Information Commissioners Office
2 82 12 £17,583 6.8 £1,465 £215 6.8 12
DCMS – National Heritage Memorial Fund
1 1,575 152 £1,072,200 10.4 £7,054 £681 10.2 155
DCMS – Sport England 3 1,691 182 £1,149,583 9.3 £6,330 £680 7.9 213
DCMS – Sports Grounds Safety Authority
1 135 6 £85,359 21.1 £13,337 £632 19.3 7
DCMS – UK Sport 1 838 98 £634,944 8.5 £6,479 £758 7.8 107
DCMS – Visit Britain 1 1,128 188 £1,049,841 6.0 £5,584 £931 6.5 174
DCMS Total 35 39,115 4,202 £26,151,226 9.3 £6,223 £669 9.5 4,123
Defra – Environment, Food and Rural Affairs
Defra – Agriculture & Horticulture Development Board
1 2,900 304 £794,807 9.5 £2,614 £274 8.6 337
Defra – Consumer Council for Water
1 792 70 £439,889 11.3 £6,258 £556 13.6 58
Defra – Department for Environment, Food and Rural Affairs
85 57,149 5,639 £28,095,004 10.1 £4,983 £492 8.7 6,554
Defra – Environment Agency Anglian
10 12,622 1,050 £2,010,259 12.0 £1,914 £159 12.5 1,007

Appendices 63
Organisation Occ
upat
ion
coun
t
Occ
upie
d u
sab
le N
IA (s
q.m
)
Tota
l off
ice-
bas
ed F
TE
sta
ff
and
co
ntra
cto
rs
Tota
l pro
per
ty c
ost
Sq
.m p
er F
TE
Tota
l pro
per
ty c
ost
per
FT
E
Tota
l pro
per
ty c
ost
per
sq
.m
Sq
.m p
er w
ork
stat
ion
Num
ber
of
wo
rkst
atio
ns
Defra – Environment Agency Head Office
2 6,260 1,081 £3,213,868 5.8 £2,974 £513 6.1 1,023
Defra – Environment Agency Midlands
7 12,124 1,272 £2,694,996 9.5 £2,118 £222 10.5 1,154
Defra – Environment Agency North East
5 12,049 1,390 £3,266,746 8.7 £2,350 £271 10.1 1,193
Defra – Environment Agency North West
3 8,580 1,213 £1,597,822 7.1 £1,317 £186 8.5 1,009
Defra – Environment Agency South West
5 10,905 969 £1,805,622 11.3 £1,864 £166 12.7 857
Defra – Environment Agency Southern
9 10,132 842 £1,935,698 12.0 £2,298 £191 12.1 837
Defra – Environment Agency Thames
4 6,544 649 £1,616,994 10.1 £2,493 £247 10.4 631
Defra – Joint Nature Conservation Committee
1 1,329 122 £291,188 10.9 £2,387 £219 12.8 104
Defra – Sea Fish Industry Authority
3 1,834 69 £760,889 26.6 £11,027 £415 22.4 82
WSRA – Water Services Regulation Authority
2 1,159 201 £811,742 5.8 £4,039 £700 8.2 142
Defra Total 138 144,378 14,871 £49,335,524 9.7 £3,317 £342 9.6 14,988
DFE – Education
DFE – Education Funding Agency
1 259 35 £521,212 7.3 £14,724 £2,012 12.3 21
DFE – Equality and Human Rights Commission
7 2,217 180 £1,390,573 12.3 £7,736 £627 10.0 221
DFE – Higher Education Funding Council for England
3 3,436 391 £1,388,776 8.8 £3,552 £404 9.1 379
DFE – Operational Properties 10 32,745 4,609 £20,522,782 7.1 £4,453 £627 8.4 3,902
DFE – Skills Funding Agency 7 9,044 915 £6,114,558 9.9 £6,683 £676 9.2 984
DFE – Student Loans Company Ltd
3 19,969 3,131 £7,394,439 6.4 £2,362 £370 7.2 2,771
Ofsted – Office for Standards in Education
4 6,075 928 £4,662,802 6.5 £5,025 £768 8.3 732
DFE Total 35 73,745 10,189 £41,995,143 7.2 £4,122 £569 8.2 9,010
DFID – International Development
DFID – Department for International Development
4 16,685 1,866 £14,406,452 8.9 £7,720 £863 10.7 1,566
Grand Total 4 16,685 1,866 £14,406,452 8.9 £7,720 £863 10.7 1,566

64 The State of the Estate in 2016–17
Organisation Occ
upat
ion
coun
t
Occ
upie
d u
sab
le N
IA (s
q.m
)
Tota
l off
ice-
bas
ed F
TE
sta
ff
and
co
ntra
cto
rs
Tota
l pro
per
ty c
ost
Sq
.m p
er F
TE
Tota
l pro
per
ty c
ost
per
FT
E
Tota
l pro
per
ty c
ost
per
sq
.m
Sq
.m p
er w
ork
stat
ion
Num
ber
of
wo
rkst
atio
ns
DFT – Transport
DFT – DFT Central 2 16,319 2,391 £12,887,431 6.8 £5,390 £790 9.0 1,804
DFT – Driver & Vehicle Standards Agency
2 6,363 648 £1,311,395 9.8 £2,024 £206 6.9 920
DFT – Driver and Vehicle Licensing Agency
4 52,320 5,397 £10,688,798 9.7 £1,981 £204 10.1 5,203
DFT – Highways England (Office and Operational Estate)
17 35,640 4,153 £14,825,259 8.6 £3,570 £416 11.3 3,141
DFT – Maritime and Coastguard Agency
1 4,953 338 £1,353,416 14.7 £4,007 £273 9.9 501
DFT – Network Rail 27 108,838 12,336 £46,254,685 8.8 £3,749 £425 10.3 10,605
DFT Total 53 224,433 25,262 £87,320,984 8.9 £3,457 £389 10.1 22,174
DH – Health
DH – Care Quality Commission
5 11,778 1,103 £8,980,763 10.7 £8,142 £762 9.4 1,250
DH – Health Education England
23 19,118 1,971 £9,462,643 9.7 £4,802 £495 8.5 2,253
DH – Health Research Authority
5 1,743 193 £766,029 9.0 £3,969 £440 9.2 190
DH – HQ 7 25,240 1,785 £23,988,674 14.1 £13,439 £950 10.7 2,363
DH – Human Fertilisation & Embryology Authority
1 269 67 £330,000 4.0 £4,925 £1,227 6.6 41
DH – Human Tissue Authority
1 300 51 £475,000 5.9 £9,314 £1,583 7.1 42
DH – Medicines, Healthcare Products and Regulatory Agency
2 6,434 985 £7,135,051 6.5 £7,242 £1,109 7.6 850
DH – National Institute for Health and Care Excellence
2 4,992 579 £3,041,035 8.6 £5,249 £609 9.6 521
DH – NHS Blood & Transplant
7 3,642 262 £1,262,835 13.9 £4,825 £347 11.2 325
DH – NHS Business Services Authority
9 27,470 2,734 £6,447,612 10.0 £2,358 £235 8.4 3,257
DH – NHS Digital 13 16,192 2,457 £7,402,338 6.6 £3,013 £457 6.5 2,473
DH – NHS England 34 43,387 5,984 £19,668,745 7.3 £3,287 £453 8.6 5,018
DH – NHS Improvement 9 7,380 1,154 £3,525,066 6.4 £3,055 £478 8.2 898
DH – NHS Litigation Authority
1 1,442 224 £1,321,625 6.4 £5,900 £917 9.5 151
DH – Public Health England 23 17,002 2,307 £9,785,324 7.4 £4,242 £576 7.9 2,154
DH Total 142 186,389 21,856 £103,592,740 8.5 £4,740 £556 8.6 21,786

Appendices 65
Organisation Occ
upat
ion
coun
t
Occ
upie
d u
sab
le N
IA (s
q.m
)
Tota
l off
ice-
bas
ed F
TE
sta
ff
and
co
ntra
cto
rs
Tota
l pro
per
ty c
ost
Sq
.m p
er F
TE
Tota
l pro
per
ty c
ost
per
FT
E
Tota
l pro
per
ty c
ost
per
sq
.m
Sq
.m p
er w
ork
stat
ion
Num
ber
of
wo
rkst
atio
ns
DWP – Work and Pensions
DWP – CMG 7 54,640 3,576 £17,458,877 15.3 £4,883 £320 9.3 5,907
DWP – Corporate Centre 6 83,043 6,738 £44,905,375 12.3 £6,664 £541 9.0 9,233
DWP – Health And Safety Executive
10 21,598 1,637 £14,977,361 13.2 £9,148 £693 8.9 2,425
DWP – Operations 104 395,508 32,937 £134,423,235 12.0 £4,081 £340 9.3 42,588
DWP – Pensions Regulator 1 3,366 615 £1,550,799 5.5 £2,521 £461 6.0 562
DWP Total 128 558,155 45,503 £213,315,647 12.3 £4,688 £382 9.2 60,715
Export Credits Guarantee Department
ECGD – Export Credits Guarantee Department
1 1,798 288 £2,473,908 6.2 £8,590 £1,376 7.0 257
ECGD Total 1 1,798 288 £2,473,908 6.2 £8,590 £1,376 7.0 257
FC – Forestry Commission
FC – Forestry Commission England
2 2,463 237 £743,838 10.4 £3,144 £302 11.5 215
FC Total 2 2,463 237 £743,838 10.4 £3,144 £302 11.5 215
FCO – Foreign & Commonwealth Office
FCO – British Council 5 9,350 1,527 £5,688,870 6.1 £3,726 £608 10.8 868
FCO – Foreign & Commonwealth Office
2 27,495 3,025 £20,662,305 9.1 £6,831 £751 9.9 2,765
FCO – Great Britain-China Centre (GBCC)
1 63 12 £56,880 5.5 £4,946 £900 7.9 8
FCO – Westminster Foundation for Democracy (WFD)
1 186 32 £171,560 5.8 £5,361 £920 7.5 25
FCO Total 9 37,095 4,596 £26,579,615 8.1 £5,784 £717 10.1 3,666
FSA – Food Standards Agency
FSA – Food Standards Agency
4 4,372 502 £6,293,948 8.7 £12,538 £1,440 8.9 491
FSA Total 4 4,372 502 £6,293,948 8.7 £12,538 £1,440 8.9 491
GAD – Government Actuary’s Department
GAD – Government Actuary's Department
1 1,624 165 £1,713,401 9.8 £10,384 £1,055 9.8 165
GAD Total 1 1,624 165 £1,713,401 9.8 £10,384 £1,055 9.8 165
HMRC
HMRC – HM Revenue and Customs
103 579,767 57,627 £233,737,894 10.1 £4,056 £403 9.0 64,239
HMRC – Valuation Office Agency
41 27,198 2,530 £9,603,454 10.8 £3,797 £353 9.3 2,910
HMRC Total 144 606,964 60,157 £243,341,348 10.1 £4,045 £401 9.0 67,149

66 The State of the Estate in 2016–17
Organisation Occ
upat
ion
coun
t
Occ
upie
d u
sab
le N
IA (s
q.m
)
Tota
l off
ice-
bas
ed F
TE
sta
ff
and
co
ntra
cto
rs
Tota
l pro
per
ty c
ost
Sq
.m p
er F
TE
Tota
l pro
per
ty c
ost
per
FT
E
Tota
l pro
per
ty c
ost
per
sq
.m
Sq
.m p
er w
ork
stat
ion
Num
ber
of
wo
rkst
atio
ns
HMT – Treasury
HMT – Government Internal Audit Agency
5 723 113 £646,030 6.4 £5,717 £894 9.6 75
HMT – HM Treasury 5 11,858 1,453 £8,486,663 8.2 £5,841 £716 8.9 1,330
HMT – Office for Budget Responsibility
1 235 23 £218,585 10.2 £9,504 £930 10.2 23
HMT – UK Debt Management Office
1 1,290 126 £1,645,303 10.2 £13,058 £1,275 8.8 146
HMT Total 12 14,106 1,715 £10,996,582 8.2 £6,412 £780 9.0 1,574
HO – Home Office
HO – Core Home Office 46 192,293 20,325 £98,341,052 9.5 £4,838 £511 10.4 18,448
HO – HM Inspectorate of Constabulary
1 188 20 £77,525 9.4 £3,876 £413 9.4 20
HOPG – College of Policing 2 1,569 178 £913,936 8.8 £5,142 £583 11.0 142
HOPG – Disclosure and Barring Service
2 6,990 862 £3,101,691 8.1 £3,599 £444 8.0 876
HOPG – Independent Police Complaints Commission
6 6,758 873 £4,016,333 7.7 £4,601 £594 7.7 873
HOPG – Office of the Immigration Services Commissioner
1 561 60 £479,295 9.4 £8,019 £854 10.4 54
HOPG – Security Industry Authority
1 1,096 183 £1,309,576 6.0 £7,156 £1,195 5.9 185
HO Total 59 209,454 22,501 £108,239,408 9.3 £4,811 £517 10.2 20,598
MOD – Ministry of Defence
MOD – Ministry of Defence 13 196,313 19,308 £144,993,950 10.2 £7,509 £739 12.7 15,505
MOD Total 13 196,313 19,308 £144,993,950 10.2 £7,509 £739 12.7 15,505
MOJ – Ministry of Justice
MOJ – Children & Family Court Advisory & Support Service
26 11,959 1,320 £5,220,165 9.1 £3,955 £437 10.5 1,144
MOJ – Criminal Cases Review Commission
1 993 83 £13,831 12.0 £167 £14 9.8 101
MOJ – Criminal Injuries Compensation Authority
1 2,722 267 £956,686 10.2 £3,583 £351 8.0 342
MOJ – HMCTS (London) 2 5,530 568 £4,777,117 9.7 £8,410 £864 9.7 568
MOJ – HMCTS (Midlands) 6 12,100 1,029 £2,922,640 11.8 £2,841 £242 10.9 1,110
MOJ – HMCTS (North East) 2 1,647 121 £499,133 13.7 £4,137 £303 14.5 114
MOJ – HMCTS (North West) 3 3,344 379 £1,076,969 8.8 £2,842 £322 8.9 377
MOJ – HMCTS (South East) 4 1,867 119 £1,076,197 15.7 £9,069 £576 9.9 188
MOJ – HMCTS (South West) 2 2,604 140 £543,220 18.6 £3,884 £209 21.7 120
MOJ – HMCTS (Wales) 1 665 80 £115,479 8.3 £1,443 £174 7.4 90
MOJ – Legal Aid Agency 7 7,189 799 £4,077,418 9.0 £5,103 £567 8.6 836

Appendices 67
Organisation Occ
upat
ion
coun
t
Occ
upie
d u
sab
le N
IA (s
q.m
)
Tota
l off
ice-
bas
ed F
TE
sta
ff
and
co
ntra
cto
rs
Tota
l pro
per
ty c
ost
Sq
.m p
er F
TE
Tota
l pro
per
ty c
ost
per
FT
E
Tota
l pro
per
ty c
ost
per
sq
.m
Sq
.m p
er w
ork
stat
ion
Num
ber
of
wo
rkst
atio
ns
MOJ – Legal Services Board 1 354 37 £292,360 9.6 £7,902 £826 9.8 36
MOJ – Ministry Of Justice HQ
4 44,989 6,189 £45,472,340 7.3 £7,347 £1,011 8.5 5,281
MOJ Total 60 95,964 11,129 £67,043,555 8.6 £6,024 £699 9.3 10,307
NIO – Northern Ireland Office
NIO – Northern Ireland Office 1 493 45 £800,539 11.0 £17,790 £1,624 7.1 69
NIO Total 1 493 45 £800,539 11.0 £17,790 £1,624 7.1 69
NS&I – National Savings and Investments
NS&I – National Savings and Investments
3 10,138 915 £4,288,864 11.1 £4,687 £423 11.0 920
NS&I Total 3 10,138 915 £4,288,864 11.1 £4,687 £423 11.0 920
Ofgem – Office of Gas and Electricity Markets
Ofgem – Office of Gas and Electricity Markets
2 9,485 1,019 £8,017,197 9.3 £7,868 £845 9.6 984
Ofgem Total 2 9,485 1,019 £8,017,197 9.3 £7,868 £845 9.6 984
ONS – Office for National Statistics
ONS – Office for National Statistics
2 34,922 2,942 £6,102,191 11.9 £2,074 £175 9.8 3,556
ONS Total 2 34,922 2,942 £6,102,191 11.9 £2,074 £175 9.8 3,556
ORR – Office of Rail and Road
ORR – Office of Rail and Road
1 2,212 241 £1,593,352 9.2 £6,611 £720 9.5 232
ORR Total 1 2,212 241 £1,593,352 9.2 £6,611 £720 9.5 232
SO – Scotland Office
SO – Scotland Office 2 1,180 89 £1,204,325 13.2 £13,494 £1,020 9.4 125
SO Total 2 1,180 89 £1,204,325 13.2 £13,494 £1,020 9.4 125
WO – Wales Office
WO – Wales Office 2 1,141 53 £1,065,231 21.5 £20,099 £934 21.5 53
WO Total 2 1,141 53 £1,065,231 21.5 £20,099 £934 21.5 53
Grand total 971 2,759,338 279,752 £1,359,426,789 9.9 £4,859 £493 9.5 289,356

68 The State of the Estate in 2016–17
GlossaryOrganisationsAGO Attorney General’s Office HMRC HM Revenue and Customs
BEIS Department for Business, Energy and Industrial Strategy
HMT HM Treasury Group
CHAR Charity Commission HO Home Office
CMA Competition and Markets Authority HOPG Home Office Property General
CO Cabinet Office LGA Local Government Association
CPS Crown Prosecution Service LOD Law Officers’ Departments
DCLG Department for Communities and Local Government
MOD Ministry of Defence
DCMS Department for Culture, Media and Sport MOJ Ministry of Justice
DECC Department of Energy and Climate Change NCA National Crime Agency
Defra Department for Environment, Food and Rural Affairs
NIO Northern Ireland Office
DFE Department for Education NOMS National Offender Management Service
DFID Department for International Development NS&I National Savings and Investments
DFT Department for Transport Ofgem Office of Gas and Electricity Markets
DH Department of Health Ofsted Office for Standards in Education, Children's Services and Skills
DSA Driving Standards Agency ONS Office for National Statistics
DVLA Driver and Vehicle Licensing Agency ORR Office of Rail and Road
DWP Department for Work and Pensions RICS Royal Institution of Chartered Surveyors
ECGD Export Credit Guarantee Department RM Royal Mint
FC Forestry Commission SFO Serious Fraud Office
FCO Foreign and Commonwealth Office SO Scotland Office
FSA Food Standards Agency TNA The National Archives
GAD Government Actuary’s Department UKSA UK Statistics Authority
GPA Government Property Agency VOSA Vehicle Operator and Services Agency
GPP Government Property Profession WO Wales Office
GPU Government Property Unit WSRA Water Services Regulation Authority
HMCTS Her Majesty’s Courts and Tribunals Service

Glossary 69
Definitions£/FTE
Cost per person calculated as total operating cost divided by total FTE staff.
£/sq.m
Cost of space calculated as total operating cost divided by total usable square metres (NIA).
Central Estate
The Central Estate is made up of the ‘core’ property holdings of organisations from the Civil Estate. Formerly referred to as the mandated estate.
Civil Estate
The Civil Estate comprises the properties (buildings and land) used to deliver government activity that are owned, leased or occupied by government organisations, including ministerial and non-ministerial departments, executive agencies and executive NDPBs.
The Civil Estate does not include the operational NHS estate, the Foreign and Commonwealth Office (FCO) overseas estate, the Department for Environment, Food and Rural Affairs (DEFRA) rural estate, the Ministry of Defence (MOD) military estate or public corporations.
Climate Change Act 2008
Two key aims of the Act are to:
• improve carbon management and help the transition towards a low-carbon economy in the UK
• demonstrate strong UK leadership internationally and signal that the UK is committed to taking its share of responsibility for reducing global emissions.
You can find the Climate Change Act 2008 at www.legislation.gov.uk.
Cost efficiency
A measure of the cost of occupancy: the sum of rent (or rental equivalent for freehold buildings), rates and other charges (service charge, repair and maintenance, security, cleaning and utilities).
DEC
Display Energy Certificate. Required from October 2008 for buildings with a total useful floor area of over 1,000 sq.m that are occupied by a public authority and by institutions providing a public service to a large number of persons, and therefore visited by those persons. A DEC showing an operational rating must be displayed in a prominent place clearly visible to the public. DECs show the energy performance of a building based on actual energy consumption as recorded and reassessed annually.
EPC
Energy Performance Certificate. EPCs provide an energy rating for a building (A–G), which is based on the performance potential of the building itself (the fabric) and its services (such as heating, ventilation and lighting). They were phased in during 2008 and are now required for all buildings when they are constructed, sold or let.
e-PIMSTM
Electronic Property Information Mapping Service.
e-PIMSTM is the central database of government’s Civil Estate properties and land. It is mandatory for all government departments (including non-ministerial departments) and their executive agencies, arm’s length bodies and NDPBs to capture and maintain their property information on e-PIMSTM. It also covers property-related activities for the devolved administrations and for some parts of the public sector outside central government, as well as the collection of sustainability data.
FTE
Full-time equivalent (staff).
Holding
A ‘property holding’ refers to building(s) and/or land described in terms of legal ownership, e.g. leasehold, freehold or PFI contract. It is different from a building (the physical entity) or an occupation, and there can be many holdings to one building or many holdings to many buildings.
KPI
Key Performance Indicator.
MOTO
Memorandum of Terms of Occupation. A type of licence agreement for the sharing of accommodation between government organisations known as ‘Crown Bodies’.
NDPB
Non-departmental public body.
NIA
Net internal area. NIA is the ‘usable area within a building measured to the internal face of the perimeter walls at each floor level’ (Royal Institution of Chartered Surveyors). It includes meeting rooms, kitchens, built-in cupboards, ramps and non-shared entrance halls.
Occupation
Refers to the organisation using space within a holding.

70 The State of the Estate in 2016–17
Operational ratings
Government’s methodology for assessing the operational performance of buildings, i.e. annual emissions of CO2 per sq.m arising from energy consumption, compared with a value that would be considered typical for the particular type of building.
The operational rating is a numerical indicator of the amount of energy consumed during the occupation of the building over a period of 12 months, based on meter readings.
PFI
Private Finance Initiative.
Property
A separately identifiable unit of real estate. In this report, we use the word ‘property’ to refer to the geographical location of a site.
Sq.m
Square meters.
Sq.m/FTE
Space per person measured as total square metres NIA divided by total FTE staff.
Top quartile commitment
A commitment to procure buildings in the upper quartile of energy performance. Originally announced in the Energy Efficiency Action Plan 2004, it is now a requirement of the Climate Change Act 2008.
Total annual operating cost
The total net cost of operating the property estate reported in The State of the Estate includes annual property occupation costs, building operation costs, business support costs, property management costs, utilities and capital charges. Income from sub-letting and charges for use of facilities are subtracted from the total expenditure to give the total annual operating cost.

Cabinet Office1 Horse Guards Road London SW1A 2HQ
www.gov.uk/government/organisations/cabinet-office


![[PPT]Introduction to Corporate Finance - John Wiley & Sons · Web viewThe IRR assumes intermediate cashflows are reinvested at IRR…NPV assumes they are reinvested at WACC This difference,](https://img.pdfslide.us/doc/110x75/5aefd30e7f8b9a572b8ea789/pptintroduction-to-corporate-finance-john-wiley-sons-viewthe-irr-assumes-intermediate.jpg)