Embed Size (px)
Citation preview
The state of road safety around the world
road traffic injuries remain a global public health problemRoad traffic injuries remain an important publichealthproblematglobal,regionaland national levels. While steps are being takeninmanycountriestoimproveroadsafety,muchstillneedstobedoneiftherising trend in road traffic deaths is to be halted or reversed.
Over the past few years a range ofmethods has been used by different organizations to estimate the number of global road traffic fatalities.TheWHOGlobalBurdenofDiseaseproject(2004),
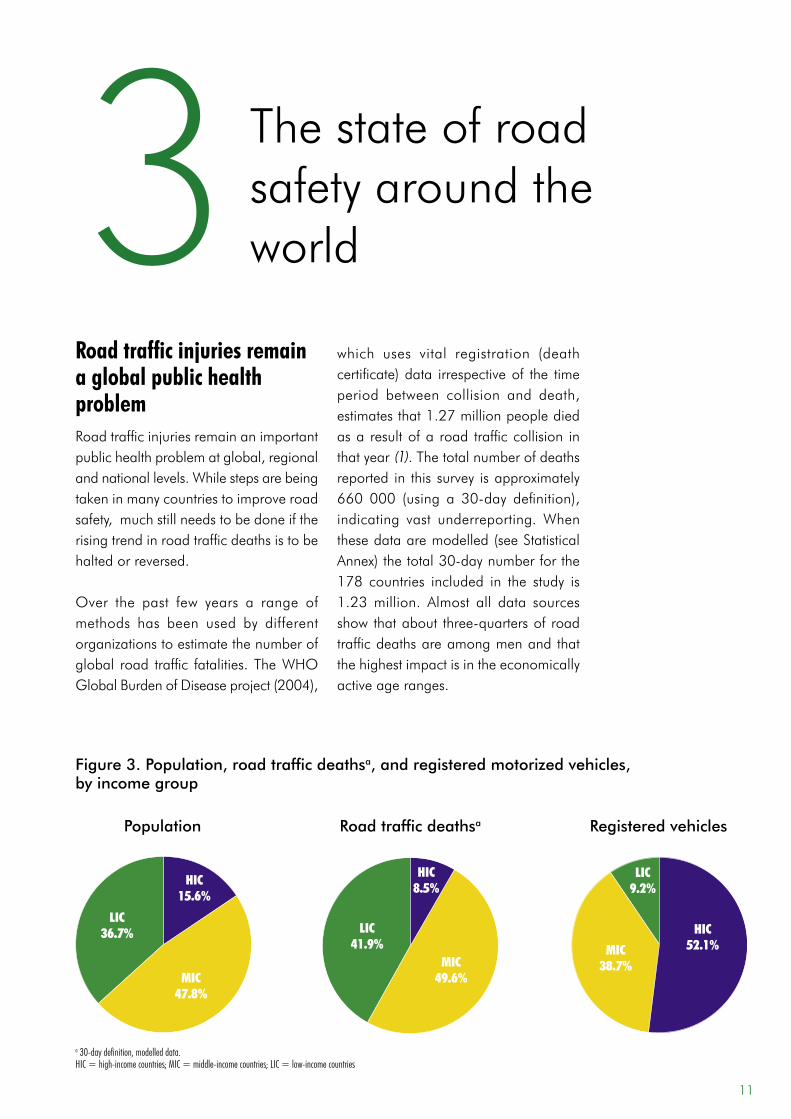
which uses vital registration (deathcertificate)data irrespectiveof the timeperiod between collision and death,estimates that 1.27 million people died as a result of a road traffic collision in that year (1). The total number of deaths reported in this survey is approximately 660 000 (using a 30-day definition),indicating vast underreporting. When thesedataaremodelled(seeStatisticalAnnex)thetotal30-daynumberforthe178 countries included in the study is 1.23million. Almost all data sourcesshowthatabout three-quartersofroadtraffic deaths are among men and that the highest impact is in the economically active age ranges.
3 Figure 3. Population, road traffic deathsa, and registered motorized vehicles, by income group
a 30-day definition, modelled data. HIC = high-income countries; MIC = middle-income countries; LIC = low-income countries
Registered vehiclesRoad traffic deathsaPopulation
LIC41.9%
LIC36.7%
LIC9.2%
HIC15.6%
MIC47.8%
HIC8.5%
MIC49.6%
MIC38.7%
HIC52.1%
11
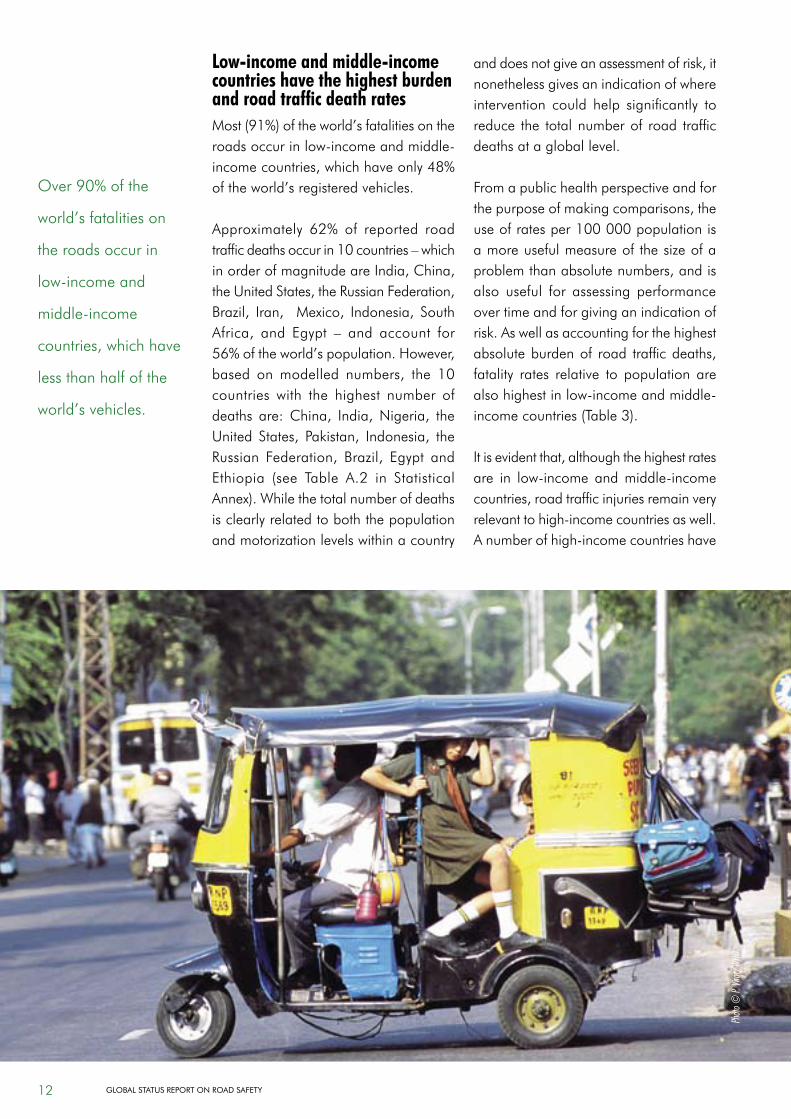
low-income and middle-income countries have the highest burden and road traffic death ratesMost(91%)oftheworld’sfatalitiesontheroadsoccurinlow-incomeandmiddle-incomecountries,whichhaveonly48%oftheworld’sregisteredvehicles.
Approximately 62% of reported roadtrafficdeathsoccurin10countries–whichinorderofmagnitudeareIndia,China,theUnitedStates,theRussianFederation,Brazil, Iran, Mexico, Indonesia, SouthAfrica, and Egypt – and account for56%oftheworld’spopulation.However,based onmodelled numbers, the 10countries with the highest number ofdeaths are:China, India,Nigeria, theUnited States, Pakistan, Indonesia, theRussian Federation, Brazil, Egypt andEthiopia (see Table A.2 in StatisticalAnnex).Whilethetotalnumberofdeathsis clearly related to both the population andmotorizationlevelswithinacountry
anddoesnotgiveanassessmentofrisk,itnonethelessgivesanindicationofwhereintervention could help significantly to reduce the total number of road traffic deaths at a global level.
From a public health perspective and for thepurposeofmakingcomparisons,theuseofratesper100000populationisa more useful measure of the size of a problemthanabsolutenumbers,andisalso useful for assessing performance over time and for giving an indication of risk.Aswellasaccountingforthehighestabsoluteburdenof road trafficdeaths,fatality rates relative to population are alsohighestinlow-incomeandmiddle-incomecountries(Table3).
Itisevidentthat,althoughthehighestratesare in low-income andmiddle-incomecountries,roadtrafficinjuriesremainveryrelevanttohigh-incomecountriesaswell.Anumberofhigh-incomecountrieshave
Photo
© P.
Virot
/WHO
Over90%ofthe
world’sfatalitieson
the roads occur in
low-incomeand
middle-income
countries,whichhave
less than half of the
world’svehicles.
12 Global StatuS RepoRt on Road Safety
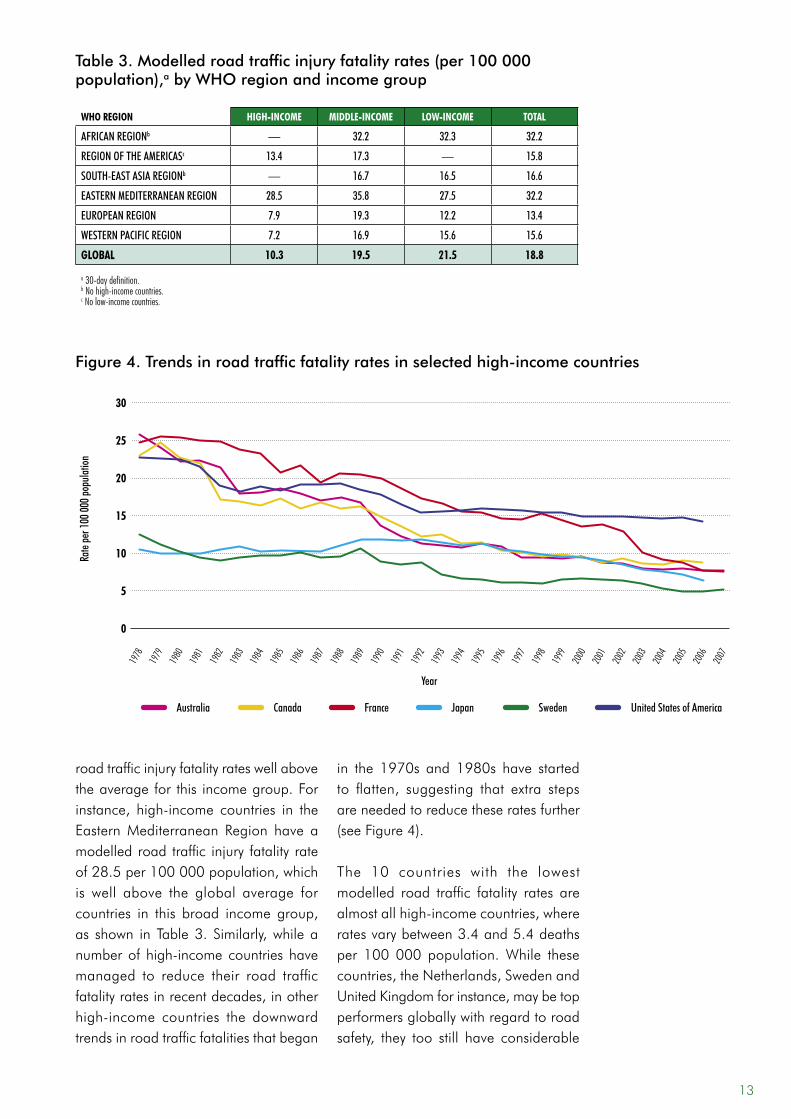
road traffic injury fatality rates well above the average for this income group. For instance, high-income countries in the Eastern Mediterranean Region have a modelled road traffic injury fatality rate of 28.5 per 100 000 population, which is well above the global average for countries in this broad income group, as shown in Table 3. Similarly, while a number of high-income countries have managed to reduce their road traffic fatality rates in recent decades, in other high-income countries the downward trends in road traffic fatalities that began
in the 1970s and 1980s have started to flatten, suggesting that extra steps are needed to reduce these rates further (see Figure 4).
The 10 countries with the lowest modelled road traffic fatality rates are almost all high-income countries, where rates vary between 3.4 and 5.4 deaths per 100 000 population. While these countries, the Netherlands, Sweden and United Kingdom for instance, may be top performers globally with regard to road safety, they too still have considerable
who region high-income middle-income low-income ToTal
AfricAn regionb — 32.2 32.3 32.2
region of the AmericAsc 13.4 17.3 — 15.8
south-eAst AsiA regionb — 16.7 16.5 16.6
eAstern mediterrAneAn region 28.5 35.8 27.5 32.2
europeAn region 7.9 19.3 12.2 13.4
Western pAcific region 7.2 16.9 15.6 15.6
global 10.3 19.5 21.5 18.8
a 30-day definition.b No high-income countries.c No low-income countries.
Table 3. Modelled road traffic injury fatality rates (per 100 000 population),a by WHO region and income group
13
Figure 4. Trends in road traffic fatality rates in selected high-income countries
0
rate
per 1
00 00
0 pop
ulatio
n
30
Year
5
10
15
20
25
united states of AmericaAustralia canada france swedenJapan
1981
1982
1983
1984
1985
1986
1987
1988
1989
1990
1991
1992
1993
1994
1995
1996
1997
1998
1999
2000
2001
2002
2003
2004
2005
2007
1978
1979
1980
2006
room for improvement. For example,road traffic injuries are still an important cause of death in Sweden, despite arelativelylowrateofroadtrafficfatalitiesand the successful implementation of a comprehensive approach to the problem.InSweden,roadtrafficcrashesare responsible for 20% of deaths ofchildrenagedbetween5and19 (16). Similarly, the road transport system inSweden is responsible formanymoredeaths–notablyofchildrenandyoungadults – than other forms of transportsuchasaviationorrailtravel.Thus,evencountrieswhichappeartobeperformingwell at the global level have a longway togotoachievea trulysaferoadtransport system.
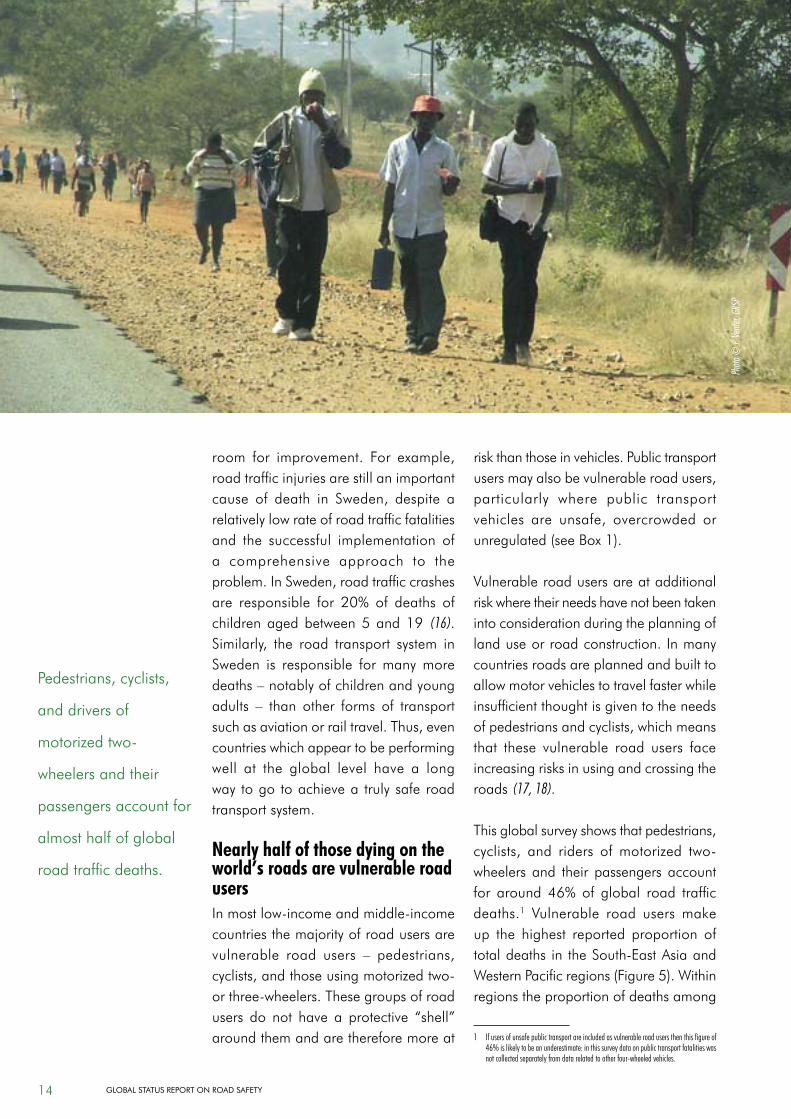
nearly half of those dying on the world’s roads are vulnerable road usersInmostlow-incomeandmiddle-incomecountries the majority of road users are vulnerable road users – pedestrians,cyclists,andthoseusingmotorizedtwo-orthree-wheelers.Thesegroupsofroadusers do not have a protective “shell” around them and are therefore more at
riskthanthoseinvehicles.Publictransportusersmayalsobevulnerableroadusers,particularly where public transportvehicles are unsafe, overcrowded orunregulated(seeBox1).
Vulnerable road users are at additional riskwheretheirneedshavenotbeentakeninto consideration during the planning of land use or road construction. In many countries roads are planned and built to allowmotorvehiclestotravelfasterwhileinsufficient thought is given to the needs ofpedestriansandcyclists,whichmeansthat these vulnerable road users face increasingrisksinusingandcrossingtheroads (17, 18).
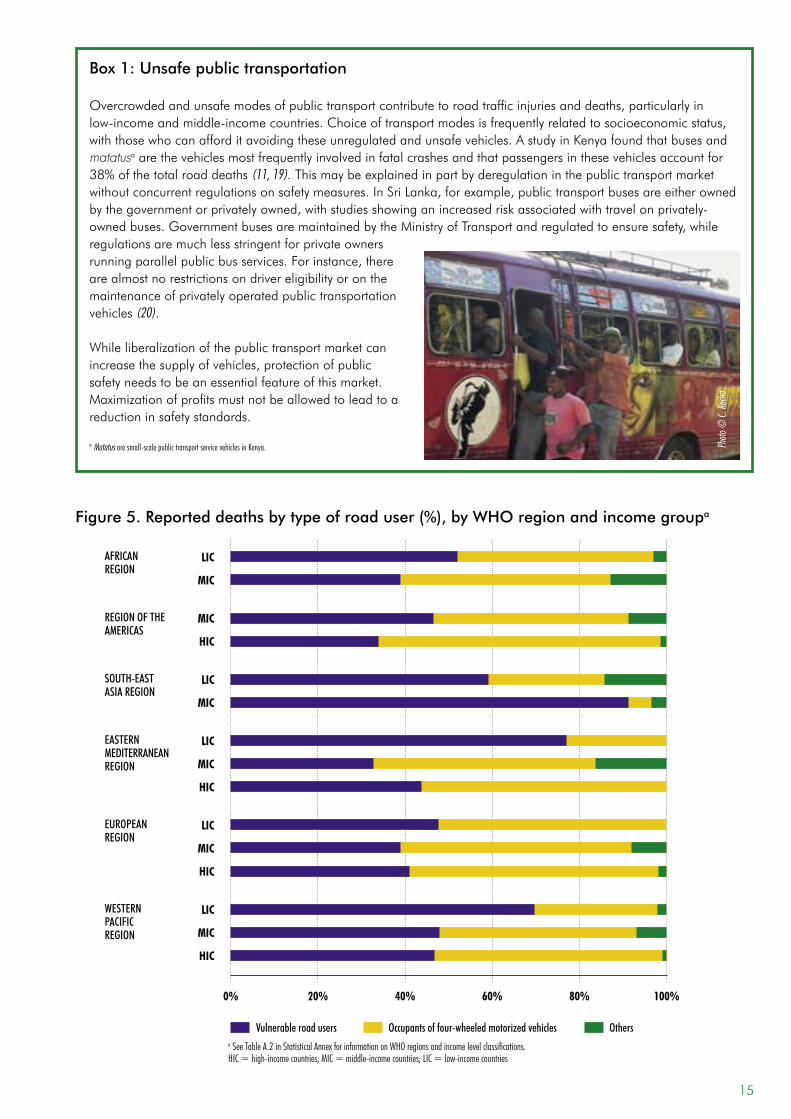
Thisglobalsurveyshowsthatpedestrians,cyclists, and riders ofmotorized two-wheelers and their passengersaccountfor around 46%of global road trafficdeaths.1 Vulnerable road usersmakeup the highest reported proportion of totaldeaths in theSouth-EastAsiaandWesternPacificregions(Figure5).Withinregions the proportion of deaths among
1 If users of unsafe public transport are included as vulnerable road users then this figure of 46% is likely to be an underestimate: in this survey data on public transport fatalities was not collected separately from data related to other four-wheeled vehicles.
Pedestrians,cyclists,
and drivers of
motorizedtwo-
wheelersandtheir
passengers account for
almost half of global
road traffic deaths.
Photo
© P.
Vente
r, GRS
P
14 Global StatuS RepoRt on Road Safety
Box 1: Unsafe public transportation
Overcrowdedandunsafemodesofpublictransportcontributetoroadtrafficinjuriesanddeaths,particularlyinlow-incomeandmiddle-incomecountries.Choiceoftransportmodesisfrequentlyrelatedtosocioeconomicstatus,withthosewhocanafforditavoidingtheseunregulatedandunsafevehicles.AstudyinKenyafoundthatbusesandmatatusaarethevehiclesmostfrequentlyinvolvedinfatalcrashesandthatpassengersinthesevehiclesaccountfor38%ofthetotalroaddeaths(11, 19).Thismaybeexplainedinpartbyderegulationinthepublictransportmarketwithoutconcurrentregulationsonsafetymeasures.InSriLanka,forexample,publictransportbusesareeitherownedbythegovernmentorprivatelyowned,withstudiesshowinganincreasedriskassociatedwithtravelonprivately-ownedbuses.GovernmentbusesaremaintainedbytheMinistryofTransportandregulatedtoensuresafety,whileregulationsaremuchlessstringentforprivateownersrunningparallelpublicbusservices.Forinstance,thereare almost no restrictions on driver eligibility or on the maintenance of privately operated public transportation vehicles (20).
Whileliberalizationofthepublictransportmarketcanincreasethesupplyofvehicles,protectionofpublicsafetyneedstobeanessentialfeatureofthismarket.Maximizationofprofitsmustnotbeallowedtoleadtoareduction in safety standards.
a Matatus are small-scale public transport service vehicles in Kenya. Photo
© C.
Rech
a
20% 60% 80%0% 100%40%
Figure 5. Reported deaths by type of road user (%), by WHO region and income groupa
Vulnerable road users Occupants of four-wheeled motorized vehicles Others
WESTERN PACIFIC REgION
lic
Mic
hic
SOUTH-EAST ASIA REgION
lic
Mic
EUROPEAN REgION
lic
Mic
hic
EASTERN MEDITERRANEAN REgION
lic
Mic
hic
REgION OF THE AMERICAS
Mic
hic
a See Table A.2 in Statistical Annex for information on WHO regions and income level classifications.HIC = high-income countries; MIC = middle-income countries; LIC = low-income countries
AFRICAN REgION
Mic
lic
15
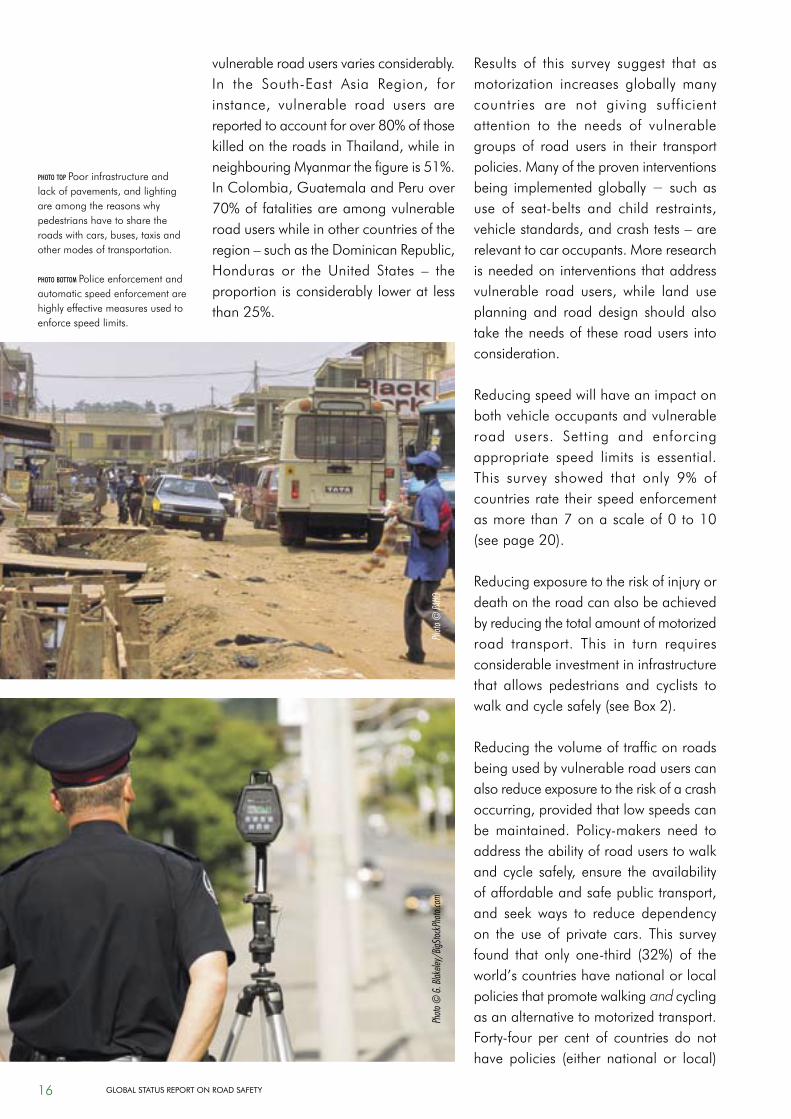
vulnerable road users varies considerably. In the South-East Asia Region, forinstance, vulnerable road users arereportedtoaccountforover80%ofthosekilledontheroadsinThailand,whileinneighbouringMyanmarthefigureis51%.InColombia,GuatemalaandPeruover70%offatalitiesareamongvulnerableroaduserswhileinothercountriesoftheregion–suchastheDominicanRepublic,Honduras or the United States – theproportionisconsiderablyloweratlessthan25%.
Results of this survey suggest that as motorization increases globally many countries are not giving sufficient attention to the needs of vulnerable groups of road users in their transport policies. Many of the proven interventions being implemented globally − such as use of seat-belts and child restraints,vehiclestandards,andcrashtests–arerelevant to car occupants. More research is needed on interventions that address vulnerable road users, while land useplanning and road design should also taketheneedsoftheseroadusersintoconsideration.
Reducingspeedwillhaveanimpactonboth vehicle occupants and vulnerable road users. Setting and enforcingappropriate speed limits is essential. This survey showed that only 9% ofcountries rate their speed enforcement asmorethan7onascaleof0to10(seepage20).
Reducingexposuretotheriskofinjuryordeath on the road can also be achieved by reducing the total amount of motorized road transport. This in turn requiresconsiderable investment in infrastructure that allows pedestrians and cyclists towalkandcyclesafely(seeBox2).
Reducing the volume of traffic on roads being used by vulnerable road users can alsoreduceexposuretotheriskofacrashoccurring,providedthatlowspeedscanbemaintained. Policy-makers need toaddresstheabilityofroaduserstowalkandcycle safely,ensure theavailabilityofaffordableandsafepublictransport,and seek ways to reduce dependencyon the use of private cars. This survey found that only one-third (32%) of theworld’scountrieshavenationalorlocalpoliciesthatpromotewalkingand cycling as an alternative to motorized transport. Forty-four per cent of countries do nothave policies (either national or local)
photo top Poor infrastructure and lackofpavements,andlightingareamongthereasonswhypedestrians have to share the roadswithcars,buses,taxisandother modes of transportation.
photo bottom Police enforcement and automatic speed enforcement are highly effective measures used to enforce speed limits.
Photo
© G
. Blak
eley/
BigSto
ckPh
oto.co
mPh
oto ©
PAHO
16 Global StatuS RepoRt on Road Safety
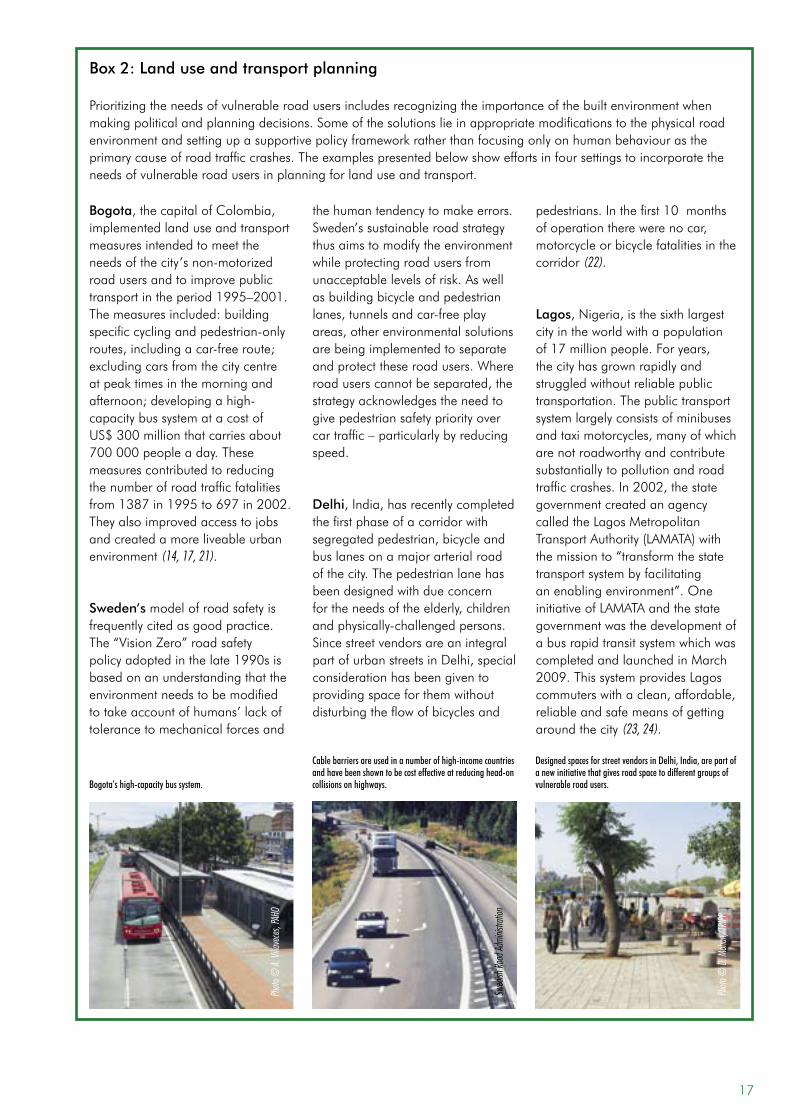
Box 2: Land use and transport planning
Prioritizingtheneedsofvulnerableroadusersincludesrecognizingtheimportanceofthebuiltenvironmentwhenmakingpoliticalandplanningdecisions.Someofthesolutionslieinappropriatemodificationstothephysicalroadenvironmentandsettingupasupportivepolicyframeworkratherthanfocusingonlyonhumanbehaviourastheprimarycauseofroadtrafficcrashes.Theexamplespresentedbelowshoweffortsinfoursettingstoincorporatetheneeds of vulnerable road users in planning for land use and transport.
Bogota’s high-capacity bus system.
Cable barriers are used in a number of high-income countries and have been shown to be cost effective at reducing head-on collisions on highways.
Designed spaces for street vendors in Delhi, India, are part of a new initiative that gives road space to different groups of vulnerable road users.
Photo
© D
. Moh
an/T
RIPP
Photo
© A.
Villa
vece
s, PA
HO
Swed
ish Ro
ad Ad
minis
tratio
n
Bogota,thecapitalofColombia,implemented land use and transport measures intended to meet the needsofthecity’snon-motorizedroad users and to improve public transportintheperiod1995–2001.Themeasuresincluded:buildingspecificcyclingandpedestrian-onlyroutes,includingacar-freeroute;excluding cars from the city centre atpeaktimesinthemorningandafternoon;developingahigh-capacity bus system at a cost of US$300millionthatcarriesabout700000peopleaday.Thesemeasures contributed to reducing the number of road traffic fatalities from1387in1995to697in2002.They also improved access to jobs and created a more liveable urban environment (14, 17, 21).
Sweden‘s model of road safety is frequentlycitedasgoodpractice.The “Vision Zero” road safety policyadoptedinthelate1990sisbased on an understanding that the environment needs to be modified totakeaccountofhumans’lackoftolerance to mechanical forces and
thehumantendencytomakeerrors.Sweden’ssustainableroadstrategythus aims to modify the environment whileprotectingroadusersfromunacceptablelevelsofrisk.Aswellas building bicycle and pedestrian lanes,tunnelsandcar-freeplayareas,otherenvironmentalsolutionsare being implemented to separate and protect these road users. Where roaduserscannotbeseparated,thestrategyacknowledgestheneedtogive pedestrian safety priority over cartraffic–particularlybyreducingspeed.
Delhi,India,hasrecentlycompletedthefirstphaseofacorridorwithsegregatedpedestrian,bicycleandbus lanes on a major arterial road of the city. The pedestrian lane has beendesignedwithdueconcernfortheneedsoftheelderly,childrenandphysically-challengedpersons.SincestreetvendorsareanintegralpartofurbanstreetsinDelhi,specialconsideration has been given to providingspaceforthemwithoutdisturbingtheflowofbicyclesand
pedestrians.Inthefirst10monthsofoperationtherewerenocar,motorcycle or bicycle fatalities in the corridor (22).
Lagos,Nigeria,isthesixthlargestcityintheworldwithapopulationof17millionpeople.Foryears,thecityhasgrownrapidlyandstruggledwithoutreliablepublictransportation. The public transport system largely consists of minibuses andtaximotorcycles,manyofwhicharenotroadworthyandcontributesubstantially to pollution and road trafficcrashes.In2002,thestategovernment created an agency calledtheLagosMetropolitanTransportAuthority(LAMATA)withthe mission to “transform the state transport system by facilitating anenablingenvironment”.OneinitiativeofLAMATAandthestategovernmentwasthedevelopmentofabusrapidtransitsystemwhichwascompleted and launched in March 2009.ThissystemprovidesLagoscommuterswithaclean,affordable,reliable and safe means of getting around the city (23, 24).
17
that encourage public transport as an alternativetocar transport,reflectingasimilar neglect in meeting the needs of non-motorizedroadusers(seeTableA.7in Statistical Annex). These figures areperhaps surprising given that decreased dependency on the use of private cars can have other positive impacts such as improvedrespiratoryhealth(asaresultof less transport-related air pollution)andreducedlevelsofobesity(asaresultofmorephysicalactivityassociatedwithwalkingandcycling).
few countries have comprehensive road safety laws that are well enforcedEnacting and enforcing legislationon a number of risk factors for roadtraffic injuries and deaths is critical in influencing exposure to risk, crashoccurrence, injury severity, and post-crash injury outcomes. Comprehensive and clear legislation, enforced withappropriate penalties and accompanied by public awareness campaigns, hasbeen shown to be a critical factor inreducing road traffic injuries and deaths associated with speed, drink–driving,andthenon-useofoccupantprotectionmeasures(helmets,seat-belts,andchildrestraints). The results of the globalsurvey suggest that the legislation on theseriskfactorsisnotcomprehensiveinmanycountries,andenforcement isoftenlacking.Similarly,manycountrieslack the institutional mechanismsand resources that would allow themto implement planned activities in a coordinated fashion – includingadoptingandenforcing laws−whichmay result in a “piecemeal” approach to road safety efforts that is seen in many countries(seeBox3).
speedWhat is known?• An increase in average speed is
directlyrelatedbothtothelikelihoodof a crash occurring and to the severityof thecrashconsequences(25, 26).
• A5%increaseinaveragespeedleadstoanapproximately10%increaseincrashes that cause injuries, and a20%increaseinfatalcrashes(27).
• Pedestrianshavea90%chanceofsurvivingacarcrashat30km/horbelow,butlessthana50%chanceofsurvivingimpactsof45km/horabove (27, 28).
• Safespeedthresholdsvaryaccordingtodifferent typesof road,differenttypes of collision and different road users, with their inherentvulnerabilities. Effective speedmanagementneedstotaketheseandother variables into account (27).
• Zones of 30 km/h can reducecrash risk and injury severity andare recommended in areaswherevulnerable road users are particularly atrisk(27, 29).
• Apart from reducing road traffic injuries and deaths, lowering theaverage traffic speed can have other positive effects on health outcomes (e.g.byreducingrespiratoryproblemsassociatedwithcaremissions)(27).
What this survey foundResearch on effective speed management indicates that the speed limits on urban roads should not exceed 50 km/h.While there remains a fairly high fatality risk at this speed (or even lower forpedestrians,cyclistsandothervulnerableroadusers),many countrieswith goodroad safety records have adopted this recommendation, while also givingprovincialor localdecision-makers theauthority to reduce these national speed limits.Inthiswaytrafficcalmingmeasures
Only9%of
countries report
their enforcement
of speed limits as
over 7 on a scale
of0to10.
18 Global StatuS RepoRt on Road Safety
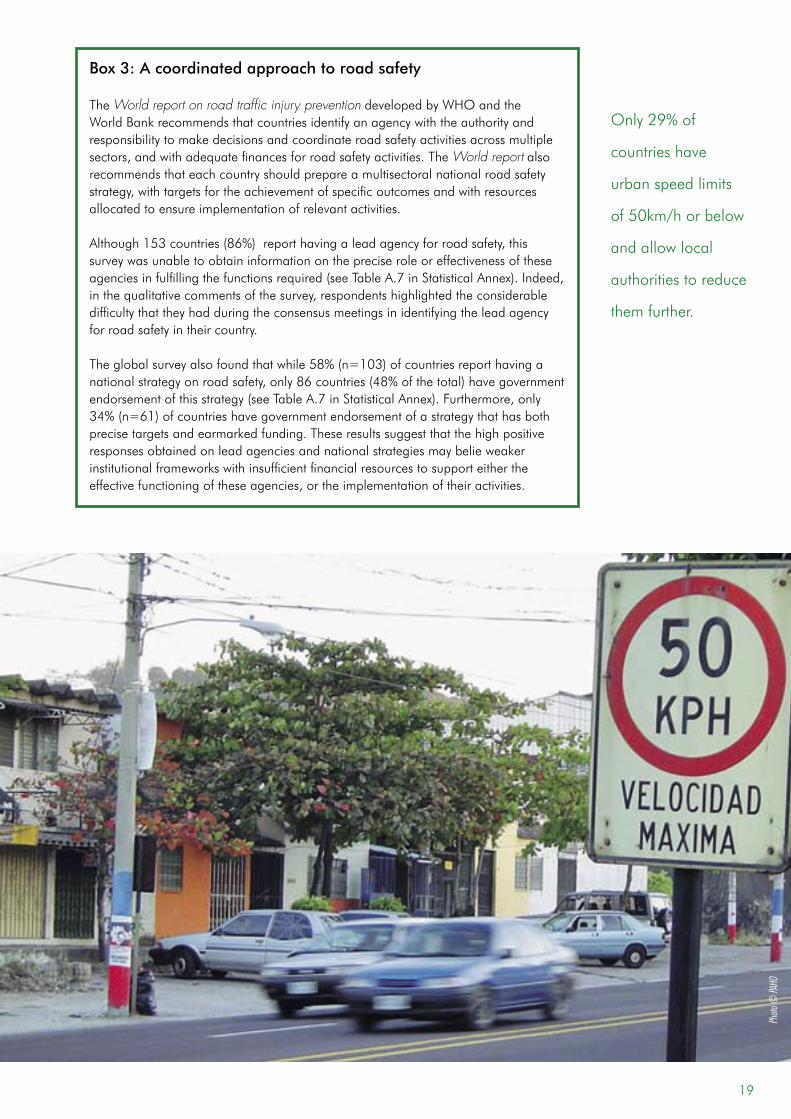
Box 3: A coordinated approach to road safety
The World report on road traffic injury preventiondevelopedbyWHOandtheWorldBankrecommendsthatcountriesidentifyanagencywiththeauthorityandresponsibilitytomakedecisionsandcoordinateroadsafetyactivitiesacrossmultiplesectors,andwithadequatefinancesforroadsafetyactivities.TheWorld report also recommends that each country should prepare a multisectoral national road safety strategy,withtargetsfortheachievementofspecificoutcomesandwithresourcesallocated to ensure implementation of relevant activities.
Although153countries(86%)reporthavingaleadagencyforroadsafety,thissurveywasunabletoobtaininformationonthepreciseroleoreffectivenessoftheseagenciesinfulfillingthefunctionsrequired(seeTableA.7inStatisticalAnnex).Indeed,inthequalitativecommentsofthesurvey,respondentshighlightedtheconsiderabledifficulty that they had during the consensus meetings in identifying the lead agency for road safety in their country.
Theglobalsurveyalsofoundthatwhile58%(n=103)ofcountriesreporthavinganationalstrategyonroadsafety,only86countries(48%ofthetotal)havegovernmentendorsementofthisstrategy(seeTableA.7inStatisticalAnnex).Furthermore,only34%(n=61)ofcountrieshavegovernmentendorsementofastrategythathasbothprecisetargetsandearmarkedfunding.Theseresultssuggestthatthehighpositiveresponsesobtainedonleadagenciesandnationalstrategiesmaybelieweakerinstitutionalframeworkswithinsufficientfinancialresourcestosupporteithertheeffectivefunctioningoftheseagencies,ortheimplementationoftheiractivities.
Only29%of
countries have
urban speed limits
of50km/horbelow
andallowlocal
authorities to reduce
them further.
Photo
© PA
HO
19
thathavebeenshowntobeveryeffectiveatreducing road traffic injuries can be made and implemented at the subnational level asneeded– forexample in residentialareas,ornearschools.Intheanalysisofthe results of this survey the criteria used for assessing urban speed management weretherefore:• speed limits on urban roads are set
atlessthanorequalto50km/h;• local authorities are able to lower
thesespeedlimitswherenecessary.
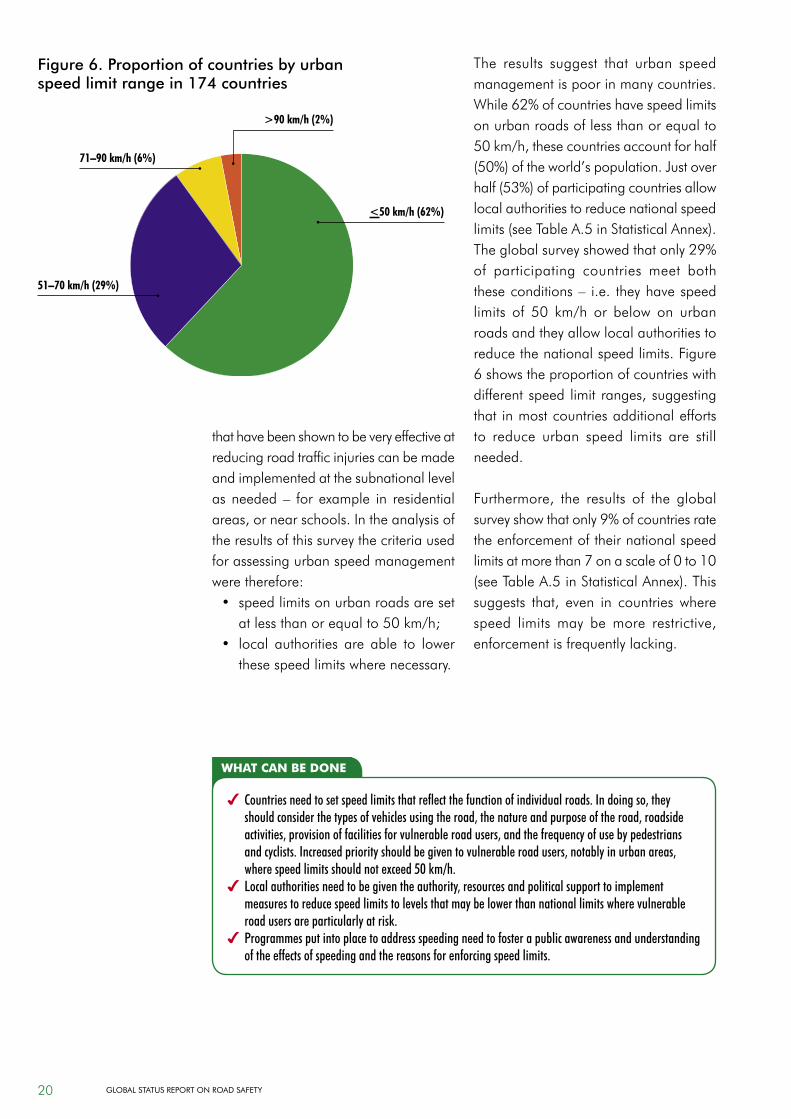
The results suggest that urban speed management is poor in many countries. While62%ofcountrieshavespeedlimitsonurbanroadsoflessthanorequalto50km/h,thesecountriesaccountforhalf(50%)oftheworld’spopulation.Justoverhalf(53%)ofparticipatingcountriesallowlocal authorities to reduce national speed limits(seeTableA.5inStatisticalAnnex).Theglobalsurveyshowedthatonly29%of participating countries meet both theseconditions– i.e. theyhavespeedlimits of 50 km/h or below on urbanroadsandtheyallowlocalauthoritiestoreduce the national speed limits. Figure 6showstheproportionofcountrieswithdifferentspeed limit ranges,suggestingthat in most countries additional efforts to reduce urban speed limits are still needed.
Furthermore, the results of the globalsurveyshowthatonly9%ofcountriesratethe enforcement of their national speed limitsatmorethan7onascaleof0to10(seeTableA.5inStatisticalAnnex).Thissuggests that, even in countries wherespeed limitsmay bemore restrictive,enforcementisfrequentlylacking.
what can be done
4 Countries need to set speed limits that reflect the function of individual roads. In doing so, they should consider the types of vehicles using the road, the nature and purpose of the road, roadside activities, provision of facilities for vulnerable road users, and the frequency of use by pedestrians and cyclists. Increased priority should be given to vulnerable road users, notably in urban areas, where speed limits should not exceed 50 km/h.
4 Local authorities need to be given the authority, resources and political support to implement measures to reduce speed limits to levels that may be lower than national limits where vulnerable road users are particularly at risk.
4 Programmes put into place to address speeding need to foster a public awareness and understanding of the effects of speeding and the reasons for enforcing speed limits.
Figure 6. Proportion of countries by urban speed limit range in 174 countries
>90 km/h (2%)
<50 km/h (62%)
51–70 km/h (29%)
71–90 km/h (6%)
20 Global StatuS RepoRt on Road Safety
drinking and drivingWhat is known?• Drinkinganddrivingincreasesboth
theriskofacrashandthelikelihoodthat death or a serious injury willresult (4).
• The risk of involvement in a crashincreases significantly above a blood alcoholconcentration(BAC)of0.04g/dl(30, 31).
• Laws which establish lower BACs(between zero and 0.02 g/dl) foryoung/novice drivers can lead toreductionsofbetween4%and24%in the number of crashes involving young people (32).
• Enforcing sobrietycheckpointsandrandombreath-testing can lead toreductionsinalcohol-relatedcrashesofabout20%,andhasbeenshowntobeverycost-effective(33, 34).
What this survey foundNinety-six per cent (n=171) ofparticipating countries report having either national or subnational laws on
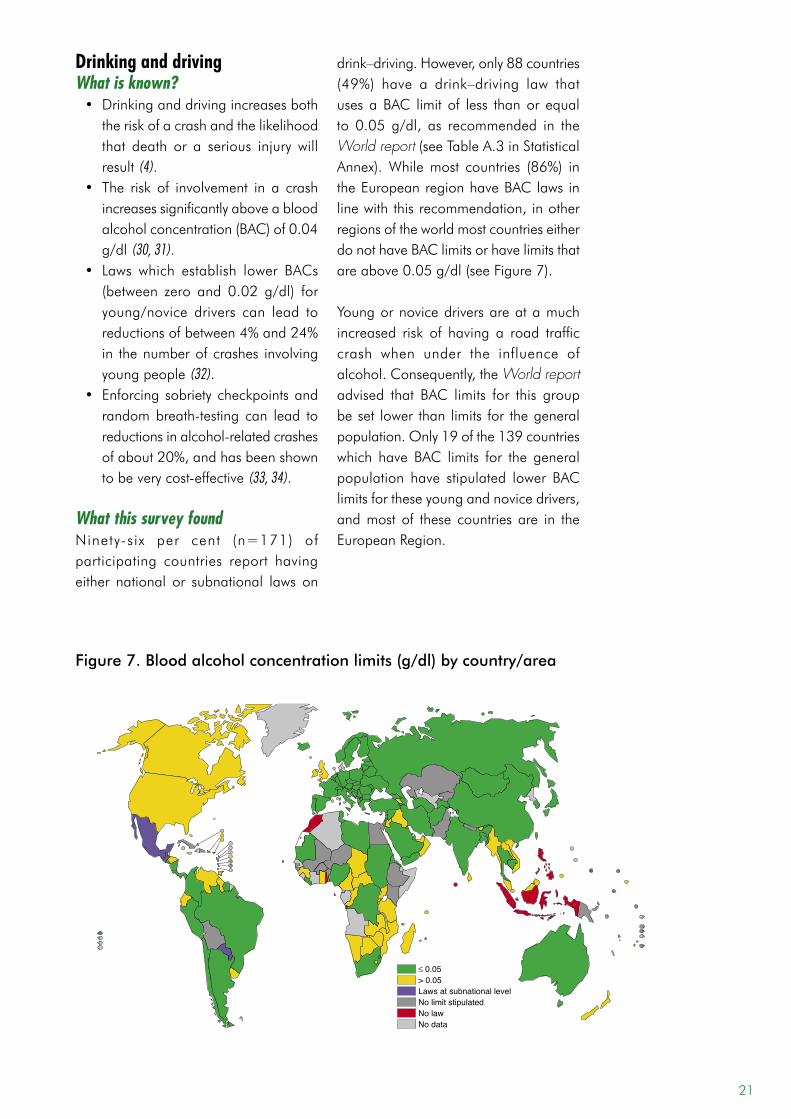
drink–driving.However,only88countries(49%) have a drink–driving law thatusesaBAC limit of less thanor equalto 0.05 g/dl, as recommended in theWorld report(seeTableA.3inStatisticalAnnex).Whilemost countries (86%) intheEuropeanregionhaveBAClawsinlinewiththisrecommendation,inotherregionsoftheworldmostcountrieseitherdo not have BAC limits or have limits that areabove0.05g/dl(seeFigure7).
Youngornovicedriversareatamuchincreased risk of having a road trafficcrash when under the influence ofalcohol.Consequently,theWorld report advised that BAC limits for this group beset lower than limits for thegeneralpopulation.Only19ofthe139countrieswhich have BAC limits for the generalpopulation have stipulated lower BAClimitsfortheseyoungandnovicedrivers,and most of these countries are in the EuropeanRegion.
Figure 7. Blood alcohol concentration limits (g/dl) by country/area
≤ 0.05> 0.05Laws at subnational levelNo limit stipulatedNo lawNo data
21
Random breath-testing and policecheckpointsare importantenforcementmechanisms that have been shownto reduce alcohol-related crashes.Seventy-nine per cent of countriesreport that they use one or both of these methodsofenforcement.However,only23countries(13%)reportanenforcementratingofover7onascaleof0 to10(seeTableA.3inStatisticalAnnex).Thisrepresents21%ofhigh-incomecountries,11% ofmiddle-income countries andjust9%oflow-incomecountries.Takentogether, these findings show that only10%ofparticipatingcountries,covering24%oftheworld’spopulation,havebothadequatedrink–drivinglaws(asdefinedbyaBAClimitof lessthanorequalto0.05 g/dl) and enforcement ratings ofover 7.
use of motorcycle helmetsWhat is known?• Wearing a motorcycle helmet
correctlycanreducetheriskofdeathbyalmost40%andtheriskofsevereinjurybyover70%(35).
• Whenmotorcycle helmet laws areenforcedeffectively,helmet-wearingrates can increase to over 90%(36, 37).
• The effectiveness of motorcycle helmets in reducing head injuries is in part a result of the quality ofthe helmets. Requiring helmets tomeet a recognized safety standard is important to ensure that helmets can effectively reduce the impact of a collision to the head in the event of a crash (38).
What this survey foundOver 90% (n=163) of countriesparticipating in this global survey have laws set at either the national orsubnational level that require helmetsto be worn by users of motorizedtwo-wheelers. However, legislation isincomplete in many of these countries. For instance, some countries makeexceptions formotorcyclists using low-
Lessthanhalfof
countriesworldwide
havedrink–driving
lawsbasedonablood
alcohol concentration
limitthatisequaltoor
lessthan0.05g/dl.
what can be done
4 All countries should have a drink–driving law and should strictly enforce it.
4 Drink–driving laws should be based on blood alcohol concentration, or the equivalent breath alcohol content limits, which should be 0.05 g/dl or below.
4 All countries should set limits of 0.02 g/dl or below for young/novice drivers.
Photo
© P.
Orel
lana/
WHO
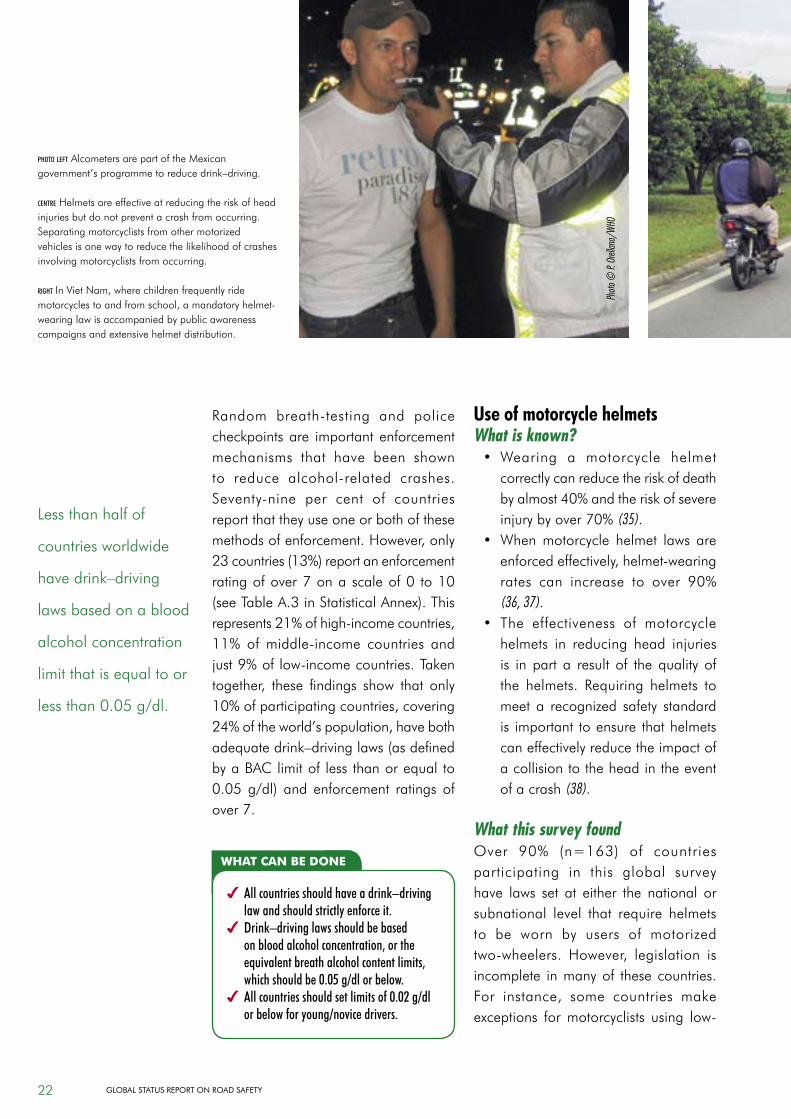
photo left Alcometers are part of the Mexican government’sprogrammetoreducedrink–driving.
centre Helmetsareeffectiveatreducingtheriskofheadinjuries but do not prevent a crash from occurring. Separatingmotorcyclistsfromothermotorizedvehiclesisonewaytoreducethelikelihoodofcrashesinvolving motorcyclists from occurring.
right InVietNam,wherechildrenfrequentlyridemotorcyclestoandfromschool,amandatoryhelmet-wearinglawisaccompaniedbypublicawarenesscampaigns and extensive helmet distribution.
22 Global StatuS RepoRt on Road Safety
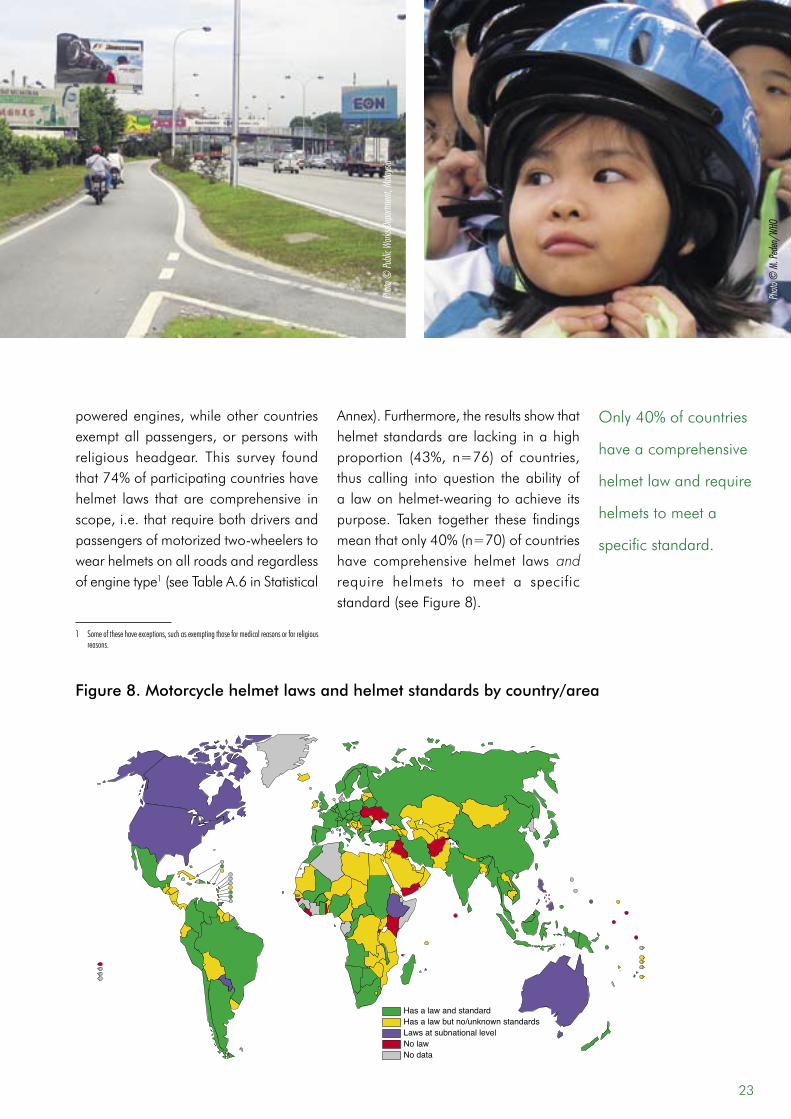
poweredengines,whileothercountriesexemptallpassengers,orpersonswithreligious headgear. This survey found that74%ofparticipatingcountrieshavehelmet laws that are comprehensive inscope,i.e.thatrequirebothdriversandpassengersofmotorizedtwo-wheelerstowearhelmetsonallroadsandregardlessof engine type1(seeTableA.6inStatistical
1 Some of these have exceptions, such as exempting those for medical reasons or for religious reasons.
Annex).Furthermore,theresultsshowthathelmetstandardsare lacking inahighproportion (43%, n=76) of countries,thus calling into question the ability ofa lawonhelmet-wearing toachieve itspurpose. Taken together these findingsmeanthatonly40%(n=70)ofcountrieshave comprehensive helmet lawsand require helmets to meet a specificstandard(seeFigure8).
Photo
© Pu
blic W
orks D
epart
ment,
Mala
ysia
Photo
© M
. Ped
en/W
HO
Figure 8. Motorcycle helmet laws and helmet standards by country/area
Has a law and standardHas a law but no/unknown standardsLaws at subnational levelNo lawNo data
Only40%ofcountries
have a comprehensive
helmetlawandrequire
helmets to meet a
specific standard.
23
Even where comprehensive laws arein place, enforcement is low inmostcountries.Only25%(n=45)ofcountriesratetheirenforcementofhelmet-uselawsas higher than 7 on a scale of 0 to10 (seeTableA.6 inStatisticalAnnex).Finally, the impact of helmet laws thatare in place is also difficult to ascertain inmanycountries.Only34%ofcountrieshavedataonhelmet-wearingrates,andboth the reliability and the generalizability of the results vary considerably (seepage35).
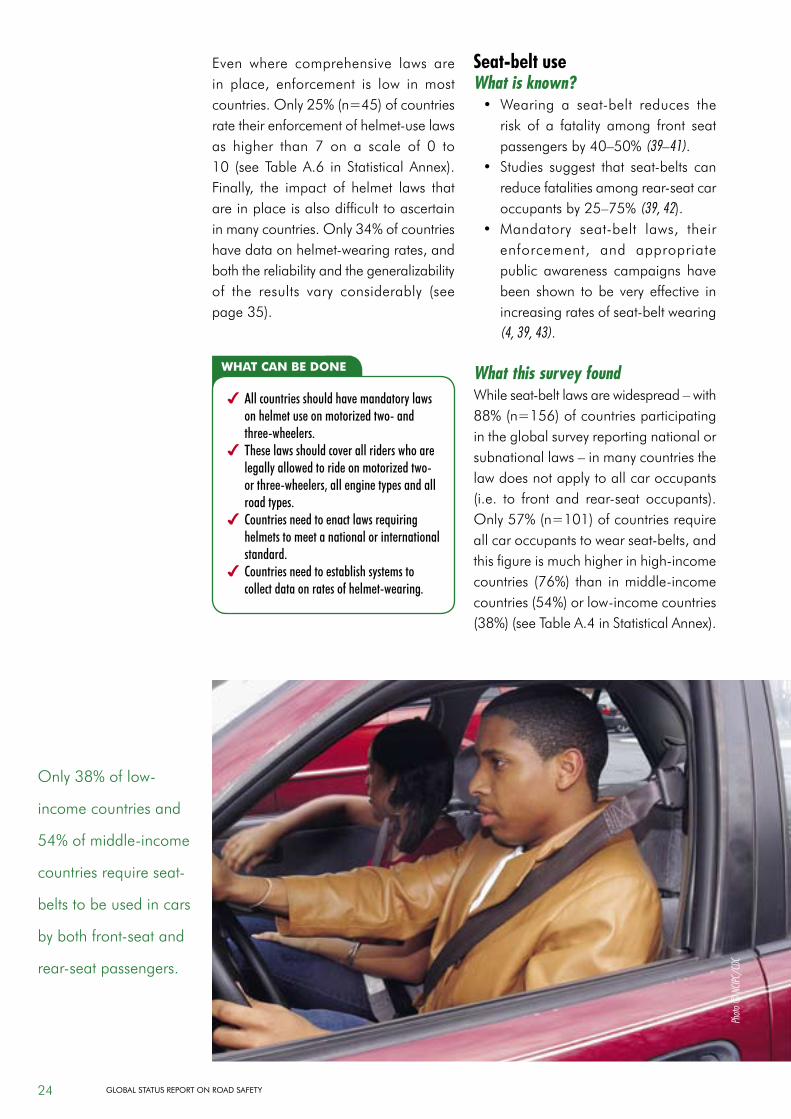
seat-belt useWhat is known?• Wearing a seat-belt reduces the
risk of a fatality among front seatpassengersby40–50%(39–41).
• Studies suggest that seat-belts canreducefatalitiesamongrear-seatcaroccupantsby25–75%(39, 42).
• Mandatory seat-belt laws, theirenforcement, and appropriatepublic awareness campaigns havebeen shown tobe veryeffective inincreasingratesofseat-beltwearing(4, 39, 43).
What this survey foundWhileseat-beltlawsarewidespread–with88%(n=156)ofcountriesparticipatingin the global survey reporting national or subnationallaws–inmanycountriesthelawdoesnotapplytoallcaroccupants(i.e. to front and rear-seat occupants).Only57%(n=101)ofcountriesrequireallcaroccupantstowearseat-belts,andthisfigureismuchhigherinhigh-incomecountries (76%) than inmiddle-incomecountries(54%)orlow-incomecountries(38%)(seeTableA.4inStatisticalAnnex).
what can be done
4 All countries should have mandatory laws on helmet use on motorized two- and three-wheelers.
4 These laws should cover all riders who are legally allowed to ride on motorized two- or three-wheelers, all engine types and all road types.
4 Countries need to enact laws requiring helmets to meet a national or international standard.
4 Countries need to establish systems to collect data on rates of helmet-wearing.
Only38%oflow-
income countries and
54%ofmiddle-income
countriesrequireseat-
belts to be used in cars
bybothfront-seatand
rear-seatpassengers.
Photo
© N
CIPC/
CDC
24 Global StatuS RepoRt on Road Safety
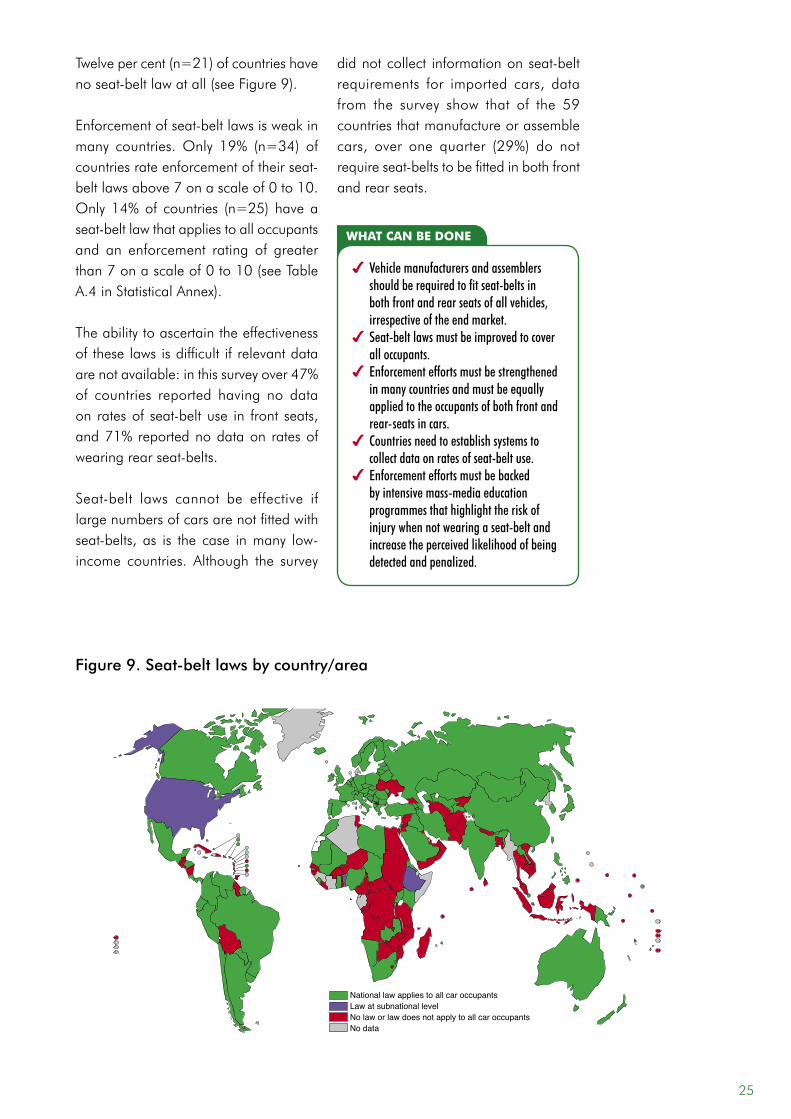
Twelvepercent(n=21)ofcountrieshavenoseat-beltlawatall(seeFigure9).
Enforcementofseat-beltlawsisweakinmany countries.Only 19% (n=34) ofcountriesrateenforcementoftheirseat-beltlawsabove7onascaleof0to10.Only14%of countries (n=25) haveaseat-beltlawthatappliestoalloccupantsand an enforcement rating of greater than7onascaleof0to10(seeTableA.4inStatisticalAnnex). The ability to ascertain the effectiveness oftheselawsisdifficult ifrelevantdataarenotavailable:inthissurveyover47%of countries reported having no data on ratesof seat-beltuse in front seats,and71%reportednodataon ratesofwearingrearseat-belts.
Seat-belt laws cannot be effective iflargenumbersofcarsarenotfittedwithseat-belts, as is the case inmany low-income countries. Although the survey
didnotcollect informationonseat-beltrequirements for imported cars, datafrom the survey show that of the 59countries that manufacture or assemble cars, over one quarter (29%) do notrequireseat-beltstobefittedinbothfrontand rear seats.
Figure 9. Seat-belt laws by country/area
National law applies to all car occupantsLaw at subnational levelNo law or law does not apply to all car occupantsNo data
what can be done
4 Vehicle manufacturers and assemblers should be required to fit seat-belts in both front and rear seats of all vehicles, irrespective of the end market.
4 Seat-belt laws must be improved to cover all occupants.
4 Enforcement efforts must be strengthened in many countries and must be equally applied to the occupants of both front and rear-seats in cars.
4 Countries need to establish systems to collect data on rates of seat-belt use.
4 Enforcement efforts must be backed by intensive mass-media education programmes that highlight the risk of injury when not wearing a seat-belt and increase the perceived likelihood of being detected and penalized.
25
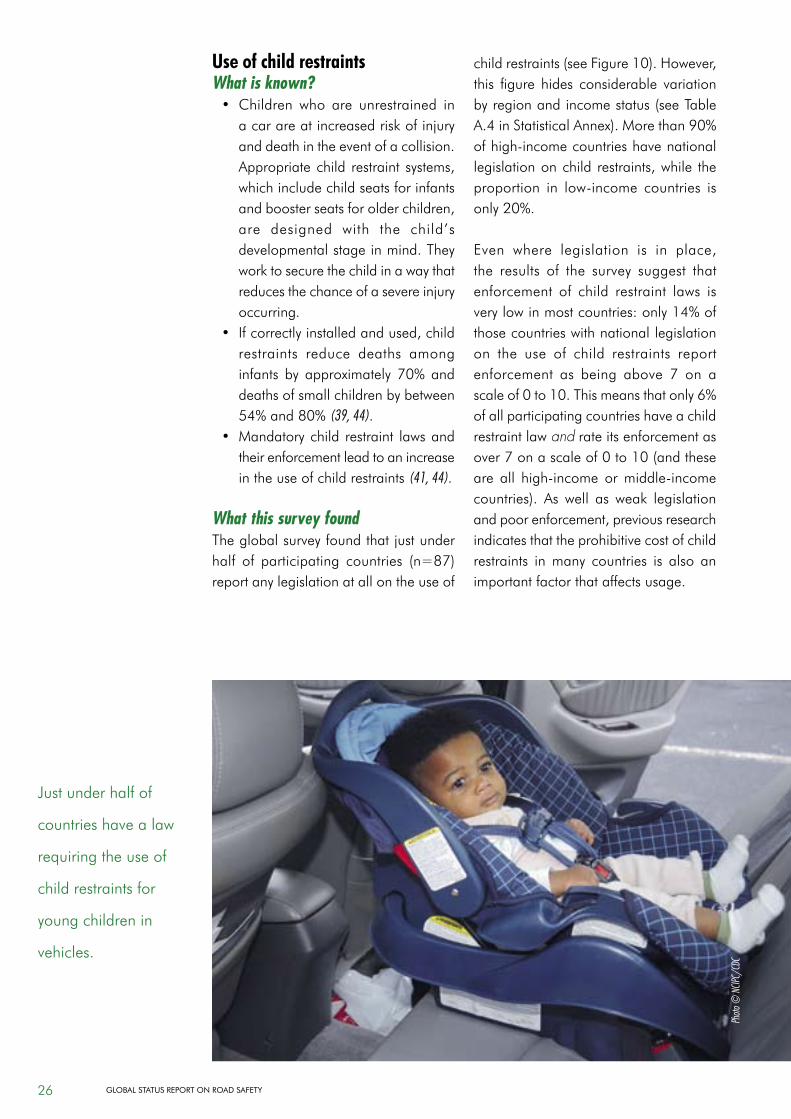
use of child restraintsWhat is known?• Children who are unrestrained in
acarareatincreasedriskofinjuryand death in the event of a collision. Appropriatechild restraint systems,whichincludechildseatsforinfantsandboosterseatsforolderchildren,are designed with the child’sdevelopmental stage in mind. They worktosecurethechildinawaythatreduces the chance of a severe injury occurring.
• Ifcorrectlyinstalledandused,childrestraints reduce deaths among infants by approximately 70%anddeathsofsmallchildrenbybetween54%and80%(39, 44).
• Mandatorychild restraint lawsandtheir enforcement lead to an increase in the use of child restraints (41, 44).
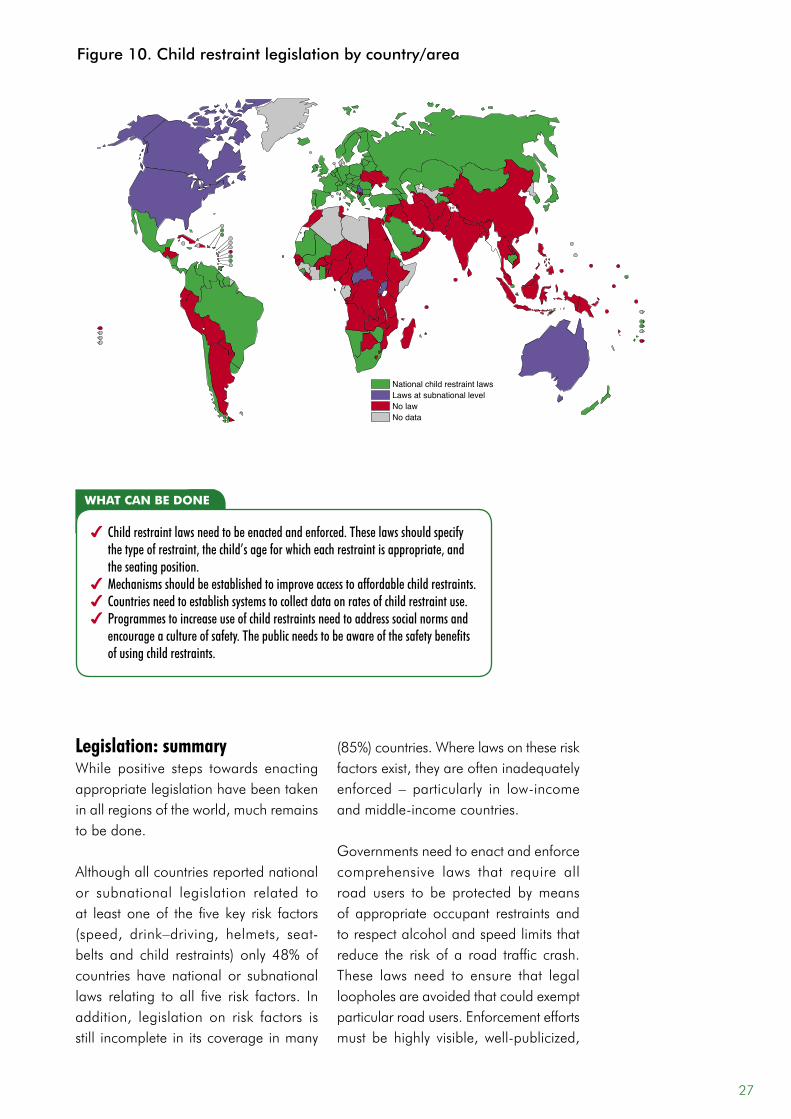
What this survey foundThe global survey found that just under half of participating countries (n=87)report any legislation at all on the use of
childrestraints(seeFigure10).However,this figure hides considerable variation byregionandincomestatus(seeTableA.4inStatisticalAnnex).Morethan90%ofhigh-incomecountrieshavenationallegislationonchild restraints,while theproportion in low-income countries isonly20%.
Even where legislation is in place,the results of the survey suggest that enforcement of child restraint laws isverylowinmostcountries:only14%ofthosecountrieswithnationallegislationon the use of child restraints report enforcement as being above 7 on a scaleof0to10.Thismeansthatonly6%of all participating countries have a child restraintlawand rate its enforcement as over7onascaleof0to10(andtheseare all high-income ormiddle-incomecountries). As well as weak legislationandpoorenforcement,previousresearchindicates that the prohibitive cost of child restraints in many countries is also an important factor that affects usage.
Justunderhalfof
countrieshavealaw
requiringtheuseof
child restraints for
young children in
vehicles.
Photo
© N
CIPC/
CDC
26 Global StatuS RepoRt on Road Safety
legislation: summaryWhile positive steps towards enactingappropriatelegislationhavebeentakeninallregionsoftheworld,muchremainsto be done.
Although all countries reported national or subnational legislation related to at leastoneof the five key risk factors(speed, drink–driving, helmets, seat-belts and child restraints) only 48%ofcountries have national or subnational laws relating to all five risk factors. Inaddition, legislation on risk factors isstill incomplete in its coverage in many
(85%)countries.Wherelawsontheseriskfactorsexist,theyareofteninadequatelyenforced – particularly in low-incomeandmiddle-incomecountries.
Governmentsneedtoenactandenforcecomprehensive laws that require allroad users to be protected by means of appropriate occupant restraints and to respect alcohol and speed limits that reduce the risk of a road traffic crash.These laws need to ensure that legalloopholes are avoided that could exempt particularroadusers.Enforcementeffortsmust be highly visible, well-publicized,
Figure 10. Child restraint legislation by country/area
National child restraint lawsLaws at subnational levelNo lawNo data
what can be done
4 Child restraint laws need to be enacted and enforced. These laws should specify the type of restraint, the child’s age for which each restraint is appropriate, and the seating position.
4 Mechanisms should be established to improve access to affordable child restraints.4 Countries need to establish systems to collect data on rates of child restraint use. 4 Programmes to increase use of child restraints need to address social norms and
encourage a culture of safety. The public needs to be aware of the safety benefits of using child restraints.
27
sustained,andimplementedbytheuseof appropriate measures and penalties for infringement. Nongovernmentalorganizations and other civil society groups can play an important role in generating public and political support for evidence-basedroadsafetymeasures.
Enforcement is most effective whensupportedbyintensivepublicawarenesscampaigns that both highlight the safety benefitsofcomplyingwiththelegislationand also increase the perception of being detected and penalized whennot complyingwith the law.Aswell asincreasingawarenessofthelaws–andof the penalties for not respecting them –publicawarenesscampaignsneedtoworktowardsbuildingacultureofsafetysothatthegeneralpublicareawareofthesafetyreasonsbehindtheselaws.
few countries have reliable data on road traffic injuriesDataonthemagnitudeoftheproblemandtheriskfactorsinvolvedareessentialto developing a systems approach to road safety. A comprehensive assessment of the magnitude of road traffic injuries should consider not only mortality but also non-fatalinjuriesandresultingdisability,as well as the economic cost of roadtrafficinjuriesandthecost-effectivenessof interventions.
A number of other indicators can, ifmonitored accurately and regularly,provide essential information to governments in target ing their interventions and in evaluating the effectiveness of their current national road safety programmes. These include the proportion of road traffic deaths that areattributedtoalcoholaswellashelmetandseat-beltuserates.
Only22%ofallcountriesrespondingtothesurveyhad:• data on fatal and non-fatal road
trafficinjuries,plus• estimatesofthecosttotheeconomy,
plus • data on monitoring and evaluation
indicators such as rates of helmet andseat-beltuse.
data on fatalitiesComparingdataacrossnationsrequiresa standardized definition of a road traffic fatality.However,countriesreportawiderange of definitions for a road traffic death. These definitions use different time periodsbetweenaroadcrashanddeathand include or exclude different types of road users. The same definitions are also notalwaysusedconsistentlyinthesamecountry (4).
The current recommended definition of a road traffic fatality for harmonization of surveillance purposes is “any person killed immediately or dying within 30 days as a result of a road traffic injury accident” (45). The choice of 30 dayswas based on researchwhich showedthatmostpersonswhodieasaresultofacrashsuccumbtotheirinjurieswithin30daysofsustainingthemandthat,whileextensionofthis30-dayperiodresultedin amarginal increase in numbers, itrequired a disproportionately largeincrease in surveillance efforts (7).
Although there aremoveswithin someregions tomake this 30-day definitionthe standard, the results of this surveyindicate that this goal remains largely unattained. The time periods used in definitionsofroadtraffic-relateddeathsrange from “died at the scene of the crash”, through a 7-day period and a30-dayperiod,toanydeaththatresultsfrom a road traffic crash regardless of the time that has elapsed. At the global level
28 Global StatuS RepoRt on Road Safety
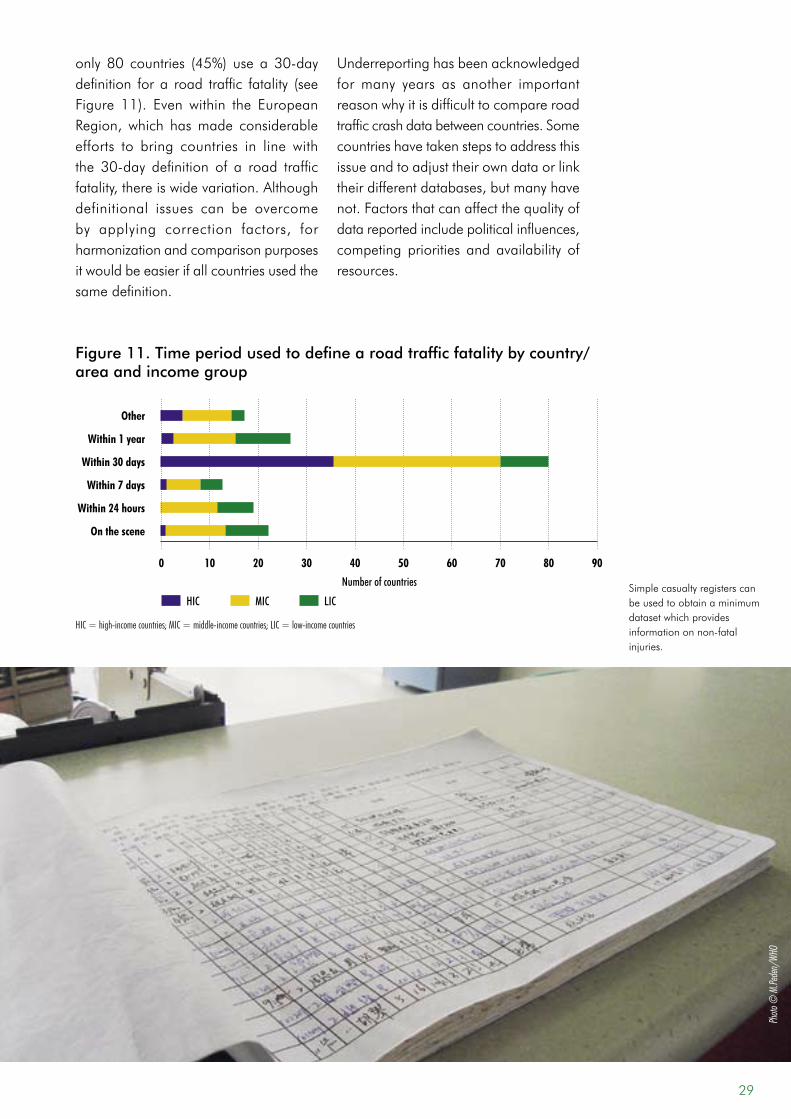
only 80 countries (45%) use a 30-daydefinition fora road traffic fatality (seeFigure 11). Even within the EuropeanRegion, which hasmade considerableefforts to bring countries in line withthe 30-day definition of a road trafficfatality,thereiswidevariation.Althoughdefinitional issues can be overcome by applying correction factors, forharmonization and comparison purposes itwouldbeeasierifallcountriesusedthesame definition.
Underreportinghasbeenacknowledgedfor many years as another important reasonwhyitisdifficulttocompareroadtrafficcrashdatabetweencountries.Somecountrieshavetakenstepstoaddressthisissueandtoadjusttheirowndataorlinktheirdifferentdatabases,butmanyhavenot.Factorsthatcanaffectthequalityofdatareportedincludepoliticalinfluences,competing priorities and availability of resources.
Photo
© M
.Pede
n/WH
O
Simplecasualtyregisterscanbe used to obtain a minimum datasetwhichprovidesinformationonnon-fatalinjuries.
Figure 11. Time period used to define a road traffic fatality by country/area and income group
10 20 30 40 50 60 70 80
HIC
other
within 1 year
within 30 days
within 7 days
within 24 hours
on the scene
0 90
MIC LIC
HIC = high-income countries; MIC = middle-income countries; LIC = low-income countries
Number of countries
29
The extent of underreporting is also influencedby:• the sector that records the
information;• theproportionofcrashes involving
vulnerable road users (in manycountries these types of crashes are morelikelytobeunderreported);
• poororabsentlinksbetweenpolice,transport and health service data,whichmeansthatfiguresforpeoplewhodieafteradmissiontohospitalmaynotbereflected;
• exemptions from reporting certaincrashes, such as those involvingnon-motorized ormilitary vehicles;and
• whether sampling strategies areemployed and extrapolated.
Finally,animportantfactorinthequalityofacountry’shealthdataingeneralisthe equality of access of its people tohealth care facilities.
One way of improving this problemis to link data sources. Studies haveshown higher levels of underreporting
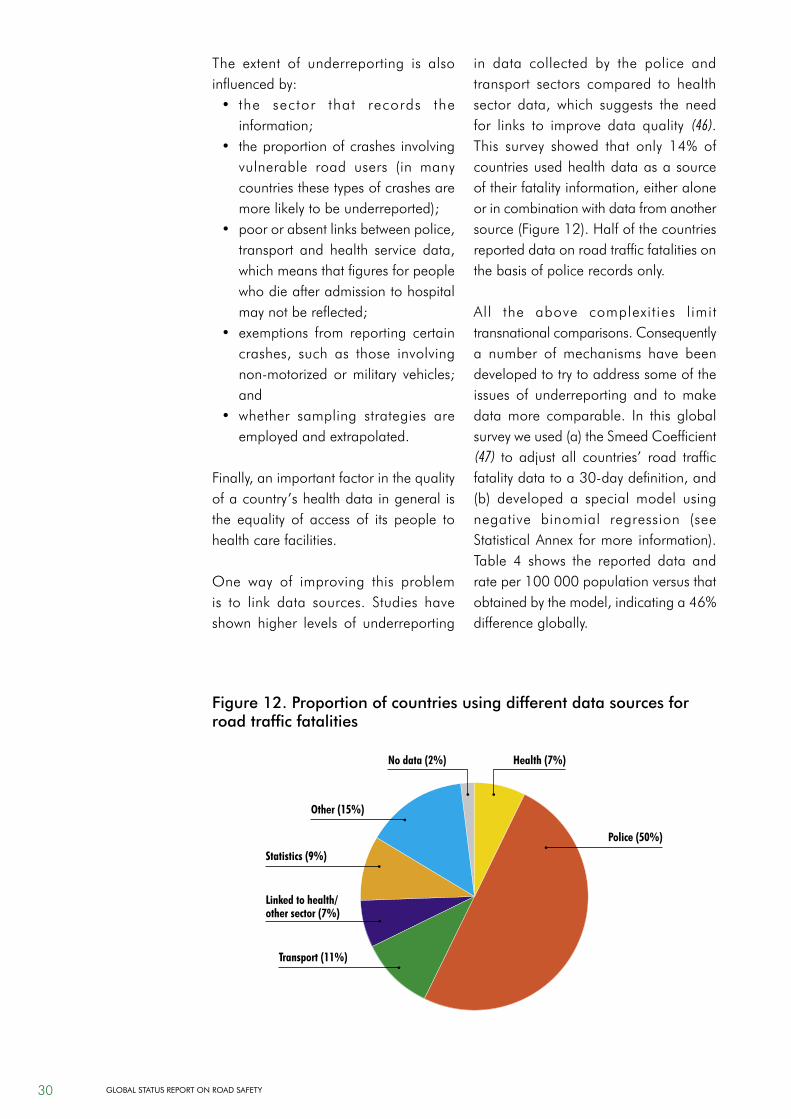
in data collected by the police and transport sectors compared to health sector data, which suggests the needfor links to improve data quality (46). This survey showed that only 14% ofcountries used health data as a source oftheirfatalityinformation,eitheraloneorincombinationwithdatafromanothersource(Figure12).Halfofthecountriesreported data on road traffic fatalities on the basis of police records only.
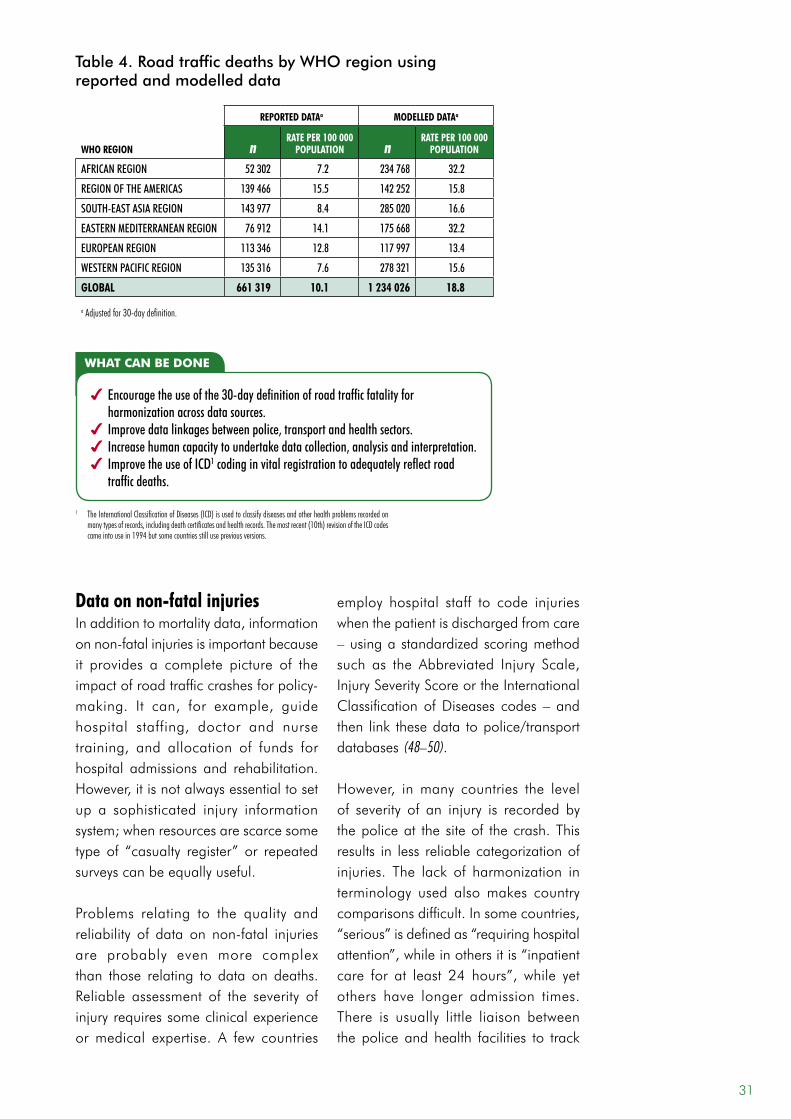
All the above complexities limit transnationalcomparisons.Consequentlya number of mechanisms have been developed to try to address some of the issues of underreporting and tomakedata more comparable. In this global surveyweused(a)theSmeedCoefficient(47) to adjust all countries’ road trafficfatalitydatatoa30-daydefinition,and(b) developed a special model usingnegative binomial regression (seeStatisticalAnnex formore information).Table 4 shows the reported data andrateper100000populationversusthatobtainedbythemodel,indicatinga46%difference globally.
Figure 12. Proportion of countries using different data sources for road traffic fatalities
health (7%)
police (50%)
linked to health/other sector (7%)
other (15%)
transport (11%)
statistics (9%)
no data (2%)
30 Global StatuS RepoRt on Road Safety
data on non-fatal injuriesInadditiontomortalitydata,informationonnon-fatalinjuriesisimportantbecauseit provides a complete picture of the impactofroadtrafficcrashesforpolicy-making. It can, for example, guidehospital staffing, doctor and nursetraining, and allocation of funds forhospital admissions and rehabilitation. However,itisnotalwaysessentialtosetup a sophisticated injury information system;whenresourcesarescarcesometype of “casualty register” or repeated surveyscanbeequallyuseful.
Problems relating to the quality andreliability of data on non-fatal injuriesare probably even more complex than those relating to data on deaths. Reliable assessment of the severity of injuryrequiressomeclinicalexperienceormedical expertise. A few countries
employ hospital staff to code injuries whenthepatientisdischargedfromcare–usingastandardizedscoringmethodsuch as the Abbreviated Injury Scale,InjurySeverityScoreortheInternationalClassificationofDiseases codes – andthen link thesedata topolice/transportdatabases (48–50).
However, inmany countries the levelof severity of an injury is recorded by the police at the site of the crash. This results in less reliable categorization of injuries. The lack of harmonization interminology used alsomakes countrycomparisonsdifficult.Insomecountries,“serious”isdefinedas“requiringhospitalattention”,whileinothersitis“inpatientcare for at least 24 hours”, while yetothers have longer admission times. There is usually little liaison betweenthepoliceandhealth facilities to track
reported dataa Modelled dataa
who region nrate per 100 000
population nrate per 100 000
population
AFRICAN REgION 52 302 7.2 234 768 32.2
REgION OF THE AMERICAS 139 466 15.5 142 252 15.8
SOUTH-EAST ASIA REgION 143 977 8.4 285 020 16.6
EASTERN MEDITERRANEAN REgION 76 912 14.1 175 668 32.2
EUROPEAN REgION 113 346 12.8 117 997 13.4
WESTERN PACIFIC REgION 135 316 7.6 278 321 15.6
global 661 319 10.1 1 234 026 18.8
a Adjusted for 30-day definition.
Table 4. Road traffic deaths by WHO region using reported and modelled data
what can be done
4 Encourage the use of the 30-day definition of road traffic fatality for harmonization across data sources.
4 Improve data linkages between police, transport and health sectors.4 Increase human capacity to undertake data collection, analysis and interpretation.4 Improve the use of ICD1 coding in vital registration to adequately reflect road
traffic deaths.
1 The International Classification of Diseases (ICD) is used to classify diseases and other health problems recorded on many types of records, including death certificates and health records. The most recent (10th) revision of the ICD codes came into use in 1994 but some countries still use previous versions.
31
howlongapatient isadmittedforandso the category of serious can range from a few cuts and bruises to severeheadinjuries.Tocompoundthis,inmosthigh-incomecountriesthoseinvolvedinacrashwithanytypeofinjuryareusuallyseen in an accident and emergency room for insurance purposes, while in low-income andmiddle-income countriesthisdependsonaccesstocare,agoodpre-hospitalcaresystem,finances,andothervariables(seeBox4).
Thissurveyshoweda1:20ratiobetweendeaths and severe injuries. If thiswereapplied to the global total of 1.27 million deaths,itwouldmeanthatapproximately25.4millionpeopleareinjuredseverelyenough to be seen in an emergency room. This supports previous estimates ofthetotalnumberofnon-fatalinjuries(allseveritylevels)asbetween20and50million (4, 7).
The majority of
countries do not
have robust data on
non-fatalroadtraffic
injuries.
what can be done
4 The data collected by the health sector need to be improved. This is particularly true with regard to data on non-fatal injuries. This can take the form of discharge data using ICD coding, injury surveillance systems or, where this is not feasible, intermittent surveys or “casualty registers” which collect only minimum data (51).
4 There is a need for standard definitions of levels of severity of non-fatal injuries to allow them to be accurately recorded and collated. The definitions should be simple enough to be administered by both health and non-health personnel.
4 Countries should be encouraged to link all data sources on road traffic injuries in order to help address underreporting.
Photo
© M
. Kha
yesi/
WHO
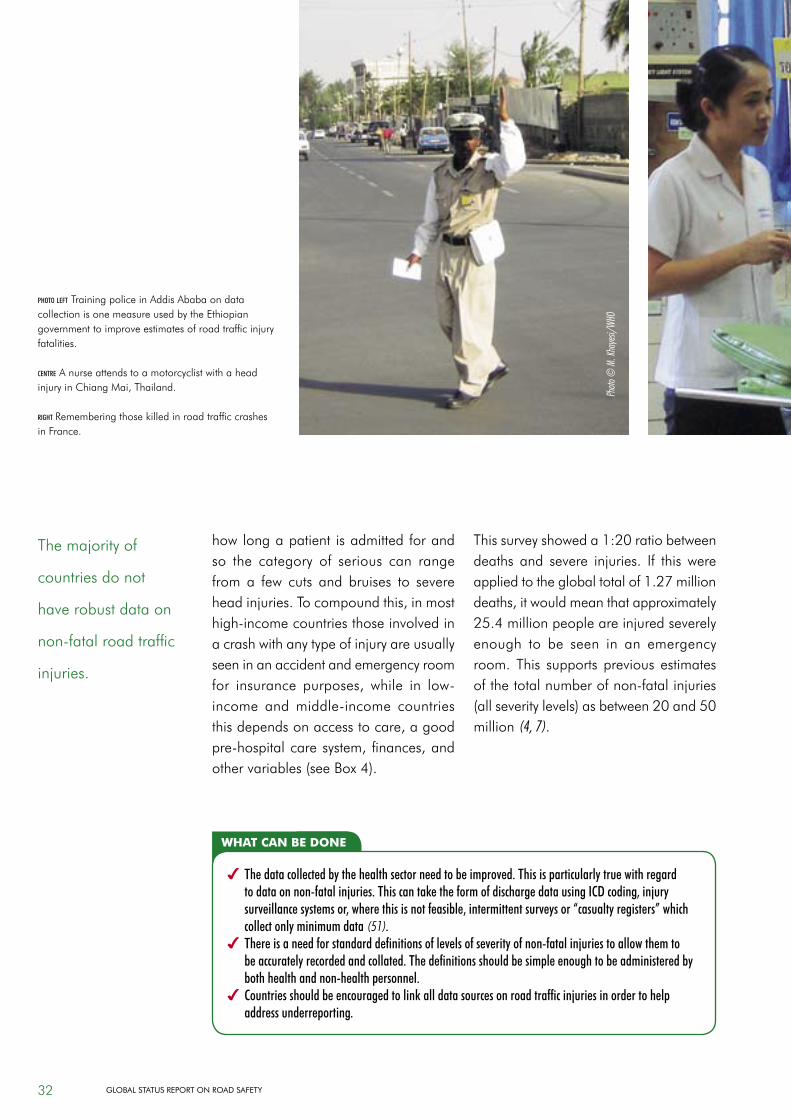
photo left Training police in Addis Ababa on data collectionisonemeasureusedbytheEthiopiangovernment to improve estimates of road traffic injury fatalities.
centre AnurseattendstoamotorcyclistwithaheadinjuryinChiangMai,Thailand.
right Rememberingthosekilledinroadtrafficcrashesin France.
32 Global StatuS RepoRt on Road Safety
Box 4: Pre-hospital care
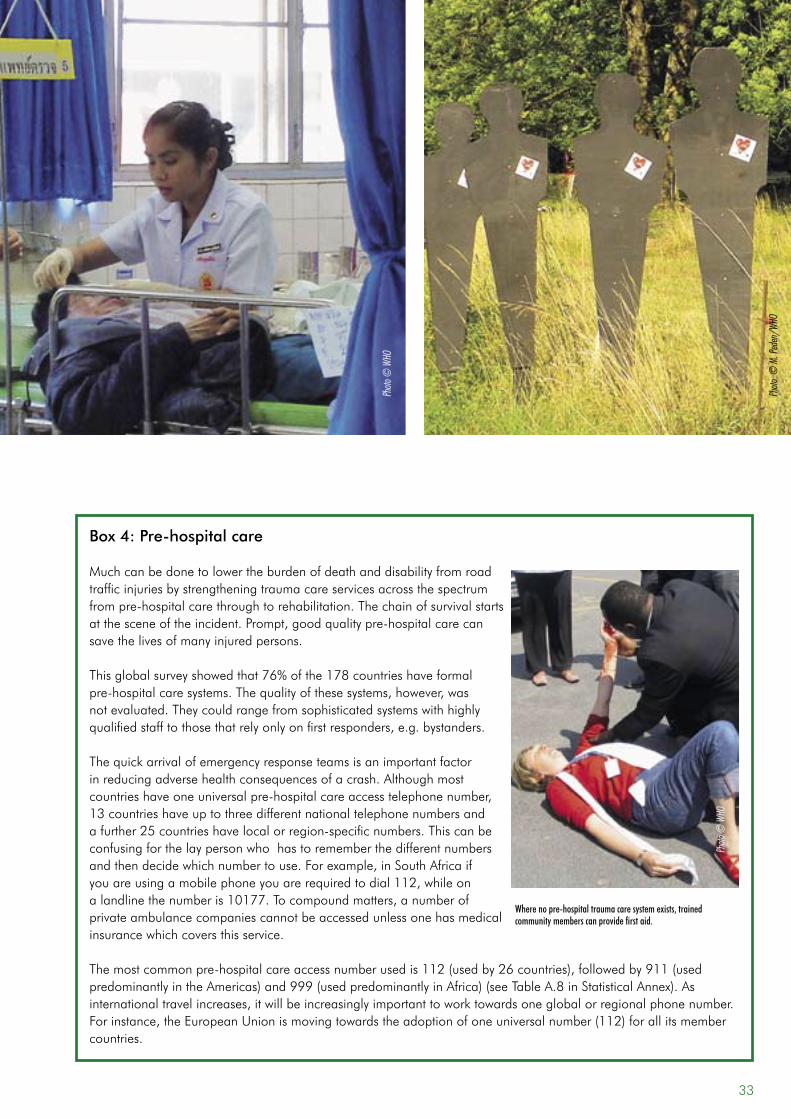
Muchcanbedonetolowertheburdenofdeathanddisabilityfromroadtraffic injuries by strengthening trauma care services across the spectrum frompre-hospitalcarethroughtorehabilitation.Thechainofsurvivalstartsatthesceneoftheincident.Prompt,goodqualitypre-hospitalcarecansave the lives of many injured persons.
Thisglobalsurveyshowedthat76%ofthe178countrieshaveformalpre-hospitalcaresystems.Thequalityofthesesystems,however,wasnotevaluated.Theycouldrangefromsophisticatedsystemswithhighlyqualifiedstafftothosethatrelyonlyonfirstresponders,e.g.bystanders.
Thequickarrivalofemergencyresponseteamsisanimportantfactorinreducingadversehealthconsequencesofacrash.Althoughmostcountrieshaveoneuniversalpre-hospitalcareaccesstelephonenumber,13countrieshaveuptothreedifferentnationaltelephonenumbersandafurther25countrieshavelocalorregion-specificnumbers.Thiscanbeconfusingforthelaypersonwhohastorememberthedifferentnumbersandthendecidewhichnumbertouse.Forexample,inSouthAfricaifyouareusingamobilephoneyouarerequiredtodial112,whileonalandlinethenumberis10177.Tocompoundmatters,anumberofprivate ambulance companies cannot be accessed unless one has medical insurancewhichcoversthisservice.
Themostcommonpre-hospitalcareaccessnumberusedis112(usedby26countries),followedby911(usedpredominantlyintheAmericas)and999(usedpredominantlyinAfrica)(seeTableA.8inStatisticalAnnex).Asinternationaltravelincreases,itwillbeincreasinglyimportanttoworktowardsoneglobalorregionalphonenumber.Forinstance,theEuropeanUnionismovingtowardstheadoptionofoneuniversalnumber(112)forallitsmembercountries.
Where no pre-hospital trauma care system exists, trained community members can provide first aid.
Photo
© W
HO
Photo
© W
HO
Photo
© M
. Ped
en/W
HO
33
deaths and injuries deaths only injuries only
other types of studies
countries reporting at least 1 study
who region n n n n nAFRICAN REgION 15 2 0 17
REgION OF THE AMERICAS 14 0 1 15
SOUTH-EAST ASIA REgION 6 1 7
EASTERN MEDITERRANEAN REgION 10 1 1 12
EUROPEAN REgION 25 2 27
WESTERN PACIFIC REgION 11 2 13
all 81 5 1 4 91
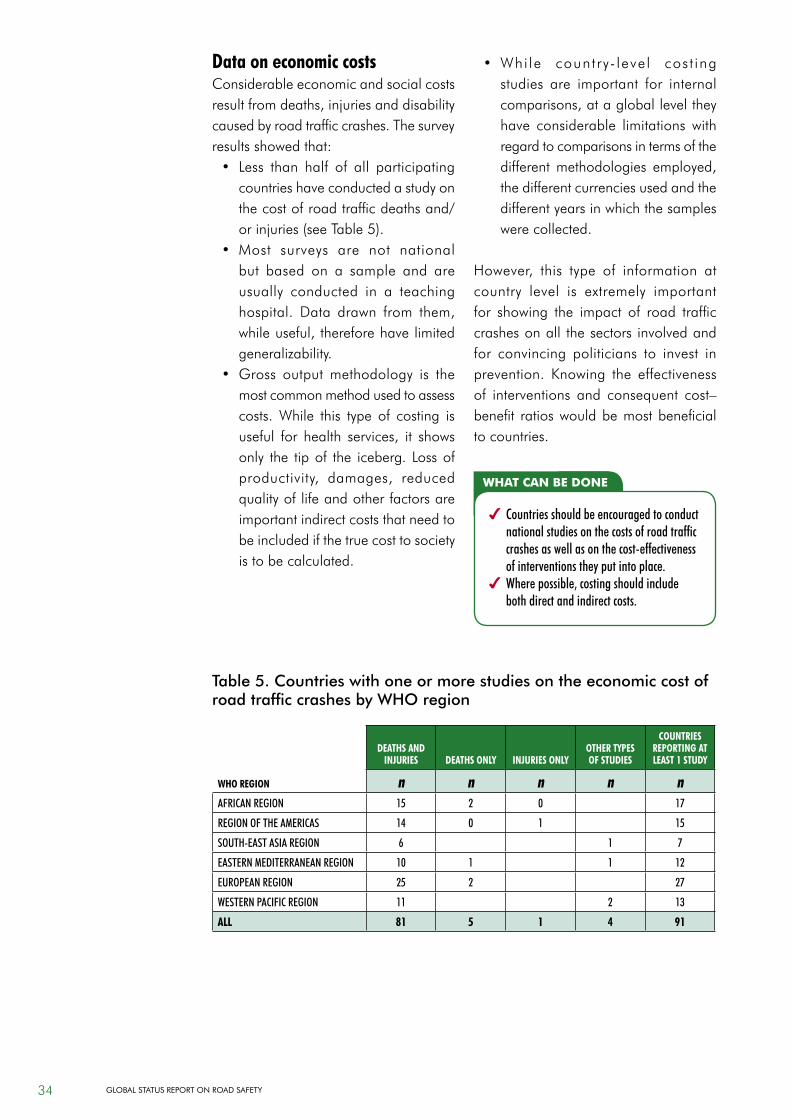
Table 5. Countries with one or more studies on the economic cost of road traffic crashes by WHO region
data on economic costsConsiderable economic and social costs resultfromdeaths,injuriesanddisabilitycaused by road traffic crashes. The survey resultsshowedthat:• Less than half of all participating
countries have conducted a study on thecostofroadtrafficdeathsand/orinjuries(seeTable5).
• Most surveys are not national but based on a sample and are usually conducted in a teaching hospital. Data drawn from them,whileuseful,thereforehavelimitedgeneralizability.
• Gross outputmethodology is themost common method used to assess costs. While this type of costing is useful for health services, it showsonly the tipof the iceberg. Lossofproductivity, damages, reducedqualityoflifeandotherfactorsareimportant indirect costs that need to be included if the true cost to society is to be calculated.
• Whi le country- level cost ingstudies are important for internal comparisons,atagloballeveltheyhave considerable limitations withregard to comparisons in terms of the differentmethodologies employed,the different currencies used and the differentyearsinwhichthesampleswerecollected.
However, this type of information atcountry level is extremely important for showing the impact of road trafficcrashes on all the sectors involved and for convincing politicians to invest in prevention. Knowing the effectivenessof interventions and consequent cost–benefit ratioswouldbemostbeneficialto countries.
what can be done
4 Countries should be encouraged to conduct national studies on the costs of road traffic crashes as well as on the cost-effectiveness of interventions they put into place.
4 Where possible, costing should include both direct and indirect costs.
34 Global StatuS RepoRt on Road Safety
who region low-incoMe Middle-incoMe high-incoMe total
AFRICAN REgIONa 9 2 — 11
REgION OF THE AMERICASb — 9 3 12
SOUTH-EAST ASIA REgIONa 2 2 — 4
EASTERN MEDITERRANEAN REgION 0 2 1 3
EUROPEAN REgION 1 11 21 33
WESTERN PACIFIC REgION 1 6 5 12
global 13 32 30 75
a No high-income countries.b No low-income countries.
Table 6. Countries with targets included in their road safety strategies by WHO region and income level
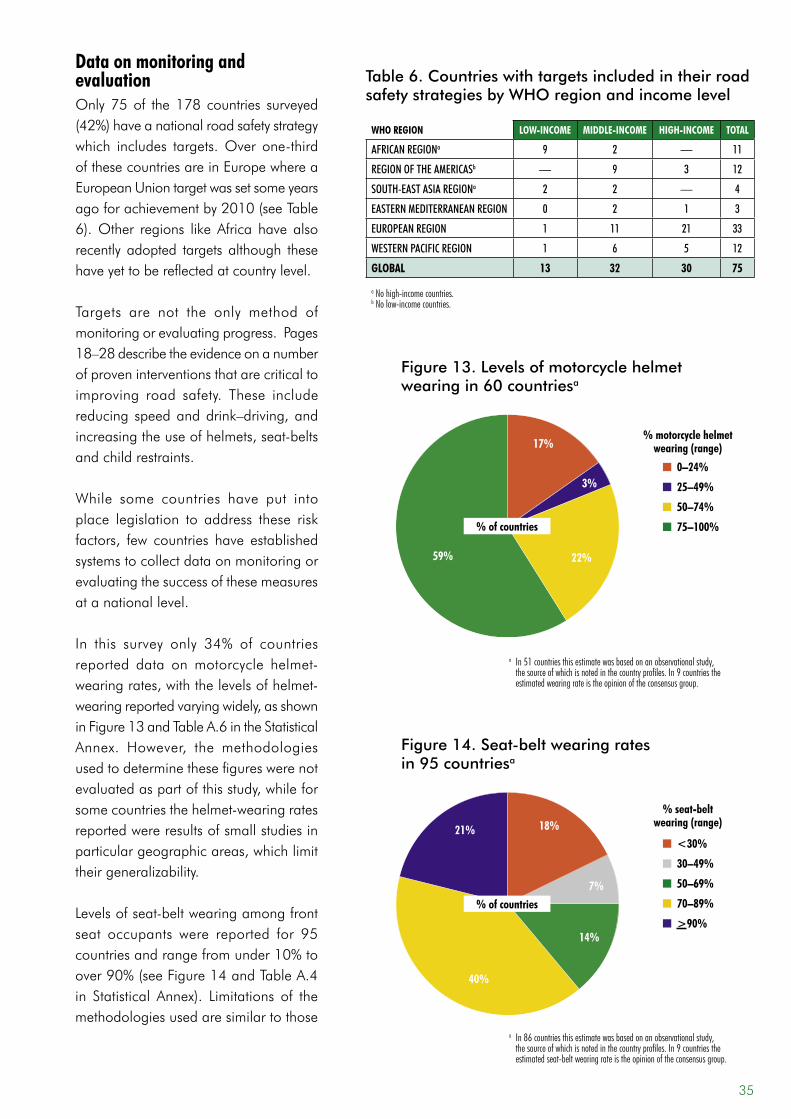
data on monitoring and evaluationOnly75of the178 countries surveyed(42%)haveanationalroadsafetystrategywhich includes targets.Over one-thirdofthesecountriesareinEuropewhereaEuropeanUniontargetwassetsomeyearsagoforachievementby2010(seeTable6).Other regions likeAfrica have alsorecently adopted targets although these have yet to be reflected at country level.
Targets are not the only method of monitoring or evaluating progress. Pages 18–28describetheevidenceonanumberof proven interventions that are critical to improving road safety. These include reducing speedanddrink–driving,andincreasingtheuseofhelmets,seat-beltsand child restraints.
While some countries have put into place legislation to address these riskfactors, few countries have establishedsystems to collect data on monitoring or evaluating the success of these measures at a national level.
In this survey only 34% of countriesreported data onmotorcycle helmet-wearingrates,withthelevelsofhelmet-wearingreportedvaryingwidely,asshowninFigure13andTableA.6intheStatisticalAnnex. However, the methodologiesusedtodeterminethesefigureswerenotevaluatedaspartofthisstudy,whileforsomecountriesthehelmet-wearingratesreportedwereresultsofsmallstudiesinparticulargeographicareas,whichlimittheir generalizability.
Levelsofseat-beltwearingamongfrontseat occupants were reported for 95countriesandrangefromunder10%toover90%(seeFigure14andTableA.4in Statistical Annex). Limitations of themethodologies used are similar to those
Figure 13. Levels of motorcycle helmet wearing in 60 countriesa
17%
3%
22%59%
n 0–24%
n 25–49%
n 50–74%
n 75–100%
a In 51 countries this estimate was based on an observational study, the source of which is noted in the country profiles. In 9 countries the estimated wearing rate is the opinion of the consensus group.
% of countries
% motorcycle helmet wearing (range)
Figure 14. Seat-belt wearing rates in 95 countriesa
21% 18%
14%
40%
7%
n <30%
n 30–49%
n 50–69%
n 70–89%
n >90%
% seat-belt wearing (range)
% of countries
a In 86 countries this estimate was based on an observational study, the source of which is noted in the country profiles. In 9 countries the estimated seat-belt wearing rate is the opinion of the consensus group.
35
what can be done
4 Countries need to step up efforts to collect robust data on a number of intermediate indicators that relate to road traffic injury prevention and that can be used for monitoring and evaluation research. These include:
• rates of helmet use;• rates of seat-belt use;• the proportion of drivers with blood alcohol concentration over the legal limit;• rates of child restraint use.
4 While high-income countries often use sophisticated survey methodology, basic helmet and seat-belt wearing surveys are relatively simple and cheap to conduct. Surveys are essential for comprehensive monitoring to take place.
4 These data are pivotal to making policy decisions based on evidence, and to evaluating measures that are put in place.
4 The health sector should play an important role in research related to risk factors.
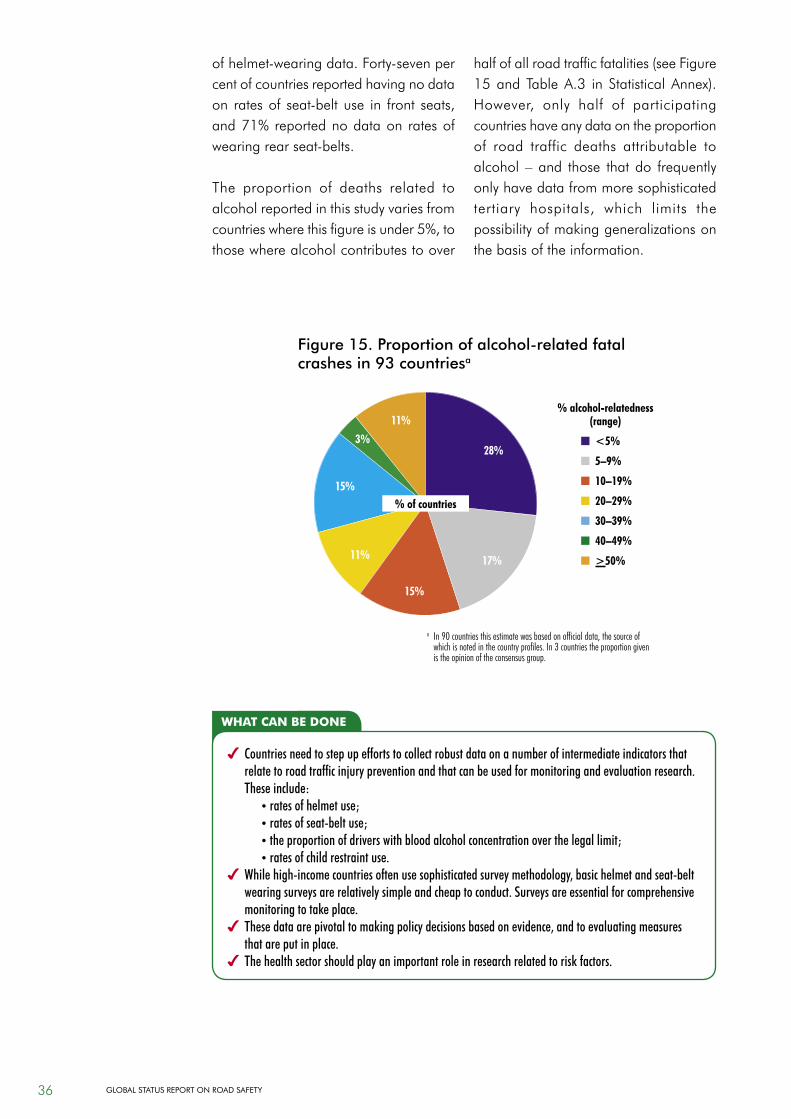
ofhelmet-wearingdata.Forty-sevenpercent of countries reported having no data on ratesof seat-beltuse in front seats,and71%reportednodataon ratesofwearingrearseat-belts.
The proportion of deaths related to alcohol reported in this study varies from countrieswherethisfigureisunder5%,tothosewherealcoholcontributestoover
halfofallroadtrafficfatalities(seeFigure15andTableA.3 in StatisticalAnnex).However, only half of participatingcountries have any data on the proportion of road traffic deaths attributable to alcohol –and those thatdo frequentlyonly have data from more sophisticated tertiary hospitals, which limits thepossibilityofmakinggeneralizationsonthe basis of the information.
Figure 15. Proportion of alcohol-related fatal crashes in 93 countriesa
11%
28%
15%
11% 17%
15%
3% n <5%
n 5–9%
n 10–19%
n 20–29%
n 30–39%
n 40–49%
n >50%
% alcohol-relatedness (range)
a In 90 countries this estimate was based on official data, the source of which is noted in the country profiles. In 3 countries the proportion given is the opinion of the consensus group.
% of countries
36 Global StatuS RepoRt on Road Safety