Embed Size (px)
Citation preview

1
The State of General Dental Practice in 2013
Research Report
November 2013

2
Contents
1. Executive summary
2. Introduction
3. Dental pilots and contract reform in England, Wales and Northern Ireland
4. Cuts in GDP remuneration in Northern Ireland and Scotland
5. NHS England launch
6. Number of dentists, surgeries and practices: NHS and private
7. Dental businesses
8. Demographics
9. Skill mix and direct access
10. Dental Patients
11. Dentists’ Earnings and Expenses 2011/12 UK
12. Practice expenses including staff pay and utility costs
13. Investment intentions and actual investment made in practices
14. Private dental care
15. Practice sales and values
16. Recruitment of general practice staff/associates
17. Retirement intentions of dentists
18. NHS contract information: contract values and UDA amounts
19. Dental foundation trainees, getting their first associate job
20. Associate underemployment
21. Practice owners’ and associates’ motivation and morale
22. Practice owners’ and associates’ wellbeing
23. Pension contributions and participation in the NHS pension scheme
24. Annex 1: Dental Business Trends research 2013
25. Annex 2: Dental Foundation Trainee Survey
26. Annex 3: FOIA to the BSA

3
1. Executive Summary
We estimate that there are 32,900 dentists working in general dental practice in the UK and
49,350 registered dental care professionals. Pilots for the reform of NHS dental contracts are well underway in England and more limited
pilots are taking place in Wales and Northern Ireland. We support the pilot process and it is
essential that there success can be properly evaluated. The transition from Primary Care Trusts to NHS England has got off to a difficult start for
NHS general dental practitioners. The 27 NHS England Area Teams seem to be under-
resourced and are not able to provide the same support to dental practices that they have
been used too. Local Dental Networks have been slow to get going and we hope that the
enthusiasm of dentists to take part in the networks and make a difference is not stifled. NHS dentists in Scotland and Northern Ireland are facing cuts in their allowances and in
Northern Ireland, a reduction in care available to NHS patients. This will have a negative
effect on dentists’ morale and motivation and ultimately damage patient care. The number of dentists working in general dental practice in the UK is increasing and with a
capped budget in all four countries average pay is decreasing. Whilst the majority of general
dental practitioners are still men, the proportion of women increases every year. Nearly a quarter of BDA member associates work for a limited company. This may be one of
the large chains or a smaller company. There are still a significant number of practices that have one dentist working there. In
England this amounts to 19 per cent of practices registered with the care quality commission
and 19 per cent of NHS contracts in England have one dentist attached to the contract. We
estimate that 39 per cent of single-dentist practices in the UK are completely private. We are concerned that single-dentist practices may have difficulties implementing new
contractual arrangements that need clinical IT systems, surgery space and skill-mix. Sixty
four per cent of single-dentist practices have one surgery and they are less likely to have a
clinical IT system. Nearly 40 per cent of general dental practitioners do not agree to patients having direct
access to dental hygienists and dental therapists within a dentist led team. Outside a dentist
led team the figure is 85 per cent. At present the use of dental hygienists and dental
therapists increases with practice size and private commitment. In England in the 24 months ending 31st March 2013, 56.1 per cent of the population was
seen by an NHS dentist (that is 29.8 million patients. In England and Wales the downward trend in dentists’ taxable income continued in 2011/12
with practice owner’s average taxable income being £112,800 (a drop of 3.8 per cent on
2010/11) and associates average taxable income was £61,800, a drop of 1.7 per cent. Overall
since 2009/10 average earnings have fallen for all dentists by 12.4 per cent. There are substantial differences in dentists’ earnings by region and country. Practice owners
in England earned an average of £114,000 in 2011/12 whilst those in Wales earned an
average of £90,400. Associates in England and Wales earned an average of £61,700 and
£62,800 respectively Practice owners in the former Yorkshire ad Humber Strategic Health
Authority area earned the highest taxable income of all SHAs earning £128,700, while those
in the South West SHA earned the lowest taxable income of£95,400. Associates in the
London SHA earned the lowest £55,900 while those in the North East SHA earned the highest
£66,800. For associates this reflects the labour market in London where there is competition

4
for associate posts. Associates with a high NHS commitment have seen their pay decline
most sharply since 2008/9.
The average Unit of Dental Activity (UDA) values for NHS dental contracts England in
2012/13 was £25.61 (about £12.50 net after average expenses are removed) but average
UDA values for associates are less (£10.81/UDA according to specialist dental accountants
Morris and Co).
Those practice owners who reported giving their dental nurses, dental hygienists and dental
therapists a pay rise in the last twelve months the median rise was 3 per cent tor all groups.
Average annual bills for water and electricity for dental practices rose by 24.6 per cent
between 2012 and 2013
Only half of practice owners reported planning to invest in 2012/13 but not all managed to
complete the planned investment. When investment did take place the cost was more than
was budgeted for.
Fifteen per cent of general dental practitioners are in fully private practice.
Using the proportion of BDA members reporting that they were exclusively private in
2010/2011 enables an estimate to be made of the size of the UK private dental market of
£4.191 billion in 2010/11. This is the latest available figure. This was a fall from £4.246
billion in 2009/10 and a further fall is expected for 2011/12. Anecdotally it appears that the
fall in demand for private care flattened in 2012/13
Recruitment of associates seems particularly difficult in Wales. Welsh associates have the
highest pay of any region which probably reflects their difficulty in recruiting. Practice owner
pay in Wales is much lower than that in the other countries. Welsh practice owners seem to
be paying themselves less in order to engage associates to help meet their UDA targets.
Overall nearly seven per cent of BDA member GDPs in the UK reported having active plans to
retire in the next twelve months. In England the figure was 11 per cent.
Reasons given for retirement (apart from age) reflect the prevailing issue of increasing
administration and regulation. Dentists enjoy clinical practice and patient care and many
find the regulatory burden very difficult to manage.
Practices with more than 11 dentists have the highest £/UDA value.
The largest practices provide more urgent care than other practices. This could be due to their
location, as large practices are more likely to be based in heavily urban populations where
patients may be likely to attend for urgent treatment only.
Overall DFTs did seem to manage to find a first associate job. Some had to look further
afield than their preferred location. Of all UK graduates in 2012, 9 per cent were unemployed
compared to 12 per cent of respondents to our FT survey. This is concerning.
On average, associate dentists providing some NHS care in 2011/12 in England and Wales
earned 55 per cent of the amount that an average practice owner providing NHS care
earned. We found that 25 per cent of associates worked in more than one practice.
Using the International Labour Organisation’s definition of underemployment, 55 out of 545
associates met the criteria giving 10 per cent of respondents were unemployed. Fourteen per
cent is probably a more accurate figure. We will monitor this trend going forward, dentists
are very expensive to train and a great many people in the UK could benefit from their skills
to tackle the serious levels of dental disease in some populations. Thirty six per cent of GDPs rate their morale as a dentist as high or very high with 32 per cent
as low or very low. Only 32 per cent would recommend a career as a dentist

5
In relation to the general population BDA GDP members seem to have slightly lower
wellbeing than the rest of the population. In keeping with the national trend, however, those
aged between 45 and 54 reported the lowest levels of satisfaction, feeling their life is
worthwhile and happiness. They also had the highest levels of anxiety. This could be down to
the stresses and pressures of practice ownership and falling incomes taking more of a toll on
this age group. Anxiety is greatest in Northern Ireland and this could be caused by the
increasing uncertainty that dentists perceive in their businesses as a result of changes being
introduced by the government in Northern Ireland.
Patient care and pay are strong motivating factors for general dental practitioners. Pay is not
surprising given that the vast majority are self-employed and are paid according to the
volume of work that they do.
In 2008 following a major review of the NHS Pension Scheme, tiered contribution rates were
introduced for the first time. The initial contribution rates were five per cent, 6.5 per cent, 7.5
per cent and 8.5 per cent. The rates reflected annual pensionable pay. Most dentists found
themselves in either the 6.5 per cent or 7.5 per cent pay bands.
Dentists who were paying member contribution rates of six per cent prior to the review in
2008 could be paying 13.5 per cent by 2015: an increase of 125 per cent over a seven-year
period.
2. Introduction
2.1 The British Dental Association is the professional association and trade union for dentists in the UK.
We have over 18,000 members in all spheres of dental practice including general dental practice,
salaried dental services, hospital dentistry, university teaching and research, the armed forces and
dental students.
2.2 We estimate that there are 32,900 dentists working in general dental practice in the UK and 49,350
registered dental care professionals. This report provides a comprehensive picture of how general
dental practice is doing in 2013 to inform the Review Body on Doctors’ and Dentists’ Remuneration
and also the dental community. The challenges general practitioners face in running small
businesses in a recession, government austerity and with increasing regulation and increasingly
high public expectations, are huge. Nevertheless they continue to provide high quality care to their
patients and comply with everything that is expected of them.
2.3 The report contains our findings from the 2013 BDA Dental Business Trends survey and also
contains information from published sources including a Freedom of Information request to the
NHS Business Services Authority. Where information is not yet available for this year we have used
the nearest available year.
2.4 A report has also been produced for the salaried primary dental care service and it can be found on
the BDA website www.bda.org.
3. Dental pilots and contract reform in England, Wales and Northern Ireland
3.1 The Department of Health (DH) in England is testing elements of a registration and capitation model for a reformed contract for NHS general dental practice. Since 2011, 70 pilot sites in
England have been testing one of three different models. A new system of care pathways has been
6
drawn up and practitioners have to use an IT based clinical decision support system. The pathways
are based on prevention and encourage the use of skill mix.
3.2 On 23 January 2013 the Department of Health announced the shortlist of 28 new dental practices to take part in the pilots starting in spring/summer 2013. The practices have joined the existing 70 pilot practices testing how different elements of the new contract might work together.
3.3 The capitation scheme currently being tested is based on age, gender and the level of social deprivation associated with the postcode of each patient but exact details of the final model have not been decided.
3.4 The first two years of piloting have demonstrated the complexities of such fundamental change to the contract and reinforced the need for careful testing and development.
3.5 The BDA has undertaken several workshops and one-to-one interviews with pilot sites which have
provided interesting feedback. Patients are, in the main, positive about the new system, whereas practitioner feedback is more mixed. Key feedback themes have been: increased waiting times and
the impact on NHS access; concerns about associate status; the reliance on IT and; the potential for the replacement of dentists with dental therapists. These early issues aside, practitioners have told us that they like the preventive approach and that this model represents a return to the style of dentistry they were taught at dental school.
3.6 The DH has made some amendments to the care pathway being used in the pilots, and the IT systems. To bring the pilots in line with non-pilot practices, a patient charge will now be levied for
the interim care appointments when a new FP17 is generated for new treatment. The pilot sites are testing a self-care plan based on a traffic light system, which sees patients advised on how to improve their oral health in the long term.
3.7 The dental pilots in Wales are continuing. They have shown a change in working patterns and the
pilot that involved only child patients was dropped as being too complicated to work alongside a
UDA scheme for adults. Early indications had shown that oral health for these children was
improving, however.
3.8 Limited progress has been made in Northern Ireland on the new GDS contract arrangements with a
limited pilot of the smallest strand of the new contract, that of oral surgery. This pilot began in April
2013 and will run for 6 months. BDA was heavily involved, working with the Health and Social Care
Board to get the pilot operational, and we await the evidence from the pilot. The focus of the pilot
is to look at ensuring that oral surgery cases are treated in the most appropriate setting. It is
focussed on the Southern Local Commissioning Area within Northern Ireland.
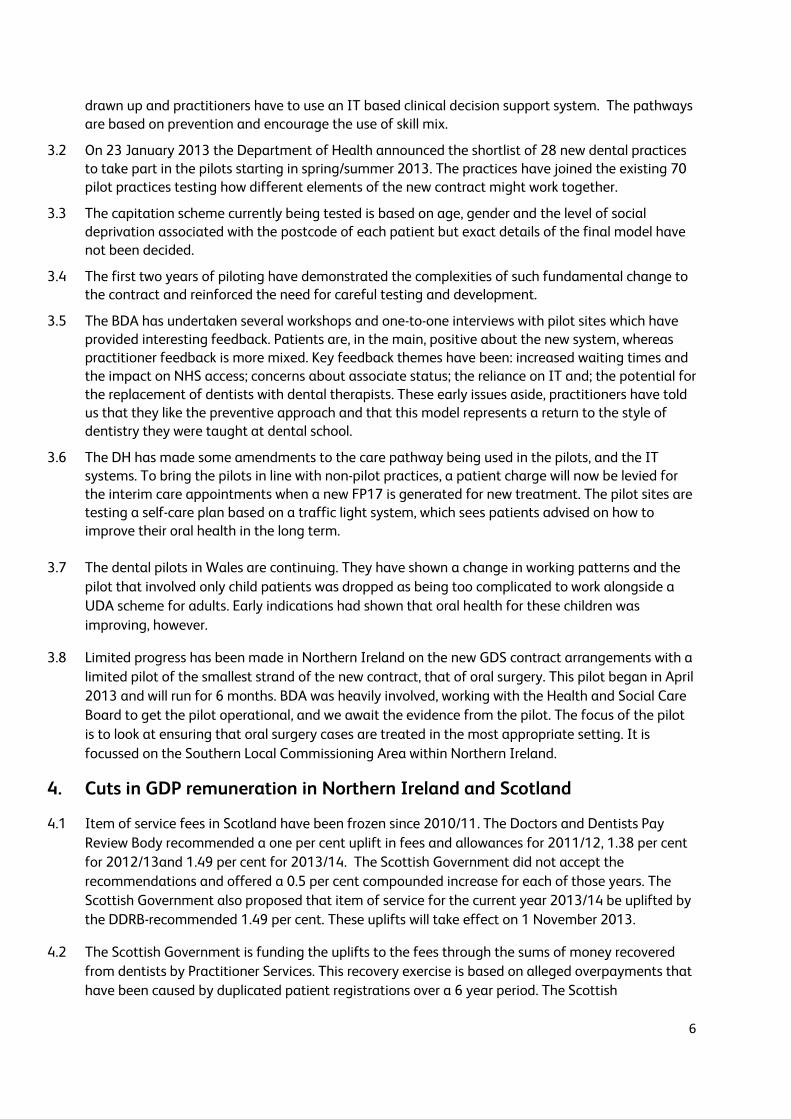
4. Cuts in GDP remuneration in Northern Ireland and Scotland
4.1 Item of service fees in Scotland have been frozen since 2010/11. The Doctors and Dentists Pay
Review Body recommended a one per cent uplift in fees and allowances for 2011/12, 1.38 per cent
for 2012/13and 1.49 per cent for 2013/14. The Scottish Government did not accept the
recommendations and offered a 0.5 per cent compounded increase for each of those years. The
Scottish Government also proposed that item of service for the current year 2013/14 be uplifted by
the DDRB-recommended 1.49 per cent. These uplifts will take effect on 1 November 2013.
4.2 The Scottish Government is funding the uplifts to the fees through the sums of money recovered
from dentists by Practitioner Services. This recovery exercise is based on alleged overpayments that
have been caused by duplicated patient registrations over a 6 year period. The Scottish
7
Government also proposes to fund the uplifts by placing a cap on the General Dental Practice
Allowance of £80,000.
4.3 Due to a an overspend in the dental budget in Northern Ireland caused by an increase in the
amount of NHS care that is being provided, the Department of Health and Social Care in Northern
Ireland consulted on proposals to reduce the availability of some items of treatment available to
patients and cut some allowances received by dentists such as payments for NHS commitment.
5. NHS England launch
5.1 NHS England took over the commissioning of primary and secondary dental care services in April
2013. It has been a mixed start. General dental contractors have continued to be paid and so
general practice NHS dentistry is still available to the public. However there are fewer dental
commissioning staff available and those that are there are sometimes new to their posts. This has
contributed to stress for dentists and frustration for Local Dental Committees.
5.2 Some services that general practitioners previously had access to have been withdrawn such as
translation services for patients who can’t speak English and occupational health services for
dentists and their staff. These services are vital and practitioners would not expect to pay for them.
All of these changes are cost saving in nature but increase practice costs and chip away at dentists’
motivation and morale.
5.3 One hope of the profession was that once PCTs were abolished, NHS England would produce
uniform and clear policies for dental commissioning based on best practice. In April six basic
policies were produced following input from the BDA. The policies were still not correct and it was
difficult to get changes made. Even worse some Area Teams decided that they wanted to produce
policy variations and at the time of writing BDA members are still experiencing problems when
trying to incorporate their businesses and with end of year processes. We hope that these initial
teething troubles will be sorted out soon.
5.4 NHS England’s big new idea for primary care services was the creation of Local Professional
Networks or Local Dental Networks in the case of dentistry. These committees were to consist of an
appointed chair and members who would represent all branches of dentists providing services in the
area covered by the Area Team. Their role is to improve commissioning and provide clinical
leadership. So far progress has been slower than we would have liked due to organisational inertia
and lack of funding. However we hope that by early next year they will all be working well and
making a real difference for patient care locally.
5.5 Local Dental Committees represent local primary care dentists in their areas. NHS England can
recognise them and arrange for collection of individual levies from dentists to be collected and
passed on to the committees. This has always occurred but because of changing administrative
arrangements in the transition between PCTs and NHS England there have been delays with levy
collection. We hope that these can be sorted out to prevent a crisis in funding.
8
6. Number of dentists, surgeries and practices: NHS and private
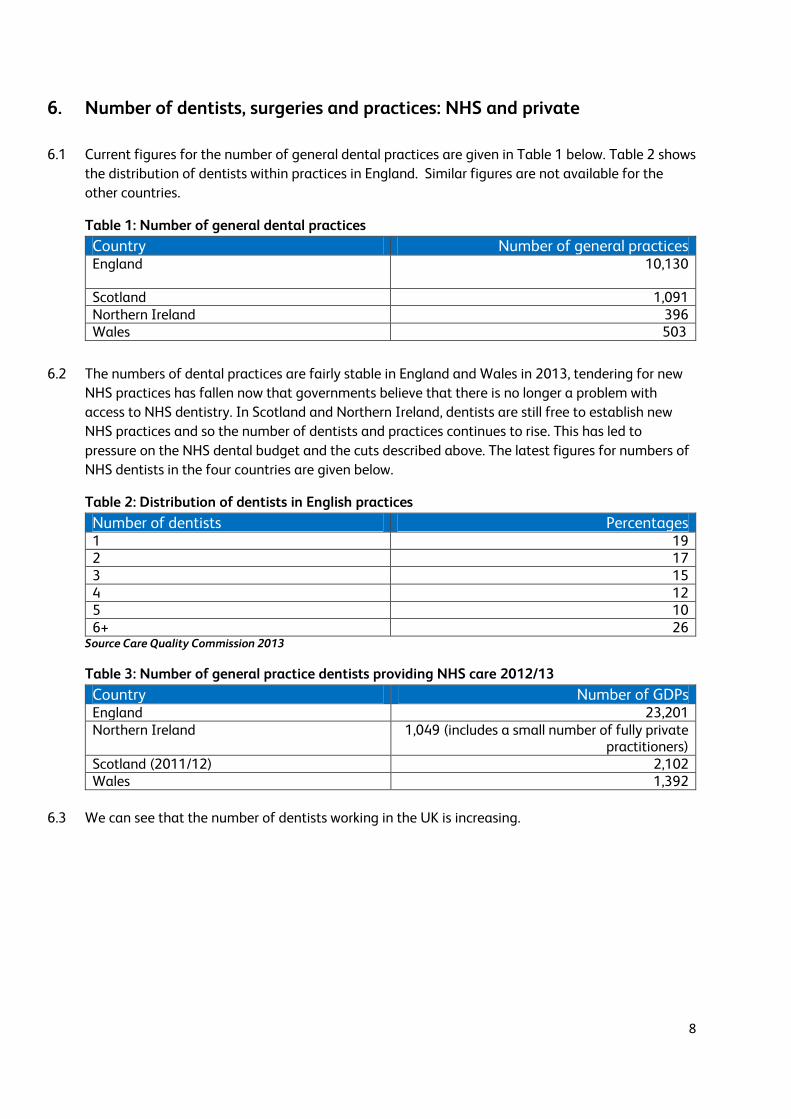
6.1 Current figures for the number of general dental practices are given in Table 1 below. Table 2 shows
the distribution of dentists within practices in England. Similar figures are not available for the
other countries.
Table 1: Number of general dental practices Country Number of general practices England 10,130
Scotland 1,091 Northern Ireland 396 Wales 503
6.2 The numbers of dental practices are fairly stable in England and Wales in 2013, tendering for new
NHS practices has fallen now that governments believe that there is no longer a problem with
access to NHS dentistry. In Scotland and Northern Ireland, dentists are still free to establish new
NHS practices and so the number of dentists and practices continues to rise. This has led to
pressure on the NHS dental budget and the cuts described above. The latest figures for numbers of
NHS dentists in the four countries are given below.
Table 2: Distribution of dentists in English practices Number of dentists Percentages 1 19 2 17 3 15 4 12 5 10 6+ 26
Source Care Quality Commission 2013
Table 3: Number of general practice dentists providing NHS care 2012/13 Country Number of GDPs England 23,201 Northern Ireland 1,049 (includes a small number of fully private
practitioners) Scotland (2011/12) 2,102 Wales 1,392
6.3 We can see that the number of dentists working in the UK is increasing.
9
Table 4: number of dentists with NHS activity 2006/7-2011/12 England (NHS HSCIC 2012)
Dentists 2006/07 2007/08 2008/09 2009/10 2010/11 2011/12 2012/13 Dentist 20,160 20,815 21,343 22,003 22,799 22,920 23,201 Joiners - 1,709 1,803 1,899 1,955 1,715 1,693 Leavers 1,054 1,275 1,239 1,159 1,594 1,412 - Net change from previous year
- 655 528 660 796 121 281
% change from previous year
- 3.2 2.5 3.1 3.6 0.5 1.2
Source HSCIC NHS Dental Statistics for England 2012/13
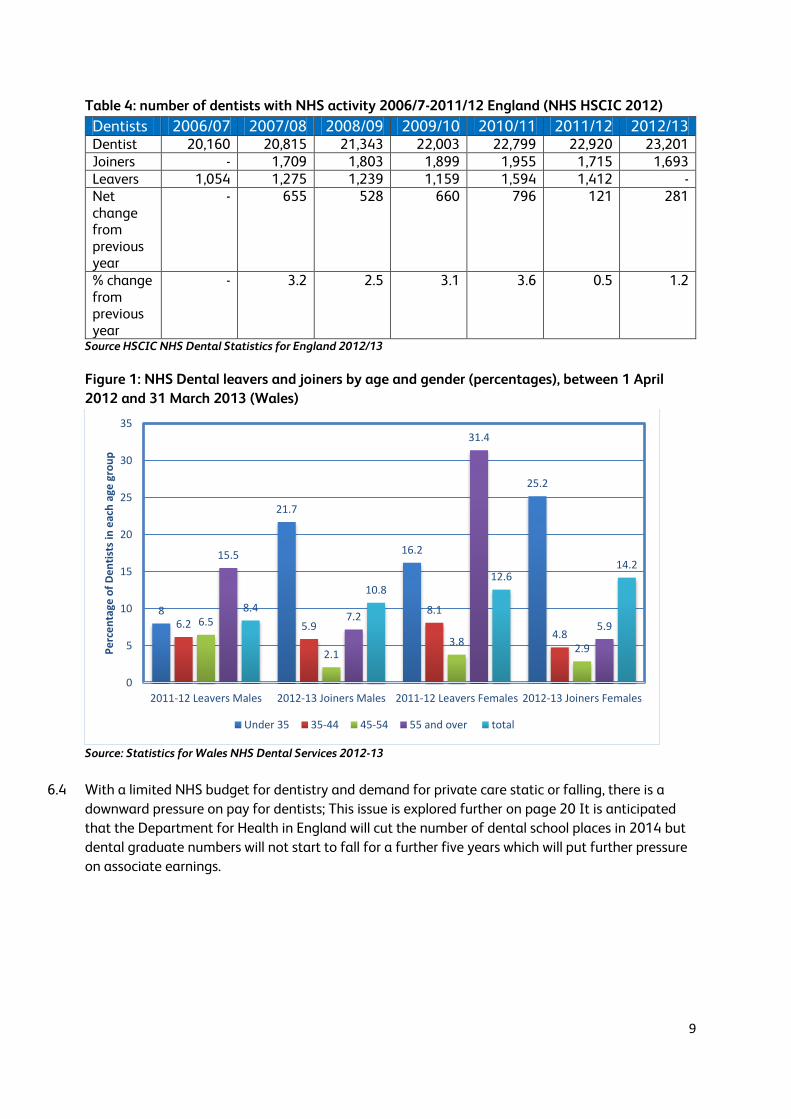
Figure 1: NHS Dental leavers and joiners by age and gender (percentages), between 1 April
2012 and 31 March 2013 (Wales)
Source: Statistics for Wales NHS Dental Services 2012-13
6.4 With a limited NHS budget for dentistry and demand for private care static or falling, there is a
downward pressure on pay for dentists; This issue is explored further on page 20 It is anticipated
that the Department for Health in England will cut the number of dental school places in 2014 but
dental graduate numbers will not start to fall for a further five years which will put further pressure
on associate earnings.
8
21.7
16.2
25.2
6.2 5.9
8.1
4.86.5
2.13.8
2.9
15.5
7.2
31.4
5.9
8.4
10.812.6
14.2
0
5
10
15
20
25
30
35
2011-12 Leavers Males 2012-13 Joiners Males 2011-12 Leavers Females 2012-13 Joiners Females
Pe
rce
nta
ge o
f D
en
tist
s in
eac
h a
ge g
rou
p
Under 35 35-44 45-54 55 and over total
10
7. Dental businesses
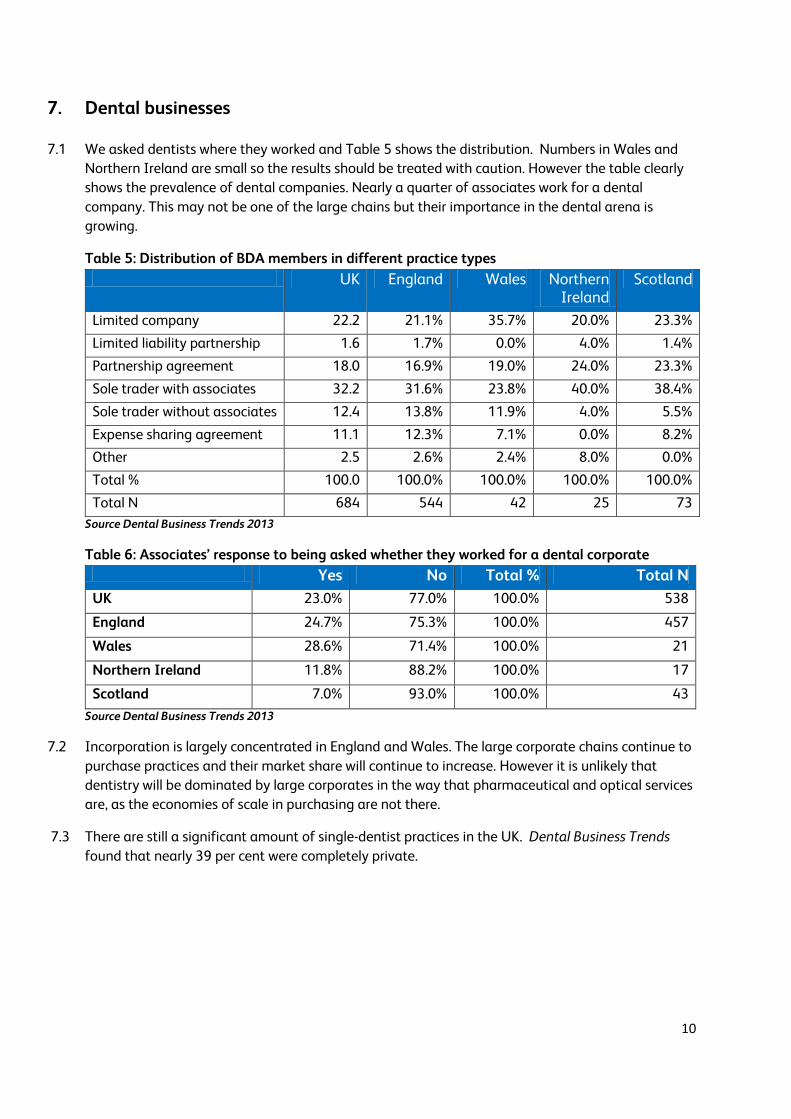
7.1 We asked dentists where they worked and Table 5 shows the distribution. Numbers in Wales and
Northern Ireland are small so the results should be treated with caution. However the table clearly
shows the prevalence of dental companies. Nearly a quarter of associates work for a dental
company. This may not be one of the large chains but their importance in the dental arena is
growing.
Table 5: Distribution of BDA members in different practice types
UK England Wales Northern Ireland
Scotland
Limited company 22.2 21.1% 35.7% 20.0% 23.3%
Limited liability partnership 1.6 1.7% 0.0% 4.0% 1.4%
Partnership agreement 18.0 16.9% 19.0% 24.0% 23.3%
Sole trader with associates 32.2 31.6% 23.8% 40.0% 38.4%
Sole trader without associates 12.4 13.8% 11.9% 4.0% 5.5%
Expense sharing agreement 11.1 12.3% 7.1% 0.0% 8.2%
Other 2.5 2.6% 2.4% 8.0% 0.0%
Total % 100.0 100.0% 100.0% 100.0% 100.0%
Total N 684 544 42 25 73
Source Dental Business Trends 2013
Table 6: Associates’ response to being asked whether they worked for a dental corporate
Yes No Total % Total N
UK 23.0% 77.0% 100.0% 538
England 24.7% 75.3% 100.0% 457
Wales 28.6% 71.4% 100.0% 21
Northern Ireland 11.8% 88.2% 100.0% 17
Scotland 7.0% 93.0% 100.0% 43
Source Dental Business Trends 2013
7.2 Incorporation is largely concentrated in England and Wales. The large corporate chains continue to
purchase practices and their market share will continue to increase. However it is unlikely that
dentistry will be dominated by large corporates in the way that pharmaceutical and optical services
are, as the economies of scale in purchasing are not there.
7.3 There are still a significant amount of single-dentist practices in the UK. Dental Business Trends
found that nearly 39 per cent were completely private.
11
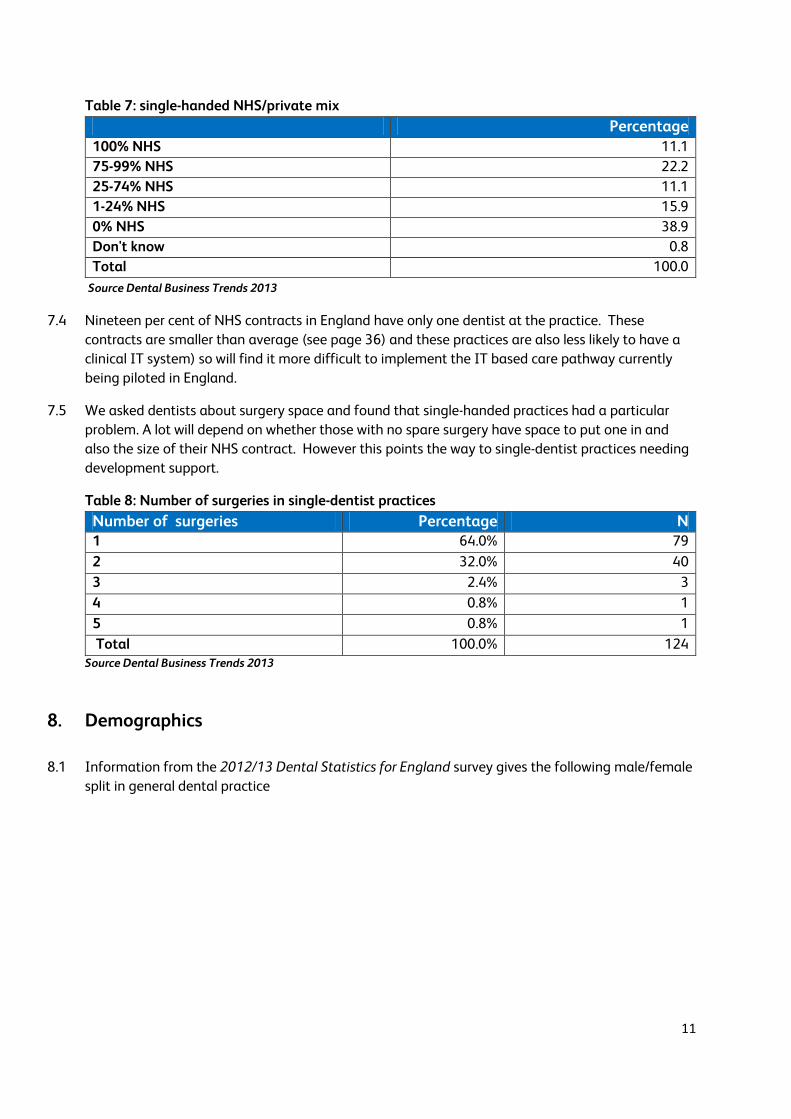
Table 7: single-handed NHS/private mix
Percentage 100% NHS 11.1
75-99% NHS 22.2
25-74% NHS 11.1
1-24% NHS 15.9
0% NHS 38.9
Don't know 0.8
Total 100.0
Source Dental Business Trends 2013
7.4 Nineteen per cent of NHS contracts in England have only one dentist at the practice. These
contracts are smaller than average (see page 36) and these practices are also less likely to have a
clinical IT system) so will find it more difficult to implement the IT based care pathway currently
being piloted in England.
7.5 We asked dentists about surgery space and found that single-handed practices had a particular
problem. A lot will depend on whether those with no spare surgery have space to put one in and
also the size of their NHS contract. However this points the way to single-dentist practices needing
development support.
Table 8: Number of surgeries in single-dentist practices
Number of surgeries Percentage N 1 64.0% 79
2 32.0% 40
3 2.4% 3
4 0.8% 1
5 0.8% 1
Total 100.0% 124 Source Dental Business Trends 2013
8. Demographics
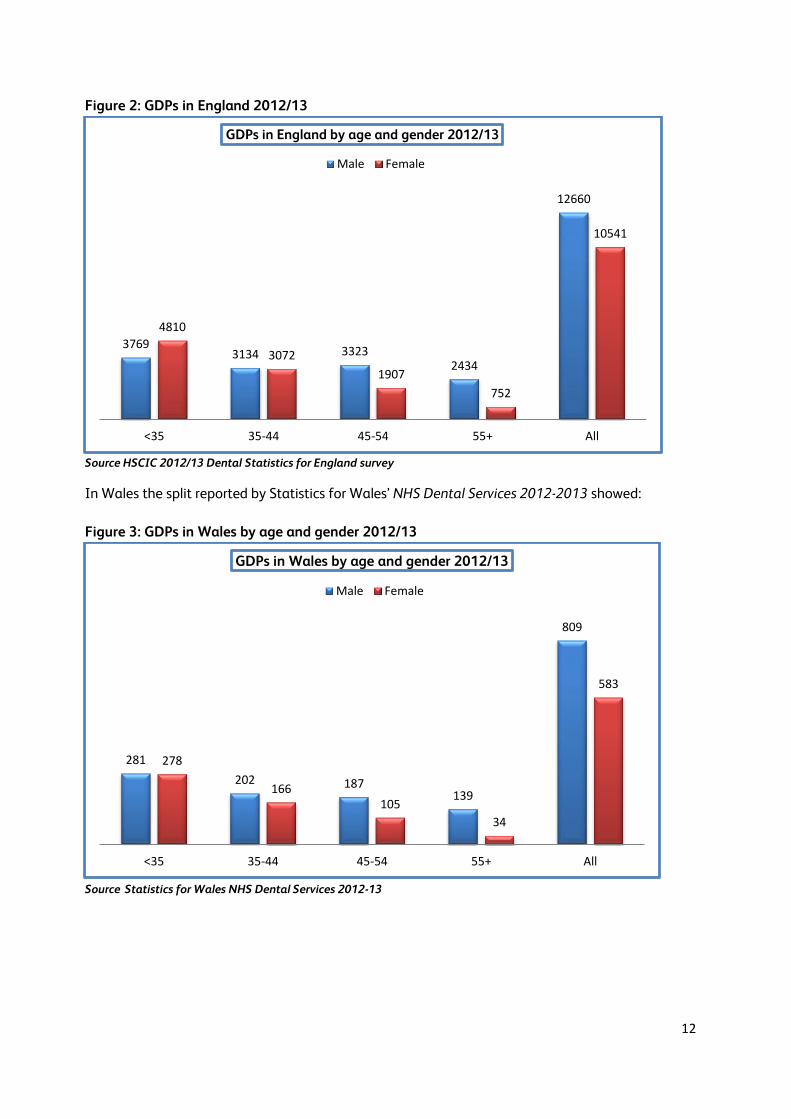
8.1 Information from the 2012/13 Dental Statistics for England survey gives the following male/female
split in general dental practice
12
Figure 2: GDPs in England 2012/13
Source HSCIC 2012/13 Dental Statistics for England survey
In Wales the split reported by Statistics for Wales’ NHS Dental Services 2012-2013 showed:
Figure 3: GDPs in Wales by age and gender 2012/13
Source Statistics for Wales NHS Dental Services 2012-13
37693134 3323
2434
12660
4810
3072
1907
752
10541
<35 35-44 45-54 55+ All
GDPs in England by age and gender 2012/13
Male Female
281
202 187139
809
278
166105
34
583
<35 35-44 45-54 55+ All
GDPs in Wales by age and gender 2012/13
Male Female
13
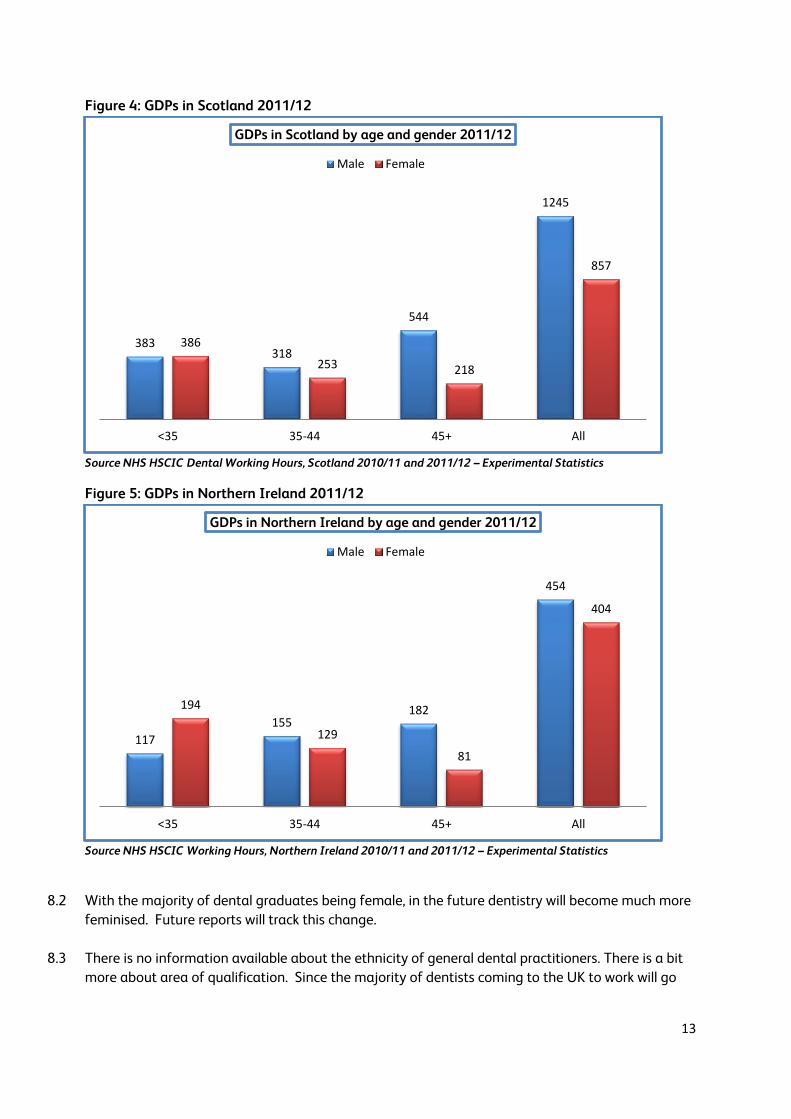
Figure 4: GDPs in Scotland 2011/12
Source NHS HSCIC Dental Working Hours, Scotland 2010/11 and 2011/12 – Experimental Statistics
Figure 5: GDPs in Northern Ireland 2011/12
Source NHS HSCIC Working Hours, Northern Ireland 2010/11 and 2011/12 – Experimental Statistics
8.2 With the majority of dental graduates being female, in the future dentistry will become much more
feminised. Future reports will track this change.
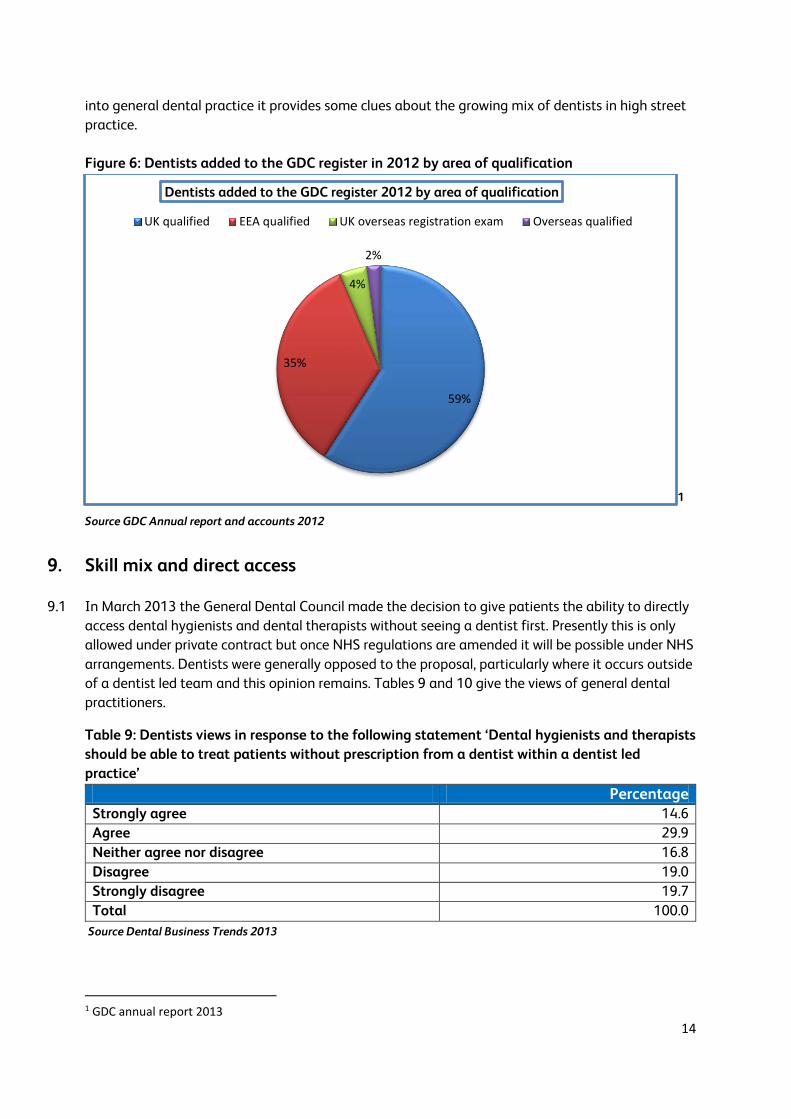
8.3 There is no information available about the ethnicity of general dental practitioners. There is a bit
more about area of qualification. Since the majority of dentists coming to the UK to work will go
383318
544
1245
386
253 218
857
<35 35-44 45+ All
GDPs in Scotland by age and gender 2011/12
Male Female
117
155182
454
194
129
81
404
<35 35-44 45+ All
GDPs in Northern Ireland by age and gender 2011/12
Male Female
14
into general dental practice it provides some clues about the growing mix of dentists in high street
practice.
Figure 6: Dentists added to the GDC register in 2012 by area of qualification
1 Source GDC Annual report and accounts 2012
9. Skill mix and direct access
9.1 In March 2013 the General Dental Council made the decision to give patients the ability to directly
access dental hygienists and dental therapists without seeing a dentist first. Presently this is only
allowed under private contract but once NHS regulations are amended it will be possible under NHS
arrangements. Dentists were generally opposed to the proposal, particularly where it occurs outside
of a dentist led team and this opinion remains. Tables 9 and 10 give the views of general dental
practitioners.
Table 9: Dentists views in response to the following statement ‘Dental hygienists and therapists
should be able to treat patients without prescription from a dentist within a dentist led
practice’
Percentage Strongly agree 14.6
Agree 29.9
Neither agree nor disagree 16.8
Disagree 19.0
Strongly disagree 19.7
Total 100.0
Source Dental Business Trends 2013
1 GDC annual report 2013
59%
35%
4%
2%
Dentists added to the GDC register 2012 by area of qualification
UK qualified EEA qualified UK overseas registration exam Overseas qualified
15
Table 10: Dental hygienists and therapists should be able to treat patients without prescription
from a dentist outside a dentist led practice
Percentage
Strongly agree 0.7
Agree 4.4
Neither agree nor disagree 9.6
Disagree 34.6
Strongly disagree 50.7
Total 100.0
Source Dental Business Trends 2013
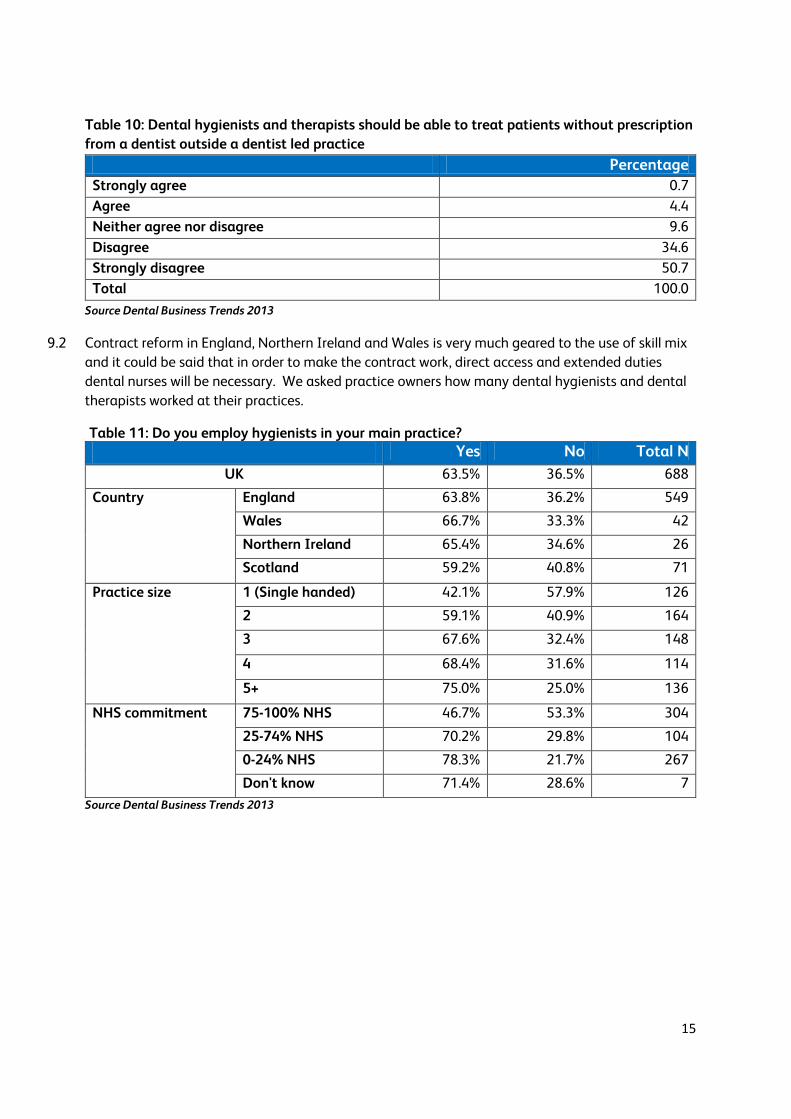
9.2 Contract reform in England, Northern Ireland and Wales is very much geared to the use of skill mix
and it could be said that in order to make the contract work, direct access and extended duties
dental nurses will be necessary. We asked practice owners how many dental hygienists and dental
therapists worked at their practices.
Table 11: Do you employ hygienists in your main practice? Yes No Total N
UK 63.5% 36.5% 688
Country England 63.8% 36.2% 549
Wales 66.7% 33.3% 42
Northern Ireland 65.4% 34.6% 26
Scotland 59.2% 40.8% 71
Practice size 1 (Single handed) 42.1% 57.9% 126
2 59.1% 40.9% 164
3 67.6% 32.4% 148
4 68.4% 31.6% 114
5+ 75.0% 25.0% 136
NHS commitment 75-100% NHS 46.7% 53.3% 304
25-74% NHS 70.2% 29.8% 104
0-24% NHS 78.3% 21.7% 267
Don't know 71.4% 28.6% 7
Source Dental Business Trends 2013

16
Table 12: How many hygienists work at your main practice?
1 2 3 4+ Total % Total N UK 51.5% 28.0% 12.2% 8.3% 100.0 435
Country England 49.6% 28.2% 13.3% 8.9% 100.0 347
Wales 67.9% 21.4% 7.1% 3.6% 100.0 28
Northern Ireland 76.5% 23.5% 0% 0% 100.0 17
Scotland 46.5% 32.6% 11.6% 9.3% 100.0 43
Practice size 1 (Single handed) 63.0% 27.8% 5.6% 3.7% 100.0 54
2 67.7% 18.8% 6.3% 7.3% 100.0 96
3 51.9% 32.7% 10.6% 4.8% 100.0 104
4 49.4% 27.3% 15.6% 7.8% 100.0 77
5+ 31.7% 32.7% 20.2% 15.4% 100.0 104
NHS commitment 75-100% NHS 57.2% 29.0% 9.7% 4.1% 100.0 145
25-74% NHS 50.0% 28.4% 12.2% 9.5% 100.0 74
0-24% NHS 47.8% 26.8% 14.4% 11.0% 100.0 209
Don't know 50.0% 50.0% 0% 0% 100.0 6
Source Dental Business Trends 2013
9.3 As can be seen from the above table, the use of dental hygienists grows with practice size and private commitment.
Table 13: Do you employ therapists in your main practice?
Yes No Total N
UK 20.6% 79.4% 689
Country England 20.3% 79.7% 548
Wales 35.7% 64.3% 42
Northern Ireland 15.4% 84.6% 26
Scotland 16.4% 83.6% 73
Practice size 1 (Single handed) 8.7% 91.3% 126
2 14.0% 86.0% 164
3 22.3% 77.7% 148
4 23.7% 76.3% 114
5+ 35.0% 65.0% 137
NHS commitment 75-100% NHS 24.2% 75.8% 306
25-74% NHS 20.4% 79.6% 103
0-24% NHS 16.5% 83.5% 267
3.Don't know 28.6% 71.4% 7
Source Dental Business Trends 2013
9.4 Only about 20 per cent of practices engage a dental therapist. Again these are larger practices. The
widespread use of skill mix looks unlikely to happen in the near future. The median number of
therapists per practice was 1 but 17 per cent of UK practice owners reported increasing the number
17
of therapists in the past twelve months. Eighty five per cent of respondents recruited to one post
and 33 per cent reported difficulties in recruiting. The median number of applications in England
was two.
10. Dental patients
10.1 We only have accurate information about the number of patients treated on the NHS in any one
year. Table 14 gives the number of patients provided with NHS dental treatment in 2012-13. The
four countries collect different levels of information about the actual treatment supplied.
Information for England is given below.
10.2 A total of 29.8 million patients were seen in the 24 month period ending March 2013, an increase of 1.6 million on the March 2006 baseline. This represents 56.1 per cent of the population compared with the March 2006 baseline of 55.8 per cent.
10.3 The number of children seen by an NHS dentist is equal to the March 2006 baseline of 7.8 million
although the percentage of children seen (69.1 per cent) is below the baseline (70.7 per cent).
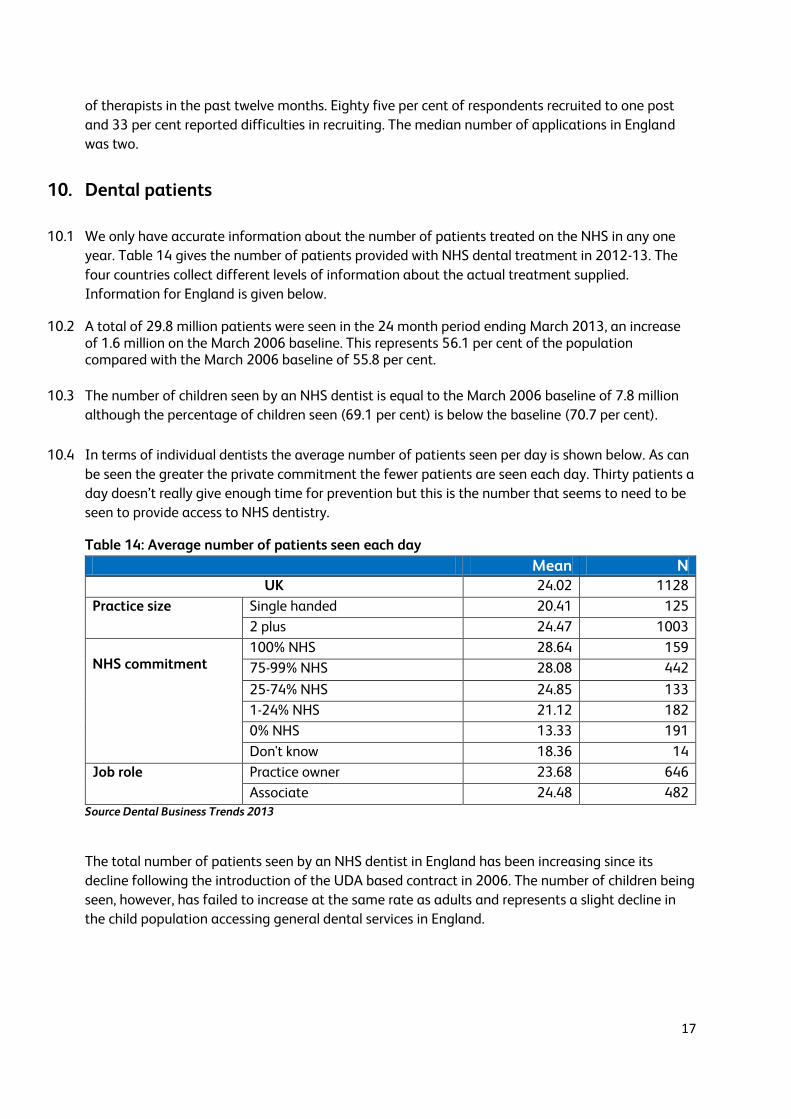
10.4 In terms of individual dentists the average number of patients seen per day is shown below. As can
be seen the greater the private commitment the fewer patients are seen each day. Thirty patients a
day doesn’t really give enough time for prevention but this is the number that seems to need to be
seen to provide access to NHS dentistry.
Table 14: Average number of patients seen each day
Mean N UK 24.02 1128
Practice size Single handed 20.41 125
2 plus 24.47 1003
NHS commitment
100% NHS 28.64 159
75-99% NHS 28.08 442
25-74% NHS 24.85 133
1-24% NHS 21.12 182
0% NHS 13.33 191
Don't know 18.36 14
Job role Practice owner 23.68 646
Associate 24.48 482 Source Dental Business Trends 2013
The total number of patients seen by an NHS dentist in England has been increasing since its
decline following the introduction of the UDA based contract in 2006. The number of children being
seen, however, has failed to increase at the same rate as adults and represents a slight decline in
the child population accessing general dental services in England.

18
Figure 7: NHS patients seen in the previous 24 months, March 2006 to June 2013 (England)
Source NHS HSCIC NHS Dental Statistics for England: 2012/13
Table 15: Number and percentage of courses of treatment by patient type and treatment
band, at specified dates (England)
Source NHS HSCIC NHS Dental Statistics for England: 2012/13
The table above shows that for the last three years, delivered courses of treatment have remained
fairly constant. Band three treatments have risen slightly and continue to be more prevalent among
non-fee paying adults, although the number of band three courses of treatment delivered to fee
paying adults and children have also risen. This appears to have been at the expense of band two
treatments, which have seen a decline. While the overall number of urgent treatments delivered has
diminished, they remain more prevalent among fee paying adults than the other two groups.

19
Table 16: Number of UDAs by patient type and treatment band at specified dates (England)
Source NHS HSCIC NHS Dental Statistics for England: 2012/13
Table 16 presents the same trend as table 15 above. The majority of UDAs are delivered for band
two treatments. This is different from the situation in Wales as shown in the figure below. In Wales
most treatment is delivered at band one for all patient groups, in England more course of treatment
were delivered at band two for exempt patients than band one however. The trend for children
appears to be roughly the same across England and Wales, though suggesting that in the younger
generation health is stabilising.

20
Figure 8: Percentage of courses of treatment by type of patient and treatment band, between
31 April 2012 and 31 March 2013
Source Statistics for Wales NHS Dental Statistics in Wales, 2011–12
11. Dentists’ Earnings and Expenses 2011/12 UK
11.1 The most accurate information available on general dental practitioners’ earnings, expenses and
taxable income comes from the Health and Social Care Information Centre that publishes reports
for England and Wales, Northern Ireland and Scotland. The information is based on HMRC tax
returns and relates to dental earnings from both NHS and private care.
11.2 In England and Wales, the downward trend in dentists’ taxable income continued in 2011/12 with
practice owner’s average taxable income being £112,800 (a drop of 3.8 per cent on 2010/11) and
associates average taxable income was £61,800, a drop of 1.7 per cent. Average earnings, expenses
and taxable income are shown in Table 18. Overall since 2009/10 average earnings have fallen for
all dentists by 12.4 per cent. The table and graph below show the income levels which Department
of Health uplifts were intended to achieve against the incomes that have actually been achieved
for all dentists with an NHS commitment of 75 per cent or more.
47.3
57.6
69.7
34.9
24.3 25.1
5.8 7.7
0.5
11.9 10.4
4.7
0
10
20
30
40
50
60
70
80
Chargeable adult Exempt adult Child
Pe
rce
ntg
ae o
f co
urs
es
of
tre
atm
en
t
Patient type
Band 1
Band 2
Band 3
Urgent

21
Table 17: Taxable income for all dentists with 75 per cent or more NHS commitment – actual
and expected (England and Wales)
Pay
award
Year that
award
applies to
Income that
should have
been achieved
with uplift
Actual
average
taxable
income
Difference in
actual
income to
income that
should have
been
achieved
Percentage
difference
1% 2013/14 £90,092 Unknown Unknown Unknown
0% 2012/13 £89,200 Unknown Unknown Unknown
0% 2011/12 £89,200 £74,300 -£14,900 -16.7%
0% 2010/11 £89,200 £77,400 -£11,800 -13.2%
1.5% 2009/10 £95,512 £89,200 -£6,312 -6.6%
2.2% 2008/9 £96,170 £94,100 -£2,070 -2.2% Source NHS HSCIC Dental Earnings and Expenses 2011/12
Figure 9: Percentage achievement of mean taxable income for GDPs in England and Wales with
an NHS commitment of 75 per cent or more
Source NHS HSCIC Dental Earnings and Expenses 2011/12
11.3 The table and graph below show how incomes for those with an NHS commitment of 0-25 per cent
have changed. We have used the previous year’s average taxable income as the baseline on the
assumption of pay freezes each year for those with a low NHS commitment.
0
20
40
60
80
100
120
2008/09 2009/10 2010/11 2011/12
Inco
me
as
pe
rce
nta
ge
Year
Percentage achievement of mean taxable income for GDPs in England and Wales with an NHS commitment of 75 per cent or more
Income which should havebeen achieved as baseline
Percentage of income whichwas achieved

22
Table 18: Pay for dentists with 0-25 per cent NHS commitment (England and Wales)
Year Income from previous year
Actual taxable income
Difference Percentage difference
2012/13 £87,000 Unknown Unknown Unknown 2011/12 £89,900 £87,000 -£2,900 -3.2% 2010/11 £95,700 £89,900 -£5,800 -6.1% 2009/10 £99,200 £95,700 -£3,500 -3.5% 2008/9 £97,299 £99,200 £1,901 +2%
Source NHS HSCIC Dental Earnings and Expenses 2011/12
Figure 10: Pay levels for GDPs in England with 0-25 per cent NHS commitment
Source NHS HSCIC Dental Earnings and Expenses 2011/12
11.4 The graph above shows the rate of decline in pay for mostly private dentists. For both primarily
NHS and primarily private dental practitioners income has been falling steadily since 2008/9.
Despite the economy remaining weak and private dental business shrinking, the fall in income has
been sharper for those with a greater NHS commitment.
11.5 There are a few explanations for this including a sharp rise in dental expenses in the last few years,
a fall in private income and for associates an oversupply in some areas, particularly London, causing
a downward pressure on pay. Private practice income is more directly market related. If patients
reduce their frequency of attendance, expenses decrease but so does pay. On the other hand
private practices have greater scope to alter their fees to either recoup more from fewer patients or
to drop fees to increase patient numbers. Primarily NHS practices do not have the same option as
they must meet UDA targets. This maintains the expense levels, and also makes them more
vulnerable to increases in the cost of laboratory work and materials. This is supported by HSCIC
figures which show that the expenses to earnings ratio for primarily private practitioners has
remained fairly constant while for primarily NHS dentists the ratio has increased.
80000
82000
84000
86000
88000
90000
92000
94000
96000
98000
100000
102000
2008/09 2009/10 2010/11 2011/12
Income for GDPs with 0-25 per cent NHS commitment
Income for GDPs with 0-25per cent NHS commitment

23
Table 19: Earnings and expenses for all dentists in England and Wales
Dental Type Percentage of time spent on NHS dentistry
Average gross earnings
Average total expenses
Average taxable income
EER
Practice Owners
0-25% £316,600 £213,400 £103,300 67.4% 25-75% £353,200 £247,200 £106,000 70%
75%+ £346,200 £229,000 £117,300 66.1% All £358,400 £245,600 £112,800 68.5%
Associates
0-25% £132,100 £61,000 £71,200 46.1% 25-75% £118,600 £48,900 £69,700 41.3%
75%+ £91,100 £28,400 £62,700 31.2% All £96,200 £34,500 £61,800 35.8%
All dentists
0-25% £223,300 £136,300 £87,00 61% 25-75% £196,400 £114,700 £81,700 58.4%
75%+ £145,100 £70,900 £74,300 48.8% All £161,00 £86,600 £74,400 53.8%
Source NHS HSCIC Dental Earnings and Expenses 2011/12
11.6 There are substantial differences by region and country. Practice owners in England earned an
average of £114,000 whilst those in Wales earned an average of £90,400. Associates in England
and Wales earned an average of £61,700 and £62,800 respectively Practice owners in in the
former Yorkshire ad Humber Strategic Health Authority area earned the highest taxable income of
all SHAs earning £128,700, while those in the South West SHA earned the lowest taxable income of
£95,400. Associates in the London SHA earned the lowest £55,900 while those in the North East
SHA earned the highest £66,800.
11.7 Associates in England and Wales working in a practice with a high NHS commitment have seen
their incomes decline sharply since 2008/9:
Table 20: pay for associates in a practice with an NHS commitment of 75 per cent or more
(England and Wales)
Pay
award
that
should be
applied
Year that
award
applies to
Income that
should have
been achieved
with uplift
Actual
taxable
income
Difference in
actual
income to
income that
should have
been
achieved
Percentage
difference
1% 2013/14 £69,791 Unknown Unknown Unknown
0% 2012/13 £69,100 Unknown Unknown Unknown
0% 2011/12 £69,100 £62,700 -£6,400 -9.3%
0% 2010/11 £69,100 £63,400 -£5,700 -8.3%
1.5% 2009/10 £71,558 £69,100 -£2,458 -3.4%
2.2% 2008/9 £69,968 £70,500 £532 +0.8% Source NHS HSCIC Dental Earnings and Expenses 2011/12

24
Figure 11: Income for associates in a practice with an NHS commitment of 75 per cent or more
(England and Wales)
Source NHS HSCIC Dental Earnings and Expenses 2011/12
11.8 While their counterparts with a high private commitment have also seen a decline, though as with
practice owners in mainly private practice, the decline appears to be slowing:
Table 21: pay for associates in practices with an NHS commitment of 0-25 per cent (England
and Wales)
Year Income from
previous year
Actual
income
Difference Percentage
difference
2012/13 £71,200 Unknown Unknown Unknown
2011/12 £72,800 £71,200 -£1,600 -2.2%
2010/11 £74,500 £72,800 -£1,700 -2.3%
2009/10 £76,400 £74,500 -£1,900 -2.5%
2008/9 £76,821 £76,400 -£421 -0.5% Source NHS HSCIC Dental Earnings and Expenses 2011/12
84
86
88
90
92
94
96
98
100
102
2008/9 2009/10 2010/11 2011/12
Inco
me
as
pe
rce
nta
ge
Year
Income which should havebeen achieved
Percentage of income whichwas achieved

25
Figure 12: Income for associates in a practice with 0-25 per cent NHS commitment (England
and Wales)
Source NHS HSCIC Dental Earnings and Expenses 2011/12
11.9 The HSCIC report Dentists Earnings and Expenses in England and Wales 2011/12includes very
useful information from the National Association of Dental Accountants and Lawyers showing the
distribution of dental practice expenses.
11.10 Quite clearly practice owners earn more than their associates which reflects the fact that they have
invested in their practices and have to bear the financial risk and they set their associates’ pay. In
England the average UDA value for NHS contracts was £25.61 in 2012/13 (which equates to
£12.50/UDA if average expense levels are deducted, with associates who have been qualified for
four or more years being paid an average of £10.81 per UDA according to figures from Morris and
Co specialist dental accountants. Associates continue to be self-employed and BDA research shows
that they wish to remain so, even when they understand the employment rights that they would
receive if employed.
12. Practice expenses including staff pay and utility costs
12.1 Dental practice expenses are normally divided into a number of categories including dental
laboratory and materials costs, staff costs and other expenses which includes premises, utilities,
finance/legal, marketing and equipment purchase and maintenance. Table 22 shows that dentists
with the highest private commitment spend a greater proportion of their income on laboratory and
materials costs, premises and other costs.
68000
69000
70000
71000
72000
73000
74000
75000
76000
77000
2008/09 2009/10 2010/11 2011/12
Inco
me
as
pe
rce
nta
ge
Year
Income
Income

26
Table 22: Expense proportions in general dental practice in England in practices with 80 per
cent or more NHS commitment Practice type Expense 2011/12 cost as
percentage of gross income
NHS practices Non-clinical staff costs 19.9% Private practices Non-clinical staff costs 19.5% NHS practices Laboratory costs 6.1% Private practices Laboratory costs 7.2% NHS practices Materials costs 6.6% Private practices Materials costs 7.4% NHS practices Other non-staffing costs 16.6% Private practices Other non-staffing costs 22.8%
Source NHS HSCIC Dental Earnings and Expenses 2011/12
12.2 Dental practices employ a range of job roles including dental nurses, receptionists, practice
managers, dental hygienists, dental therapists and other dentists. In some areas of the UK dental
practices are important local employers and provide important training and jobs in rural areas. In
order to keep good members of the dental team, provide stability for patients and motivate staff
practices have found that they have had to be providing some level of pay increase. This has been
occurring at the same time that the practice owners have received an average pay cut of 3.8 per
cent, few employees have experienced a pay cut. In fact, many have seen pay increase:
Table 23: Changes to dental nurse pay 2012/13
Increased their rate of pay
Decreased their rate of
pay
Stayed the same
Total %
Total N
UK 59.2% 1.5% 39.3% 100.0 687
Country England 61.5% 1.5% 37.0% 100.0 546
Wales 59.5% 2.4% 38.1% 100.0 42
Northern Ireland
46.2% 3.8% 50.0% 100.0 26
Scotland 46.6% - 53.4% 100.0 73
Practice size
1 55.2% 1.6% 43.2% 100.0 125
2 57.1% 2.5% 40.5% 100.0 163
3 62.8% 0.7% 36.5% 100.0 148
4 57.8% - 42.2% 100.0 116
5+ 63.0% 2.2% 34.8% 100.0 135
NHS commitment
75-100% NHS
63.3% 1.3% 35.4% 100.0 305
25-74% NHS
54.9% 2.0% 43.1% 100.0 102
0-24% NHS
57.7% 1.5% 40.8% 100.0 267
Source Dental Business Trends Survey 2013

27
Table 24: Average percentage increase in dental nurses rates of pay for those given an increase
Mean Median N
UK 3.95 3.00 380
Country England 4.10 3.00 315
Wales 3.84 2.75 22
Northern Ireland 3.18 3.00 11
Scotland 2.79 2.55 32
Practice size 1.00 5.34 4.00 64
2.00 4.21 3.00 88
3.00 4.24 3.00 84
4.00 3.13 3.00 62
5+ 2.92 2.00 82
NHS commitment 75-100% NHS 4.37 3.00 179
25-74% NHS 3.46 2.75 52
0-24% NHS 3.65 3.00 145
Don't know 3.50 3.50 2
Source Dental Business Trends Survey 2013
Table 25: Changes in dental hygienists pay in the last twelve months
Increased Stayed the same
Decreased Total %
Total N
UK 9.4% 85.0% 5.5% 100.0 434
Country England 9.8% 84.4% 5.8% 100.0 347
Wales 10.7% 89.3% 100.0 28
Northern Ireland
88.2% 11.8% 100.0 17
Scotland 9.5% 85.7% 4.8% 100.0 42
Practice size 1.00 9.4% 88.7% 1.9% 100.0 53
2.00 6.3% 88.5% 5.2% 100.0 96
3.00 7.7% 86.5% 5.8% 100.0 104
4.00 6.4% 87.2% 6.4% 100.0 78
5+ 16.5% 76.7% 6.8% 100.0 103
NHS commitment
75-100% NHS
10.3% 87.0% 2.7% 100.0 146
25-74% NHS
6.8% 87.8% 5.4% 100.0 74
0-24% NHS
9.7% 82.6% 7.7% 100.0 207
Source Dental Business Trends Survey 2013
28
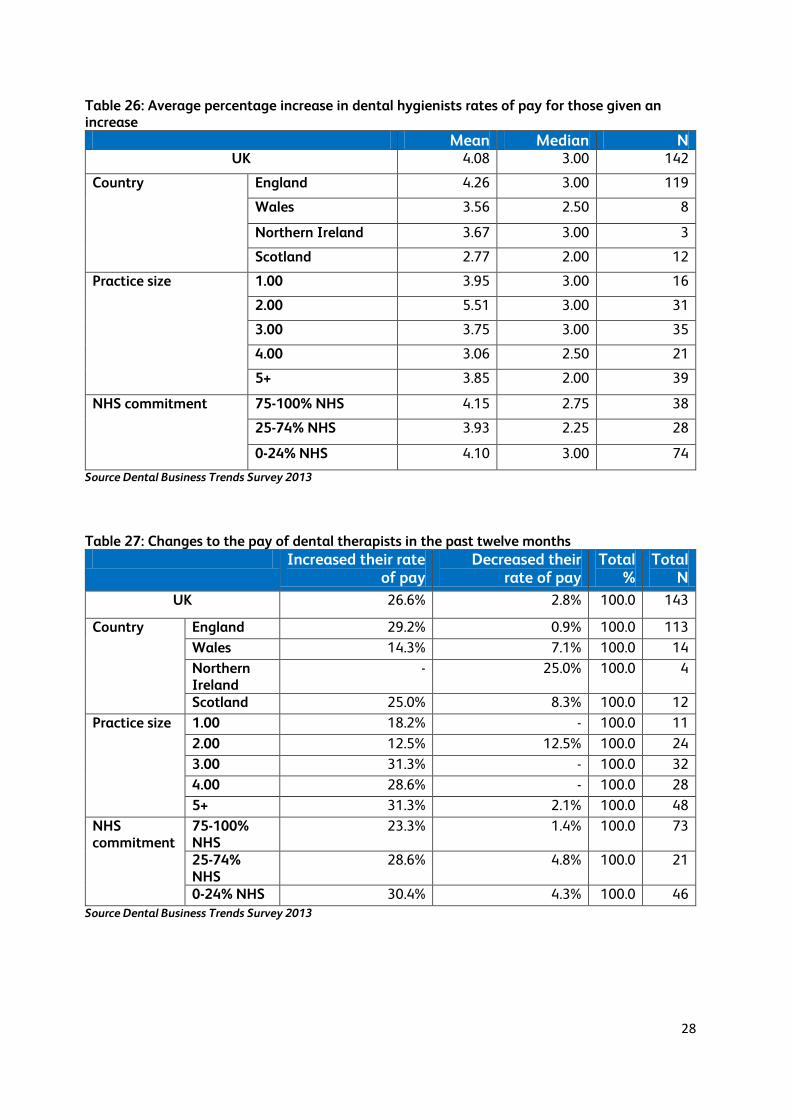
Table 26: Average percentage increase in dental hygienists rates of pay for those given an increase
Mean Median N UK 4.08 3.00 142
Country England 4.26 3.00 119
Wales 3.56 2.50 8
Northern Ireland 3.67 3.00 3
Scotland 2.77 2.00 12
Practice size 1.00 3.95 3.00 16
2.00 5.51 3.00 31
3.00 3.75 3.00 35
4.00 3.06 2.50 21
5+ 3.85 2.00 39
NHS commitment 75-100% NHS 4.15 2.75 38
25-74% NHS 3.93 2.25 28
0-24% NHS 4.10 3.00 74
Source Dental Business Trends Survey 2013
Table 27: Changes to the pay of dental therapists in the past twelve months
Increased their rate of pay
Decreased their rate of pay
Total %
Total N
UK 26.6% 2.8% 100.0 143
Country England 29.2% 0.9% 100.0 113
Wales 14.3% 7.1% 100.0 14
Northern Ireland
- 25.0% 100.0 4
Scotland 25.0% 8.3% 100.0 12
Practice size 1.00 18.2% - 100.0 11
2.00 12.5% 12.5% 100.0 24
3.00 31.3% - 100.0 32
4.00 28.6% - 100.0 28
5+ 31.3% 2.1% 100.0 48
NHS commitment
75-100% NHS
23.3% 1.4% 100.0 73
25-74% NHS
28.6% 4.8% 100.0 21
0-24% NHS 30.4% 4.3% 100.0 46 Source Dental Business Trends Survey 2013
29
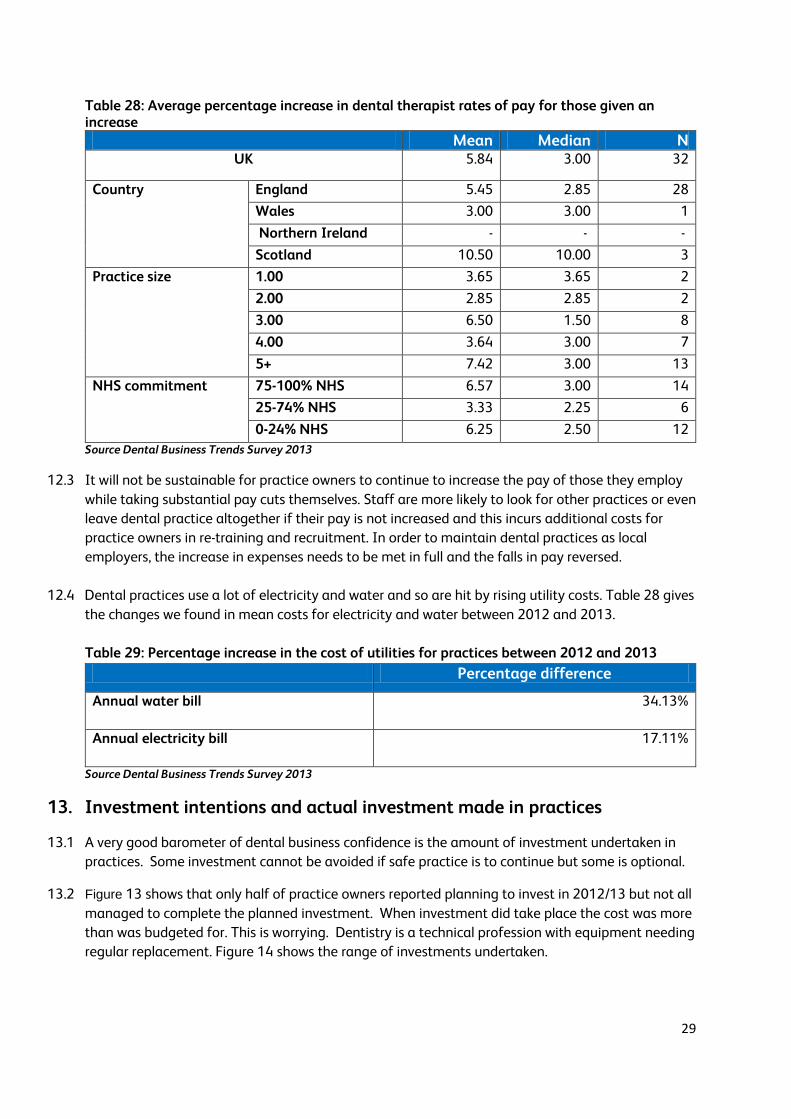
Table 28: Average percentage increase in dental therapist rates of pay for those given an increase
Mean Median N UK 5.84 3.00 32
Country England 5.45 2.85 28
Wales 3.00 3.00 1
Northern Ireland - - -
Scotland 10.50 10.00 3
Practice size 1.00 3.65 3.65 2
2.00 2.85 2.85 2
3.00 6.50 1.50 8
4.00 3.64 3.00 7
5+ 7.42 3.00 13
NHS commitment 75-100% NHS 6.57 3.00 14
25-74% NHS 3.33 2.25 6
0-24% NHS 6.25 2.50 12
Source Dental Business Trends Survey 2013
12.3 It will not be sustainable for practice owners to continue to increase the pay of those they employ
while taking substantial pay cuts themselves. Staff are more likely to look for other practices or even
leave dental practice altogether if their pay is not increased and this incurs additional costs for
practice owners in re-training and recruitment. In order to maintain dental practices as local
employers, the increase in expenses needs to be met in full and the falls in pay reversed.
12.4 Dental practices use a lot of electricity and water and so are hit by rising utility costs. Table 28 gives
the changes we found in mean costs for electricity and water between 2012 and 2013.
Table 29: Percentage increase in the cost of utilities for practices between 2012 and 2013
Percentage difference
Annual water bill 34.13%
Annual electricity bill 17.11%
Source Dental Business Trends Survey 2013
13. Investment intentions and actual investment made in practices
13.1 A very good barometer of dental business confidence is the amount of investment undertaken in
practices. Some investment cannot be avoided if safe practice is to continue but some is optional.
13.2 Figure 13 shows that only half of practice owners reported planning to invest in 2012/13 but not all
managed to complete the planned investment. When investment did take place the cost was more
than was budgeted for. This is worrying. Dentistry is a technical profession with equipment needing
regular replacement. Figure 14 shows the range of investments undertaken.

30
Figure 13: Intentions to undertake investment
Source Dental Business Trends Survey 2013
Table 30: How much of your planned investment did you complete?
N Percentage
All 194 53.0
Most 88 24.0
Some 64 17.5
None 20 5.5
Total 366 100.0 Source Dental Business Trends Survey 2013
Figure 14: Number of dentists who intended and completed investment
Source Dental Business Trends Survey 2013
53%40%
7%
Did you plan to undertake any investment in your main practice in 2012/13?
Yes No Don't know
0
50
100
150
200
250
300
Intended
Completed

31
Table 31: Average planned investment, Actual investment and difference between the two
Mean N Planned investment cost £42,813.98 322
Actual investment cost £50,804.48 315
Difference in Investment Additional £7,719.84 308
Source Dental Business Trends Survey 2013
14. Private dental care
14.1 Respondents to Dental Business Trends 2013 had the following self-reported NHS commitment.
Fifteen per cent of respondents declared themselves to be exclusively private. This is a fairly
consistent percentage.
Table 32: Percentage of practices providing levels of NHS care
NHS commitment Percentage N 100% (Exclusively NHS) 14.7% 203
75-99% 40.4% 558
50-74% 6.5% 90
25-49% 6.1% 84
1-24% 16.0% 221
0% (Exclusively private) 15.0% 207
Don't know 1.0% 14
Would prefer not to answer 0.2% 3
Total 100.0% 1380 Source Dental Business Trends Survey 2013
14.2 Using the proportion of BDA members reporting that they are exclusively private in 2010/2011
enabled an estimate to be made of the size of the UK private dental market of £4.191 billion in
2010/11. This was a fall from £4.246 billion in 2009/10 and a further fall is expected for 2011/12.
Anecdotally it appears that the fall in demand for private care flattened in 2012/13
15. Practice sales and values
15.1 Dental accountants in England report that the market for dental practices remains strong.
Associate pay is falling and for many different reasons many wish to own their own practice.
Dental corporates are able to pay large amounts for large NHS practices so associates are having
to opt for smaller practices including those for one dentist. It is almost impossible for an associate
to win an NHS tender. Since starting up in NHS practice is not possible in England and Wales,
practice purchase is the only option.
15.2 It is still possible to start a new NHS practice in Scotland and Northern Ireland and it is still being
done. However in many places the recession has led to a slow-down of patients seeking dental care
so building a practice is harder than it was ten years ago.

32
16. Recruitment of general practice staff/associates
16.1 There are recruitment issues for associates and practice staff in some areas. This is particularly true
of rural locations. However rates of recruitment seem to be falling. We don’t know whether
vacancies are not being filled to save costs or that, for example, because there are fewer associate
vacancies, associates are staying in jobs even if they are not happy in them.
Table 33: In the past 12 months, how has the number of dentists at your main practice changed?
Increased Stayed the same
Decreased Total %
Total N
UK 10.7% 78.5% 10.8% 100.0 701
Country England 10.8% 77.6% 11.7% 100.0 557
Wales 7.0% 86.0% 7.0% 100.0 43
Northern Ireland
18.5% 70.4% 11.1% 100.0 27
Scotland 9.5% 83.8% 6.8% 100.0 74
Practice size 1.00 0.8% 88.2% 11.0% 100.0 127
2.00 2.4% 90.3% 7.3% 100.0 165
3.00 8.6% 84.1% 7.3% 100.0 151
4.00 18.6% 63.6% 17.8% 100.0 118
5+ 25.0% 62.1% 12.9% 100.0 140
NHS commitment
75-100% NHS 12.5% 75.6% 11.9% 100.0 312
25-74% NHS 16.2% 72.4% 11.4% 100.0 105
0-24% NHS 7.0% 83.0% 10.0% 100.0 271
Don't know - 100.0% - 100.0 7 Source Dental Business Trends Survey 2013
Table 34: Have you sought to recruit any dentists in the past 12 months?
Yes No Total % Total N
UK 31.4% 68.6% 100.0 700
Country England 30.8% 69.2% 100.0 556
Wales 30.2% 69.8% 100.0 43
Northern Ireland 22.2% 77.8% 100.0 27
Scotland 40.5% 59.5% 100.0 74
Practice size 1.00 9.4% 90.6% 100.0 127
2.00 18.9% 81.1% 100.0 164
3.00 31.8% 68.2% 100.0 151
4.00 46.6% 53.4% 100.0 118
5+ 52.9% 47.1% 100.0 140
NHS commitment 75-100% NHS 35.9% 64.1% 100.0 312
25-74% NHS 39.0% 61.0% 100.0 105
0-24% NHS 23.3% 76.7% 100.0 270
Don't know 28.6% 71.4% 100.0 7 Source Dental Business Trends Survey 2013
33
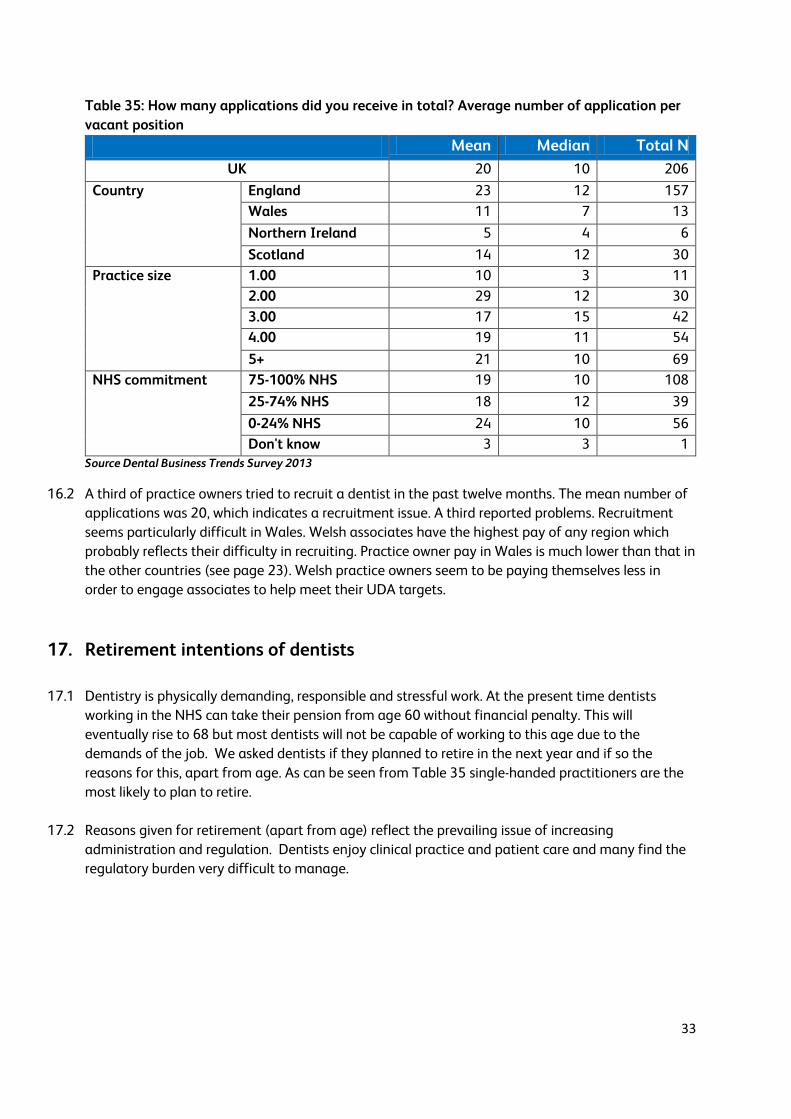
Table 35: How many applications did you receive in total? Average number of application per
vacant position
Mean Median Total N
UK 20 10 206
Country England 23 12 157
Wales 11 7 13
Northern Ireland 5 4 6
Scotland 14 12 30
Practice size 1.00 10 3 11
2.00 29 12 30
3.00 17 15 42
4.00 19 11 54
5+ 21 10 69
NHS commitment 75-100% NHS 19 10 108
25-74% NHS 18 12 39
0-24% NHS 24 10 56
Don't know 3 3 1
Source Dental Business Trends Survey 2013
16.2 A third of practice owners tried to recruit a dentist in the past twelve months. The mean number of
applications was 20, which indicates a recruitment issue. A third reported problems. Recruitment
seems particularly difficult in Wales. Welsh associates have the highest pay of any region which
probably reflects their difficulty in recruiting. Practice owner pay in Wales is much lower than that in
the other countries (see page 23). Welsh practice owners seem to be paying themselves less in
order to engage associates to help meet their UDA targets.
17. Retirement intentions of dentists
17.1 Dentistry is physically demanding, responsible and stressful work. At the present time dentists
working in the NHS can take their pension from age 60 without financial penalty. This will
eventually rise to 68 but most dentists will not be capable of working to this age due to the
demands of the job. We asked dentists if they planned to retire in the next year and if so the
reasons for this, apart from age. As can be seen from Table 35 single-handed practitioners are the
most likely to plan to retire.
17.2 Reasons given for retirement (apart from age) reflect the prevailing issue of increasing
administration and regulation. Dentists enjoy clinical practice and patient care and many find the
regulatory burden very difficult to manage.

34
Table 36: Do you have active plans to retire in the next 12 months? Yes No Don’t know Total % Total N
UK 6.9% 89.3% 3.8% 100.0 1355
Country England 6.8% 89.0% 4.1% 100.0 1067
Wales 10.3% 86.8% 2.9% 100.0 68
Northern Ireland 3.8% 96.2% 0.0% 100.0 52
Scotland 4.6% 93.1% 2.3% 100.0 131
Practice size 1 (Single handed) 11.7% 80.3% 8.0% 100.0 137
2 7.9% 88.8% 3.3% 100.0 240
3 6.9% 89.2% 4.0% 100.0 277
4 4.7% 92.5% 2.8% 100.0 214
5+ 6.0% 90.8% 3.3% 100.0 487
Age < 35 0.5% 99.0% 0.5% 100.0 209
35 - 44 1.5% 97.1% 1.5% 100.0 340
45 - 54 1.6% 96.2% 2.2% 100.0 445
55 - 64 21.4% 70.1% 8.5% 100.0 318
65+ 29.7% 48.6% 21.6% 100.0 37
Source Dental Business Trends Survey 2013
Table 37: Reasons for intending to retire other than age
Per cent of cases
N
Burden of administration/ Increasing administration 37.2% 29
Increasing regulations / Unhappy with regulations / Burden of regulations
33.3% 26
Stress within the profession 11.5% 9
Cost of running and maintaining a practice 11.5% 9
Declining levels of pay 9.0% 7
Fed up with dentistry 7.7% 6
Uncertainty (NHS, new contract) 6.4% 5
Unhappy with the current contract 6.4% 5
Workload increasing 2.6% 2
Other (health, other activities, etc.) 20.5% 16
Total 78
Source Dental Business Trends Survey 2013
18. NHS contract information: contract values and UDA amounts
18.1 The figures below show information provided by NHS Dental Services for Unit of Dental Activity
values in England. There does not appear to be a significant divergence of UDA value by practice
size, except for very large practices. Practices with more than 11 dentists have the highest £/UDA
value. As we saw above in table 7, single dentist practices were likely to provide substantial
amounts of private care.

35
Figure 15: £/UDA values by practice size in England 2012/13
Source NHS Business Services Authority
18.2 Most UDAs commissioned are valued between £20-£27.99, with an average value of £25.61.
Figure 16: Contracts by £/UDA value
Source NHS Business Services Authority
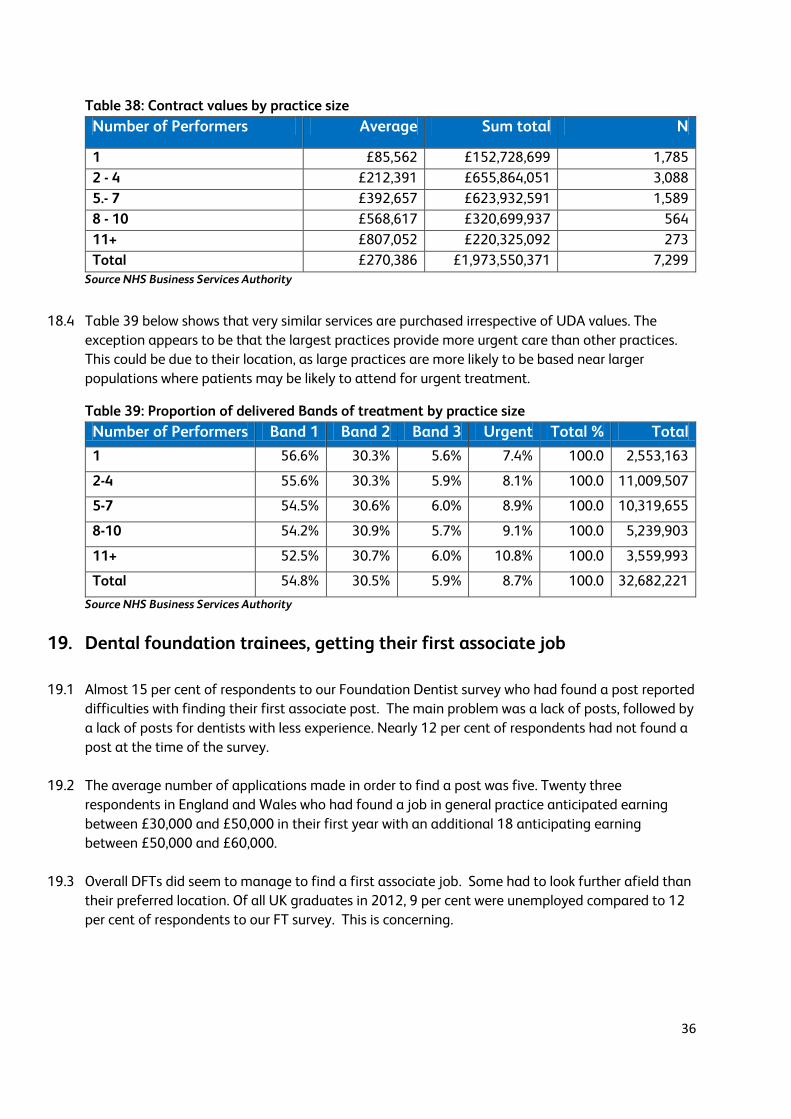
18.3 Table 38 gives the mean contract value for contracts with different numbers of dentist performers.
As would be expected, the larger the practice the larger the average contract value. We have
excluded some contracts from the table below principally those with £/UDA values of more than
£50 and less than £10 and those with no activity recorded.
24
24.5
25
25.5
26
26.5
27
27.5
1 2 to 4 5 to 7 8 to 10 11 or more Average UDAvalue
Number of dentist performers
Mean £/UDA value
Mean value of UDA
0
500
1000
1500
2000
2500
3000
3500
<£15 £15-£19.99£20-£23.99 £24 -£27.99
£28 -£31.99
£32 -£35.99
£36+
Number of contracts by £/UDA value
Number
36
Table 38: Contract values by practice size
Number of Performers Average Sum total N
1 £85,562 £152,728,699 1,785
2 - 4 £212,391 £655,864,051 3,088
5.- 7 £392,657 £623,932,591 1,589
8 - 10 £568,617 £320,699,937 564
11+ £807,052 £220,325,092 273
Total £270,386 £1,973,550,371 7,299 Source NHS Business Services Authority
18.4 Table 39 below shows that very similar services are purchased irrespective of UDA values. The
exception appears to be that the largest practices provide more urgent care than other practices.
This could be due to their location, as large practices are more likely to be based near larger
populations where patients may be likely to attend for urgent treatment.
Table 39: Proportion of delivered Bands of treatment by practice size
Number of Performers Band 1 Band 2 Band 3 Urgent Total % Total
1 56.6% 30.3% 5.6% 7.4% 100.0 2,553,163
2-4 55.6% 30.3% 5.9% 8.1% 100.0 11,009,507
5-7 54.5% 30.6% 6.0% 8.9% 100.0 10,319,655
8-10 54.2% 30.9% 5.7% 9.1% 100.0 5,239,903
11+ 52.5% 30.7% 6.0% 10.8% 100.0 3,559,993
Total 54.8% 30.5% 5.9% 8.7% 100.0 32,682,221
Source NHS Business Services Authority
19. Dental foundation trainees, getting their first associate job
19.1 Almost 15 per cent of respondents to our Foundation Dentist survey who had found a post reported
difficulties with finding their first associate post. The main problem was a lack of posts, followed by
a lack of posts for dentists with less experience. Nearly 12 per cent of respondents had not found a
post at the time of the survey.
19.2 The average number of applications made in order to find a post was five. Twenty three
respondents in England and Wales who had found a job in general practice anticipated earning
between £30,000 and £50,000 in their first year with an additional 18 anticipating earning
between £50,000 and £60,000.
19.3 Overall DFTs did seem to manage to find a first associate job. Some had to look further afield than
their preferred location. Of all UK graduates in 2012, 9 per cent were unemployed compared to 12
per cent of respondents to our FT survey. This is concerning.
37
20. Associate underemployment
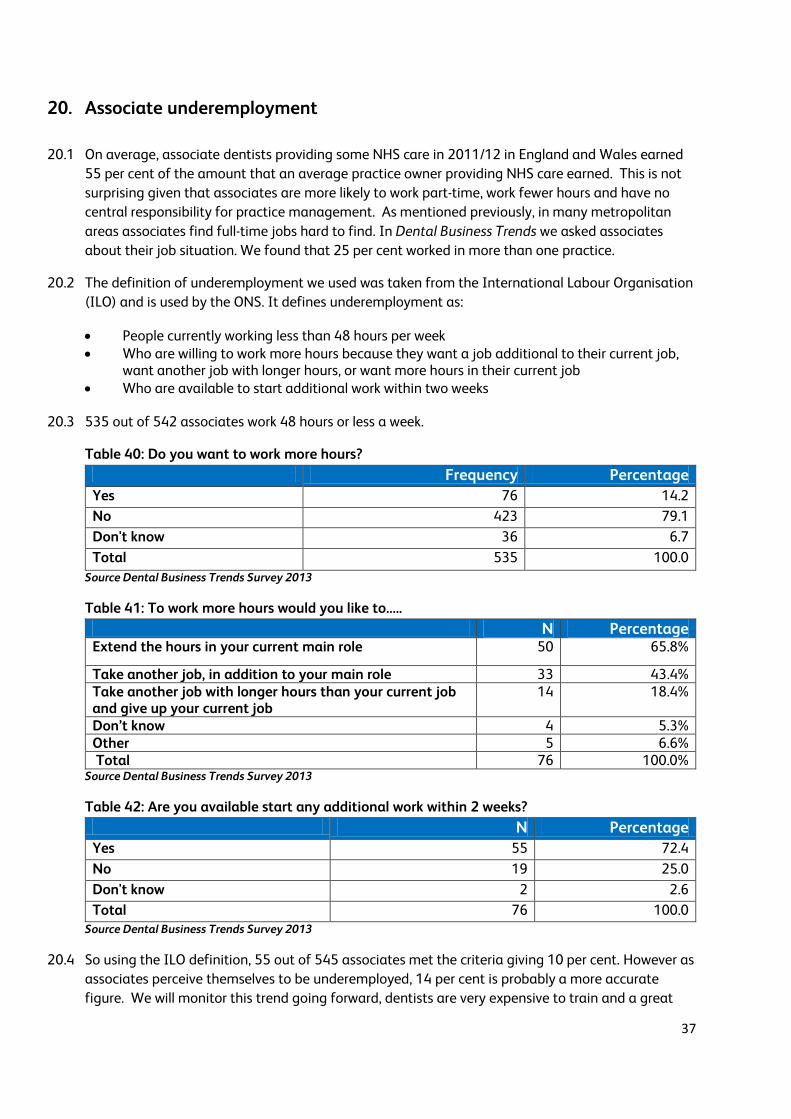
20.1 On average, associate dentists providing some NHS care in 2011/12 in England and Wales earned
55 per cent of the amount that an average practice owner providing NHS care earned. This is not
surprising given that associates are more likely to work part-time, work fewer hours and have no
central responsibility for practice management. As mentioned previously, in many metropolitan
areas associates find full-time jobs hard to find. In Dental Business Trends we asked associates
about their job situation. We found that 25 per cent worked in more than one practice.
20.2 The definition of underemployment we used was taken from the International Labour Organisation
(ILO) and is used by the ONS. It defines underemployment as:
People currently working less than 48 hours per week Who are willing to work more hours because they want a job additional to their current job,
want another job with longer hours, or want more hours in their current job Who are available to start additional work within two weeks
20.3 535 out of 542 associates work 48 hours or less a week.
Table 40: Do you want to work more hours?
Frequency Percentage
Yes 76 14.2
No 423 79.1
Don't know 36 6.7
Total 535 100.0
Source Dental Business Trends Survey 2013
Table 41: To work more hours would you like to…..
N Percentage Extend the hours in your current main role 50 65.8%
Take another job, in addition to your main role 33 43.4% Take another job with longer hours than your current job and give up your current job
14 18.4%
Don’t know 4 5.3% Other 5 6.6% Total 76 100.0%
Source Dental Business Trends Survey 2013
Table 42: Are you available start any additional work within 2 weeks?
Source Dental Business Trends Survey 2013
20.4 So using the ILO definition, 55 out of 545 associates met the criteria giving 10 per cent. However as
associates perceive themselves to be underemployed, 14 per cent is probably a more accurate
figure. We will monitor this trend going forward, dentists are very expensive to train and a great
N Percentage
Yes 55 72.4
No 19 25.0
Don't know 2 2.6
Total 76 100.0

38
many people in the UK could benefit from their skills to tackle the serious levels of dental disease in
some populations.
21. Practice owners’ and associates’ motivation and morale
21.1 General dental practitioners show levels of morale below that of the average for the general
population. We asked practice owners and associates about their morale, what motivates them in
their work and also about their levels of well-being and stress.
Table 43: How would you rate your morale as a dentist at the moment? Very
high High Neither low
nor high Low Very
low Total
% Total
N UK 8.9% 27.4% 31.2% 22.2% 10.3% 100.0 1319
Country England 9.7% 28.4% 30.5% 21.1% 10.3% 100.0 1070
Wales 7.4% 22.1% 38.2% 25.0% 7.4% 100.0 68
Northern Ireland
3.9% 19.6% 23.5% 35.3% 17.6% 100.0 51
Scotland 4.6% 25.4% 36.2% 24.6% 9.2% 100.0 130
Job Role Practice owner
9.8% 26.9% 28.5% 22.6% 12.3% 100.0 766
Associate 7.6% 28.0% 35.1% 21.8% 7.6% 100.0 542
Age < 35 4.8% 29.8% 34.6% 23.1% 7.7% 100.0 208
35 – 44 10.7% 26.2% 33.3% 22.0% 7.7% 100.0 336
45 – 54 9.4% 23.5% 30.6% 22.8% 13.6% 100.0 434
55 – 64 6.1% 30.4% 30.4% 22.7% 10.4% 100.0 309
65+ 36.1% 41.7% 13.9% 5.6% 2.8% 100.0 36 Source Dental Business Trends Survey 2013
21.2 Thirty six per cent of GDPs rate their morale as a dentist as high or very high with 32 per cent as low
or very low. Practice owners seem to have slightly lower morale than associates and dentists in
Northern Ireland have the lowest morale. This might be due to the planned cuts to dental services
in Northern Ireland which will mean a loss of commitment payments to dentists.

39
Figure 17: Would you recommend a career in general dental practice
Source Dental Business Trends Survey 2013
21.3 General dental practitioners are not very likely to recommend a career as a dentist. This suggests
that morale and motivation among the profession is lower than the table above shows. With the
great number of changes and frustration that dentists feel with administration and the
implementation of direct access to dental hygienists and therapists it is no wonder that almost a
third would not recommend a career in dentistry.
22. Practice owners’ and associates’ wellbeing
22.1 Dentists were asked questions about their general wellbeing and asked to rate their answers on a scale of 1 to 10. In relation to the general population BDA members seem to have slightly lower wellbeing than the rest of the population. In keeping with the national trend, however, those aged between 45 and 54 reported the lowest levels of satisfaction, feeling their life is worthwhile and happiness. They also had the highest levels of anxiety. This could be down to the stresses and pressures of practice ownership and falling incomes taking more of a toll on this age group. Anxiety is greatest in Northern Ireland and this could be caused by the increasing uncertainty that dentists perceive in their businesses as a result of changes introduced by DHSSPSNI. Dentists in Northern Ireland continue this trend in all categories.
51%
32%
17%
Would you recommend a career in general dental practice?
Yes
No
Don't know

40
Table 44: Overall, how satisfied are you with your life nowadays? Mean Median N
UK 6.74 7.00 1313
Country England 6.78 7.00 1066
Wales 6.88 7.50 68
Northern Ireland 6.18 7.00 51
Scotland 6.54 7.00 128
Job Role Practice owner 6.65 7.00 764
Associate 6.88 7.00 540
Age < 35 6.89 7.00 205
35 – 44 6.75 7.00 328
45 – 54 6.47 7.00 430
55 – 64 6.92 8.00 309
65+ 7.69 8.00 35 Source Dental Business Trends Survey 2013
Table 45: Overall, to what extent do you feel the things you do in your life are worthwhile? Mean Median N
UK 7.20 8.00 1314
Country England 7.24 8.00 1067
Wales 7.15 8.00 68
Northern Ireland 6.65 7.00 51
Scotland 7.13 7.00 128
Job Role Practice owner 7.19 8.00 764
Associate 7.21 8.00 541
Age < 35 7.08 7.00 206
35 – 44 7.17 7.00 328
45 – 54 6.98 7.00 430
55 – 64 7.51 8.00 309
65+ 8.29 9.00 35 Source Dental Business Trends Survey 2013
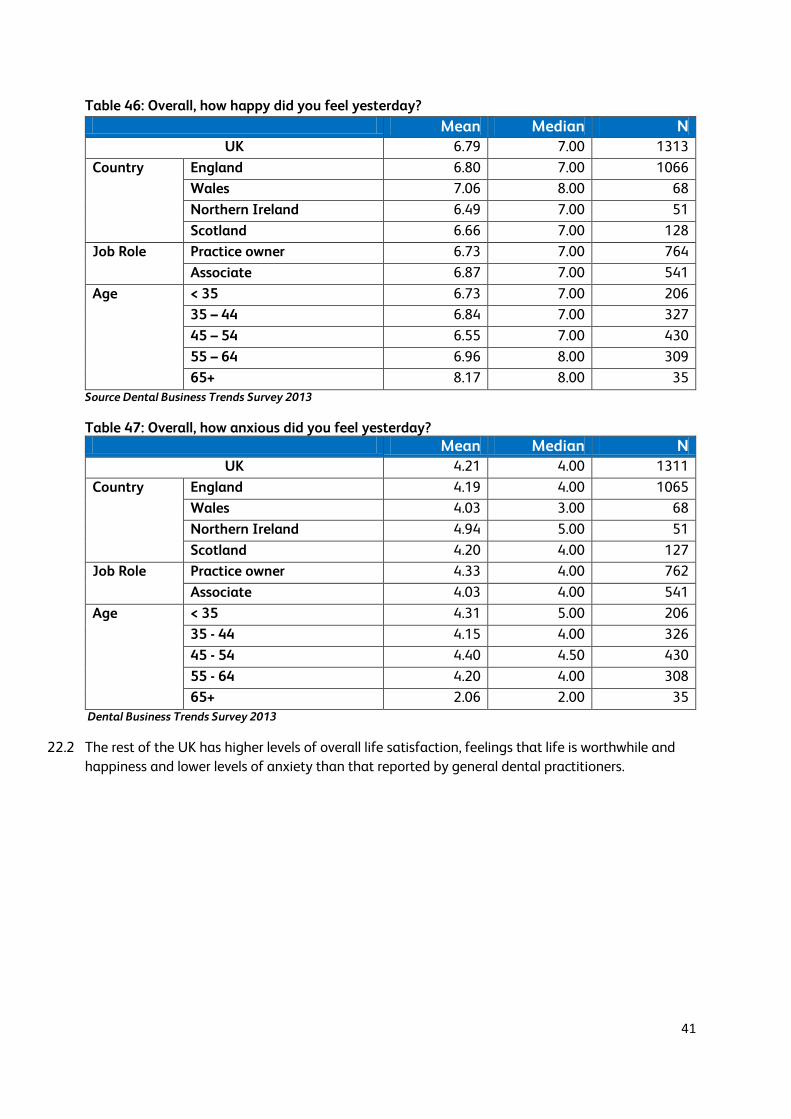
41
Table 46: Overall, how happy did you feel yesterday? Mean Median N
UK 6.79 7.00 1313
Country England 6.80 7.00 1066
Wales 7.06 8.00 68
Northern Ireland 6.49 7.00 51
Scotland 6.66 7.00 128
Job Role Practice owner 6.73 7.00 764
Associate 6.87 7.00 541
Age < 35 6.73 7.00 206
35 – 44 6.84 7.00 327
45 – 54 6.55 7.00 430
55 – 64 6.96 8.00 309
65+ 8.17 8.00 35
Source Dental Business Trends Survey 2013
Table 47: Overall, how anxious did you feel yesterday? Mean Median N
UK 4.21 4.00 1311
Country England 4.19 4.00 1065
Wales 4.03 3.00 68
Northern Ireland 4.94 5.00 51
Scotland 4.20 4.00 127
Job Role Practice owner 4.33 4.00 762
Associate 4.03 4.00 541
Age < 35 4.31 5.00 206
35 - 44 4.15 4.00 326
45 - 54 4.40 4.50 430
55 - 64 4.20 4.00 308
65+ 2.06 2.00 35
Dental Business Trends Survey 2013
22.2 The rest of the UK has higher levels of overall life satisfaction, feelings that life is worthwhile and
happiness and lower levels of anxiety than that reported by general dental practitioners.
42
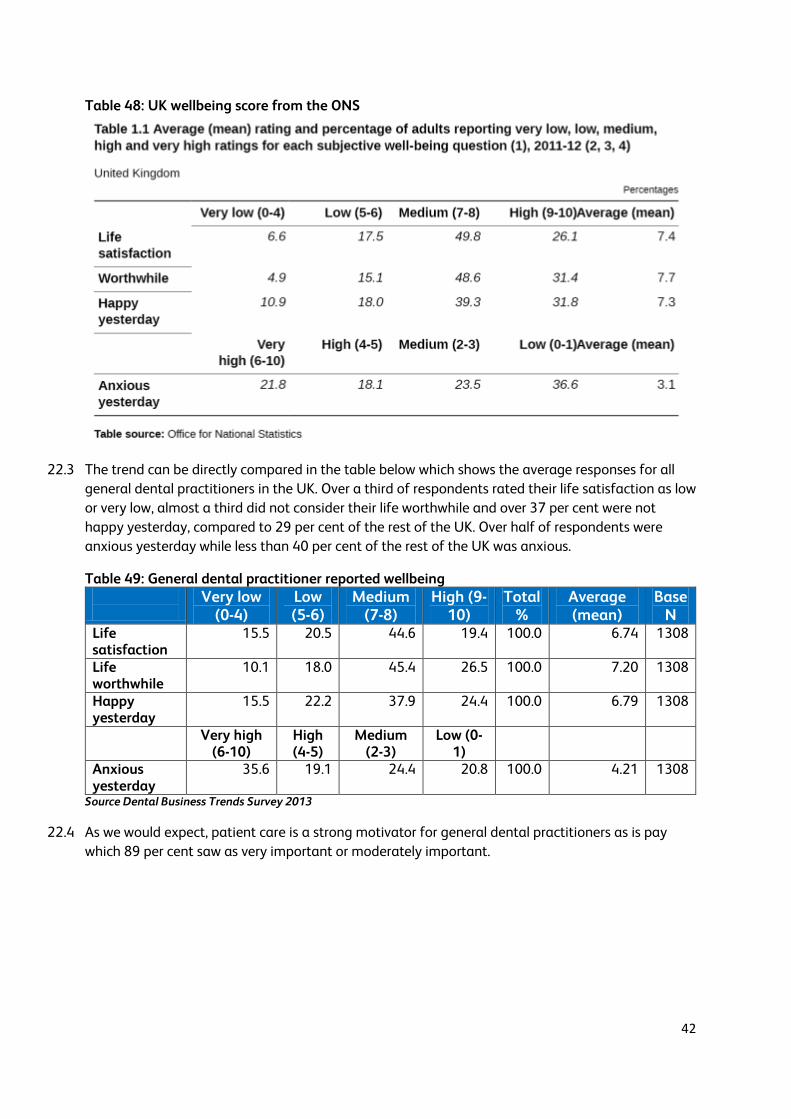
Table 48: UK wellbeing score from the ONS
22.3 The trend can be directly compared in the table below which shows the average responses for all
general dental practitioners in the UK. Over a third of respondents rated their life satisfaction as low
or very low, almost a third did not consider their life worthwhile and over 37 per cent were not
happy yesterday, compared to 29 per cent of the rest of the UK. Over half of respondents were
anxious yesterday while less than 40 per cent of the rest of the UK was anxious.
Table 49: General dental practitioner reported wellbeing
Very low (0-4)
Low (5-6)
Medium (7-8)
High (9-10)
Total %
Average (mean)
Base N
Life satisfaction
15.5 20.5 44.6 19.4 100.0 6.74 1308
Life worthwhile
10.1 18.0 45.4 26.5 100.0 7.20 1308
Happy yesterday
15.5 22.2 37.9 24.4 100.0 6.79 1308
Very high (6-10)
High (4-5)
Medium (2-3)
Low (0-1)
Anxious yesterday
35.6 19.1 24.4 20.8 100.0 4.21 1308
Source Dental Business Trends Survey 2013
22.4 As we would expect, patient care is a strong motivator for general dental practitioners as is pay
which 89 per cent saw as very important or moderately important.

43
Table 50: How important are these factors to your motivation?
Very important
Moderately important
Neutral Low importance
Not important
Total Total
Career progression
18.9% 30.8% 30.3% 10.9% 9% 100% 1346
Training 32.3% 42.9% 17.9% 4.8% 2% 100% 1343 Colleagues 32.1% 42.5% 20.4% 3.8% 1.2% 100% 1344 Variety of work
42.8% 45.9% 9.9% 1% 0.4% 100% 1348
Pay 40% 49.3% 9.4% 1.2% 0.1% 100% 1345 Care to patients
78.2% 20% 1.6% 0% 0.1% 100% 1347
Management 46.4% 37.7% 13.1% 2.5% 0.3% 100% 1346 Commitment to NHS
16.7% 25.8% 23.5% 14% 20% 100% 1341
Job security 57.4% 31.2% 9.4% 1.3% 0.7% 100% 1345 Terms and conditions
34.8% 32.4% 24.9% 5.2% 2.7 100% 1335
Source Dental Business Trends Survey 2013
23. Pension contributions and participation in the NHS pension scheme
23.1 We asked associates whether they were having NHS superannuation contributions deducted from
their NHS earnings. We wanted to try and understand their level of participation in a major NHS
benefit. It looks as if participation rates are very good if totally private associates are excluded.
Next year we will find out whether those saying no have specifically opted out of the pensions
scheme because they might only be working in the NHS for s short time or they might be older
associates who have already taken their pension.
Figure 18: Are NHS superannuation payments being deducted from your pay?
Source Dental Business Trends Survey 2013
78%
11%
8%
3%
Are NHS superannuation payments being deducted from your pay?
Yes
No
Private
Don't know
44
23.2 In 2008 following a major review of the NHS Pension Scheme, tiered contribution rates were
introduced for the first time. The initial contribution rates were five per cent, 6.5 per cent, 7.5 per
cent and 8.5 per cent. The rates reflected annual pensionable pay. Most dentists found themselves
in either the 6.5 per cent or 7.5 per cent pay bands.
23.3 Independently of the Hutton reports on the future shape of public service pension schemes, the
Coalition Government increased tiered contribution rates over a three year period by an average of
3.2 percentage points.
23.4 2013-14 is the second year of the increased rates. The increase in contribution rates did not relate
in any way to the financial solvency of the NHS Pension Scheme but to a need to raise £2.8 billion
to reduce the overall financial deficit in the economy.
23.5 In addition, the increases have not been raised equally across public service schemes as the lower
paid were to be protected and higher increases were to be met by the higher paid, including
dentists.
23.6 Dentists who were paying member contribution rates of six per cent prior to the review in 2008
could be paying 13.5 per cent by 2015: an increase of 125 per cent over a seven-year period.
23.7 The Pensions Policy Institute in its paper on the implications of the Coalition Government’s public
service pension reforms2 made the following observations, inter alia-
The Coalition Government’s reforms to the NHS, Teachers, Local Government and Civil
Service pension schemes will reduce the average value of the benefit offered across all
scheme members by more than a third.
The impact across all members of the NHS Scheme is to reduce the pension benefit from 23
per cent of a member’s salary before the reforms to 14 per cent after the reforms, a reduction
of more than a third.
23.8 The new NHS Pension scheme which will begin in April 2015 will be a Career Average Re-Valued
Scheme.
2 The implications of the Coalition Government’s public service pension reforms Pensions Policy Institute, May
2013

45
Annex 1
24.
Dental Business Trends Survey 2013
The BDA carried out its annual Dental Business Trends Survey in 2013. The survey collects data on
morale, motivation, recruitment and retention as well as information on the size of dental practices,
hours worked, pension arrangements, working patterns and demographic information.
The survey was carried out in the summer of 2013 with practice owners and associates who were
members of the BDA in June 2013. The survey sought to investigate the following areas:
Dental workloads
Morale and motivation in the profession
Financial circumstance of dentists
The dental workforce
Fieldwork for this survey took place between 12th June and 8th August 2013 via an electronic survey.
The survey population included all dentists working in general dental practice who were members of
the BDA at that time and for whom the BDA had current and reliable information.
The survey was e-mailed to 10,058 GDPs in the UK and 1,341 responded within the allotted
timeframe.
The final response rates can be seen below.
Final response rates
England 13%
Wales 15%
Scotland 18%
Northern Ireland 18%

46
Annex 2
25.
Dental Foundation Trainee Survey
The BDA conducted its annual survey of Dental Foundation Trainees. The aim of the 2013 survey
was to understand the labour-market experience of DFTs in the UK and had the following
objectives:
To assess levels of recruitment among DFTs; To understand DFTs’ experiences of finding and looking for a post; To identify any barriers to finding employment among DFTs.
The target population for the survey was all DFTs in the UK who were due to complete their DFT
training before October 2013. The effective survey population included BDA members and non-
members who had not opted out of receiving communications from the BDA and for whom up-to-
date contact data were available on BDA data systems. Fieldwork for this survey took place
between 11th June and 23rd July 2013. The survey was administered online with a postal reminder.
Of the 741 DFTs who were invited to participate, 194 responded to the survey (26 per cent of those
surveyed), with members being slightly more likely to respond than non-members. Among
respondents, 140 completed the survey, were in VT/DVT/DFT at the time of survey, and were due to
finish their training before October 2013.

47
Annex 3
FOIA to the BSA
On 11th July the BDA contacted the NHS Business Services Authority with a Freedom of Information
Act Request. The first response was received on 29th July informing the BDA that the correct
protocol had not been followed for the request as the e-mail account had changed. A second
request was made on 05th August and the final response was received on 30th August. A copy of the
request can be found below.
To whom it may concern,
The following request for information is being made under the Freedom of Information Act.
Request:
For each dental contract in England, that has provided or provides dental services, excluding those
providing only orthodontic, sedation or domiciliary dental services, or Trust Dental Services
contracts can you provide the following:
* name of each contractor and their contract number(s)
* The area team which it falls under the control of
* The first part of the practice postcode i.e. CR1 7 or W1G 8
* The purpose of the contract (e.g. general, general and orthodontic)
* Total Contracted UDA Activity
* Total delivered UDAs
* Total Contracted Value
* Cost per UDA
* The number of patients seen by the practice in the last year (1/04/2012 - 31/03/2013).
* The number of patients seen by the practice in the last three years (1/04/2010 - 31/03/2013).
* The number of performers that have carried out NHS work with in the practice (1/04/2012 -
31/03/2013)
* The number of Band 1, 2, 3 and urgent courses of treatment performed in the last year?
(1/04/2012 - 31/03/2013)
* Type of contract (e.g. GDS, PDS, PDS+).
In addition can you please provide the number of patients seen under TDS contracts last year
(1/04/2012 - 31/03/2013)?