Embed Size (px)
Citation preview
1
The State of Electric Vehicles In Hawaii
Katherine McKenzie Hawaii Natural Energy Institute
University of Hawaii at Manoa 1680 East West Road, POST 109
Honolulu, HI 96822 E-mail: [email protected]
Submitted to:
Dr. David Block Florida Solar Energy Center University of Central Florida
1679 Clearlake Road Cocoa, FL 32922
E-mail: [email protected]
Purchase Order Number: 291166 Report Number: HNEI-05-15
March 2015
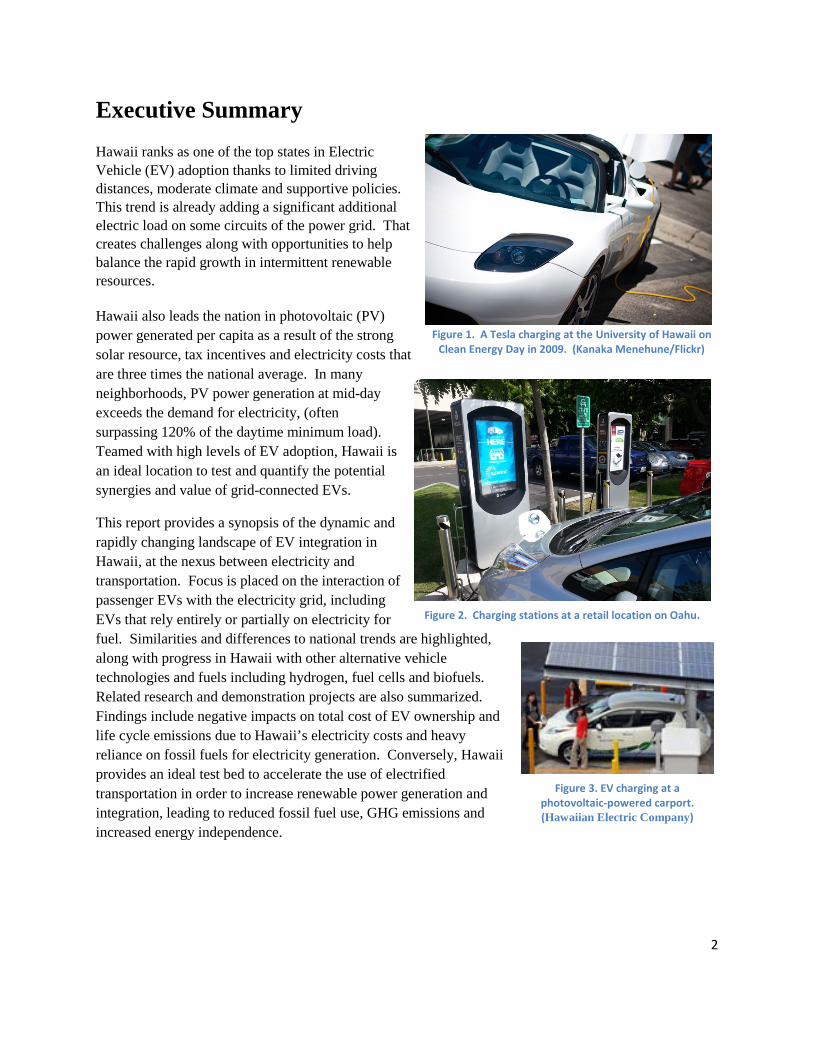
Executive Summary Hawaii ranks as one of the top states in Electric Vehicle (EV) adoption thanks to limited driving distances, moderate climate and supportive policies. This trend is already adding a significant additional electric load on some circuits of the power grid. That creates challenges along with opportunities to help balance the rapid growth in intermittent renewable resources. Hawaii also leads the nation in photovoltaic (PV) power generated per capita as a result of the strong solar resource, tax incentives and electricity costs that are three times the national average. In many neighborhoods, PV power generation at mid-day exceeds the demand for electricity, (often surpassing 120% of the daytime minimum load). Teamed with high levels of EV adoption, Hawaii is an ideal location to test and quantify the potential synergies and value of grid-connected EVs.
This report provides a synopsis of the dynamic and rapidly changing landscape of EV integration in Hawaii, at the nexus between electricity and transportation. Focus is placed on the interaction of passenger EVs with the electricity grid, including EVs that rely entirely or partially on electricity for fuel. Similarities and differences to national trends are highlighted, along with progress in Hawaii with other alternative vehicle technologies and fuels including hydrogen, fuel cells and biofuels. Related research and demonstration projects are also summarized. Findings include negative impacts on total cost of EV ownership and life cycle emissions due to Hawaii’s electricity costs and heavy reliance on fossil fuels for electricity generation. Conversely, Hawaii provides an ideal test bed to accelerate the use of electrified transportation in order to increase renewable power generation and integration, leading to reduced fossil fuel use, GHG emissions and increased energy independence.
Figure 3. EV charging at a photovoltaic-powered carport. (Hawaiian Electric Company)
Figure 1. A Tesla charging at the University of Hawaii on Clean Energy Day in 2009. (Kanaka Menehune/Flickr)
Figure 2. Charging stations at a retail location on Oahu.
2
Contents Executive Summary ................................................................................................................................... 1
I. Introduction .................................................................................................................................. 4
Background ......................................................................................................................... 4
Overview of Electric Vehicles in Hawaii ........................................................................... 5
Strengths ............................................................................................................................. 6
Weaknesses ......................................................................................................................... 7
Opportunities ...................................................................................................................... 8
Threats ................................................................................................................................ 8
Solutions ............................................................................................................................. 8
II. Electric Vehicle Adoption .............................................................................................................. 8
Number of EVs ................................................................................................................... 8
Projections ........................................................................................................................ 11
Tourism and EVs .............................................................................................................. 12
III. Fuel Considerations ..................................................................................................................... 14
Electricity Versus Gasoline ................................................................................................ 14
Time of Use Rates ............................................................................................................. 17
Photovoltaics and Net Energy Metering ........................................................................... 18
IV. EV Integration into the Power System ........................................................................................ 19
PV Growth ........................................................................................................................ 21
V. Emissions ..................................................................................................................................... 24
VI. EV Infrastructure ......................................................................................................................... 25
VII. Research and Demonstration Projects ....................................................................................... 27
Systems Integration ........................................................................................................... 27
Smart Grid......................................................................................................................... 29
Hydrogen Refueling Support ............................................................................................ 31
Alternative Fuels ............................................................................................................... 33
Energy Storage .................................................................................................................. 34
VIII. Conclusions ................................................................................................................................. 34
IX. Acknowledgments ....................................................................................................................... 35
X. References .................................................................................................................................. 35
3
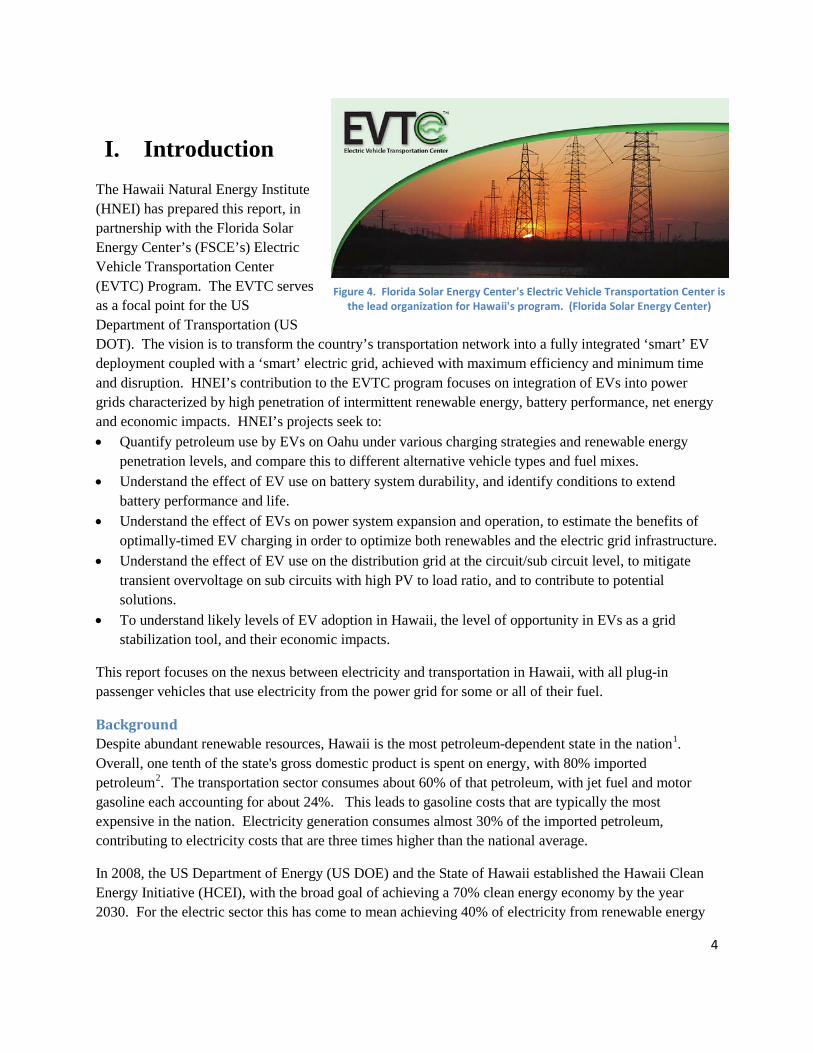
I. Introduction The Hawaii Natural Energy Institute (HNEI) has prepared this report, in partnership with the Florida Solar Energy Center’s (FSCE’s) Electric Vehicle Transportation Center (EVTC) Program. The EVTC serves as a focal point for the US Department of Transportation (US DOT). The vision is to transform the country’s transportation network into a fully integrated ‘smart’ EV deployment coupled with a ‘smart’ electric grid, achieved with maximum efficiency and minimum time and disruption. HNEI’s contribution to the EVTC program focuses on integration of EVs into power grids characterized by high penetration of intermittent renewable energy, battery performance, net energy and economic impacts. HNEI’s projects seek to: • Quantify petroleum use by EVs on Oahu under various charging strategies and renewable energy
penetration levels, and compare this to different alternative vehicle types and fuel mixes. • Understand the effect of EV use on battery system durability, and identify conditions to extend
battery performance and life. • Understand the effect of EVs on power system expansion and operation, to estimate the benefits of
optimally-timed EV charging in order to optimize both renewables and the electric grid infrastructure. • Understand the effect of EV use on the distribution grid at the circuit/sub circuit level, to mitigate
transient overvoltage on sub circuits with high PV to load ratio, and to contribute to potential solutions.
• To understand likely levels of EV adoption in Hawaii, the level of opportunity in EVs as a grid stabilization tool, and their economic impacts.
This report focuses on the nexus between electricity and transportation in Hawaii, with all plug-in passenger vehicles that use electricity from the power grid for some or all of their fuel.
Background Despite abundant renewable resources, Hawaii is the most petroleum-dependent state in the nation1. Overall, one tenth of the state's gross domestic product is spent on energy, with 80% imported petroleum2. The transportation sector consumes about 60% of that petroleum, with jet fuel and motor gasoline each accounting for about 24%. This leads to gasoline costs that are typically the most expensive in the nation. Electricity generation consumes almost 30% of the imported petroleum, contributing to electricity costs that are three times higher than the national average.
In 2008, the US Department of Energy (US DOE) and the State of Hawaii established the Hawaii Clean Energy Initiative (HCEI), with the broad goal of achieving a 70% clean energy economy by the year 2030. For the electric sector this has come to mean achieving 40% of electricity from renewable energy
Figure 4. Florida Solar Energy Center's Electric Vehicle Transportation Center is the lead organization for Hawaii's program. (Florida Solar Energy Center)
4
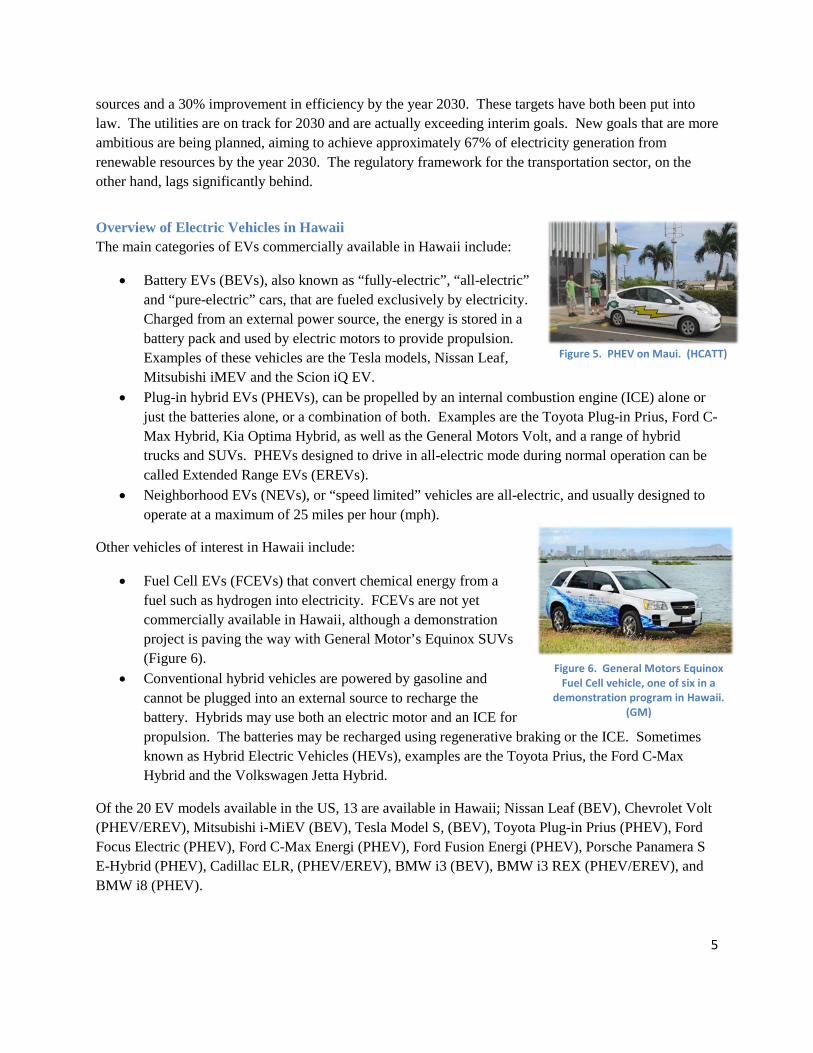
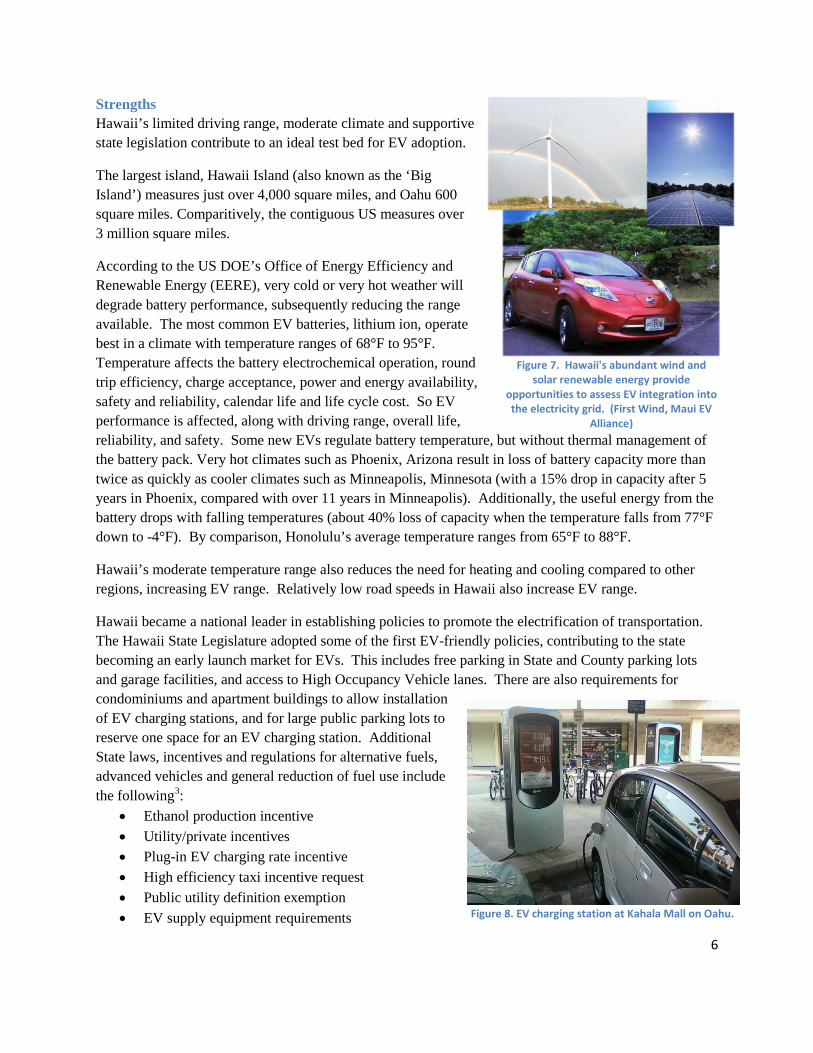
Figure 6. General Motors Equinox Fuel Cell vehicle, one of six in a
demonstration program in Hawaii. (GM)
sources and a 30% improvement in efficiency by the year 2030. These targets have both been put into law. The utilities are on track for 2030 and are actually exceeding interim goals. New goals that are more ambitious are being planned, aiming to achieve approximately 67% of electricity generation from renewable resources by the year 2030. The regulatory framework for the transportation sector, on the other hand, lags significantly behind.
Overview of Electric Vehicles in Hawaii The main categories of EVs commercially available in Hawaii include:
• Battery EVs (BEVs), also known as “fully-electric”, “all-electric” and “pure-electric” cars, that are fueled exclusively by electricity. Charged from an external power source, the energy is stored in a battery pack and used by electric motors to provide propulsion. Examples of these vehicles are the Tesla models, Nissan Leaf, Mitsubishi iMEV and the Scion iQ EV.
• Plug-in hybrid EVs (PHEVs), can be propelled by an internal combustion engine (ICE) alone or just the batteries alone, or a combination of both. Examples are the Toyota Plug-in Prius, Ford C-Max Hybrid, Kia Optima Hybrid, as well as the General Motors Volt, and a range of hybrid trucks and SUVs. PHEVs designed to drive in all-electric mode during normal operation can be called Extended Range EVs (EREVs).
• Neighborhood EVs (NEVs), or “speed limited” vehicles are all-electric, and usually designed to operate at a maximum of 25 miles per hour (mph).
Other vehicles of interest in Hawaii include:
• Fuel Cell EVs (FCEVs) that convert chemical energy from a fuel such as hydrogen into electricity. FCEVs are not yet commercially available in Hawaii, although a demonstration project is paving the way with General Motor’s Equinox SUVs (Figure 6).
• Conventional hybrid vehicles are powered by gasoline and cannot be plugged into an external source to recharge the battery. Hybrids may use both an electric motor and an ICE for propulsion. The batteries may be recharged using regenerative braking or the ICE. Sometimes known as Hybrid Electric Vehicles (HEVs), examples are the Toyota Prius, the Ford C-Max Hybrid and the Volkswagen Jetta Hybrid.
Of the 20 EV models available in the US, 13 are available in Hawaii; Nissan Leaf (BEV), Chevrolet Volt (PHEV/EREV), Mitsubishi i-MiEV (BEV), Tesla Model S, (BEV), Toyota Plug-in Prius (PHEV), Ford Focus Electric (PHEV), Ford C-Max Energi (PHEV), Ford Fusion Energi (PHEV), Porsche Panamera S E-Hybrid (PHEV), Cadillac ELR, (PHEV/EREV), BMW i3 (BEV), BMW i3 REX (PHEV/EREV), and BMW i8 (PHEV).
Figure 5. PHEV on Maui. (HCATT)
5
Strengths Hawaii’s limited driving range, moderate climate and supportive state legislation contribute to an ideal test bed for EV adoption.
The largest island, Hawaii Island (also known as the ‘Big Island’) measures just over 4,000 square miles, and Oahu 600 square miles. Comparitively, the contiguous US measures over 3 million square miles.
According to the US DOE’s Office of Energy Efficiency and Renewable Energy (EERE), very cold or very hot weather will degrade battery performance, subsequently reducing the range available. The most common EV batteries, lithium ion, operate best in a climate with temperature ranges of 68°F to 95°F. Temperature affects the battery electrochemical operation, round trip efficiency, charge acceptance, power and energy availability, safety and reliability, calendar life and life cycle cost. So EV performance is affected, along with driving range, overall life, reliability, and safety. Some new EVs regulate battery temperature, but without thermal management of the battery pack. Very hot climates such as Phoenix, Arizona result in loss of battery capacity more than twice as quickly as cooler climates such as Minneapolis, Minnesota (with a 15% drop in capacity after 5 years in Phoenix, compared with over 11 years in Minneapolis). Additionally, the useful energy from the battery drops with falling temperatures (about 40% loss of capacity when the temperature falls from 77°F down to -4°F). By comparison, Honolulu’s average temperature ranges from 65°F to 88°F.
Hawaii’s moderate temperature range also reduces the need for heating and cooling compared to other regions, increasing EV range. Relatively low road speeds in Hawaii also increase EV range.
Hawaii became a national leader in establishing policies to promote the electrification of transportation. The Hawaii State Legislature adopted some of the first EV-friendly policies, contributing to the state becoming an early launch market for EVs. This includes free parking in State and County parking lots and garage facilities, and access to High Occupancy Vehicle lanes. There are also requirements for condominiums and apartment buildings to allow installation of EV charging stations, and for large public parking lots to reserve one space for an EV charging station. Additional State laws, incentives and regulations for alternative fuels, advanced vehicles and general reduction of fuel use include the following3:
• Ethanol production incentive • Utility/private incentives • Plug-in EV charging rate incentive • High efficiency taxi incentive request • Public utility definition exemption • EV supply equipment requirements
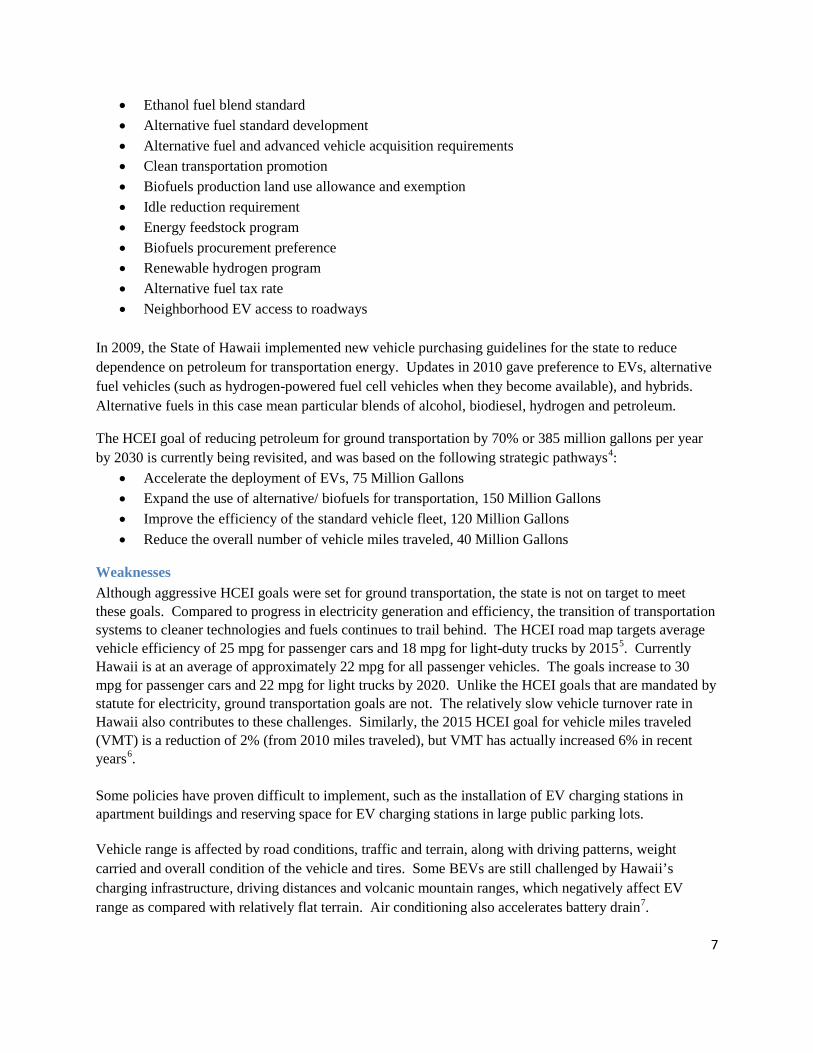
Figure 7. Hawaii's abundant wind and solar renewable energy provide
opportunities to assess EV integration into the electricity grid. (First Wind, Maui EV
Alliance)
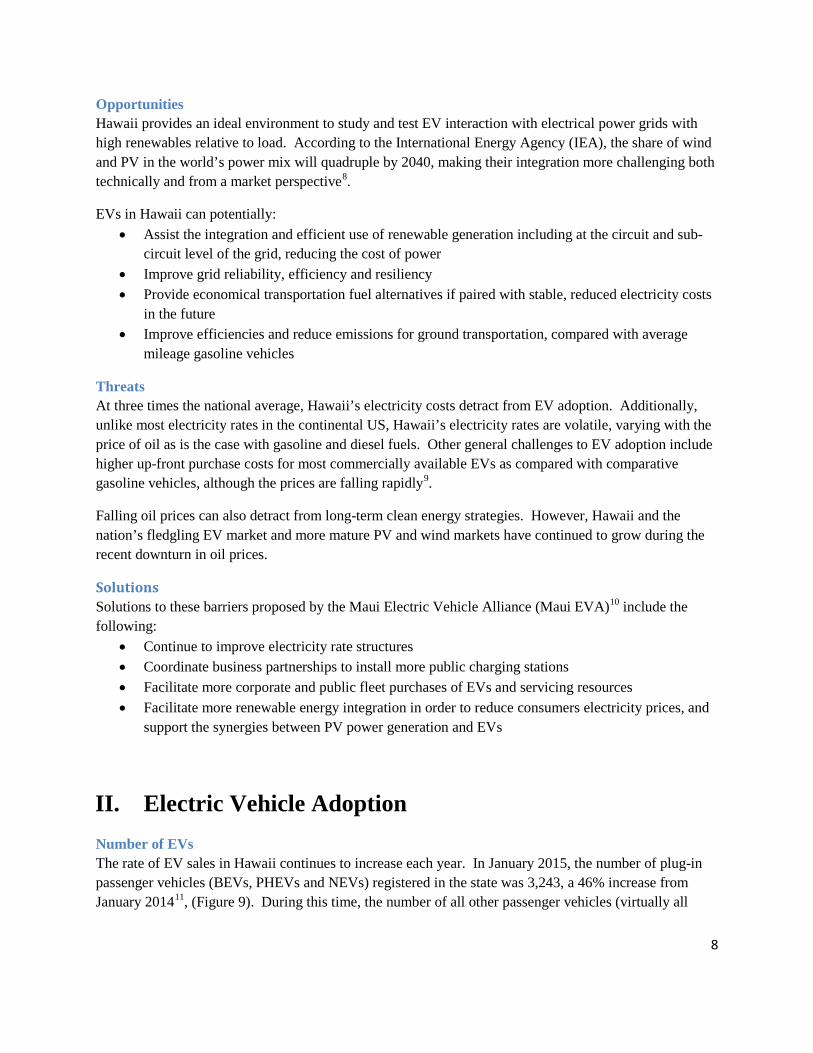
Figure 8. EV charging station at Kahala Mall on Oahu.
6
• Ethanol fuel blend standard • Alternative fuel standard development • Alternative fuel and advanced vehicle acquisition requirements • Clean transportation promotion • Biofuels production land use allowance and exemption • Idle reduction requirement • Energy feedstock program • Biofuels procurement preference • Renewable hydrogen program • Alternative fuel tax rate • Neighborhood EV access to roadways
In 2009, the State of Hawaii implemented new vehicle purchasing guidelines for the state to reduce dependence on petroleum for transportation energy. Updates in 2010 gave preference to EVs, alternative fuel vehicles (such as hydrogen-powered fuel cell vehicles when they become available), and hybrids. Alternative fuels in this case mean particular blends of alcohol, biodiesel, hydrogen and petroleum.
The HCEI goal of reducing petroleum for ground transportation by 70% or 385 million gallons per year by 2030 is currently being revisited, and was based on the following strategic pathways4:
• Accelerate the deployment of EVs, 75 Million Gallons • Expand the use of alternative/ biofuels for transportation, 150 Million Gallons • Improve the efficiency of the standard vehicle fleet, 120 Million Gallons • Reduce the overall number of vehicle miles traveled, 40 Million Gallons
Weaknesses Although aggressive HCEI goals were set for ground transportation, the state is not on target to meet these goals. Compared to progress in electricity generation and efficiency, the transition of transportation systems to cleaner technologies and fuels continues to trail behind. The HCEI road map targets average vehicle efficiency of 25 mpg for passenger cars and 18 mpg for light-duty trucks by 20155. Currently Hawaii is at an average of approximately 22 mpg for all passenger vehicles. The goals increase to 30 mpg for passenger cars and 22 mpg for light trucks by 2020. Unlike the HCEI goals that are mandated by statute for electricity, ground transportation goals are not. The relatively slow vehicle turnover rate in Hawaii also contributes to these challenges. Similarly, the 2015 HCEI goal for vehicle miles traveled (VMT) is a reduction of 2% (from 2010 miles traveled), but VMT has actually increased 6% in recent years6. Some policies have proven difficult to implement, such as the installation of EV charging stations in apartment buildings and reserving space for EV charging stations in large public parking lots. Vehicle range is affected by road conditions, traffic and terrain, along with driving patterns, weight carried and overall condition of the vehicle and tires. Some BEVs are still challenged by Hawaii’s charging infrastructure, driving distances and volcanic mountain ranges, which negatively affect EV range as compared with relatively flat terrain. Air conditioning also accelerates battery drain7.
7
Opportunities Hawaii provides an ideal environment to study and test EV interaction with electrical power grids with high renewables relative to load. According to the International Energy Agency (IEA), the share of wind and PV in the world’s power mix will quadruple by 2040, making their integration more challenging both technically and from a market perspective8.
EVs in Hawaii can potentially: • Assist the integration and efficient use of renewable generation including at the circuit and sub-
circuit level of the grid, reducing the cost of power • Improve grid reliability, efficiency and resiliency • Provide economical transportation fuel alternatives if paired with stable, reduced electricity costs
in the future • Improve efficiencies and reduce emissions for ground transportation, compared with average
mileage gasoline vehicles
Threats At three times the national average, Hawaii’s electricity costs detract from EV adoption. Additionally, unlike most electricity rates in the continental US, Hawaii’s electricity rates are volatile, varying with the price of oil as is the case with gasoline and diesel fuels. Other general challenges to EV adoption include higher up-front purchase costs for most commercially available EVs as compared with comparative gasoline vehicles, although the prices are falling rapidly9.
Falling oil prices can also detract from long-term clean energy strategies. However, Hawaii and the nation’s fledgling EV market and more mature PV and wind markets have continued to grow during the recent downturn in oil prices.
Solutions Solutions to these barriers proposed by the Maui Electric Vehicle Alliance (Maui EVA)10 include the following:
• Continue to improve electricity rate structures • Coordinate business partnerships to install more public charging stations • Facilitate more corporate and public fleet purchases of EVs and servicing resources • Facilitate more renewable energy integration in order to reduce consumers electricity prices, and
support the synergies between PV power generation and EVs
II. Electric Vehicle Adoption Number of EVs The rate of EV sales in Hawaii continues to increase each year. In January 2015, the number of plug-in passenger vehicles (BEVs, PHEVs and NEVs) registered in the state was 3,243, a 46% increase from January 201411, (Figure 9). During this time, the number of all other passenger vehicles (virtually all
8
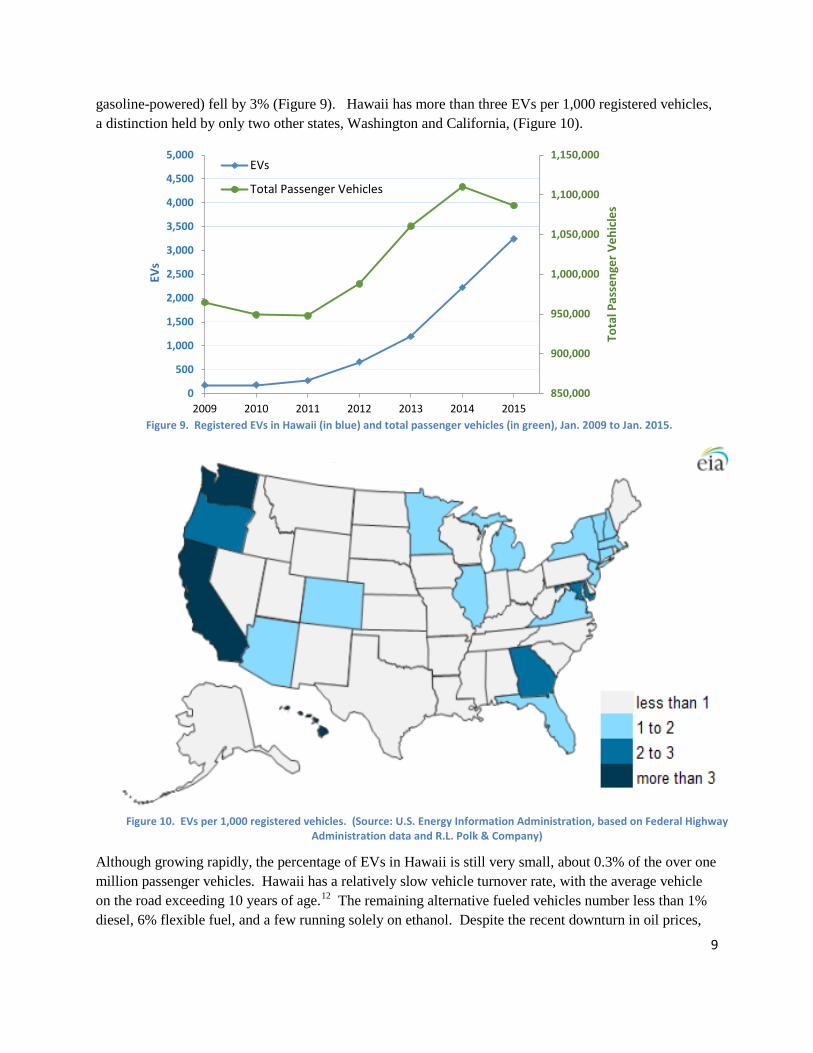
Figure 10. EVs per 1,000 registered vehicles. (Source: U.S. Energy Information Administration, based on Federal Highway Administration data and R.L. Polk & Company)
gasoline-powered) fell by 3% (Figure 9). Hawaii has more than three EVs per 1,000 registered vehicles, a distinction held by only two other states, Washington and California, (Figure 10).
Although growing rapidly, the percentage of EVs in Hawaii is still very small, about 0.3% of the over one million passenger vehicles. Hawaii has a relatively slow vehicle turnover rate, with the average vehicle on the road exceeding 10 years of age.12 The remaining alternative fueled vehicles number less than 1% diesel, 6% flexible fuel, and a few running solely on ethanol. Despite the recent downturn in oil prices,
850,000
900,000
950,000
1,000,000
1,050,000
1,100,000
1,150,000
0
500
1,000
1,500
2,000
2,500
3,000
3,500
4,000
4,500
5,000
2009 2010 2011 2012 2013 2014 2015
Tota
l Pas
seng
er V
ehic
les
EVs
EVs
Total Passenger Vehicles
Figure 9. Registered EVs in Hawaii (in blue) and total passenger vehicles (in green), Jan. 2009 to Jan. 2015.
9
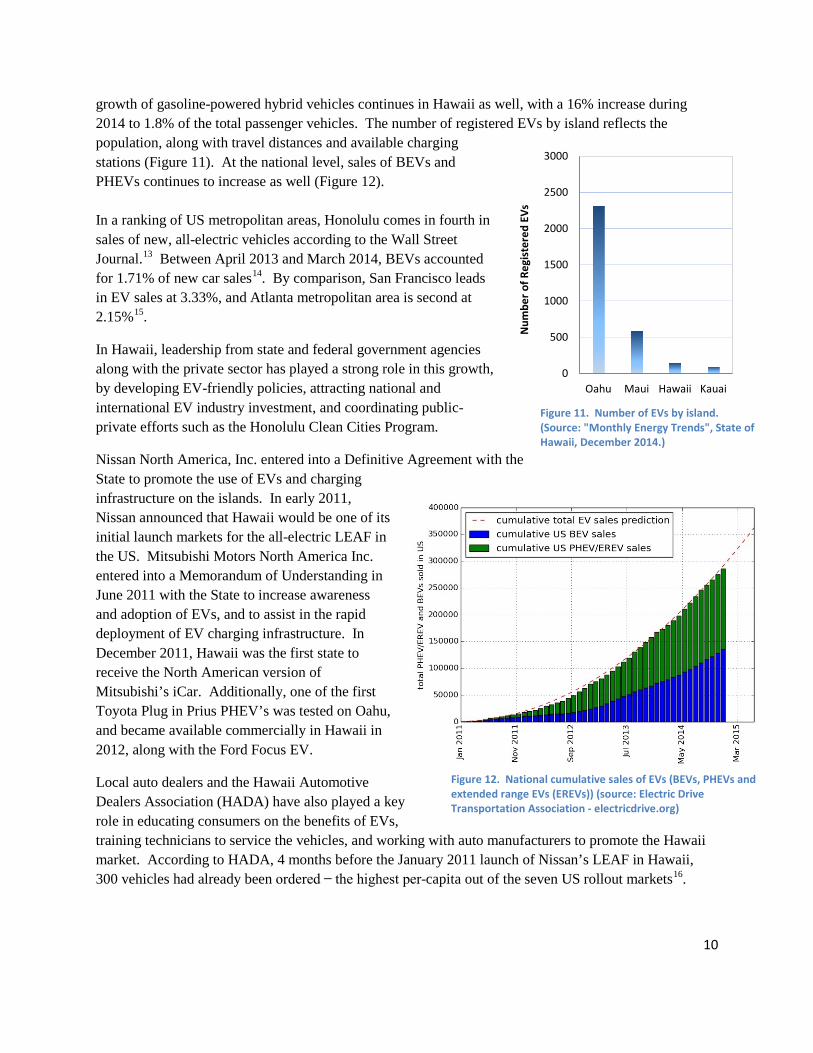
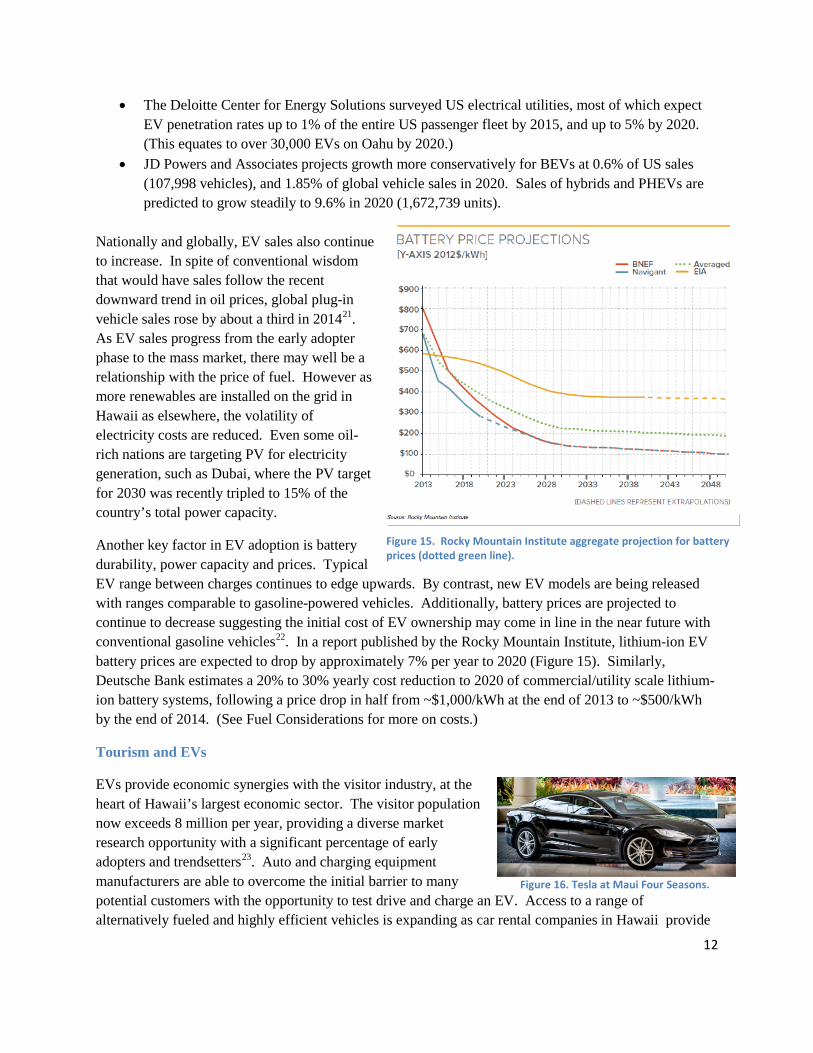
Figure 12. National cumulative sales of EVs (BEVs, PHEVs and extended range EVs (EREVs)) (source: Electric Drive Transportation Association - electricdrive.org)
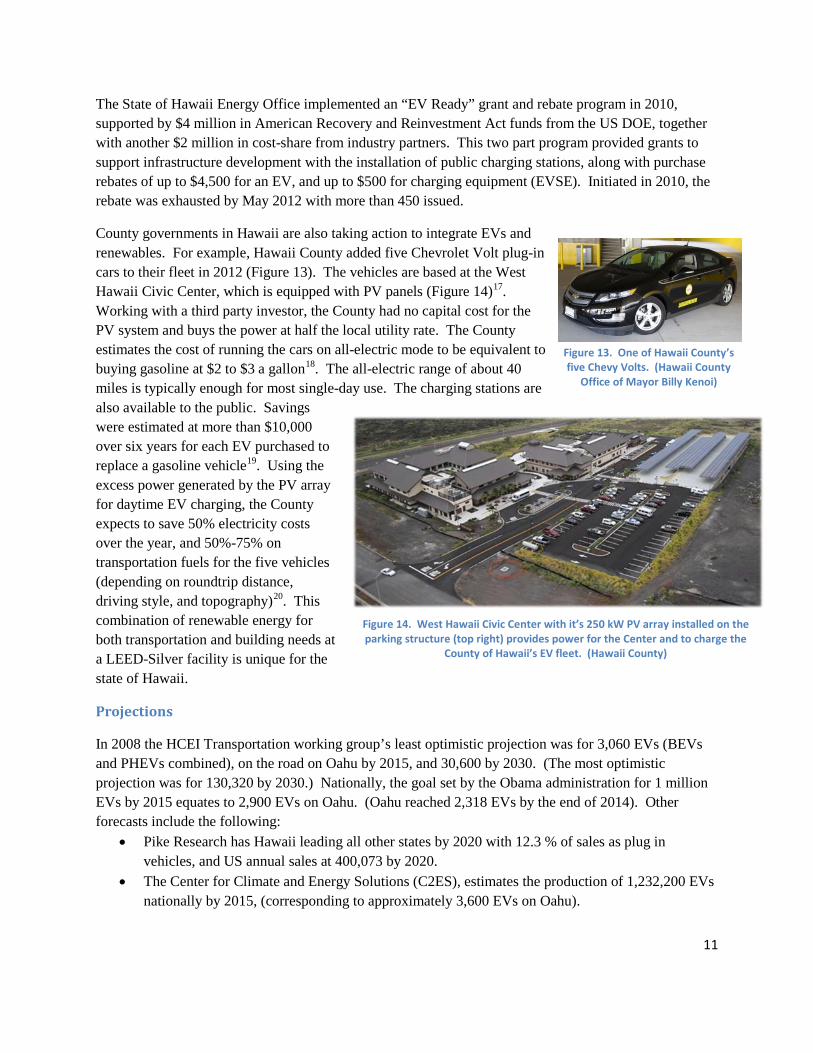
growth of gasoline-powered hybrid vehicles continues in Hawaii as well, with a 16% increase during 2014 to 1.8% of the total passenger vehicles. The number of registered EVs by island reflects the population, along with travel distances and available charging stations (Figure 11). At the national level, sales of BEVs and PHEVs continues to increase as well (Figure 12). In a ranking of US metropolitan areas, Honolulu comes in fourth in sales of new, all-electric vehicles according to the Wall Street Journal.13 Between April 2013 and March 2014, BEVs accounted for 1.71% of new car sales14. By comparison, San Francisco leads in EV sales at 3.33%, and Atlanta metropolitan area is second at 2.15%15.
In Hawaii, leadership from state and federal government agencies along with the private sector has played a strong role in this growth, by developing EV-friendly policies, attracting national and international EV industry investment, and coordinating public-private efforts such as the Honolulu Clean Cities Program.
Nissan North America, Inc. entered into a Definitive Agreement with the State to promote the use of EVs and charging infrastructure on the islands. In early 2011, Nissan announced that Hawaii would be one of its initial launch markets for the all-electric LEAF in the US. Mitsubishi Motors North America Inc. entered into a Memorandum of Understanding in June 2011 with the State to increase awareness and adoption of EVs, and to assist in the rapid deployment of EV charging infrastructure. In December 2011, Hawaii was the first state to receive the North American version of Mitsubishi’s iCar. Additionally, one of the first Toyota Plug in Prius PHEV’s was tested on Oahu, and became available commercially in Hawaii in 2012, along with the Ford Focus EV.
Local auto dealers and the Hawaii Automotive Dealers Association (HADA) have also played a key role in educating consumers on the benefits of EVs, training technicians to service the vehicles, and working with auto manufacturers to promote the Hawaii market. According to HADA, 4 months before the January 2011 launch of Nissan’s LEAF in Hawaii, 300 vehicles had already been ordered ̶ the highest per-capita out of the seven US rollout markets16.
0
500
1000
1500
2000
2500
3000
Oahu Maui Hawaii Kauai
Num
ber o
f Reg
iste
red
EVs
Figure 11. Number of EVs by island. (Source: "Monthly Energy Trends", State of Hawaii, December 2014.)
10
The State of Hawaii Energy Office implemented an “EV Ready” grant and rebate program in 2010, supported by $4 million in American Recovery and Reinvestment Act funds from the US DOE, together with another $2 million in cost-share from industry partners. This two part program provided grants to support infrastructure development with the installation of public charging stations, along with purchase rebates of up to $4,500 for an EV, and up to $500 for charging equipment (EVSE). Initiated in 2010, the rebate was exhausted by May 2012 with more than 450 issued.
County governments in Hawaii are also taking action to integrate EVs and renewables. For example, Hawaii County added five Chevrolet Volt plug-in cars to their fleet in 2012 (Figure 13). The vehicles are based at the West Hawaii Civic Center, which is equipped with PV panels (Figure 14)17. Working with a third party investor, the County had no capital cost for the PV system and buys the power at half the local utility rate. The County estimates the cost of running the cars on all-electric mode to be equivalent to buying gasoline at $2 to $3 a gallon18. The all-electric range of about 40 miles is typically enough for most single-day use. The charging stations are also available to the public. Savings were estimated at more than $10,000 over six years for each EV purchased to replace a gasoline vehicle19. Using the excess power generated by the PV array for daytime EV charging, the County expects to save 50% electricity costs over the year, and 50%-75% on transportation fuels for the five vehicles (depending on roundtrip distance, driving style, and topography)20. This combination of renewable energy for both transportation and building needs at a LEED-Silver facility is unique for the state of Hawaii.
Projections
In 2008 the HCEI Transportation working group’s least optimistic projection was for 3,060 EVs (BEVs and PHEVs combined), on the road on Oahu by 2015, and 30,600 by 2030. (The most optimistic projection was for 130,320 by 2030.) Nationally, the goal set by the Obama administration for 1 million EVs by 2015 equates to 2,900 EVs on Oahu. (Oahu reached 2,318 EVs by the end of 2014). Other forecasts include the following:
• Pike Research has Hawaii leading all other states by 2020 with 12.3 % of sales as plug in vehicles, and US annual sales at 400,073 by 2020.
• The Center for Climate and Energy Solutions (C2ES), estimates the production of 1,232,200 EVs nationally by 2015, (corresponding to approximately 3,600 EVs on Oahu).
Figure 13. One of Hawaii County’s five Chevy Volts. (Hawaii County
Office of Mayor Billy Kenoi)
Figure 14. West Hawaii Civic Center with it’s 250 kW PV array installed on the parking structure (top right) provides power for the Center and to charge the
County of Hawaii’s EV fleet. (Hawaii County)
11
• The Deloitte Center for Energy Solutions surveyed US electrical utilities, most of which expect EV penetration rates up to 1% of the entire US passenger fleet by 2015, and up to 5% by 2020. (This equates to over 30,000 EVs on Oahu by 2020.)
• JD Powers and Associates projects growth more conservatively for BEVs at 0.6% of US sales (107,998 vehicles), and 1.85% of global vehicle sales in 2020. Sales of hybrids and PHEVs are predicted to grow steadily to 9.6% in 2020 (1,672,739 units).
Nationally and globally, EV sales also continue to increase. In spite of conventional wisdom that would have sales follow the recent downward trend in oil prices, global plug-in vehicle sales rose by about a third in 201421. As EV sales progress from the early adopter phase to the mass market, there may well be a relationship with the price of fuel. However as more renewables are installed on the grid in Hawaii as elsewhere, the volatility of electricity costs are reduced. Even some oil-rich nations are targeting PV for electricity generation, such as Dubai, where the PV target for 2030 was recently tripled to 15% of the country’s total power capacity.
Another key factor in EV adoption is battery durability, power capacity and prices. Typical EV range between charges continues to edge upwards. By contrast, new EV models are being released with ranges comparable to gasoline-powered vehicles. Additionally, battery prices are projected to continue to decrease suggesting the initial cost of EV ownership may come in line in the near future with conventional gasoline vehicles22. In a report published by the Rocky Mountain Institute, lithium-ion EV battery prices are expected to drop by approximately 7% per year to 2020 (Figure 15). Similarly, Deutsche Bank estimates a 20% to 30% yearly cost reduction to 2020 of commercial/utility scale lithium-ion battery systems, following a price drop in half from ~$1,000/kWh at the end of 2013 to ~$500/kWh by the end of 2014. (See Fuel Considerations for more on costs.)
Tourism and EVs
EVs provide economic synergies with the visitor industry, at the heart of Hawaii’s largest economic sector. The visitor population now exceeds 8 million per year, providing a diverse market research opportunity with a significant percentage of early adopters and trendsetters23. Auto and charging equipment manufacturers are able to overcome the initial barrier to many potential customers with the opportunity to test drive and charge an EV. Access to a range of alternatively fueled and highly efficient vehicles is expanding as car rental companies in Hawaii provide
Figure 15. Rocky Mountain Institute aggregate projection for battery prices (dotted green line).
Figure 16. Tesla at Maui Four Seasons.
12

Figure 17. Maui Bio-Beetle biodiesel powered VW.
a means of introducing residents and visitors alike to the experience of driving an EV and other alternately fueled vehicles.
In 2011, Enterprise was the first car rental company in Hawaii to add EVs, and now provides car sharing opportunities. Bio Beetle on Maui started with biodiesel VWs fueled by vegetable oil from Hawaii, and now rents hybrid and electric cars as well (Figure 17). The Hawaiian Electric Vehicle Network on Maui offers the Tesla Model S, Model X, and Roadster, the Nissan LEAF and NV200, the Toyota RAV4 EV, and the BMW i3. PHEVs on offer include the Chevy Volt, Cadillac ELR, Mitsubishi AWD Outlander, BMW i8, Ford Fusion Energi and C-MAX Energi. Rental companies provide special rates to encourage residents to try an EV, along with providing access to pre-owned EVs through vehicle resale. Additionally, many hotels have installed charging stations and encourage their guests to rent EVs, including the Marriott, Sheraton, Westin and Four Seasons, with the latter now offering the Tesla Model S as a shuttle option.
13
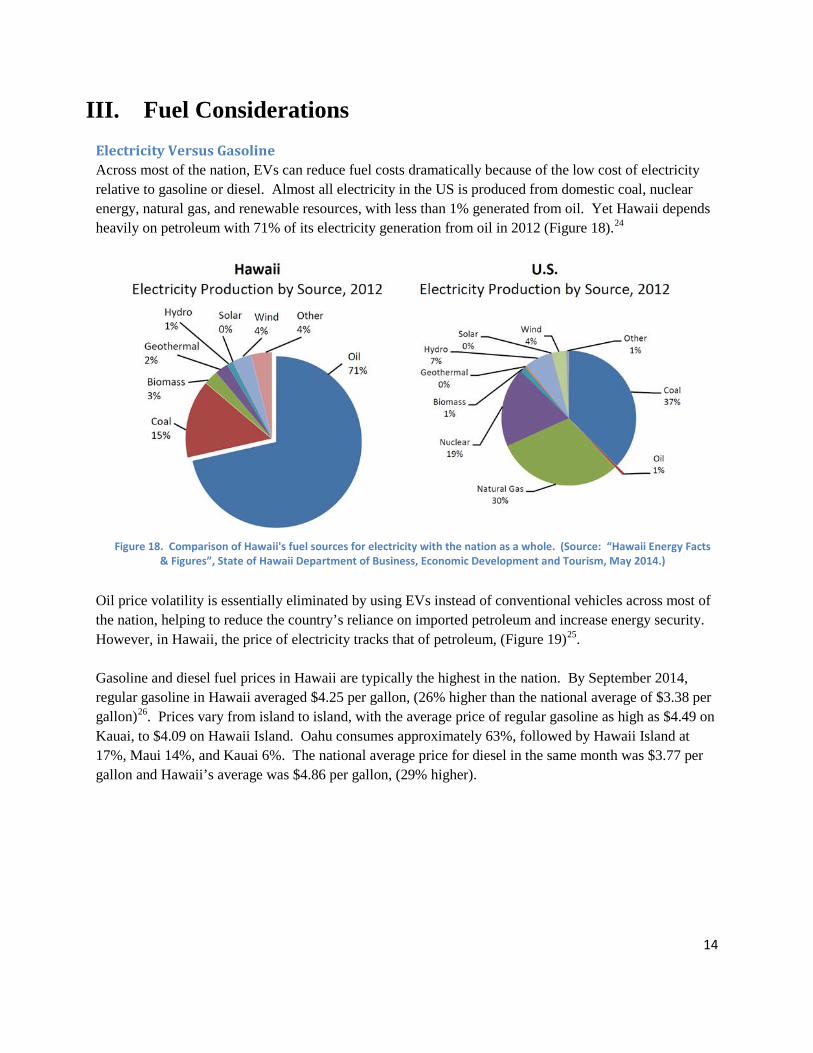
Figure 18. Comparison of Hawaii's fuel sources for electricity with the nation as a whole. (Source: “Hawaii Energy Facts & Figures”, State of Hawaii Department of Business, Economic Development and Tourism, May 2014.)
III. Fuel Considerations Electricity Versus Gasoline Across most of the nation, EVs can reduce fuel costs dramatically because of the low cost of electricity relative to gasoline or diesel. Almost all electricity in the US is produced from domestic coal, nuclear energy, natural gas, and renewable resources, with less than 1% generated from oil. Yet Hawaii depends heavily on petroleum with 71% of its electricity generation from oil in 2012 (Figure 18).24
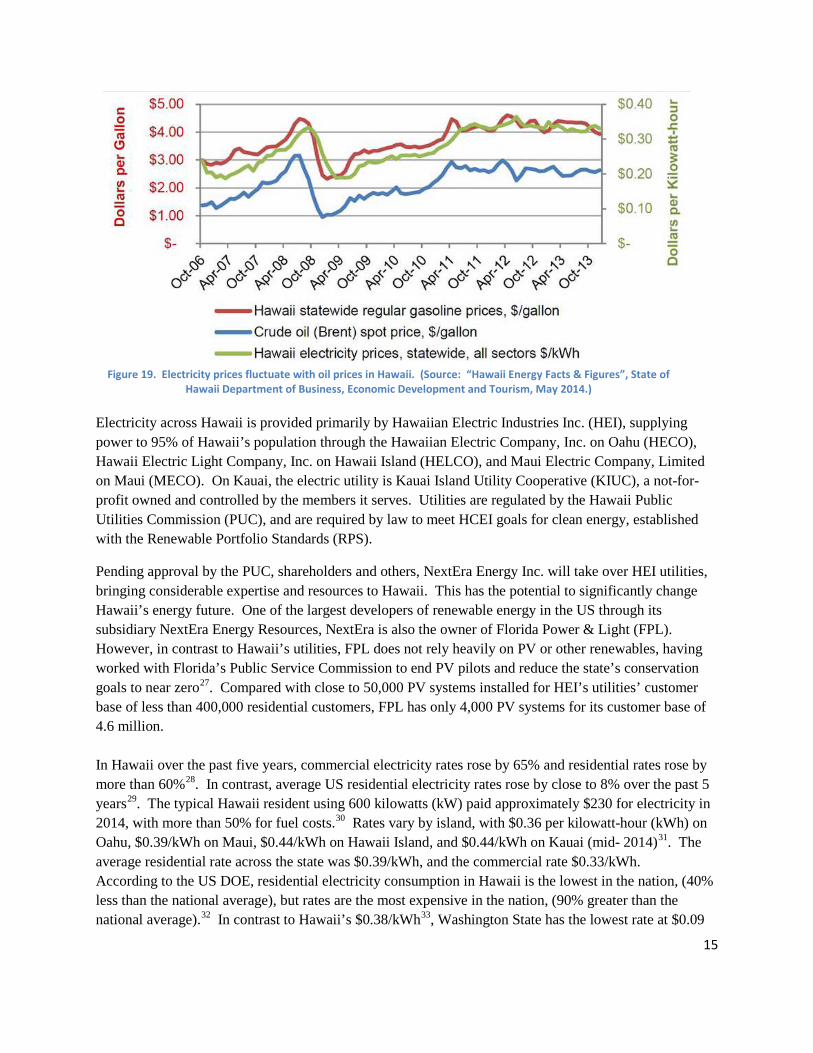
Oil price volatility is essentially eliminated by using EVs instead of conventional vehicles across most of the nation, helping to reduce the country’s reliance on imported petroleum and increase energy security. However, in Hawaii, the price of electricity tracks that of petroleum, (Figure 19)25. Gasoline and diesel fuel prices in Hawaii are typically the highest in the nation. By September 2014, regular gasoline in Hawaii averaged $4.25 per gallon, (26% higher than the national average of $3.38 per gallon)26. Prices vary from island to island, with the average price of regular gasoline as high as $4.49 on Kauai, to $4.09 on Hawaii Island. Oahu consumes approximately 63%, followed by Hawaii Island at 17%, Maui 14%, and Kauai 6%. The national average price for diesel in the same month was $3.77 per gallon and Hawaii’s average was $4.86 per gallon, (29% higher).
14
Electricity across Hawaii is provided primarily by Hawaiian Electric Industries Inc. (HEI), supplying power to 95% of Hawaii’s population through the Hawaiian Electric Company, Inc. on Oahu (HECO), Hawaii Electric Light Company, Inc. on Hawaii Island (HELCO), and Maui Electric Company, Limited on Maui (MECO). On Kauai, the electric utility is Kauai Island Utility Cooperative (KIUC), a not-for-profit owned and controlled by the members it serves. Utilities are regulated by the Hawaii Public Utilities Commission (PUC), and are required by law to meet HCEI goals for clean energy, established with the Renewable Portfolio Standards (RPS).
Pending approval by the PUC, shareholders and others, NextEra Energy Inc. will take over HEI utilities, bringing considerable expertise and resources to Hawaii. This has the potential to significantly change Hawaii’s energy future. One of the largest developers of renewable energy in the US through its subsidiary NextEra Energy Resources, NextEra is also the owner of Florida Power & Light (FPL). However, in contrast to Hawaii’s utilities, FPL does not rely heavily on PV or other renewables, having worked with Florida’s Public Service Commission to end PV pilots and reduce the state’s conservation goals to near zero27. Compared with close to 50,000 PV systems installed for HEI’s utilities’ customer base of less than 400,000 residential customers, FPL has only 4,000 PV systems for its customer base of 4.6 million. In Hawaii over the past five years, commercial electricity rates rose by 65% and residential rates rose by more than 60%28. In contrast, average US residential electricity rates rose by close to 8% over the past 5 years29. The typical Hawaii resident using 600 kilowatts (kW) paid approximately $230 for electricity in 2014, with more than 50% for fuel costs.30 Rates vary by island, with $0.36 per kilowatt-hour (kWh) on Oahu, $0.39/kWh on Maui, $0.44/kWh on Hawaii Island, and $0.44/kWh on Kauai (mid- 2014)31. The average residential rate across the state was $0.39/kWh, and the commercial rate $0.33/kWh. According to the US DOE, residential electricity consumption in Hawaii is the lowest in the nation, (40% less than the national average), but rates are the most expensive in the nation, (90% greater than the national average).32 In contrast to Hawaii’s $0.38/kWh33, Washington State has the lowest rate at $0.09
Figure 19. Electricity prices fluctuate with oil prices in Hawaii. (Source: “Hawaii Energy Facts & Figures”, State of Hawaii Department of Business, Economic Development and Tourism, May 2014.)
15
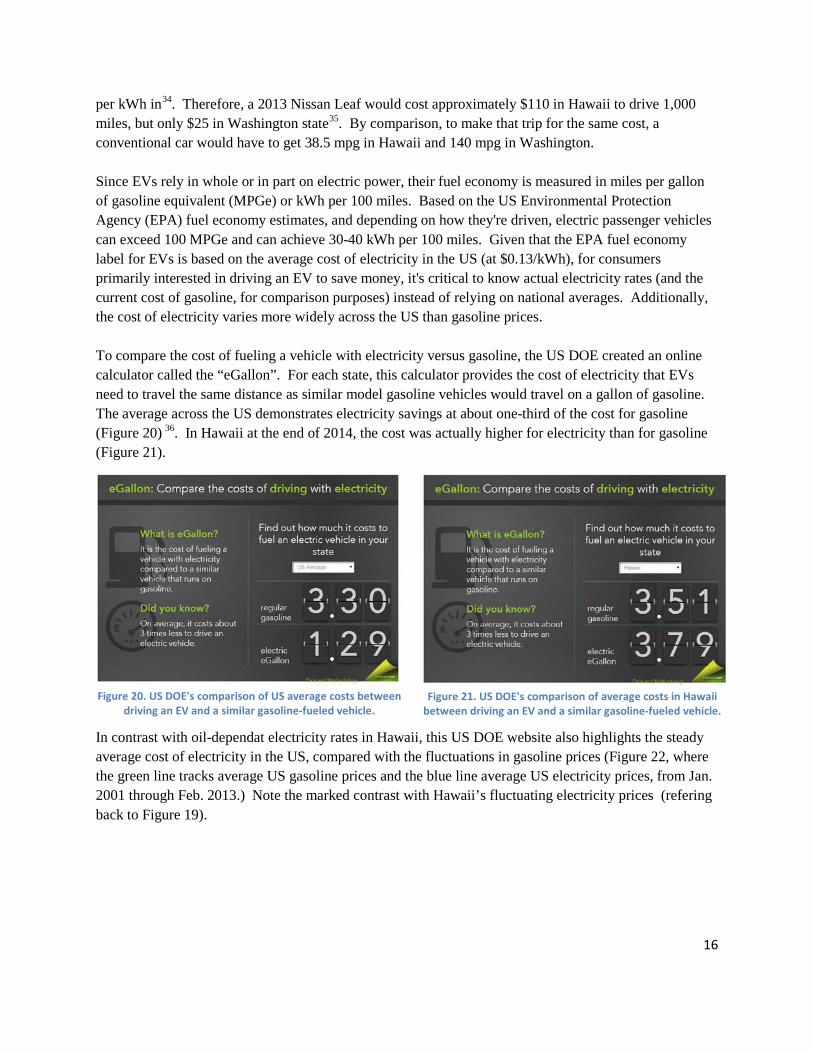
per kWh in34. Therefore, a 2013 Nissan Leaf would cost approximately $110 in Hawaii to drive 1,000 miles, but only $25 in Washington state35. By comparison, to make that trip for the same cost, a conventional car would have to get 38.5 mpg in Hawaii and 140 mpg in Washington. Since EVs rely in whole or in part on electric power, their fuel economy is measured in miles per gallon of gasoline equivalent (MPGe) or kWh per 100 miles. Based on the US Environmental Protection Agency (EPA) fuel economy estimates, and depending on how they're driven, electric passenger vehicles can exceed 100 MPGe and can achieve 30-40 kWh per 100 miles. Given that the EPA fuel economy label for EVs is based on the average cost of electricity in the US (at $0.13/kWh), for consumers primarily interested in driving an EV to save money, it's critical to know actual electricity rates (and the current cost of gasoline, for comparison purposes) instead of relying on national averages. Additionally, the cost of electricity varies more widely across the US than gasoline prices. To compare the cost of fueling a vehicle with electricity versus gasoline, the US DOE created an online calculator called the “eGallon”. For each state, this calculator provides the cost of electricity that EVs need to travel the same distance as similar model gasoline vehicles would travel on a gallon of gasoline. The average across the US demonstrates electricity savings at about one-third of the cost for gasoline (Figure 20) 36. In Hawaii at the end of 2014, the cost was actually higher for electricity than for gasoline (Figure 21).
In contrast with oil-dependat electricity rates in Hawaii, this US DOE website also highlights the steady average cost of electricity in the US, compared with the fluctuations in gasoline prices (Figure 22, where the green line tracks average US gasoline prices and the blue line average US electricity prices, from Jan. 2001 through Feb. 2013.) Note the marked contrast with Hawaii’s fluctuating electricity prices (refering back to Figure 19).
Figure 21. US DOE's comparison of average costs in Hawaii between driving an EV and a similar gasoline-fueled vehicle.
Figure 20. US DOE's comparison of US average costs between driving an EV and a similar gasoline-fueled vehicle.
16
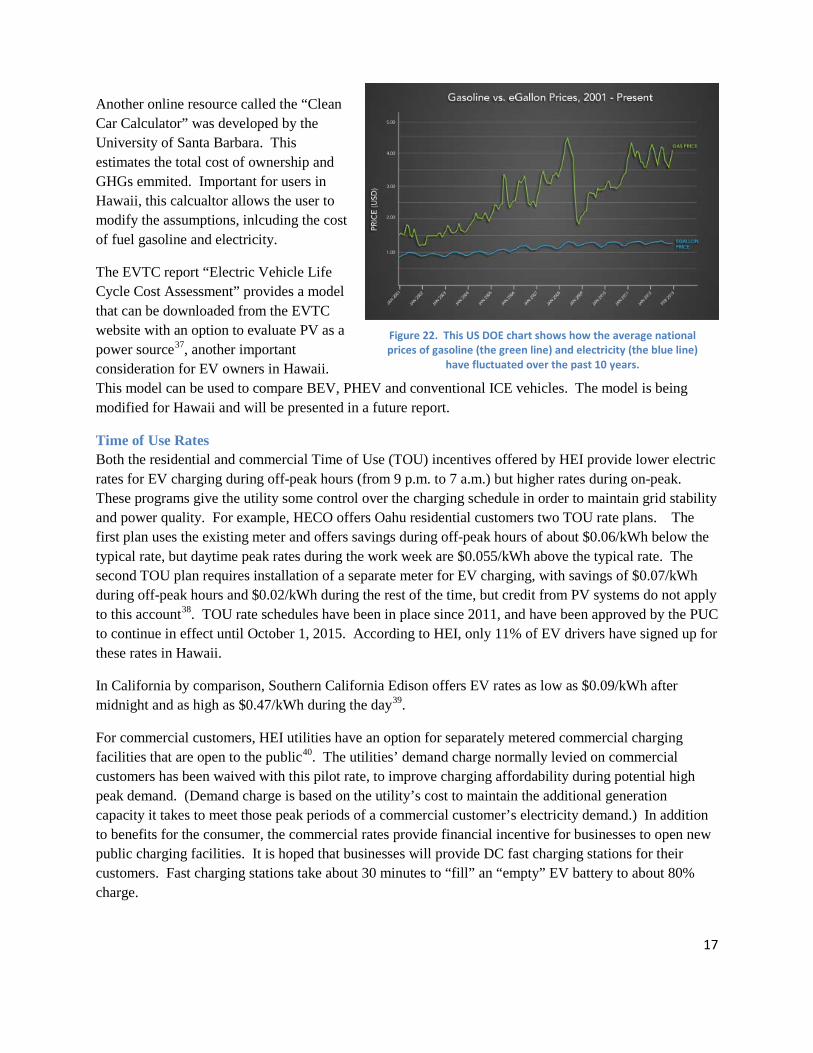
Figure 22. This US DOE chart shows how the average national prices of gasoline (the green line) and electricity (the blue line)
have fluctuated over the past 10 years.
Another online resource called the “Clean Car Calculator” was developed by the University of Santa Barbara. This estimates the total cost of ownership and GHGs emmited. Important for users in Hawaii, this calcualtor allows the user to modify the assumptions, inlcuding the cost of fuel gasoline and electricity.
The EVTC report “Electric Vehicle Life Cycle Cost Assessment” provides a model that can be downloaded from the EVTC website with an option to evaluate PV as a power source37, another important consideration for EV owners in Hawaii. This model can be used to compare BEV, PHEV and conventional ICE vehicles. The model is being modified for Hawaii and will be presented in a future report.
Time of Use Rates Both the residential and commercial Time of Use (TOU) incentives offered by HEI provide lower electric rates for EV charging during off-peak hours (from 9 p.m. to 7 a.m.) but higher rates during on-peak. These programs give the utility some control over the charging schedule in order to maintain grid stability and power quality. For example, HECO offers Oahu residential customers two TOU rate plans. The first plan uses the existing meter and offers savings during off-peak hours of about $0.06/kWh below the typical rate, but daytime peak rates during the work week are $0.055/kWh above the typical rate. The second TOU plan requires installation of a separate meter for EV charging, with savings of $0.07/kWh during off-peak hours and $0.02/kWh during the rest of the time, but credit from PV systems do not apply to this account38. TOU rate schedules have been in place since 2011, and have been approved by the PUC to continue in effect until October 1, 2015. According to HEI, only 11% of EV drivers have signed up for these rates in Hawaii.
In California by comparison, Southern California Edison offers EV rates as low as $0.09/kWh after midnight and as high as $0.47/kWh during the day39.
For commercial customers, HEI utilities have an option for separately metered commercial charging facilities that are open to the public40. The utilities’ demand charge normally levied on commercial customers has been waived with this pilot rate, to improve charging affordability during potential high peak demand. (Demand charge is based on the utility’s cost to maintain the additional generation capacity it takes to meet those peak periods of a commercial customer’s electricity demand.) In addition to benefits for the consumer, the commercial rates provide financial incentive for businesses to open new public charging facilities. It is hoped that businesses will provide DC fast charging stations for their customers. Fast charging stations take about 30 minutes to “fill” an “empty” EV battery to about 80% charge.
17
Photovoltaics and Net Energy Metering The State of Hawaii offers a state tax credit for installation of residential and commercial PV systems. Combined with the federal tax credit, the cost of a system can be recovered in a few years, offering about a 20% return on investment. HEI utilities currently offer Net Energy Metering (NEM), giving PV owners retail credit for excess energy transmitted to the utility grid. Once the owner of the PV system recovers the up-front cost, their electricity costs for the remaining life of the PV system are reduced to the base charge of being connected to the grid.
Nonetheless, HEI has applied with the PUC to cut the NEM rates nearly in half, instead of receiving the full retail rate for the excess electricity sent back to the grid, customers would receive something closer to HEI's cost of avoided generation, which largely reflects the cost of purchased fuel41. HEI have held new PV applications, but were recently directed by the PUC to continue connecting customers. (See also PV Growth.) Many utilities around the country are similarly engaged in efforts to establish cost-based compensation rates for distributed PV customers to ensure satisfactory cost recovery for the utility and equitable cost distributions to all customers.
According to HECO filings from a recent complete rate case, a minimum monthly bill of $25.31 would ensure that all residential customers (with and without PV) are paying for the cost of the Oahu power grid system.
Additionally, Hawaii’s PUC recently approved a financing order for a new, mandatory fee $9 on all HEI utility’s 424,000 residential customers, which went into effect at the end of 2014. This fee is being levied to secure an additional source of low-interest loans for ratepayers who cannot currently purchase PV due to low income or poor credit ratings. The fee was meant to be offset by a reduction in a separate existing public benefits fee, but this was not implemented. Known as “Green Energy Market Securitization”, this has allowed the State’s Department of Business, Economic Development and Tourism (DBEDT) to float $150 million in bonds for these loans, securing repayment of the bonds for up to 20 years at no risk for the utility or the State government. According to DBEDT, the loan program initially targets distributed PV, but will be deployed in a phased approach to make financing available for other (unspecified) clean energy and energy efficient technologies that provide energy cost savings. The program combines a traditional rate-reduction bond structure and on-bill financing. Goldman Sachs and Citigroup were the leading managers for the bond sale, and local investors were able to place orders during a special retail order period42. Interest on the bonds is exempt from state taxes, since the state has designated the bonds as "green bonds". According to Pacific Business News, Hawaii is the first state in the nation to use this type of financing structure to help consumers pay for clean energy installations.
Currently, another additional fee for ratepayers is before the Hawaii PUC, again including those that have already invested their own finances to install a PV system. This would add $50 (MECO), $55 (HECO) and $61 (HELCO) to monthly electricity bills should it receive approval.
18
In response to orders from the PUC, HEI’s utilities developed the Power Supply Improvement Plan. According to this plan, accelerating the growth in the EV market can have a positive impact on the cost of electricity, spreading the fixed costs of the grid over larger usage. The plan also notes that EV charging done at times of high renewable generation will allow excess energy to be used and will keep the marginal cost to serve the EV load low, benefiting all electricity customers.
KIUC on Kauai offered NEM as a pilot program to owners of PV systems producing less than 50kW, (most homeowners), until the program became fully subscribed, as was the program for larger (commercial) systems43. Under this pilot program, KIUC purchases excess power from subscribed customers at a fixed rate with fixed terms of $0.20/kWh for 20 years. Complementing this, KIUC’s smart grid technology includes wireless meters installed at 28,000 homes and businesses, allowing customers to log into a website where they can track their energy use. As a cooperative, a notable difference in the utility’s operating approach is that KIUC has returned $29 million in the last ten years to its members in the form of patronage capital and billing credits.
IV. EV Integration into the Power System Along with vastly larger power grids, utilities in the contiguous US have more choices than Hawaii for conventional sources of electricity production, including cost-effective nuclear, natural gas and large-scale hydroelectric. This leads to more options for balancing intermittent renewable power generation along with a relatively stable price of electricity. By contrast, the electrical grid system on each Hawaiian Island is independent, with no neighboring utilities from which to draw power in the event of a problem. This requires additional backup capabilities to maintain a stable and reliable power supply.
In 2013, approximately 18% of the state’s electricity was generated from renewable sources, including bioenergy, geothermal, wind and solar44. HEI utilities reported renewable generation reaching 18.2% by the end of 2013, and energy efficiency achieving another 16.4%. KIUC is also on track to meet the HCEI goals with about 15% of electricity currently generated from hydropower and solar resources. Another 12 % renewable power is planned for the near term based on two KIUC-owned PV farms, customer (distributed) PV, and a biomass plant. HEI’s Power Supply Improvement Plan has the utilities now aiming for a combined target of 67% renewable energy generation for Oahu, Maui and Hawaii Island by 2030, with 61% for the island of Oahu where most of the state's population resides. This includes almost tripling the amount of distributed PV power. KIUC is aiming for 50% for Kauai by 2023, with numerous hydropower and PV projects under consideration.
These increases in intermittent energy generation along with a rapidly growing demand for electricity for EVs mean that utilities must find innovative ways to balance the grid and maintain reliability. Utilities
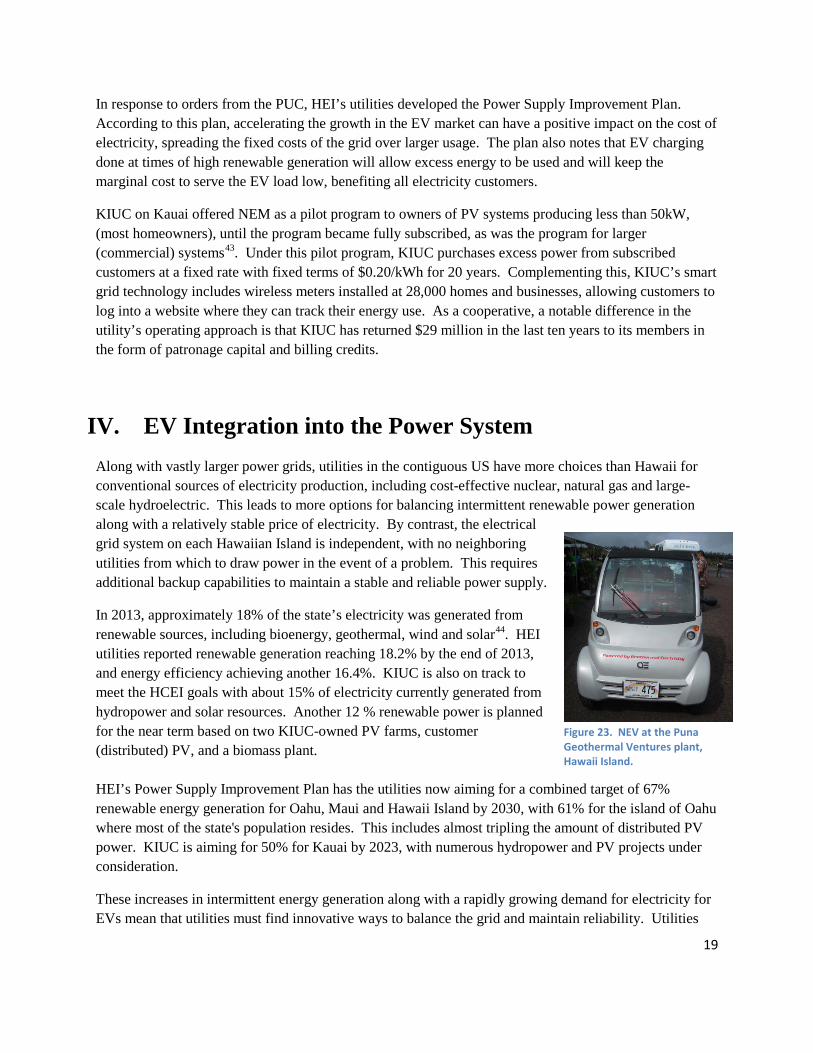
Figure 23. NEV at the Puna Geothermal Ventures plant, Hawaii Island.
19
must be able to continue providing reliable power to meet customer demands by mitigating the power loss from cloud cover or when the wind suddenly drops off. Similarly, to maintain reliable service across the distribution system, the utilities have to be able to deal with a potential spike in demand if thousands of EVs charge simultaneously on various circuits. Like other electricity power systems designed originally to generate power from large, centralized sources and send that power out to customers, Hawaii’s utilities are racing to become highly flexible and responsive to the new, two-way flow of power across the grid, along with the changing load profiles.
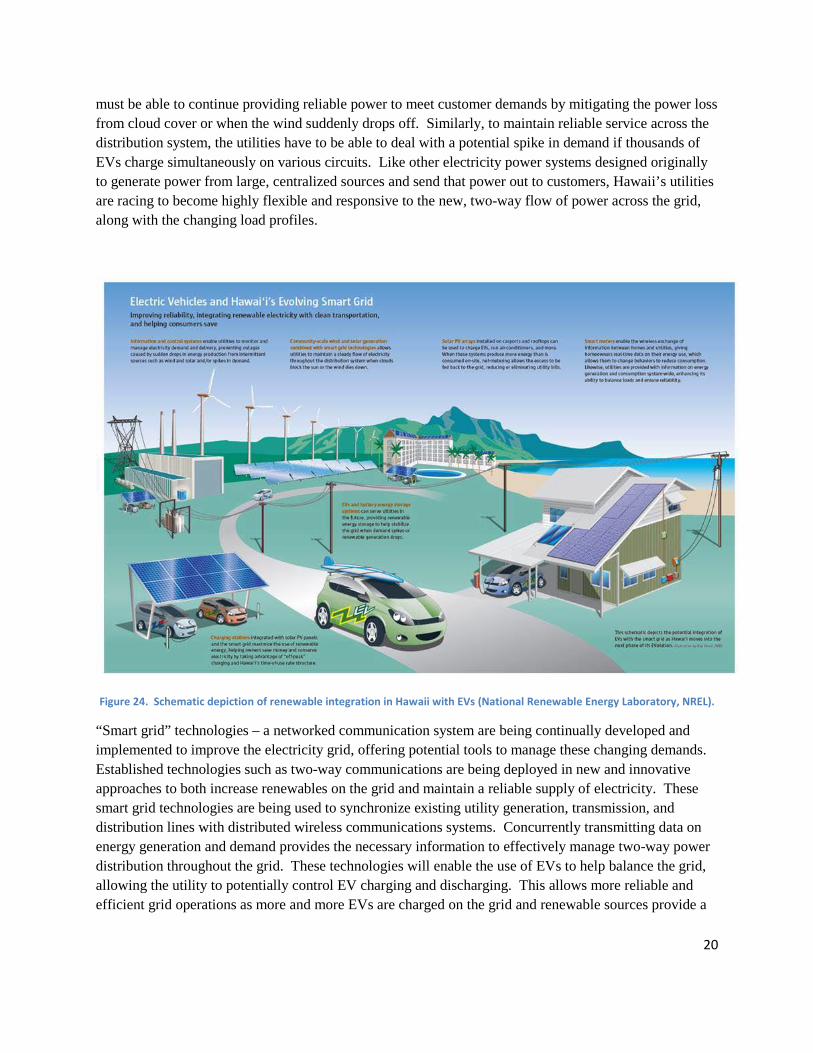
Figure 24. Schematic depiction of renewable integration in Hawaii with EVs (National Renewable Energy Laboratory, NREL).
“Smart grid” technologies – a networked communication system are being continually developed and implemented to improve the electricity grid, offering potential tools to manage these changing demands. Established technologies such as two-way communications are being deployed in new and innovative approaches to both increase renewables on the grid and maintain a reliable supply of electricity. These smart grid technologies are being used to synchronize existing utility generation, transmission, and distribution lines with distributed wireless communications systems. Concurrently transmitting data on energy generation and demand provides the necessary information to effectively manage two-way power distribution throughout the grid. These technologies will enable the use of EVs to help balance the grid, allowing the utility to potentially control EV charging and discharging. This allows more reliable and efficient grid operations as more and more EVs are charged on the grid and renewable sources provide a
20
greater portion of Hawaii’s energy generation. Smart grid benefits also increase consumers’ ability to control their energy use and costs.
Utilities in Hawaii have demand response programs where communication technologies are used to decrease energy use. Non-essential uses of electricity can be momentarily lowered by the utility, helping to match renewable energy supply with demand, such as briefly turning off water heating tanks during peak load. Grid-to-vehicle (G2V) charging of EVs offers demand response by briefly lowering or halting charging. Another way utilities could take advantage of G2V demand response would be to help prevent transformer overheating – a potential challenge for the grid assuming EVs proliferate and distributed EV charging becomes concentrated in certain neighborhoods. Concentrations of PV systems on certain neighborhood circuits can exacerbate the issue as a result of the intermittency in PV resources.
EVs also have the potential for energy storage when used as a backup at times with little PV or wind power production. This reverse charging or vehicle-to-grid (V2G) can potentially help to regulate the fluctuations in variable renewable energy resources. The technology required includes two-way inverters in the vehicles to both charge and discharge the batteries, along with a smart grid.
PV Growth Hawaii currently ranks first in the nation for PV power generation per capita, with close to 50,000 net-metered PV customers at the end of 2014. On Oahu, roughly 12% of customers have rooftop PV45, compared to an estimated US average of 0.5%, according to the Solar Electric Power Association. Hawaii’s total PV capacity now exceeds 250 megawatt (MW) from distributed PV and the average capacity of newly installed, residential net-metered PV systems in Hawaii has also been increasing (Figure 25).
21
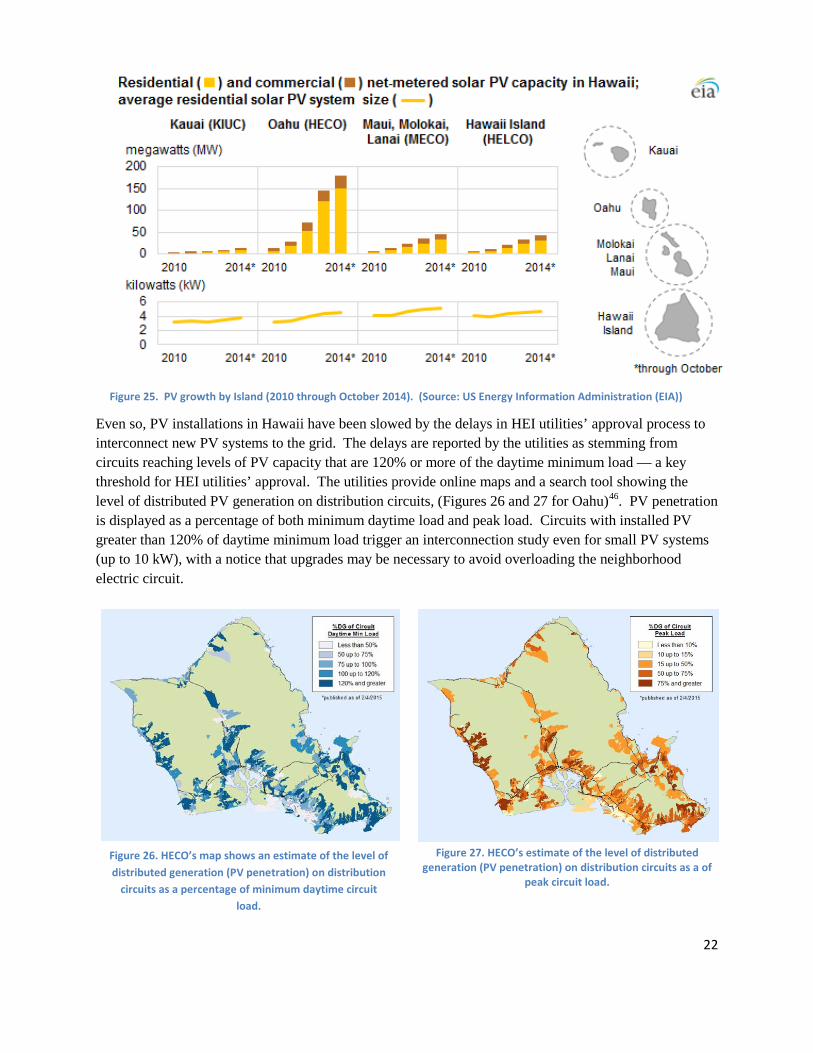
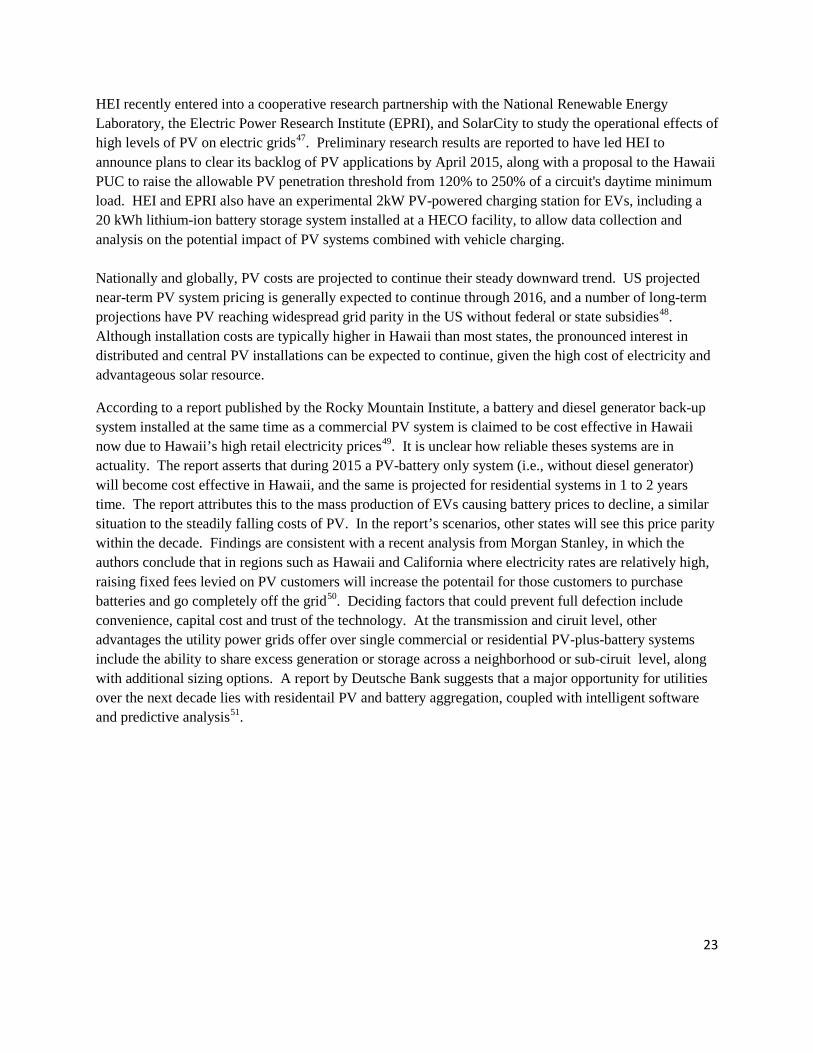
Even so, PV installations in Hawaii have been slowed by the delays in HEI utilities’ approval process to interconnect new PV systems to the grid. The delays are reported by the utilities as stemming from circuits reaching levels of PV capacity that are 120% or more of the daytime minimum load — a key threshold for HEI utilities’ approval. The utilities provide online maps and a search tool showing the level of distributed PV generation on distribution circuits, (Figures 26 and 27 for Oahu)46. PV penetration is displayed as a percentage of both minimum daytime load and peak load. Circuits with installed PV greater than 120% of daytime minimum load trigger an interconnection study even for small PV systems (up to 10 kW), with a notice that upgrades may be necessary to avoid overloading the neighborhood electric circuit.
Figure 26. HECO’s map shows an estimate of the level of distributed generation (PV penetration) on distribution
circuits as a percentage of minimum daytime circuit load.
Figure 27. HECO’s estimate of the level of distributed generation (PV penetration) on distribution circuits as a of
peak circuit load.
Figure 25. PV growth by Island (2010 through October 2014). (Source: US Energy Information Administration (EIA))
22
HEI recently entered into a cooperative research partnership with the National Renewable Energy Laboratory, the Electric Power Research Institute (EPRI), and SolarCity to study the operational effects of high levels of PV on electric grids47. Preliminary research results are reported to have led HEI to announce plans to clear its backlog of PV applications by April 2015, along with a proposal to the Hawaii PUC to raise the allowable PV penetration threshold from 120% to 250% of a circuit's daytime minimum load. HEI and EPRI also have an experimental 2kW PV-powered charging station for EVs, including a 20 kWh lithium-ion battery storage system installed at a HECO facility, to allow data collection and analysis on the potential impact of PV systems combined with vehicle charging. Nationally and globally, PV costs are projected to continue their steady downward trend. US projected near-term PV system pricing is generally expected to continue through 2016, and a number of long-term projections have PV reaching widespread grid parity in the US without federal or state subsidies48. Although installation costs are typically higher in Hawaii than most states, the pronounced interest in distributed and central PV installations can be expected to continue, given the high cost of electricity and advantageous solar resource.
According to a report published by the Rocky Mountain Institute, a battery and diesel generator back-up system installed at the same time as a commercial PV system is claimed to be cost effective in Hawaii now due to Hawaii’s high retail electricity prices49. It is unclear how reliable theses systems are in actuality. The report asserts that during 2015 a PV-battery only system (i.e., without diesel generator) will become cost effective in Hawaii, and the same is projected for residential systems in 1 to 2 years time. The report attributes this to the mass production of EVs causing battery prices to decline, a similar situation to the steadily falling costs of PV. In the report’s scenarios, other states will see this price parity within the decade. Findings are consistent with a recent analysis from Morgan Stanley, in which the authors conclude that in regions such as Hawaii and California where electricity rates are relatively high, raising fixed fees levied on PV customers will increase the potentail for those customers to purchase batteries and go completely off the grid50. Deciding factors that could prevent full defection include convenience, capital cost and trust of the technology. At the transmission and ciruit level, other advantages the utility power grids offer over single commercial or residential PV-plus-battery systems include the ability to share excess generation or storage across a neighborhood or sub-ciruit level, along with additional sizing options. A report by Deutsche Bank suggests that a major opportunity for utilities over the next decade lies with residentail PV and battery aggregation, coupled with intelligent software and predictive analysis51.
23
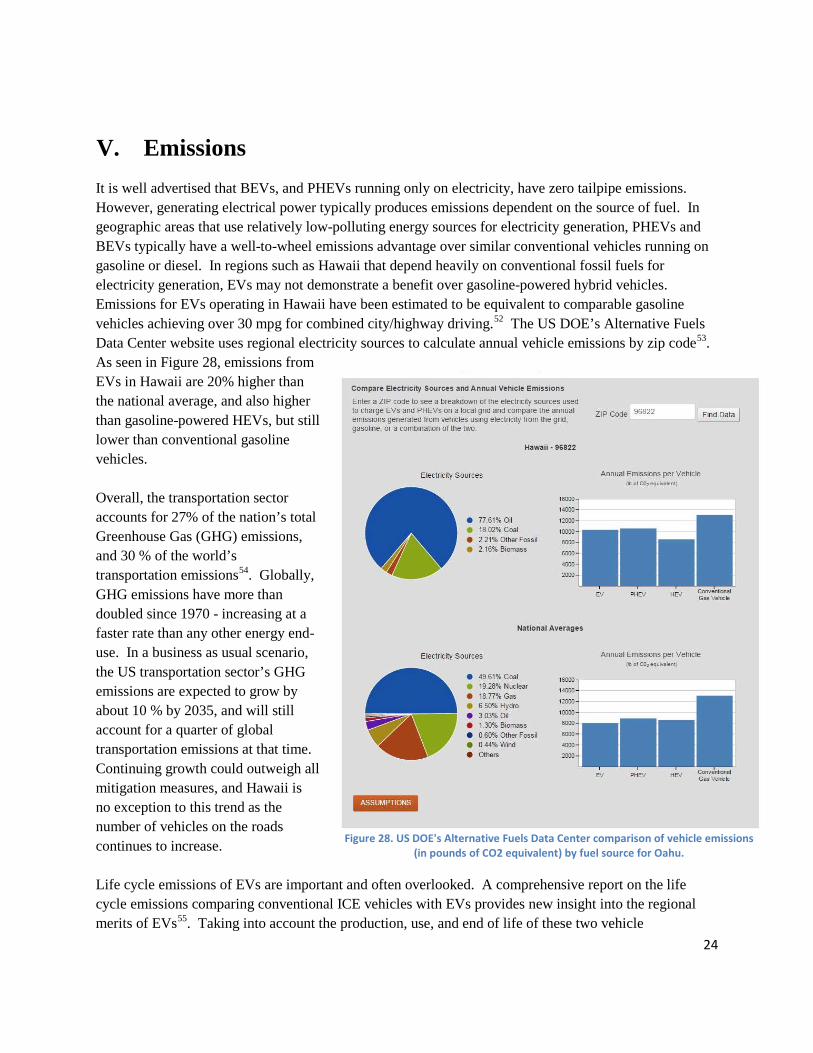
V. Emissions It is well advertised that BEVs, and PHEVs running only on electricity, have zero tailpipe emissions. However, generating electrical power typically produces emissions dependent on the source of fuel. In geographic areas that use relatively low-polluting energy sources for electricity generation, PHEVs and BEVs typically have a well-to-wheel emissions advantage over similar conventional vehicles running on gasoline or diesel. In regions such as Hawaii that depend heavily on conventional fossil fuels for electricity generation, EVs may not demonstrate a benefit over gasoline-powered hybrid vehicles. Emissions for EVs operating in Hawaii have been estimated to be equivalent to comparable gasoline vehicles achieving over 30 mpg for combined city/highway driving.52 The US DOE’s Alternative Fuels Data Center website uses regional electricity sources to calculate annual vehicle emissions by zip code53. As seen in Figure 28, emissions from EVs in Hawaii are 20% higher than the national average, and also higher than gasoline-powered HEVs, but still lower than conventional gasoline vehicles. Overall, the transportation sector accounts for 27% of the nation’s total Greenhouse Gas (GHG) emissions, and 30 % of the world’s transportation emissions54. Globally, GHG emissions have more than doubled since 1970 - increasing at a faster rate than any other energy end-use. In a business as usual scenario, the US transportation sector’s GHG emissions are expected to grow by about 10 % by 2035, and will still account for a quarter of global transportation emissions at that time. Continuing growth could outweigh all mitigation measures, and Hawaii is no exception to this trend as the number of vehicles on the roads continues to increase. Life cycle emissions of EVs are important and often overlooked. A comprehensive report on the life cycle emissions comparing conventional ICE vehicles with EVs provides new insight into the regional merits of EVs55. Taking into account the production, use, and end of life of these two vehicle
Figure 28. US DOE's Alternative Fuels Data Center comparison of vehicle emissions (in pounds of CO2 equivalent) by fuel source for Oahu.
24
technologies revealed that the production phase of EVs proved substantially more environmentally intensive. However when EVs are powered with clean energy sources, substantial overall improvements in global warming potential and other impacts can be achieved relative to comparable gasoline-powered vehicles. The report concludes that is it counterproductive to promote EVs in regions where electricity is produced from oil, coal, and lignite combustion. Recommendations for the electrification of transportation include focusing policy development on life cycle management to counter potential setbacks in terms of water pollution and toxicity. For EVs to contribute positively to pollution mitigation efforts at the global level, development of the transportation, electricity, electronic, and metal industry sectors must be jointly and consistently addressed. For Hawaii, further investigation is needed to determine the life cycle emissions and relative merits of EVs powered by planned and proposed future energy sources.
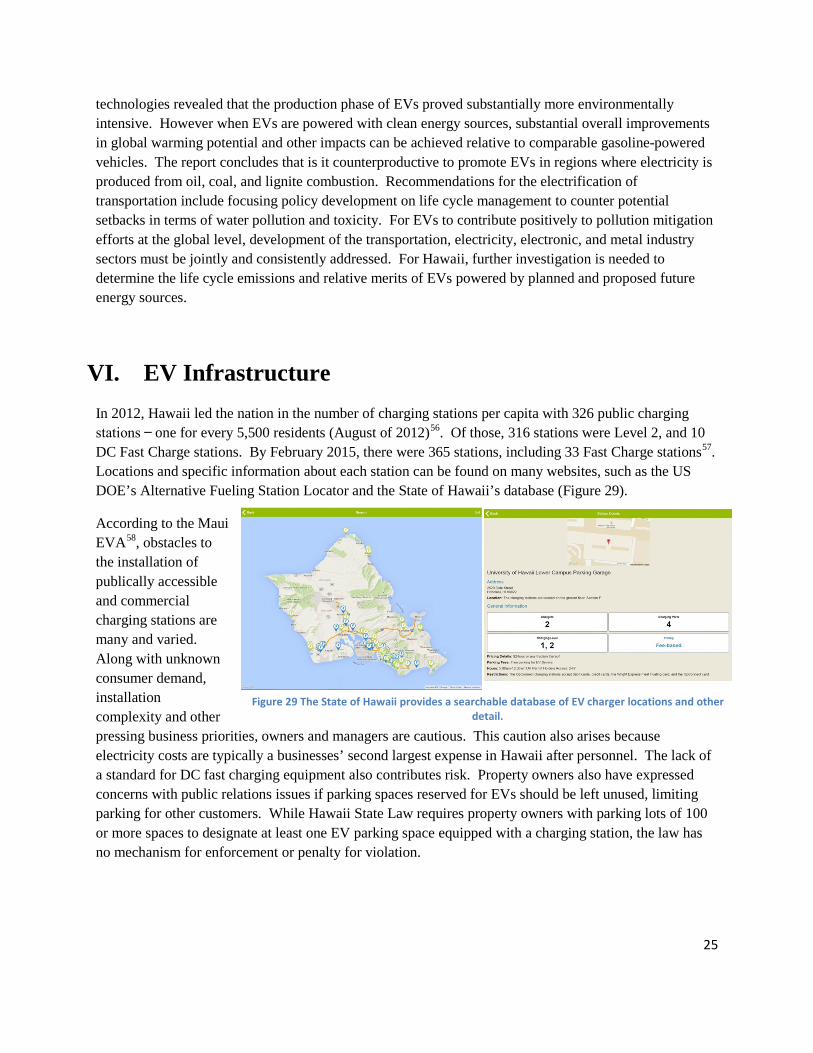
VI. EV Infrastructure In 2012, Hawaii led the nation in the number of charging stations per capita with 326 public charging stations ̶ one for every 5,500 residents (August of 2012)56. Of those, 316 stations were Level 2, and 10 DC Fast Charge stations. By February 2015, there were 365 stations, including 33 Fast Charge stations57. Locations and specific information about each station can be found on many websites, such as the US DOE’s Alternative Fueling Station Locator and the State of Hawaii’s database (Figure 29).
According to the Maui EVA58, obstacles to the installation of publically accessible and commercial charging stations are many and varied. Along with unknown consumer demand, installation complexity and other pressing business priorities, owners and managers are cautious. This caution also arises because electricity costs are typically a businesses’ second largest expense in Hawaii after personnel. The lack of a standard for DC fast charging equipment also contributes risk. Property owners also have expressed concerns with public relations issues if parking spaces reserved for EVs should be left unused, limiting parking for other customers. While Hawaii State Law requires property owners with parking lots of 100 or more spaces to designate at least one EV parking space equipped with a charging station, the law has no mechanism for enforcement or penalty for violation.
Figure 29 The State of Hawaii provides a searchable database of EV charger locations and other detail.
25
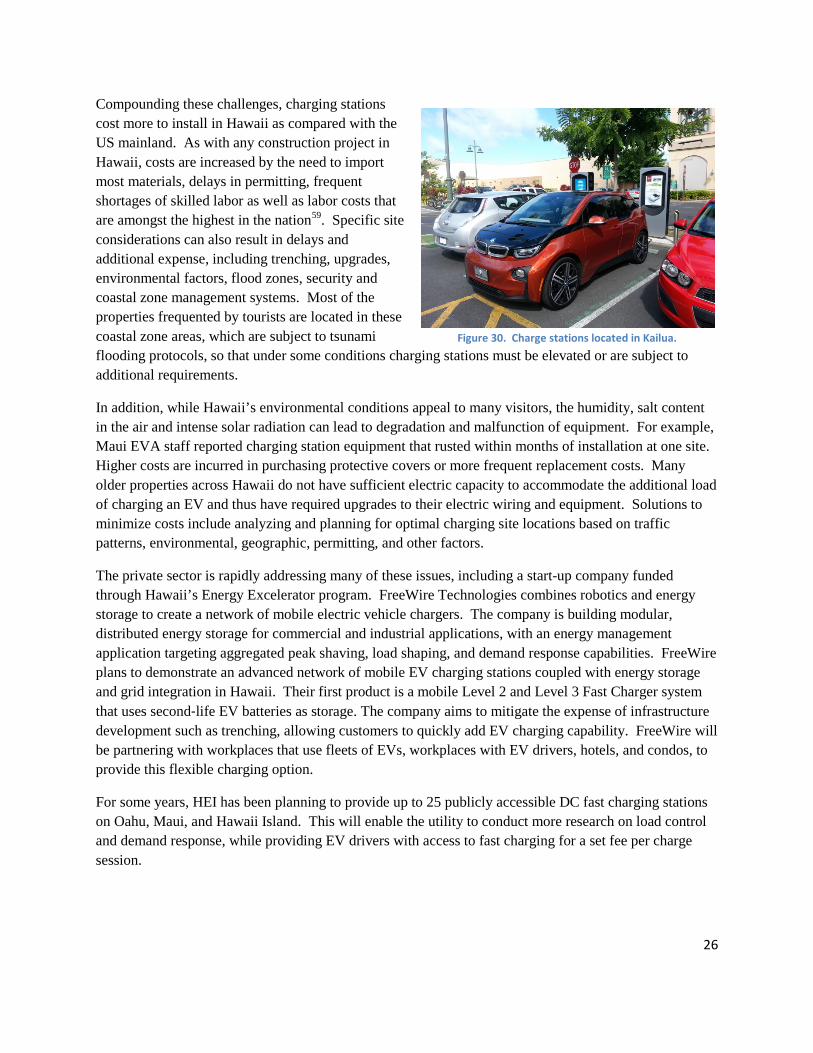
Compounding these challenges, charging stations cost more to install in Hawaii as compared with the US mainland. As with any construction project in Hawaii, costs are increased by the need to import most materials, delays in permitting, frequent shortages of skilled labor as well as labor costs that are amongst the highest in the nation59. Specific site considerations can also result in delays and additional expense, including trenching, upgrades, environmental factors, flood zones, security and coastal zone management systems. Most of the properties frequented by tourists are located in these coastal zone areas, which are subject to tsunami flooding protocols, so that under some conditions charging stations must be elevated or are subject to additional requirements.
In addition, while Hawaii’s environmental conditions appeal to many visitors, the humidity, salt content in the air and intense solar radiation can lead to degradation and malfunction of equipment. For example, Maui EVA staff reported charging station equipment that rusted within months of installation at one site. Higher costs are incurred in purchasing protective covers or more frequent replacement costs. Many older properties across Hawaii do not have sufficient electric capacity to accommodate the additional load of charging an EV and thus have required upgrades to their electric wiring and equipment. Solutions to minimize costs include analyzing and planning for optimal charging site locations based on traffic patterns, environmental, geographic, permitting, and other factors.
The private sector is rapidly addressing many of these issues, including a start-up company funded through Hawaii’s Energy Excelerator program. FreeWire Technologies combines robotics and energy storage to create a network of mobile electric vehicle chargers. The company is building modular, distributed energy storage for commercial and industrial applications, with an energy management application targeting aggregated peak shaving, load shaping, and demand response capabilities. FreeWire plans to demonstrate an advanced network of mobile EV charging stations coupled with energy storage and grid integration in Hawaii. Their first product is a mobile Level 2 and Level 3 Fast Charger system that uses second‐life EV batteries as storage. The company aims to mitigate the expense of infrastructure development such as trenching, allowing customers to quickly add EV charging capability. FreeWire will be partnering with workplaces that use fleets of EVs, workplaces with EV drivers, hotels, and condos, to provide this flexible charging option.
For some years, HEI has been planning to provide up to 25 publicly accessible DC fast charging stations on Oahu, Maui, and Hawaii Island. This will enable the utility to conduct more research on load control and demand response, while providing EV drivers with access to fast charging for a set fee per charge session.
Figure 30. Charge stations located in Kailua.
26
VII. Research and Demonstration Projects Systems Integration HNEI, the utilities, Department of Defense (DOD) and other stakeholders continue to evaluate which technologies best fit Hawaii’s needs and provide the most value. The EVTC and other projects are exploring the role that EVs can play in integrating high levels of PV and wind into the power grid. These studies also address concerns shared by utilities around the country, that adequate preparation is needed to avoid stress on power grid circuits from the additional demand for electricity from widespread EV charging. Toward that end, HNEI is conducting ongoing technical analysis exploring the impact on the grid of various high-penetration, intermittent renewable energy scenarios.
HNEI commissioned General Electric International, Inc. (GE) to perform detailed, electrical dispatch modeling to estimate the amount of excess (curtailed) energy captured by controlled charging of a large number of EVs, (“Oahu Electric Vehicle Charging Study”, 2013)60. Renewable energy base cases were modeled with 600 MW to 1000 MW of combined wind and PV capacity on the future Oahu grid with a peak load of about 1200 MW. Under the modeled future renewable energy base cases before EVs were added, 10 to 23 % of the combined wind and solar energy were curtailed when these resources exceeded the maximum that could be absorbed into the grid. Wind power resulted in more curtailed energy than PV, due to the higher variability of wind as a renewable resource. Grid-connected EVs were explored for their potential to take up the curtailed energy on the Oahu grid. Approximately 10 to 30 % of light-duty (passenger) vehicles on Oahu were replaced with EVs in this study. Additional petroleum fuel for electricity generation (to balance the intermittency of wind and solar) was quantified for each future scenario’s EV load. It was expected that much of this curtailed energy would be captured by strategically charged EVs. Nonetheless, it was found that day-to-day variations in total wind and solar curtailment reduced the effectiveness of controlled EV charging in capturing curtailed energy. With this very large fleet of EVs and assuming all EVs follow a practical, controlled charging profile, curtailed energy was reduced by 18 to 46 %. However further improvements in the electric grid were also indicated to reduce curtailed energy. With hourly EV load and curtailed energy data from the GE models as input, a relatively simple spreadsheet was shown to be accurate (within ½ of one percent), in calculating the amount of curtailed energy captured in each charging scenario. Significantly, this simple spreadsheet could be used when actual hourly data becomes available for curtailed energy and EV load. An EV analysis was subsequently performed to quantify the effects of curtailment on electrified transportation. Results show that overall fuel and emissions savings can be made on Oahu by replacing average mileage gasoline vehicles (achieving less than 22 mpg) with EVs. To put this into perspective for Oahu’s existing electric power system, EVs achieve approximately 32 miles per gallon equivalent to gasoline (MPGe)61. Cleary EVs on Oahu’s grid now and in the future save fuel compared to average gasoline vehicles. In the modeled future scenarios, the same gasoline savings made by the very large fleets of EVs would be comparable to improving Oahu’s entire passenger vehicle fleet by 1 to 4mpg
27
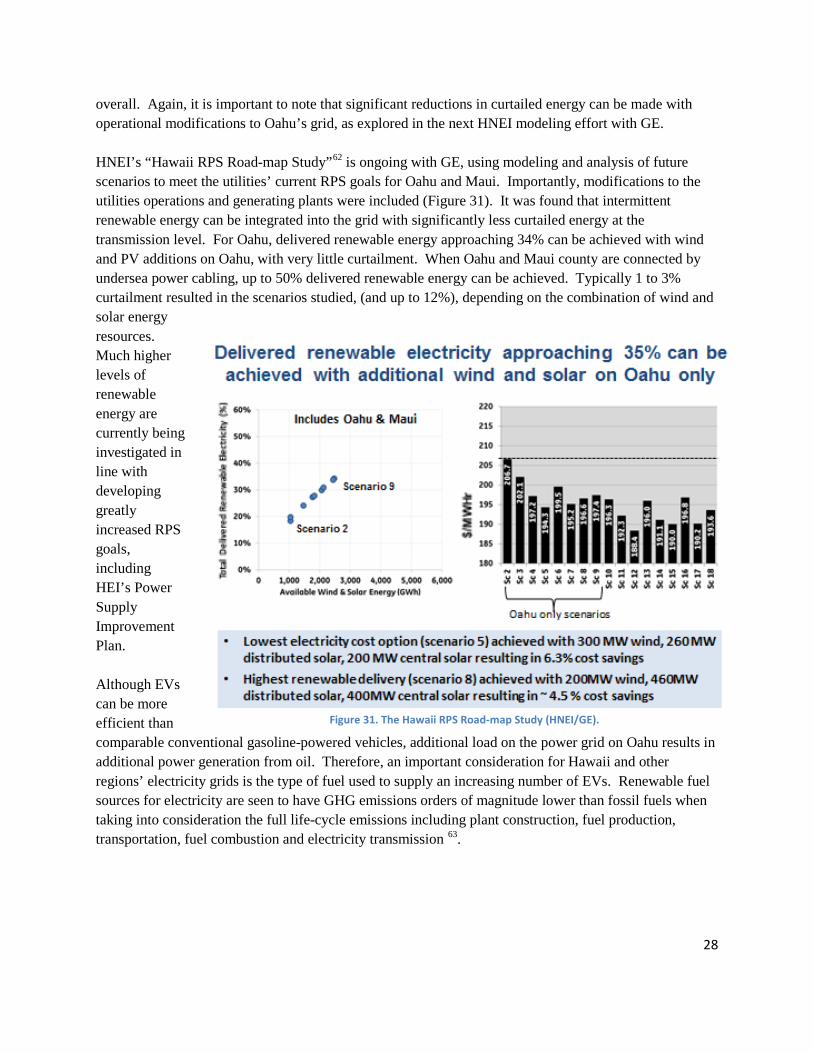
overall. Again, it is important to note that significant reductions in curtailed energy can be made with operational modifications to Oahu’s grid, as explored in the next HNEI modeling effort with GE. HNEI’s “Hawaii RPS Road-map Study”62 is ongoing with GE, using modeling and analysis of future scenarios to meet the utilities’ current RPS goals for Oahu and Maui. Importantly, modifications to the utilities operations and generating plants were included (Figure 31). It was found that intermittent renewable energy can be integrated into the grid with significantly less curtailed energy at the transmission level. For Oahu, delivered renewable energy approaching 34% can be achieved with wind and PV additions on Oahu, with very little curtailment. When Oahu and Maui county are connected by undersea power cabling, up to 50% delivered renewable energy can be achieved. Typically 1 to 3% curtailment resulted in the scenarios studied, (and up to 12%), depending on the combination of wind and solar energy resources. Much higher levels of renewable energy are currently being investigated in line with developing greatly increased RPS goals, including HEI’s Power Supply Improvement Plan. Although EVs can be more efficient than comparable conventional gasoline-powered vehicles, additional load on the power grid on Oahu results in additional power generation from oil. Therefore, an important consideration for Hawaii and other regions’ electricity grids is the type of fuel used to supply an increasing number of EVs. Renewable fuel sources for electricity are seen to have GHG emissions orders of magnitude lower than fossil fuels when taking into consideration the full life-cycle emissions including plant construction, fuel production, transportation, fuel combustion and electricity transmission 63.
Figure 31. The Hawaii RPS Road-map Study (HNEI/GE).
28
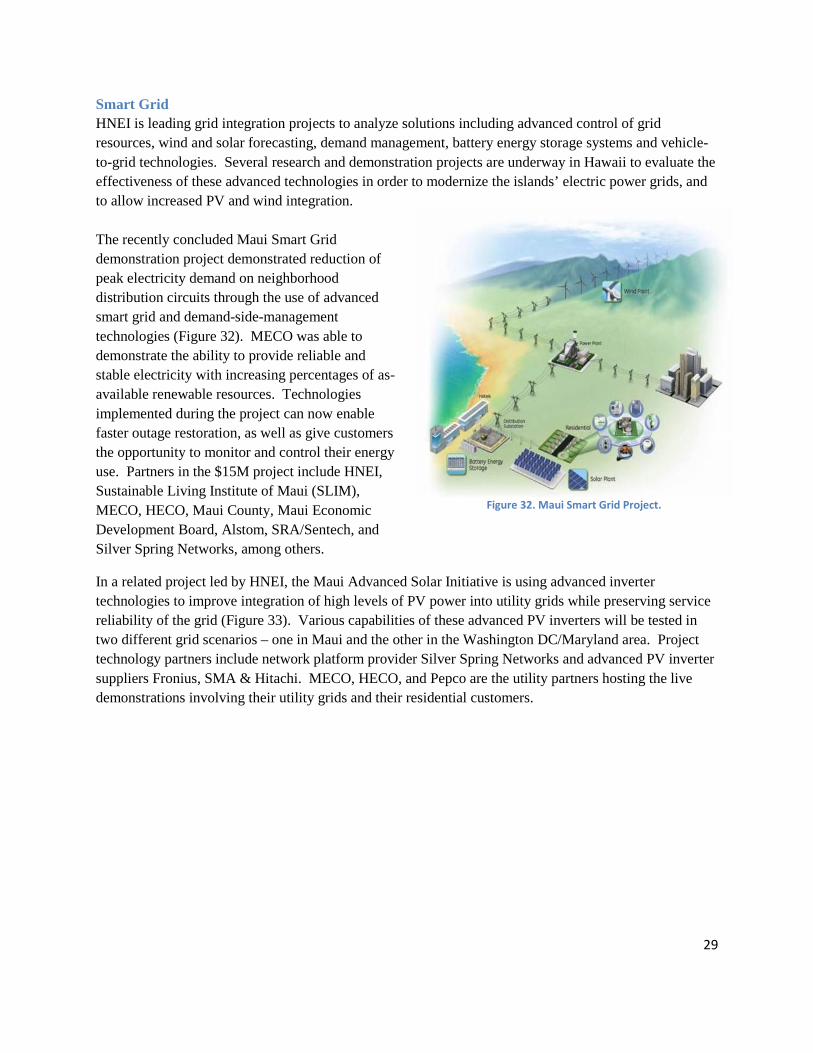
Smart Grid HNEI is leading grid integration projects to analyze solutions including advanced control of grid resources, wind and solar forecasting, demand management, battery energy storage systems and vehicle-to-grid technologies. Several research and demonstration projects are underway in Hawaii to evaluate the effectiveness of these advanced technologies in order to modernize the islands’ electric power grids, and to allow increased PV and wind integration. The recently concluded Maui Smart Grid demonstration project demonstrated reduction of peak electricity demand on neighborhood distribution circuits through the use of advanced smart grid and demand-side-management technologies (Figure 32). MECO was able to demonstrate the ability to provide reliable and stable electricity with increasing percentages of as-available renewable resources. Technologies implemented during the project can now enable faster outage restoration, as well as give customers the opportunity to monitor and control their energy use. Partners in the $15M project include HNEI, Sustainable Living Institute of Maui (SLIM), MECO, HECO, Maui County, Maui Economic Development Board, Alstom, SRA/Sentech, and Silver Spring Networks, among others.
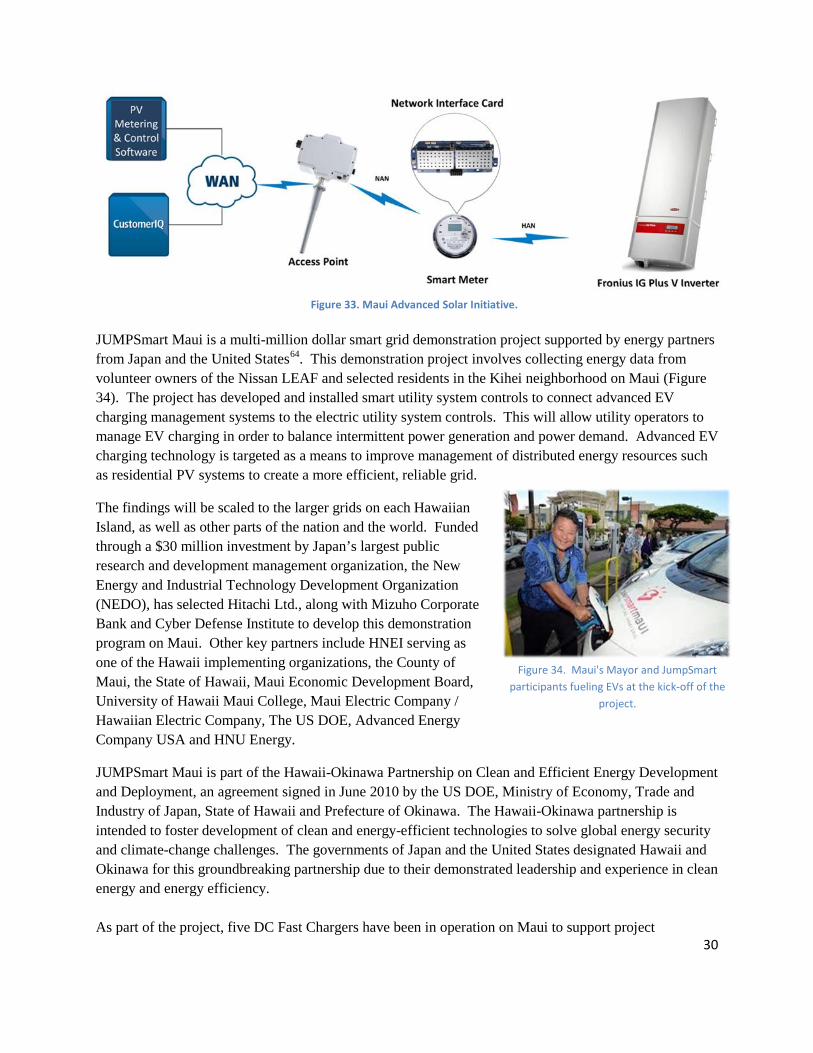
In a related project led by HNEI, the Maui Advanced Solar Initiative is using advanced inverter technologies to improve integration of high levels of PV power into utility grids while preserving service reliability of the grid (Figure 33). Various capabilities of these advanced PV inverters will be tested in two different grid scenarios – one in Maui and the other in the Washington DC/Maryland area. Project technology partners include network platform provider Silver Spring Networks and advanced PV inverter suppliers Fronius, SMA & Hitachi. MECO, HECO, and Pepco are the utility partners hosting the live demonstrations involving their utility grids and their residential customers.
Figure 32. Maui Smart Grid Project.
29
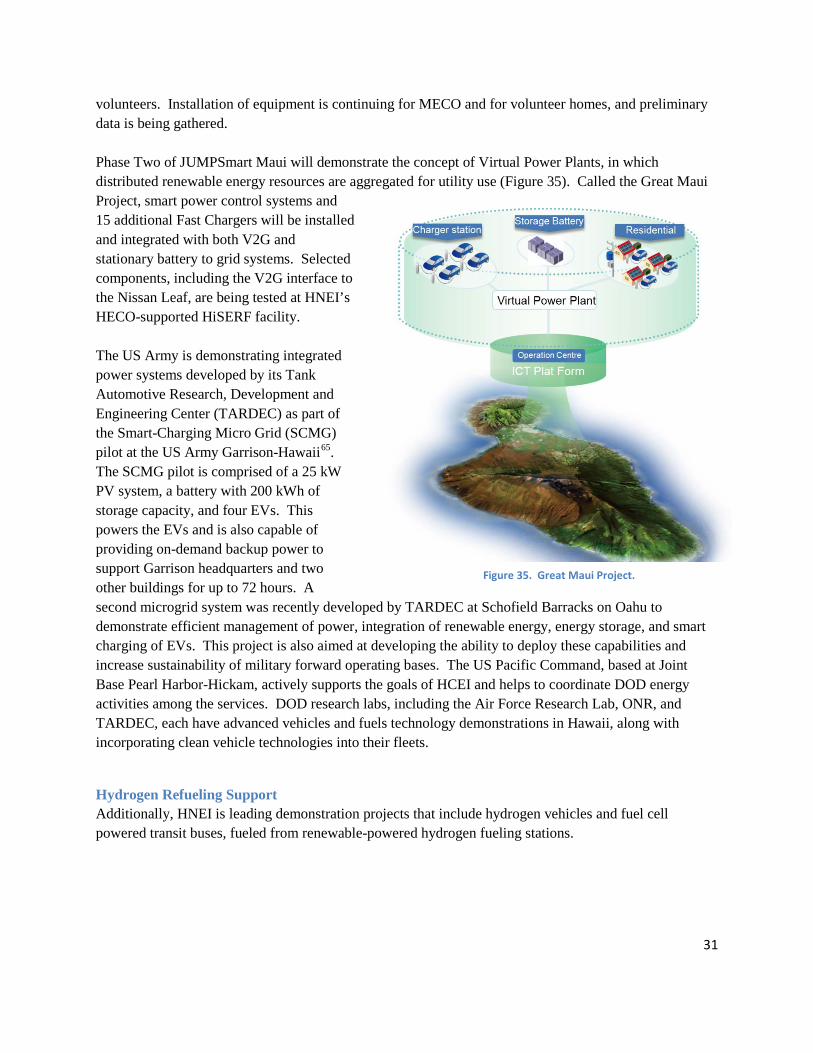
JUMPSmart Maui is a multi-million dollar smart grid demonstration project supported by energy partners from Japan and the United States64. This demonstration project involves collecting energy data from volunteer owners of the Nissan LEAF and selected residents in the Kihei neighborhood on Maui (Figure 34). The project has developed and installed smart utility system controls to connect advanced EV charging management systems to the electric utility system controls. This will allow utility operators to manage EV charging in order to balance intermittent power generation and power demand. Advanced EV charging technology is targeted as a means to improve management of distributed energy resources such as residential PV systems to create a more efficient, reliable grid.
The findings will be scaled to the larger grids on each Hawaiian Island, as well as other parts of the nation and the world. Funded through a $30 million investment by Japan’s largest public research and development management organization, the New Energy and Industrial Technology Development Organization (NEDO), has selected Hitachi Ltd., along with Mizuho Corporate Bank and Cyber Defense Institute to develop this demonstration program on Maui. Other key partners include HNEI serving as one of the Hawaii implementing organizations, the County of Maui, the State of Hawaii, Maui Economic Development Board, University of Hawaii Maui College, Maui Electric Company / Hawaiian Electric Company, The US DOE, Advanced Energy Company USA and HNU Energy.
JUMPSmart Maui is part of the Hawaii-Okinawa Partnership on Clean and Efficient Energy Development and Deployment, an agreement signed in June 2010 by the US DOE, Ministry of Economy, Trade and Industry of Japan, State of Hawaii and Prefecture of Okinawa. The Hawaii-Okinawa partnership is intended to foster development of clean and energy-efficient technologies to solve global energy security and climate-change challenges. The governments of Japan and the United States designated Hawaii and Okinawa for this groundbreaking partnership due to their demonstrated leadership and experience in clean energy and energy efficiency. As part of the project, five DC Fast Chargers have been in operation on Maui to support project
Figure 34. Maui's Mayor and JumpSmart participants fueling EVs at the kick-off of the
project.
Figure 33. Maui Advanced Solar Initiative.
30
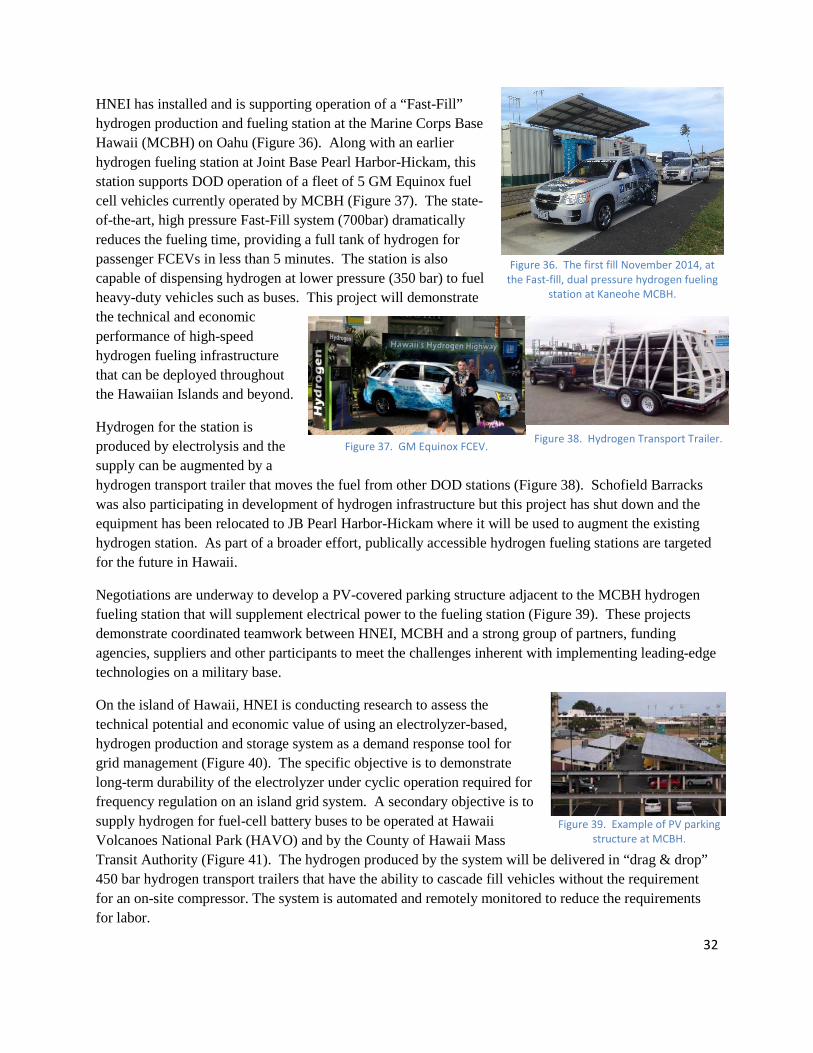
volunteers. Installation of equipment is continuing for MECO and for volunteer homes, and preliminary data is being gathered. Phase Two of JUMPSmart Maui will demonstrate the concept of Virtual Power Plants, in which distributed renewable energy resources are aggregated for utility use (Figure 35). Called the Great Maui Project, smart power control systems and 15 additional Fast Chargers will be installed and integrated with both V2G and stationary battery to grid systems. Selected components, including the V2G interface to the Nissan Leaf, are being tested at HNEI’s HECO-supported HiSERF facility. The US Army is demonstrating integrated power systems developed by its Tank Automotive Research, Development and Engineering Center (TARDEC) as part of the Smart-Charging Micro Grid (SCMG) pilot at the US Army Garrison-Hawaii65. The SCMG pilot is comprised of a 25 kW PV system, a battery with 200 kWh of storage capacity, and four EVs. This powers the EVs and is also capable of providing on-demand backup power to support Garrison headquarters and two other buildings for up to 72 hours. A second microgrid system was recently developed by TARDEC at Schofield Barracks on Oahu to demonstrate efficient management of power, integration of renewable energy, energy storage, and smart charging of EVs. This project is also aimed at developing the ability to deploy these capabilities and increase sustainability of military forward operating bases. The US Pacific Command, based at Joint Base Pearl Harbor-Hickam, actively supports the goals of HCEI and helps to coordinate DOD energy activities among the services. DOD research labs, including the Air Force Research Lab, ONR, and TARDEC, each have advanced vehicles and fuels technology demonstrations in Hawaii, along with incorporating clean vehicle technologies into their fleets.
Hydrogen Refueling Support Additionally, HNEI is leading demonstration projects that include hydrogen vehicles and fuel cell powered transit buses, fueled from renewable-powered hydrogen fueling stations.
Figure 35. Great Maui Project.
31
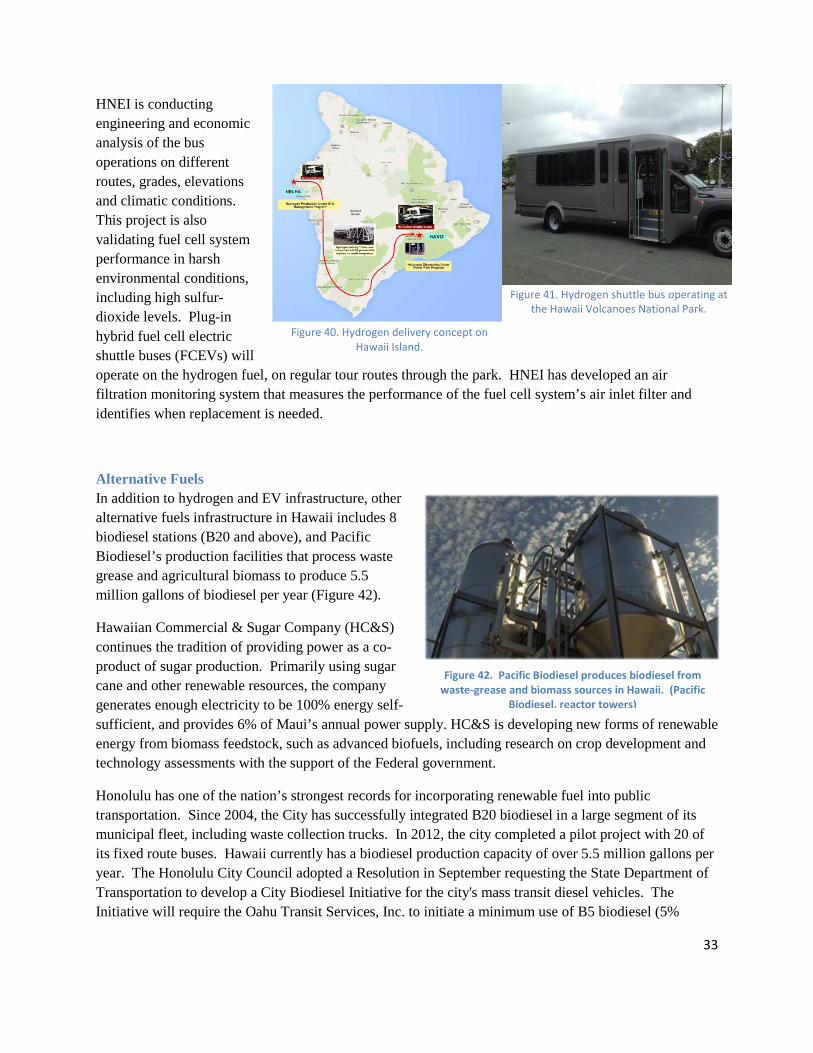
HNEI has installed and is supporting operation of a “Fast-Fill” hydrogen production and fueling station at the Marine Corps Base Hawaii (MCBH) on Oahu (Figure 36). Along with an earlier hydrogen fueling station at Joint Base Pearl Harbor-Hickam, this station supports DOD operation of a fleet of 5 GM Equinox fuel cell vehicles currently operated by MCBH (Figure 37). The state-of-the-art, high pressure Fast-Fill system (700bar) dramatically reduces the fueling time, providing a full tank of hydrogen for passenger FCEVs in less than 5 minutes. The station is also capable of dispensing hydrogen at lower pressure (350 bar) to fuel heavy-duty vehicles such as buses. This project will demonstrate the technical and economic performance of high-speed hydrogen fueling infrastructure that can be deployed throughout the Hawaiian Islands and beyond.
Hydrogen for the station is produced by electrolysis and the supply can be augmented by a hydrogen transport trailer that moves the fuel from other DOD stations (Figure 38). Schofield Barracks was also participating in development of hydrogen infrastructure but this project has shut down and the equipment has been relocated to JB Pearl Harbor-Hickam where it will be used to augment the existing hydrogen station. As part of a broader effort, publically accessible hydrogen fueling stations are targeted for the future in Hawaii.
Negotiations are underway to develop a PV-covered parking structure adjacent to the MCBH hydrogen fueling station that will supplement electrical power to the fueling station (Figure 39). These projects demonstrate coordinated teamwork between HNEI, MCBH and a strong group of partners, funding agencies, suppliers and other participants to meet the challenges inherent with implementing leading-edge technologies on a military base.
On the island of Hawaii, HNEI is conducting research to assess the technical potential and economic value of using an electrolyzer-based, hydrogen production and storage system as a demand response tool for grid management (Figure 40). The specific objective is to demonstrate long-term durability of the electrolyzer under cyclic operation required for frequency regulation on an island grid system. A secondary objective is to supply hydrogen for fuel-cell battery buses to be operated at Hawaii Volcanoes National Park (HAVO) and by the County of Hawaii Mass Transit Authority (Figure 41). The hydrogen produced by the system will be delivered in “drag & drop” 450 bar hydrogen transport trailers that have the ability to cascade fill vehicles without the requirement for an on-site compressor. The system is automated and remotely monitored to reduce the requirements for labor.
Figure 39. Example of PV parking structure at MCBH.
Figure 37. GM Equinox FCEV. Figure 38. Hydrogen Transport Trailer.
Figure 36. The first fill November 2014, at the Fast-fill, dual pressure hydrogen fueling
station at Kaneohe MCBH.
32
HNEI is conducting engineering and economic analysis of the bus operations on different routes, grades, elevations and climatic conditions. This project is also validating fuel cell system performance in harsh environmental conditions, including high sulfur-dioxide levels. Plug-in hybrid fuel cell electric shuttle buses (FCEVs) will operate on the hydrogen fuel, on regular tour routes through the park. HNEI has developed an air filtration monitoring system that measures the performance of the fuel cell system’s air inlet filter and identifies when replacement is needed.
Alternative Fuels In addition to hydrogen and EV infrastructure, other alternative fuels infrastructure in Hawaii includes 8 biodiesel stations (B20 and above), and Pacific Biodiesel’s production facilities that process waste grease and agricultural biomass to produce 5.5 million gallons of biodiesel per year (Figure 42).
Hawaiian Commercial & Sugar Company (HC&S) continues the tradition of providing power as a co-product of sugar production. Primarily using sugar cane and other renewable resources, the company generates enough electricity to be 100% energy self-sufficient, and provides 6% of Maui’s annual power supply. HC&S is developing new forms of renewable energy from biomass feedstock, such as advanced biofuels, including research on crop development and technology assessments with the support of the Federal government.
Honolulu has one of the nation’s strongest records for incorporating renewable fuel into public transportation. Since 2004, the City has successfully integrated B20 biodiesel in a large segment of its municipal fleet, including waste collection trucks. In 2012, the city completed a pilot project with 20 of its fixed route buses. Hawaii currently has a biodiesel production capacity of over 5.5 million gallons per year. The Honolulu City Council adopted a Resolution in September requesting the State Department of Transportation to develop a City Biodiesel Initiative for the city's mass transit diesel vehicles. The Initiative will require the Oahu Transit Services, Inc. to initiate a minimum use of B5 biodiesel (5%
Figure 42. Pacific Biodiesel produces biodiesel from waste-grease and biomass sources in Hawaii. (Pacific
Biodiesel, reactor towers)
Figure 40. Hydrogen delivery concept on Hawaii Island.
Figure 41. Hydrogen shuttle bus operating at the Hawaii Volcanoes National Park.
33
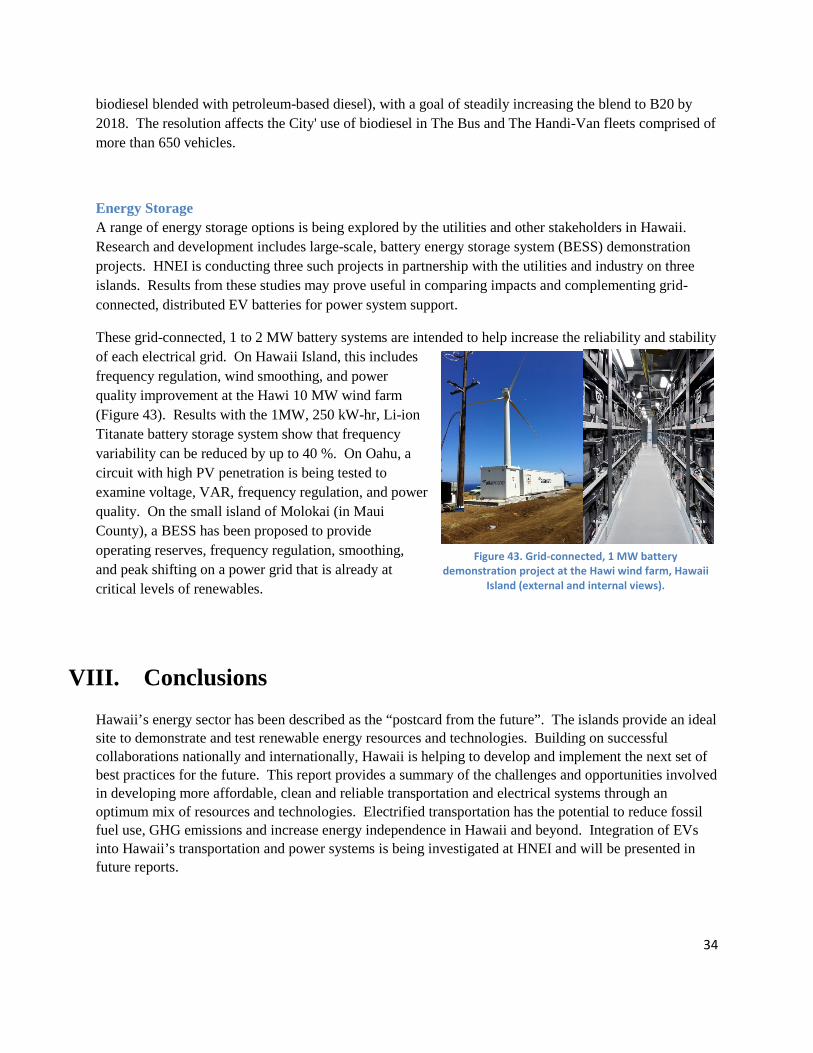
biodiesel blended with petroleum-based diesel), with a goal of steadily increasing the blend to B20 by 2018. The resolution affects the City' use of biodiesel in The Bus and The Handi-Van fleets comprised of more than 650 vehicles.
Energy Storage A range of energy storage options is being explored by the utilities and other stakeholders in Hawaii. Research and development includes large-scale, battery energy storage system (BESS) demonstration projects. HNEI is conducting three such projects in partnership with the utilities and industry on three islands. Results from these studies may prove useful in comparing impacts and complementing grid-connected, distributed EV batteries for power system support.
These grid-connected, 1 to 2 MW battery systems are intended to help increase the reliability and stability of each electrical grid. On Hawaii Island, this includes frequency regulation, wind smoothing, and power quality improvement at the Hawi 10 MW wind farm (Figure 43). Results with the 1MW, 250 kW-hr, Li-ion Titanate battery storage system show that frequency variability can be reduced by up to 40 %. On Oahu, a circuit with high PV penetration is being tested to examine voltage, VAR, frequency regulation, and power quality. On the small island of Molokai (in Maui County), a BESS has been proposed to provide operating reserves, frequency regulation, smoothing, and peak shifting on a power grid that is already at critical levels of renewables.
VIII. Conclusions Hawaii’s energy sector has been described as the “postcard from the future”. The islands provide an ideal site to demonstrate and test renewable energy resources and technologies. Building on successful collaborations nationally and internationally, Hawaii is helping to develop and implement the next set of best practices for the future. This report provides a summary of the challenges and opportunities involved in developing more affordable, clean and reliable transportation and electrical systems through an optimum mix of resources and technologies. Electrified transportation has the potential to reduce fossil fuel use, GHG emissions and increase energy independence in Hawaii and beyond. Integration of EVs into Hawaii’s transportation and power systems is being investigated at HNEI and will be presented in future reports.
Figure 43. Grid-connected, 1 MW battery demonstration project at the Hawi wind farm, Hawaii
Island (external and internal views).
34
IX. Acknowledgments This report was funded under a subaward to the Hawaii Natural Energy Institute, University of Hawaii at Manoa, from the Florida Solar Energy Center, University of Central Florida, through a grant from the US Department of Transportation’s University Transportation Centers Program, Research and Innovative Technology Administration.
X. References
1 US Energy Information Administration, (EIA), State Profile and Energy Estimates, Retrieved from http://www.eia.gov/state/analysis.cfm?sid=HI 2 EIA, State Profile and Energy Estimates, Retrieved from http://www.eia.gov/state/analysis.cfm?sid=HI 3 US DOE EERE Alternative Fuels Data Center, (October 2014), Retrieved from http://www.afdc.energy.gov/laws/state_summary?state=HI 4 US Department of Energy, Office of Energy Efficiency and Renewable Energy and State of Hawaii; prepared by the National Renewable Energy Laboratory (NREL), (August 2011), Hawaii Clean Energy Initiative Road Map 2011 Edition, Retrieved from http://www.hawaiicleanenergyinitiative.org/storage/media/HCEI%20RoadMap_2011_40pgs.pdf 5 HCEI Road Map: 2011 Edition”, Retrieved from www.hawaiicleanenergyinitiative.org 6 Blue Planet Foundation, Hawaii Energy Report Card 2014, Retrieved from http://hawaiienergyreportcard.com/transportation 7 Plug In Cars, (November 2014), Driving an Electric Car for Maximum Efficiency, Retrieved from http://www.plugincars.com/driving-electric-car-maximum-efficiency-130271.html 8 International Energy Agency, (IEA), (February 2014), World Energy Outlook 2014, Retrieved from http://www.iea.org/newsroomandevents/pressreleases/2014/november/signs-of-stress-must-not-be-ignored-iea-warns-in-its-new-world-energy-outlook.html 9 Electric Vehicle Transportation Center, Makena Coffman, Paul Bernstein, Sherilyn Wee, (March 2015), Factors Affecting EV Adoption: A Literature Review and EV Forecast for Hawaii 10 Maui Vehicle Alliance (Maui EVA); Berkeley Law, University of California, Berkeley and Maui College, University of Hawaiʻi (September 2013), Electric Vehicle Paradise: How Hawai'i Can Lead the World in Deployment 11 State of Hawaii Research & Economic Analysis, Department of Business, Economic Development and Tourism, (October 2014), Monthly Energy Trends, December 2014, Retrieved from http://dbedt.hawaii.gov/economic/energy-trends-2/ 12 Hawaii Automobile Dealers Association, (November 2014), Hawaii Dealer, 2014 First Quarter, Retrieved from http://www.hawaiiautodealer.com/magazine/PDFs/HADA-2014-Q1.pdf 13 Wall Street Journal, (June 2014), States With the Most and Least Electric-Vehicle Sales, Source: IHS Automotive, (data from the 12 months that ended March 31, 2014), Retrieved from http://online.wsj.com/public/resources/documents/st_ATLANTAEVB20140602.html 14 The Wall Street Journal, Mike Ramsey (June 2014), "States With the Most and Least Electric-Vehicle Sales", Source: IHS Automotive 15 State of Hawaii Research & Economic Analysis, Department of Business, Economic Development and Tourism, (October 2014), Monthly Energy Trends, September 2014, Retrieved from http://dbedt.hawaii.gov/economic/energy-trends-2/
35

16 HECO, Powerlines, Fall/Winder Special Edition, Retrieved from http://www.hawaiianelectric.com/vcmcontent/EnergyServices/Powerlines/Fall_and_Winter_Special_Edition2011final.pdf 17 Hawaii Tribune-Herald, County assesses Volt fleet, Tom Collis, (January 2013), http://hawaiitribune-herald.com/sections/news/local-news/county-assesses-volt-fleet.html 18 Hawaii Tribune-Herald, County assesses Volt fleet, Tom Collis, (January 2013), http://hawaiitribune-herald.com/sections/news/local-news/county-assesses-volt-fleet.html 19 National Renewable Energy Laboratory, Kuss, M. C.; Markel, T. J.; Simpson, M. B.; Helwig, M. S.; Jun, M.; Kelly, K. J., (2013), Evaluation of West Hawai‘i Civic Center’s Transportation and Energy Use 20 ” Will Rolston, Energy Coordinator for the County of Hawai‘i. 21 Electric Drive Transportation Association, Ward’s Automotive Group, Bloomberg, Tom Randall, (January 2015), Seven Reasons Cheap Oil Can't Stop Renewables Now, Retrieved from http://www.bloomberg.com/news/articles/2015-01-30/seven-reasons-cheap-oil-can-t-stop-renewables-now 22 Rocky Mountain Institute, (February 2014), The Economics of Grid Defection, data EIA, Bloomberg New Energy Finance, and Navigant Research, http://www.rmi.org/electricity_grid_defection 23 Maui Venture Consulting, David Fisher, (October 2014), Retrieved from http://www.cartalk.com/content/perfecting-paradise-hawaii-plugs-electric-cars 24 State of Hawaii Department of Business, Economic Development and Tourism, (May 2014), Hawaii Energy Facts & Figures” 25 State of Hawaii Department of Business, Economic Development and Tourism, (May 2014), Hawaii Energy Facts & Figures” 26 State of Hawaii Research & Economic Analysis, Department of Business, Economic Development and Tourism, Monthly Energy Trend Highlights, September 2014, Retrieved from http://dbedt.hawaii.gov/economic/energy-trends-2/ 28 Hawaiian Electric Industries, 2012 Annual Report to Shareholders 29 EIA, Short Term energy Outlook and Retail sales of electricity to ultimate customer 30 Civil Beat, Harris, (February 2014), Hawaii Electric Rates Are Up 50 Percent Since 2009 31 State of Hawaii Research & Economic Analysis, Department of Business, Economic Development and Tourism, (most recent data available as of September 2014), Monthly Energy Trends, January 2015, Retrieved from http://dbedt.hawaii.gov/economic/energy-trends-2/ 32 U.S. Energy Information Administration (2012), Retrieved from http://www.electricitylocal.com/states/hawaii/kailua/ 33 State of Hawaii Research & Economic Analysis, Department of Business, Economic Development and Tourism, (most recent data available as of September 2014), Monthly Energy Trends, January 2015, from http://dbedt.hawaii.gov/economic/energy-trends-2/ 34 EIA, Electric Power Monthly, (October 2014), data for August 2014, Retrieved from http://www.eia.gov/electricity/monthly/epm_table_grapher.cfm?t=epmt_5_6_a 35 Edmonds.com, The True cost of powering and Electric Vehicle, (November 2013), Retrieved from http://www.edmunds.com/fuel-economy/the-true-cost-of-powering-an-electric-car.html 36 US DOE, (November 2014), eGallon: What It Is and Why It’s Important, Retrieved from http://energy.gov/articles/egallon-what-it-and-why-it-s-important 37 Electric Vehicle Transportation Center, Florida Solar Energy Center, University of Central Florida, Retrieved from http://fsec.ucf.edu/en/publications/pdf/FSEC-CR-1984-14.pdf 38 Hawaiian Electric Companies (HECO), (November 2014), Retrieved from http://www.hawaiianelectric.com/heco/Clean-Energy/Going-Solar/More-Solar-Information 39 Edmonds.com, (November 2013), The True cost of powering and Electric Vehicle, Retrieved from http://www.edmunds.com/fuel-economy/the-true-cost-of-powering-an-electric-car.html
36

40 Hawaiian Electric Companies (HECO), (October 2014), Retrieved from http://www.hawaiianelectric.com/heco/Clean-Energy/Electric-Vehicles 41 EIA, (EIA-861 and EIA-826), Hawaii’s electric system is changing with rooftop solar growth and new utility ownership, Retrieved from http://www.eia.gov/todayinenergy/detail.cfm?id=19731 42 Pacific Business News, (October 2014), Goldman Sachs, Citigroup head up Hawaii's $150M green financing program, Retrieved from http://www.bizjournals.com/pacific/news/2014/10/29/goldman-sachs-citigroup-head-up-hawaiis-150m-green.html 43 Kauai Island Utility Cooperative, (November 2014), Retrieved from www.KIUC.Coop 44 State of Hawaii, Department of Business Development and Tourism, Retrieved from http://www.hawaiicleanenergyinitiative.org/imported-20101004182628/2014/12/18/hawaii-made-great-progress-towards-renewable-energy-in-2014.html 45 EIA, (EIA-861 and EIA-826), Hawaii’s electric system is changing with rooftop solar growth and new utility ownership, Retrieved from http://www.eia.gov/todayinenergy/detail.cfm?id=19731 46 Hawaiian Electric Companies, (October 2014), Retrieved from http://www.hawaiianelectric.com/portal/site/heco/lvmsearch 47 Transient Over-Voltage Mitigation, Hawaiian Electric Industries, Retrieved from http://www.hawaiielectriclight.com/vcmcontent/StaticFiles/pdf/TOV-Mitigation-Measures-Public-Brief-Feb-24-2014(Final).pdf 48 National Renewable Energy Laboratory and Lawrence Berkeley National Laboratory, (September 2014), Photovoltaic (PV) Pricing Trends: Historical, Recent, and Near-Term Projections (2014 Edition) 49 Rocky Mountain Institute, (February 2014), The Economics of Grid Defection, Retrieved from http://www.rmi.org/ 50 Morgan Stanley, Stephen Lacey, Fixed Charges on Solar May Cause ‘Tipping Point’ for Grid Defection, (August 2014), Retrieved from http://www.greentechmedia.com/articles/read/Solar-Fixed-Charges-May-Cause-Grid-Defection 51 RenewEconomy.com, Energy storage to reach cost ‘holy grail’, mass adoption in 5 Years, (quoting Deutsche Bank report), Retrieved from http://reneweconomy.com.au/2015/energy-storage-to-reach-cost-holy-grail-mass-adoption-in-5-years-18383 52 Union of Concerned Scientists, Don Anair, Amine Mahmassani, (June 2012), State of Charge 53 US DOE, EERE, Alternative Fuels Data Center, (October 2014), Retrieved from http://www.afdc.energy.gov/vehicles/electric_emissions.php 54 Center for Climate and energy Solutions, David L. Greene and Steven E. Plotkin, (January 2011), Reducing Greenhouse Gas Emissions from US Transportation, 55 Norwegian University of Science and Technology (NTNU), Trondheim, Norway, HTroy R. Hawkins, Bhawna Singh, Guillaume Majeau-Bettez andAnders Hammer Strømman, Comparative Environmental Life Cycle Assessment of Conventional and Electric Vehicles, Journal of Industrial Ecology, Volume 17, Issue 1, pages 53–64, February 2013 56 State of Hawaii Energy Office, Department of Business, Economic Development and Tourism, (October 2014), Retrieved from http://dbedt.hawaii.gov 57 US DOE, Alternative Fueling Station Locator, Retrieved from http://www.afdc.energy.gov/locator/stations/results?utf8=%E2%9C%93&location=Hawaii&fuel=all&private=false&planned=false&owner=all&payment=all&radius=false&radius_miles=5 58 Maui Vehicle Alliance (Maui EVA); Berkeley Law, University of California, Berkeley and Maui College, University of Hawaiʻi (September 2013), Electric Vehicle Paradise: How Hawai'i Can Lead the World in Deployment 59 DegreeDirectory.org, What is the typical salary of an electrician? (November 2014), Retrieved from http://degreedirectory.org/articles/What_is_the_Typical_Salary_of_an_Electrician.html 60 Hawaii Natural Energy Institute, GE Energy Consulting, (July 2013), Oahu Electric Vehicle Charging Study 61 Calculations were based on data from HNEI’s Oahu Wind Integration Study, (2011) and US Department of Energy’s methodology, Electric and Hybrid Vehicle Research, Development, and Demonstration Program; Petroleum-Equivalent Fuel Economy Calculation, (2000)
37

62 HNEI and GE, (January 2014), Executive Summary: Hawaii RPS Roadmap Study, presentation to the Hawaii State Capitol, Retrieved from http://www.hnei.hawaii.edu/sites/dev.hnei.hawaii.edu/files/news/Full%20Slide%20Deck.pdf 63 Union of Concerned Scientists, Don Anair, Amine Mahmassani, (June 2012), State of Charge 64 Hawaiian Electric Industries, (HECO), (September 2014), Retrieved from http://www.hawaiianelectric.com/portal/site/helco/menuitem.b136fe8120a5c28884276c10c510b1ca/?vgnextoid=c8649b99dd443310VgnVCM10000005041aacRCRD&vgnextchannel=7124bd0243602410VgnVCM10000005041aacRCRD&vgnextfmt=default 65 National Renewable Energy Laboratory, U.S. Department of Energy, Office of Energy Efficiency and Renewable Energy, Ray David, (May 2013), Hawai‘i’s Evolution: Hawai‘i Powered. Technology Driven, Retrieved from http://energy.hawaii.gov/wp-content/uploads/2013/07/HawaiiEVolutionReport.pdf
38