Embed Size (px)
Citation preview

The State of Dyslipidemia Treatment
USA-145-101385 © 2014 Amgen Inc. All rights reserved. Not for Reproduction.
Table of Contents
Dyslipidemia
Dyslipidemia in Diabetes
Dyslipidemia in Familial Hypercholesterolemia

Dyslipidemia

Mean Blood Cholesterol in the United States Is Among Highest in the World
193 mg/dL
180–193 mg/dL
166 mg/dL
No data
167–179 mg/dL
WHO = World Health Organization. 1 mg/dL=0.0259 mmol/LAdapted from WHO, Mean Blood Cholesterol in Males over 25 Years of Age, 1980–2008. 1. World Health Organization. Global Health Observatory (GHO). World Health Organization website. www.who.int/gho/ncd/risk_factors/cholesterol_prevalence/en/. Accessed October 23, 2014.

Total Cholesterol Levels Increase During Development and Remain Higher Than Those in Hunter-Gatherer Populations
50
40
30
20
10
0
US
Po
pu
lati
on
(%
)
TC Level (mg/dL)2
80 120 160 200 240 280 320 360 400
Cholesterol levelsfor modern hunter-
gatherer populations range from:3 101 mg/dL–146 mg/dL
Distribution of Total Serum Cholesterol Levels in ~34,000 US Adults From NHANES III (1988–1994)
Developmental Period1
Birth Weaned
High fat
Low fat
Breast fed250
200
150
50
0
100
Pla
sm
a T
C (
mg
/dL
)
Fetal Nursing Infant Adult
Formula diet
TC Changes During Fetal Development Through Adulthood
Exact N is not available for Hunter-gatherer data, but is likely in the hundreds.
1. Adapted from Dietschy JM, et al. J Lipid Res. 2004;45:1375-1397. 2. Schwartz LM, Woloshin S. Eff Clin Pract. 1999;2:76-85. 3. Eaton SB, et al. Am J Med. 1988;84:739-749.
This information is meant to inform on levels at different stages of human development

1988-1994 1999-2002 2007-20100
50
100
150
129123
116
In utero (wk)1,c
n = 79
Infants (mo)2
n = 18
Adults (y)3,*
n = 8,174aFormula fed. bBreast fed. cUmbilical cord plasma concentrations*NHANES trends in mean LDL-C serum levels of US adult respondents from 1999-2006, estimates are age adjusted to the 2000 standard US population using the direct method. †Mean Age-adjusted LDL-C levels- approx. 15,000 US adults from NHANES (1988-2010)
1. Parker CR Jr, et al. Metabolism. 1983;32:919-923. 2. Wong WW, et al. J Lipid Res. 1993;34:1403-1411. 3. Cohen JD, et al. Am J Cardiol. 2010;106:969-975. 4. Carroll MD, et al. JAMA. 2012;308:1545-1554
33–34 41–42 4–5 4–5 20–39 40–59 60–740
50
100
150
49
28
48
83
113
124 123
Mea
n L
DL
-C (
mg
/dL
)
Mean LDL-C by Age
LDL-C Levels Rise After Adulthood and Remain Higher Than Those in Early Development
b
Age:
Average LDL-C Levels in the US
Years4,†
a
LD
L-C
(m
g/d
L)

Clinical Guidelines Recommend LDL-C Lowering
1. American Diabetes Association. Diabetes Care. 2014;37(suppl 1):S14-S80. 2. Jellinger PS, et al. Endocr Pract. 2012;18(suppl 1):1-78. 3. Grundy SM, et al. J. Clin Lipidol. 2013;8:29-60. 4. Reiner Z, et al. Eur Heart J. 2011;32:1769-1818. 5. Stone NJ, et al. J Am Coll Cardiol. 2014;63:2889-2934. 6. Keaney JF, et al. N Engl J Med. 2014;370:275-278.
ADA = American Diabetes Association; AACE = American Association of Clinical Endocrinologists; IAS = International Atherosclerosis Society; ESC = European Society of Cardiology; EAS = European Atherosclerosis Society; AHA = American Heart Association; ACC = American College of Cardiology
AACE Guidelines2
Targets LDL-C level
Targets statin
therapy intensity
ADA Recommendations1
AACE Guidelines2
IASRecommendations3
ESC/EASGuidelines4
ACC/AHAGuidelines5,6
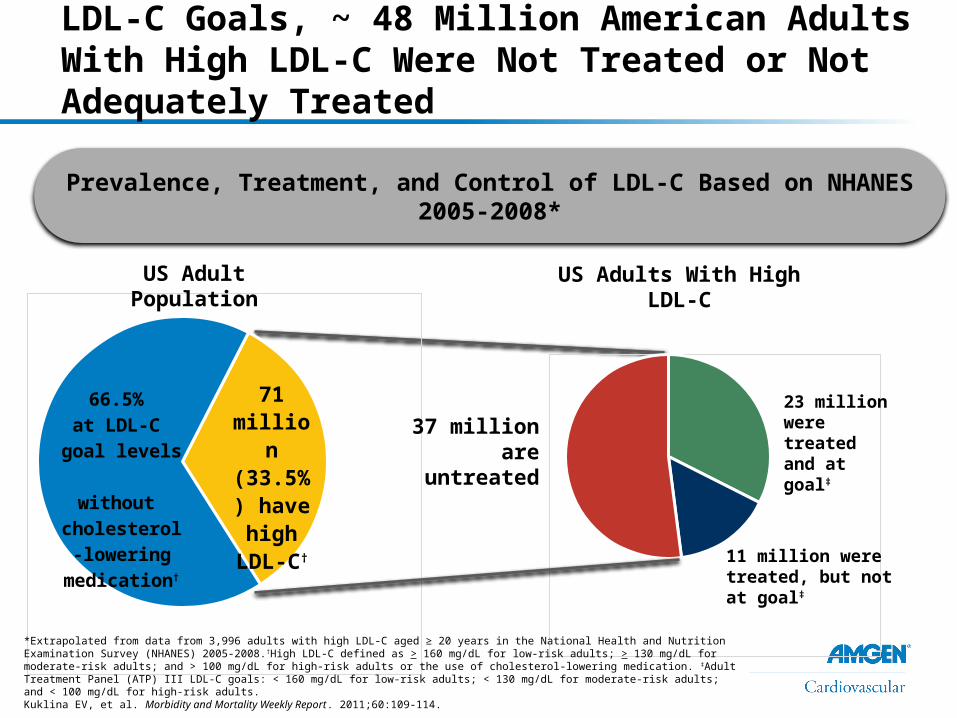
When Compared to Adult Treatment Panel III LDL-C Goals, ~ 48 Million American Adults With High LDL-C Were Not Treated or Not Adequately Treated
71 mil-lion
(33.5%) have high
LDL-C†
66.5% at LDL-C goal levels
without cholesterol-
lowering med-ication†
37 millionare untreated
23 million were treated and at goal‡
11 million were treated, but not at goal‡
Prevalence, Treatment, and Control of LDL-C Based on NHANES 2005-2008*
*Extrapolated from data from 3,996 adults with high LDL-C aged ≥ 20 years in the National Health and Nutrition Examination Survey (NHANES) 2005-2008.†High LDL-C defined as > 160 mg/dL for low-risk adults; > 130 mg/dL for moderate-risk adults; and > 100 mg/dL for high-risk adults or the use of cholesterol-lowering medication. ‡Adult Treatment Panel (ATP) III LDL-C goals: < 160 mg/dL for low-risk adults; < 130 mg/dL for moderate-risk adults; and < 100 mg/dL for high-risk adults.Kuklina EV, et al. Morbidity and Mortality Weekly Report. 2011;60:109-114.
US Adult Population US Adults With High LDL-C

0%
20%
40%
60%
80%
100%
18%
25%
38%
51%
74%
86%
A Substantial Percentage Do Not Achieve LDL-C < 70 mg/dL Despite Maximal Statin Therapy
Individual patient data pooled meta-analysis, N=32,258 of 37 studies, comparing efficacy of various statins in At Risk Groups (VOYAGER). On multivariate analysis, baseline lipid level (p < 0.0001) and increasing statin dose (p < 0.0001) were strong predictors of achieving treatment goals in high risk patients. Studies were identified by a comprehensive search of the Cochrane Controlled Trials Registry, Medline (1999-2007), EMBASE (1999-2007) Citeline Trialtrove, and collection of all published research. Maximal intensity included average between two high dose groups of †20 and 40 mg of statin 1 and ‡40 and 80 mg of statin 2. High dose statin per ACC/AHA guidelines = statin 2, 40-80 mg; statin 1, 20-40 mg.
1. Nicholls SJ, et. al. Am J Cardiol. 2010; 105:69-76. 2. Stone NJ, et al. J Am Coll Cardiol. 2014;63:2889-2934.
LD
L-C
> 7
0 m
g/d
L
< 130 mg/dL 130-160 mg/dL > 160 mg/dL
While on Maximal Statin Therapy The Percent of Patients Not Achieving LDL-C < 70 mg/dL By Baseline LDL-C
Maximal Intensity† (20 and 40 mg) of Statin 1
Maximal Intensity‡ (40 and 80 mg) of Statin 2
Baseline LDL-C

Number of High Risk US Adults Achieving LDL-C Levels of < 100 mg/dL or LDL-C Levels of < 70 mg/dL, Respectively
NHANES Administrativeclaims data
EMR NHANES Administrative claims data
EMR0
10
20
30
40
50
60
70
80
90 At goal Not at goal
LDL-C < 100 mg/dL LDL-C < 70 mg/dL
Per
cen
t o
f To
tal
Jones, PH, et al. J Am Heart Assoc. 2012;1:e001800.
High-risk patients were defined as patients older than 18 years with a history of CHD or CHD risk equivalent who had the latest complete lipid panel measurement and were treated with statin monotherapy for > 90 days.EMR = electronic medical record database collected from 40,000 clinicians and 20,000 NP and PA (GE Centricity); Administrative Claims Database of the medical and pharmacy claims for 42MM patients enrolled in a large US managed care plan (Clinformatics DataMart, a product of Optuminsight Life Sciences); NHANES=National Health and Nutrition Examination Survey, a national public health survey conducted by the CDC of a nationally representative sample of 5000 individuals each year across a country.As per NCEP ATP III, the LDL-C goal patients was <100 mg/dL. High-risk patients were also evaluated for the optional goal of LDL-C <70 mg/dL, as per the 2004 update to the NCEP ATP III Guidelines.
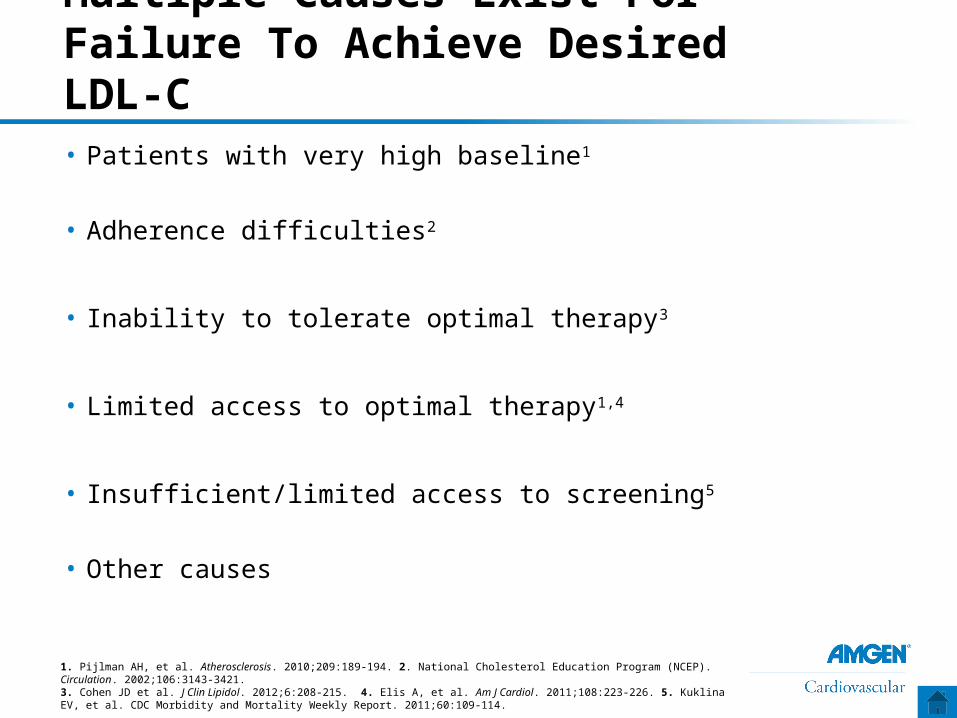
Multiple Causes Exist For Failure To Achieve Desired LDL-C• Patients with very high baseline1
• Adherence difficulties2
• Inability to tolerate optimal therapy3
• Limited access to optimal therapy1,4
• Insufficient/limited access to screening5
• Other causes
1. Pijlman AH, et al. Atherosclerosis. 2010;209:189-194. 2. National Cholesterol Education Program (NCEP). Circulation. 2002;106:3143-3421. 3. Cohen JD et al. J Clin Lipidol. 2012;6:208-215. 4. Elis A, et al. Am J Cardiol. 2011;108:223-226. 5. Kuklina EV, et al. CDC Morbidity and Mortality Weekly Report. 2011;60:109-114.

Dyslipidemia in Diabetes
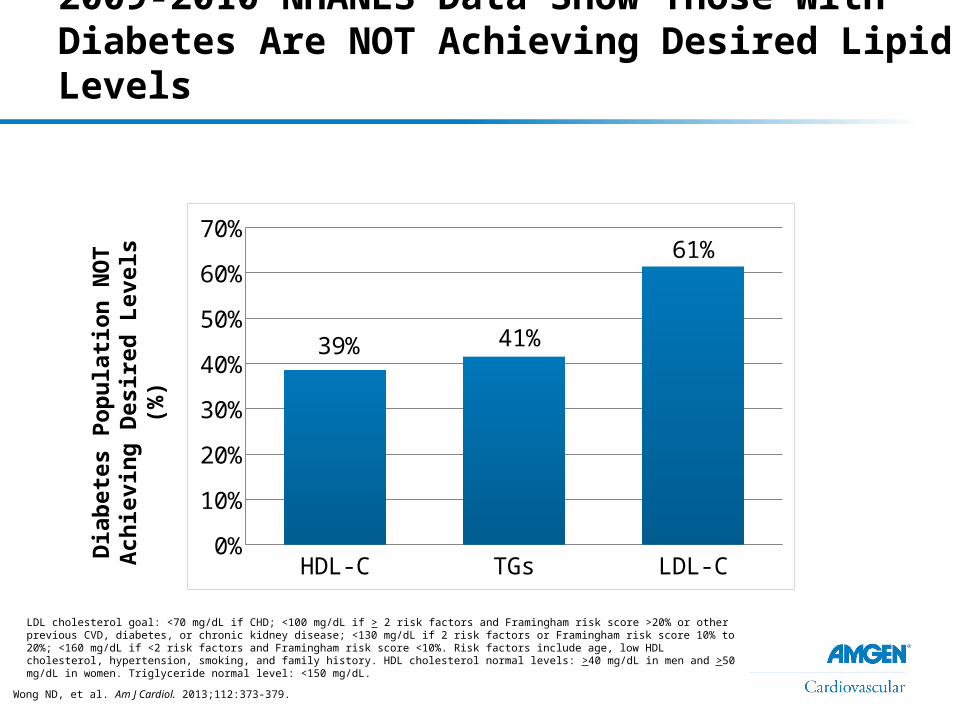
2009-2010 NHANES Data Show Those With Diabetes Are NOT Achieving Desired Lipid Levels
Wong ND, et al. Am J Cardiol. 2013;112:373-379.
Dia
bet
es
Po
pu
lati
on
NO
T
Ach
iev
ing
Des
ire
d L
eve
ls (
%)
LDL cholesterol goal: <70 mg/dL if CHD; <100 mg/dL if > 2 risk factors and Framingham risk score >20% or other previous CVD, diabetes, or chronic kidney disease; <130 mg/dL if 2 risk factors or Framingham risk score 10% to 20%; <160 mg/dL if <2 risk factors and Framingham risk score <10%. Risk factors include age, low HDL cholesterol, hypertension, smoking, and family history. HDL cholesterol normal levels: >40 mg/dL in men and >50 mg/dL in women. Triglyceride normal level: <150 mg/dL.
HDL-C TGs LDL-C0%
10%
20%
30%
40%
50%
60%
70%
39% 41%
61%

A Substantial Number of People With Diabetes Have High LDL-C
57%
43%
28%
72%
< 100 mg/dL LDL-C
> 100 mg/dL LDL-C
< 70 mg/dL LDL-C
> 70 mg/dL LDL-C
Individuals With DiabetesIndividuals With Diabetes
and Cardiovascular Disease
Ali MK, et al. N Engl J Med. 2013; 368:1613-1624.
Data shown are from 3,355 adults in the National Health and Nutrition Examination Survey (NHANES) with a diagnosis of diabetes from a health care professional, and 97,310 adults who reported having diabetes from the Behavioral Risk Factor Surveillance System (BRFSS) survey. Data is from 2007-2010.
(P<0.001)
Dyslipidemia in Familial Hypercholesterolemia
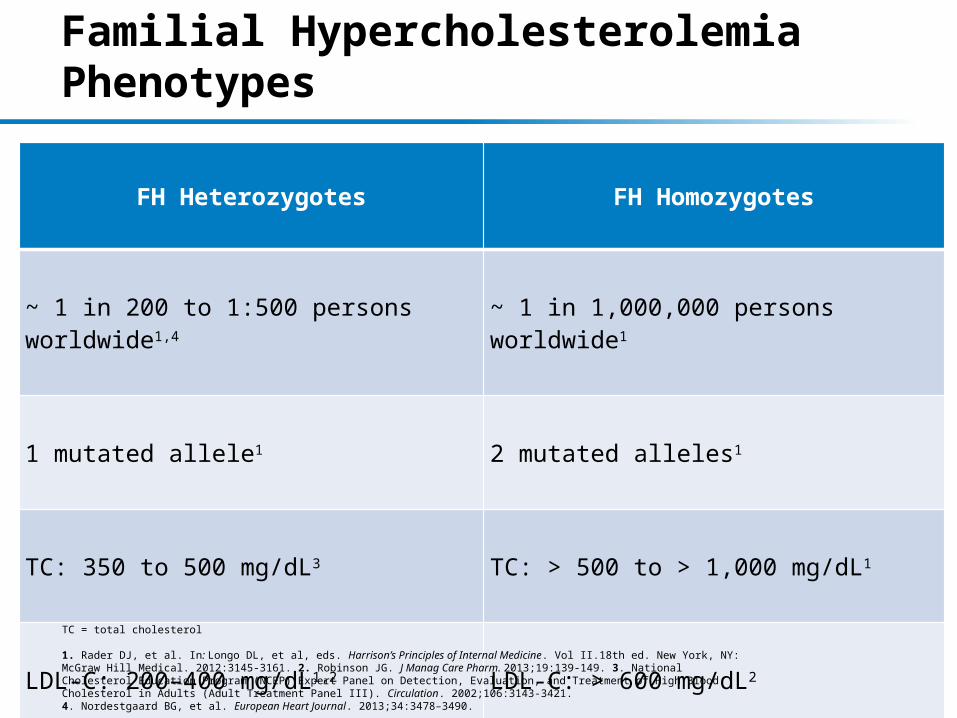
Familial Hypercholesterolemia Phenotypes
FH Heterozygotes FH Homozygotes
~ 1 in 200 to 1:500 persons worldwide1,4 ~ 1 in 1,000,000 persons worldwide1
1 mutated allele1 2 mutated alleles1
TC: 350 to 500 mg/dL3 TC: > 500 to > 1,000 mg/dL1
LDL-C: 200–400 mg/dL1,2 LDL-C: > 600 mg/dL2
Half the number of LDLR expressed3 LDLR activity absent or dysfunctional3TC = total cholesterol
1. Rader DJ, et al. In: Longo DL, et al, eds. Harrison’s Principles of Internal Medicine. Vol II.18th ed. New York, NY: McGraw Hill Medical. 2012:3145-3161. 2. Robinson JG. J Manag Care Pharm. 2013;19:139-149. 3. National Cholesterol Education Program (NCEP) Expert Panel on Detection, Evaluation, and Treatment of High Blood Cholesterol in Adults (Adult Treatment Panel III). Circulation. 2002;106:3143-3421.4. Nordestgaard BG, et al. European Heart Journal. 2013;34:3478–3490.
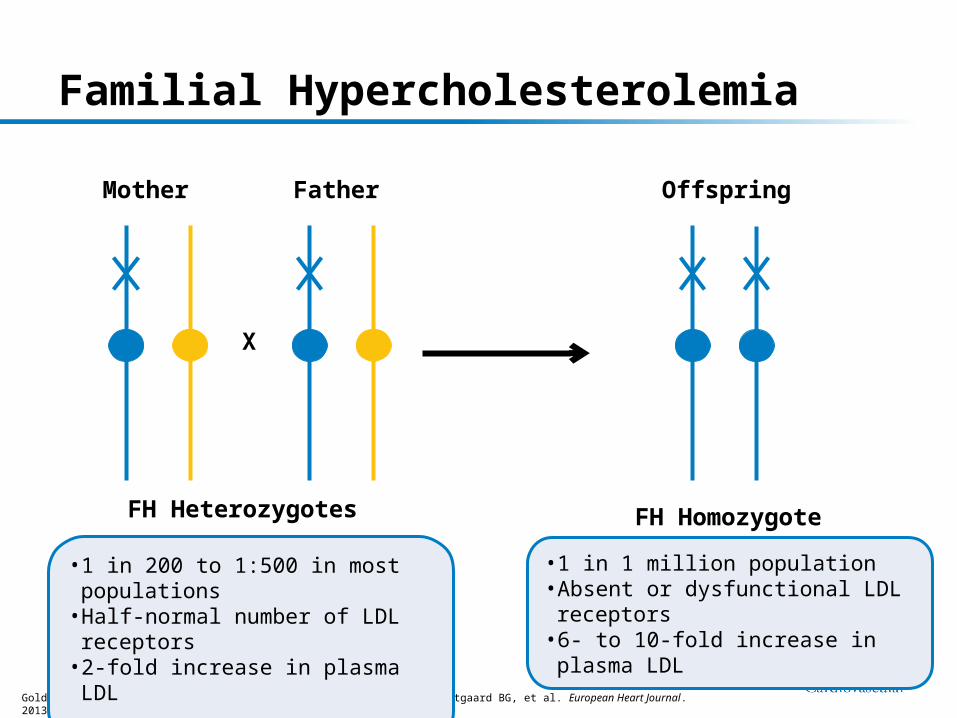
Familial Hypercholesterolemia
Mother Father
X
Offspring
FH Heterozygotes FH Homozygote
Goldstein JL, et al. Arterioscler Thromb Vasc Biol. 2009;29:431-438. Nordestgaard BG, et al. European Heart Journal. 2013;34:3478–3490.
• 1 in 200 to 1:500 in most populations• Half-normal number of LDL receptors• 2-fold increase in plasma LDL
• 1 in 1 million population• Absent or dysfunctional LDL receptors• 6- to 10-fold increase in plasma LDL

67%LDLR
16.7%Others
2.3%PCSK9
14%ApoB
*Autosomal Dominant Hypercholesterolemia. LDLR = LDL receptor; PCSK9 = Proprotein Convertase Subtilisin Kexin Type 9; ApoB = apolipoprotein B Seidah NG, et al. J Mol Med. 2007;85:685-696.
Multiple Genetic Defects Causing Changes in Lipoprotein Metabolism Can Be Associated With Familial Hypercholesterolemia (FH)*

Nordestgaard BG, et al. European Heart Journal. 2013; 34: 3478-3490
Diagnosis of FH in the US is Approximately <1% of Estimated Prevalence
Estimated percent of individuals diagnosed with FH in different countries/territories*
*As a fraction of those theoretically predicted based on a frequency of 1/500 in the general population. As most countries do not have valid nationwide registries for FH, several values represent informed estimates from clinicians/experts in their respective countries.

Despite Maximal Treatment, A Low Percentage of Patients with HeFH Achieve LDL-C < 100 mg/dL
*NCEP Adult Treatment Panel III Risk Category: Medium Risk: <130 mg/dL (3.4 mmol/L); ≥ 2 risk factors,10-year risk of coronary artery disease ≤ 20%; High Risk: <100 mg/dL (2.6 mmol/L); coronary artery disease or its risk equivalents (atherosclerosis, diabetes, or 10-year risk > 20%).18 week RCT, double-blind parallel group where heterozygous (He) FH patients initiated statin treatment at 20 mg with forced titration to 40 and 80 mg in 1999-2000. N = 623 randomized; p Values were obtained from a logistic regression model . Global population consisted of 31% US patients.**Adults with HeFH were part of a cross-sectional study. 96% were on statin treatment where 34% were on maximum dose. N = 1249 met inclusion criteria. n = 304 patients on maximal therapy; Maximum lipid-lowering therapy was defined as maximum statin doses in combination with ezetimibe. Using outpatient visits to Lipid Clinics after February 2006.
1. Stein EA, et al. Am J Cardiol. 2003; 92:1287-1293. 2. Pijlman AH, et al. Atherosclerosis. 2010; 209:189-194.
In Netherlands Estimates of HeFH Patients On Maximal Lipid Lowering Therapy Achieving
LDL-C < 100 mg/dL**
In a Randomized Global Clinical Trial of HeFH Patients, A Low Percentage Achieved LDL-C Levels
of < 100 mg/dL on Maximal Treatment*
<130 mg/dL <100 mg/dL0%
20%
40%
60%
80%
100% < 100 mg/dL> 100 mg/dL
% o
f P
atie
nts
Ach
ievi
ng
LD
L-C
Go
al
Per
Ris
k C
ateg
ory
Statin 1Statin 2
†p < 0.05, n = 103
n = 37
n = 67
‡p < 0.001, n = 155
14%
86%