Embed Size (px)
Citation preview

The State of College Completion Initiatives at U.S. Community Colleges
2017

Authors: Wendy Kilgore, Ph.D., Director of Research [email protected] Jacob I. Wilson, Research Intern
This report was made possible in part by AACRAO’s research underwriters.
and
http://hobsons.com http://www.studentclearinghouse.org/
American Association of Collegiate Registrars and Admissions Officers One Dupont Circle, NW, Suite 520 | Washington, DC 20036-1135 (202) 293-9161 MAIN | (202) 872-8857 FAX | www.aacrao.org
© 2017 American Association of Collegiate Registrars and Admissions Officers. All rights reserved. Suggested Citation: Kilgore, W. & Wilson, J. (2017, September). The State of College Completion Initiatives at U.S. Community Colleges, Washington DC: American Association of Collegiate Registrars and Admissions Officers.

Contents
A College President’s Perspective ................................................................................................... 1
Introduction .................................................................................................................................... 4
Key Points – Institutional Data .................................................................................................... 4
Key Points – Student Data .......................................................................................................... 5
Key Points – Stories from the Field ............................................................................................. 5
Impetus ........................................................................................................................................... 5
Research Approach ......................................................................................................................... 6
A Brief History and Review of the College Completion Literature ................................................. 7
Critique of the Completion Agenda .......................................................................................... 13
Results ........................................................................................................................................... 14
Multi-Initiative Institutions (MIIs) ............................................................................................. 15
Measures of Institutional Engagement and Commitment to Initiatives .............................. 18
Student Engagement at Multi-Initiative Institutions ............................................................ 19
Reporting and Measures of Effectiveness ............................................................................ 21
Single Completion Initiative Institutions (SIIs) .......................................................................... 28
Measures of Institutional Engagement and Commitment to the Initiative at Single Initiative Institutions ............................................................................................................................ 28
Student Engagement at Single Initiative Institutions ........................................................... 30
Reporting and Measures of Effectiveness at Single Initiative Institutions ........................... 30
Stories from the Field ............................................................................................................... 34
Identifying Intentions and Creating Guided Pathways | Pima Community College ............. 34
Presidential and Faculty Leadership for Completion| Cuyahoga Community College ........ 36
10,604 | Harper College ........................................................................................................ 38
The Messy Middle | Metropolitan Community College ....................................................... 40
Aligning Accreditation and Completion | Northland Pioneer College ................................. 41
High-Tech, High-Touch | Bakersfield College ....................................................................... 44
Moving Toward an Integrated First Year Experience|Central Oregon Community College 46
Leading the (Path) Way | Monroe Community College ....................................................... 47
Building Relationships to Increase Completion | Columbus State Community College ...... 49
Redesign to Align | Linn-Benton Community College .......................................................... 50
“Changing the Way We Work” | Tulsa Community College ................................................. 52
Student Experience ................................................................................................................... 53
Closing ........................................................................................................................................... 57
References .................................................................................................................................... 59
Appendix A: List of active National College Completion Initiatives.............................................. 62
Appendix B: List of State Level Completion Initiatives Provided by Respondents ....................... 63

American Association of Collegiate Registrars and Admissions Officers
1
A College President’s Perspective
Dr. Veronica Garcia President Northeast Lakeview College Alamo Community College District I believe that an educated workforce is critical to the social and economic well-being of all our communities. In Texas, Governor Abbott charged three state agencies—the Texas Education Agency, the Texas Workforce Commission, and the Texas Higher Coordinating Board—to develop a set of recommendations to raise the educational attainment and increase our economic competitiveness. In addition, the Texas Association of Community Colleges just announced a plan to expand guided-pathways to all Texas community colleges. I was asked to provide my perspective as a community college president in reaction to the institutional and student data presented in this report. I found that the institutional successes and challenges presented in the “Stories from the Field” section mirror those of the Alamo Colleges, of which my college, Northeast Lakeview College (NLC), is a part. As part of the multi-pronged efforts to support and increase college completion, we have implemented new advising practices, increased retention efforts, defined student pathways to completion and wrestled with our need to have access to, understand and utilize our student data. We, too, seek feedback from our students to gain a further contextual understanding of the effectiveness of our initiatives. Our college completion initiatives are at once ongoing, exploratory and evolving. As others in this report mention, managing these initiatives takes coordination across functional areas; buy-in from faculty, staff and administrators; a consistent administrative voice championing the efforts; and, essentially, institutional grit to stick with an effort long enough to evaluate its effectiveness. This is the NLC and Alamo Colleges, completion agenda story so far: We have several completion initiatives and have identified metrics to measure our success. Initiatives include our new advising model, development of student pathways, enrollment process, dual credit/early college and student satisfaction. At NLC, we monitor several data points, including course completion rates, course pass rates, high challenge (at-risk) courses and fall-to-fall student persistence rates, among others. Highlighted here are details of some of our initiatives and the outcomes we have realized to date. Alamo Advise Alamo Advise is a case management approach to academic advising where students are assigned an advisor for the duration of their enrollment at NLC. During the mandatory New Student Orientation, students receive an advising syllabus that outlines by semester the advising achievements, milestones and expectations. By the 15th credit hour, students must declare their career goal and academic pathway. By the 30th hour, students must declare their university transfer intent. Students complete the state-approved core curriculum by the time

American Association of Collegiate Registrars and Admissions Officers
2
they have earned 42 credit hours and require 18 additional hours needed to complete the associate’s degree. Prior to implementing the case management model, NLC advisors had a student caseload of 1050:1. We hired additional advisors and reduced the caseload to 839:1 within the first year and aim to further reduce the ratio to 702:1 during the 2017-18 academic year. Although the caseloads are still relatively large, the model has allowed us to increase the number of students completing the core curriculum by 150% over the past two years, increase the number of graduates by 25%, and decrease the average number of semester credit hours completed by the graduates from 90 to 70. Partnerships NLC, in collaboration with Judson Independent School District, launched the Judson Early College Academy (JECA) in 2009 with 125 students in the first cohort. Over the duration, the program has sustained a graduation rate of over 90%. In May 2017, 109 JECA students graduated with a high school diploma and associate’s degree. Northeast Lakeview has maintained a partnership with JISD and expanded the ECHS model to Judson, Wagner and Veteran Memorial High Schools during the 2016-17 academic year. The JISD and NLC partnership currently enrolls approximately 715 students in dual degree courses. Summer Momentum Program A Summer Momentum Program (SMP) was offered as a plan to increase the number of students who enroll in summer courses by offering free credits to help students expedite degree completion. The program enabled students who earned 18-24 total credit hours across both semesters (fall 2016 and spring 2017) to receive three to six free credit hours for summer 2017. As of July 10, 2017, the five colleges paid more than $3,126,766 in student scholarships, with 7,477 students enrolled (out of the 14,201 who were eligible to receive the scholarship). Data and Outcome Based Funding Texas requires public institutions to create and implement a college completion plan and has shifted some of the state funding from enrollment to student success metrics, such as retention and completion. The college or university receives additional funding under an outcomes-based funding model allocated on a three-year rolling average of postsecondary completions or other measurable student outcome metrics. The Student Success Points Model awards institutions for: complete DE Math; complete DE reading/writing; first college-level math completed; 15 college-level credits earned in one term; 30 college-level credits earned in one year; certificate and associate degrees awarded; and employment and bachelor degrees completed. The challenge NLC faces is ensuring the accuracy of the methodology used to assess these metrics, not only at the state level but also at the local and federal level. The Alamo colleges developed a data analyst position within the division of student success for each college to support additional data needs and to relieve the institutional effectiveness departments of some of this workload. The data analyst is charged with developing, tracking and analyzing student success metrics; providing systematic reports and performance analytics; identifying
American Association of Collegiate Registrars and Admissions Officers
3
patterns and trends that impact student success; and supporting continuous process improvement efforts. Historically, a core philosophy at community colleges was to accept students where they are academically and help them develop the skills they need to achieve their personal goals, even if that took longer than the standard timeframe. Although there is now a move to increase the rate at which students complete and the percentage of those who complete at NLC, we remain steadfast to our commitment not to allow the desire to graduate students quickly to negatively impact the quality of education. It is apparent from this report and other related data that the college completion agenda is still very active. State legislatures and organizations with an educational focus will continue, for the foreseeable future, to be a primary driving force behind these initiatives, particularly at the community college level. Unfortunately, without federal guidance or major national initiatives, the national college completion landscape may become further fragmented, where some states and/or college districts will be able to provide their citizens with a wide-ranging set of options to complete their college education while other, perhaps less economically fortunate states/districts, will not be able to do the same.

American Association of Collegiate Registrars and Admissions Officers
4
Introduction
The American Association of Collegiate Registrars and Admissions Officers (AACRAO) periodically undertakes research projects to keep ourselves and the higher-education community in general, informed about current and emerging institutional practices.
College completion rates and how to improve them, have been in the forefront of the higher education agenda in the United States since 2009 when President Obama announced his 2020 goal to increase the percentage of citizens with college degrees. For this project, we chose to focus on how the completion agenda impacts student success and the institution, as measured by an increase in the number or percentage of certificates or degrees awarded at U.S. community colleges. We attempted to: gain an understanding of the rate of participation in any formal college completion initiative, understand the breadth of initiatives in progress, measure the fiscal and human resource impact on the institution and determine the impact on student completion. In addition, we wanted to capture an understanding of students’ awareness of their colleges’ efforts to support degree completion.
During the survey development process, we reviewed existing resources on the subject and were unable to find a definitive source listing all active national college completion initiatives. The resources found were several years old and contained references to inactive initiatives. As a result, we included survey questions to help us develop a current snapshot of most, if not all, national-level initiatives.
Key Points – Institutional Data
The data alludes to the existence of at least one college completion initiative at more than half of community colleges in the United States.
Most institutions are engaged in more than one initiative simultaneously.
Most expect attention to completion initiatives to increase over the next year.
Almost all multi-initiative institutions require students to participate in student success activities; the most common activities are advising, orientation, tutoring and course placement.
Nearly 9 out of 10 multi-initiative institutions rate their initiatives as “extremely effective,” “very effective,” or “moderately effective” compared to about 8 of 10 of single-initiative institutions.
For institutions with internal and/or external reporting requirements related to the initiative(s), the majority view meeting those requirements as “moderately challenging.”
Initiative funding is not generally an issue for multi-initiative institutions; single-initiative institutions face greater funding challenges.

American Association of Collegiate Registrars and Admissions Officers
5
Twelve percent of multi-initiative institutions describe their faculty as “extremely engaged” in college completion efforts.
Key Points – Student Data
All of the students agreed their institution has programs and/or services in place to help them reach their educational goal.
Most believe their institution has recently increased efforts to improve student success.
Advising and guidance counseling top the list of services students report as helping them meet their educational goal.
Almost two-thirds of students indicate they are familiar with the national push to increase the number of college completers.
Only one-third report completing an educational plan of study and less than one-quarter use a guided pathway for completion.
Key Points – Stories from the Field
Access to data is very important.
The ability to trust the accuracy of the institutional data is paramount to buy-in for completion efforts.
An institution-wide culture of completion is key to success.
Service redesign is a common component of completion initiatives.
Special student programs and success courses have been created to support initiatives.
Curriculum review and realignment is often utilized to support completion.
Some have added more staff (such as advisors) or created entirely new positions to support the initiatives.
Impetus
The National Center for Higher Education Management Systems (NCHEMS) summarized the college completion agenda thusly, “The college completion agenda is based on the premise that higher-education produces both private and public financial benefits and thereby encourages economic prosperity.” (NCHEMS, 2017). On February 24, 2009, President Obama set an ambitious goal for American higher education. In his first joint address to Congress, the President declared, “by 2020, America will once again have the highest proportion of college

American Association of Collegiate Registrars and Admissions Officers
6
graduates in the world” (Obama, 2009a). At this time, the United States also ranked 14th globally in the percentage of 25-34 year-olds with an associate degree or higher (OECD, 2017). The President challenged students to pursue at least one year of college or career training beyond high school:
“This can be community-college or a 4-year school; vocational training or an apprenticeship. But whatever the training may be, every American will need to get more than a high school diploma. And dropping out of high school is no longer an option” (Obama, 2009a).
This challenge refocused efforts of higher education leaders, many of whom had spent years targeting access and affordability issues, to find ways to award credentials to eight million additional students by 2020. As a result, the higher education community formed additional coalitions, developed strategic plans, conducted research and created and evaluated programs focused on increasing degree completion. Today, while there is broad agreement among higher education leaders to help more students complete college, there are limited data on the most effective means to improve completion rates on a national scale (Kelly & Schneider, 2012).
A wealth of qualitative and quantitative data exists on the impact on college completion rates of individual initiatives. In addition, the economic returns of increased college completion were examined on national and state levels by NCHEMS and Center for Law and Social Policy (CLASP) (NCHEMS, 2017). However, we were unable to find data that collectively examines the impact of these initiatives on college completion rates. Finally, we anecdotally heard from some of our community college members that they are managing multiple formal college completion initiatives simultaneously. It was these observations, taken together, that led us to the focus of the research presented here.
Research Approach
The project consisted of two primary surveys - one for U.S. community colleges (which for the purposes of this research also included technical colleges) and another for current community college students. A literature review and interviews with community college administrators familiar with the institutional initiatives were also conducted. The institutional survey included questions about initiative participation and how completion improvement efforts impact the institution. A follow-up, one-question survey was distributed to those institutions for which we did not receive a response to the initial survey. The one-question survey asked if the institution was engaged in at least one formal completion initiative, or if not, if the institution had practices in place to support college completion. Those who indicated the institution had at least one completion initiative were subsequently invited one final time to complete the comprehensive survey. Institutional respondents were also asked if they would be willing to participate in phone interviews to share their institutional stories.
The institutional survey content consisted of a multi-branch question set based upon whether or not an institution is currently “actively engaged” in one or more formal college completion

American Association of Collegiate Registrars and Admissions Officers
7
initiatives. If respondents reported they had an active college initiative, the remaining survey content included, but was not limited to, the following:
Type of completion intiative(s) – national, state, institutional;
Name(s) of initative(s);
Engagement and awareness levels among adminsitrators, faculty and staff relative to the initiative(s);
Adequancy of funding for initiative(s);
Data and reporting requirements and challenges;
Active or passive student engagement and in what areas; and
Measures of success.
Community college students enrolled in a nationwide voluntary survey panel were also invited to complete a short survey online. Students were asked about services they use at their community college, their enrollment pattern, if they are required to use any of the college’s services (e.g., advising, success coaches) and whether they had any perception of specific college completion efforts at their institution.
A Brief History and Review of the College Completion Literature
Efforts to increase completion rates at community colleges require an understanding of the needs, barriers and sociopolitical contexts facing students, faculty and leaders. This literature review provides a brief history of the national college completion agenda, examines the role of community colleges in increasing completion rates and surveys the national landscape of active completion efforts. In addition, this review focuses on the efforts and programmatic methodology of select initiatives.
The oft-cited Organization for Economic Co-Operation and Development (OECD) rankings show the United States slipping in attainment rankings compared to other countries. But this tells only part of the story. Hauptman (2012) points to OECD data that show the U.S. is highly competitive across age groups in baccalaureate attainment (2nd globally among 24-64 year olds in 2008) but lags behind other nations on sub baccalaureate attainment (tied for 9th). Despite the conferral rate of associate degrees growing faster than bachelor’s conferral rates in the U.S., the overall degree-attainment rate remains stagnant. Hauptman (2012) cites a few reasons for higher attainment rates in other countries, including U.S. immigration patterns and international higher education reforms (e.g., Bologna Process). In addition, sub baccalaureate degrees are rarely terminal degrees in the U.S., unlike in some other nations.
Community and technical colleges hold the primary role in awarding certificates and associate degrees in the United States. They are predominantly open-access institutions that disproportionately serve low-income students, adult learners, students of color and first-

American Association of Collegiate Registrars and Admissions Officers
8
generation students. In 2014, 56% of Hispanic and 44% of Black students were enrolled at community colleges, compared to a total of 29% of both Hispanic and Black students enrolled at public 4-year institutions (Ma & Baum, 2016). Additionally, 33% of all students enrolled at community colleges in 2011-12 worked full-time compared to 20% of students at public 4-year and 18% at private not-for-profit 4-year institutions (Ma & Baum, 2016).
The Obama administration’s rollout of the American Graduation Initiative (AGI) is often viewed as the launch of the national college completion agenda. AGI is a 10-year plan that was announced on July 14, 2009. It dedicated federal funds to support community colleges while calling for five million more community college graduates by 2020 in order to, once again, lead the world in college degree attainment (Obama, 2009b). While the Obama administration increased focus on community colleges and completion, some states and 2- and 4-year institutions were already focusing on increasing student completion. In addition, foundations and nongovernmental organizations were and continue to be, involved in completion initiatives.
Measuring the scope of initiatives in place to support the completion agenda is difficult because institutional participation can include national, state and college-specific initiatives—or none at all. In the first years after Obama’s completion challenge, a wide variety of organizations adopted a completion agenda.
With funding from major foundations, a diverse set of initiatives formed with the common goal of increasing the number of adults with credentials (i.e., a degree or certificate). In A Guide to Major U.S. College completion Initiatives, the American Association of State Colleges and Universities (AASCU) identifies 13 initiatives, several of which were formed after 2009 (Russell, 2011). Other initiatives have been introduced since the guide was published. We have identified 19 active national completion initiatives (Appendix A). Although some are no longer in place, it is possible that participating institutions are still implementing practices developed during the initiative’s existence without the formal structure of the sponsoring entity.
Additionally, while an institution might not be formally engaged in a comprehensive completion initiative, it may engage in practices or initiatives that foster completion. For example, the Carnegie Math Pathways initiative, which has 56 participating colleges in 14 states, focuses on helping students successfully complete math requirements by shortening the developmental math sequence and reducing transition points (Carnegie Math Pathways, 2017).
Philanthropic foundations maintain a large role in supporting completion initiatives, providing funding, research, consulting and human resources toward such efforts. Some leaders in this arena are the Bill and Melinda Gates Foundation, Carnegie Corporation of New York, Ford Foundation, Lumina Foundation for Education and the W.K. Kellogg Foundation. In addition, B. Lamar Johnson, along with presidents of a dozen technical and community colleges, founded the League for Innovation in the Community College in 1968. Since its founding, the League has released more than 200 publications, 140 research and demonstration projects and has convened several gatherings of community college administrators, faculty and other leaders aimed at improving completion at community colleges (League for Innovation in the Community College, 2017). The League focuses on a wide range of issues impacting community college student success efforts, which include simplifying the transition from high school to

American Association of Collegiate Registrars and Admissions Officers
9
college through curriculum alignment and supporting career pathways programs to prepare students for the workforce (League for Innovation in the Community College, 2007).
Another early completion effort, “Achieving the Dream: Community Colleges Count (ATD),” began in 2004 with funding from Lumina. The focus of ATD is “to improve institutional outcomes, including helping academically underprepared students succeed in college-level work, increasing semester-to-semester persistence and improving rates of degree completion” (Bailey, Jaggars, & Jenkins, 2015, p. 7). ATD began as a network of more than two dozen colleges in five states; each being assigned two coaches—one for data and one for leadership—who are generally experienced institutional researchers and community college leaders, respectively.
A primary goal of ATD is to help institutions effectively gather and analyze data, which is used to make decisions to improve student outcomes, with an emphasis on low-income students and students of color (Zachry Rutschow et al, 2011). An investment of more than $150 million in ATD by Lumina and other national and local donors resulted in ATD becoming a freestanding nonprofit organization in 2010, with a diversified funding base (Achieving the Dream, 2017). ATD college network members pledge to boost certificate and degree completion rates by focusing on:
1. Course completion with satisfactory grades; 2. Developmental education leading to college-level coursework; 3. Enrollment and success in gatekeeper courses, such as introductory English and math;
and 4. Persistence and re-enrollment in successive terms (McClenney, 2013).
In 2007, presidents and chancellors of nearly two dozen public higher education systems in the United States, representing more than 3.1 million students, formed the Access to Success Initiative (A2S). A2S is a joint effort between the National Association of System Heads (NASH) and The Education Trust to increase overall graduation rates in participating states while decreasing the attainment gap for students of color and low-income students. The A2S baseline report identified IPEDS data gaps, including missing data on degree completion by economic background, non-first-time students, and part-time students (Engle & Lynch, 2009). These data are instrumental in institutional decision-making. In response, A2S developed four metrics that allow participating institutions to analyze their progress annually in reducing the attainment gap. The metrics include:
1. Identifying and counting transfer students who graduate within the same system; 2. Retention rates of both part-time and full-time students by race and family income; 3. Data on system-wide transfer to other associate or bachelor’s programs; and 4. Number of degrees conferred by income and financial aid status (Engle & Lynch, 2009).
Some of the data gaps have been addressed since 2009. In the 2015-2016 academic year, the National Center for Education Statistics (NCES) Integrated Postsecondary Education Data System (IPEDS) started collecting data through the new Outcomes Measures survey to identify the following cohorts in addition to first-time, full-time (FTFT):

American Association of Collegiate Registrars and Admissions Officers
10
1. “First-time, part-time students (FTPT),who attend less than a full-time credit workload each term (typically less than 12-credits) and who have no prior postsecondary attendance;
2. Non-first-time students, also known as transfer-in students, who are enrolled at a full-time level (NFTFT); and
3. Non-first-time students, also known as transfer-in students, who are enrolled at a part-time level (NFTPT).” (Jones, 2017).
On October 12, 2017 the Department of Education released graduation rate data for the first time on part-time and transfer students. In addition, beginning in the academic year 2017-2018, the Outcome Measures survey will include students who enroll throughout the academic year (Itzkowitz, 2017).
Challenges accessing appropriate data are not unique to community colleges; the four-year sector responded similarly to increased calls for accountability and transparency by creating the Voluntary System of Accountability (VSA) in 2007. Created through a partnership of the Association of Public and Land-grant Universities (APLU) and the American Association of State Colleges and Universities (AASCU), the VSA defined metrics and created publicly available College Portraits online of 275 institutions (APLU website, n.d.). In addition, private, not-for-profit institutions developed the University and College Accountability Network (UCAN) through the National Association of Independent Colleges and Universities to share institutional data publicly (UCAN, 2013).
Like public and private four-year colleges, community colleges see the need for transparency in an era of accountability, but community college leaders need a framework that takes into account the diverse missions and enrollments of community colleges. A consistent challenge facing community colleges working to increase completion rates is a lack of reliable data (Phillips & Horowitz, 2013). Participating institutions report required data to national and state agencies; however, the diverse nature of community college students and their educational goals (e.g., career and technical education, continuing education and transfer) make assessing student outcomes accurately a different challenge from four-year institutions.
To this end, The American Association of Community Colleges (AACC), the Association of Community College Trustees (ACCT) and the College Board developed the Voluntary Framework of Accountability (VFA) for community colleges (AACC, 2012a). The three-phase project, which began in 2009, included multiple working groups, input from community college leaders and piloting and assessing metrics. In addition to examining measures used in the VSA and UCAN, the VFA group assessed current measures being used for accountability reporting used by the National Community College Benchmarking Project, ATD Cross-State Data Group, Complete College America and multiple system-wide state accountability models, including those in Florida, Georgia, Maryland, Ohio and Washington state. This work resulted in the VFA, which has four key metrics, including:
1. Student progress and outcomes; 2. Career and technical education (both credit and noncredit); 3. Adult basic education and the GED; and

American Association of Collegiate Registrars and Admissions Officers
11
4. Student learning outcomes (American Association of Community Colleges, 2012).
The VFA standardizes metrics for completion and simplifies reporting and the sharing of community college data with the public. The diverse composition of community college students and enrollment patterns makes collecting data on progress and outcomes for all students critically important in telling the full story of community colleges and their students. The VFA uses retrospective cohort tracking to measure progress after two years, or 100% of normal time to completion. It also measures completion rates at six years (300% of normal time to completion), an increase from the previous standard three-year (150% of normal time to completion) measure of completion (AACC, 2012a). The 300% timeframe helps overcome limitations of the three-year (150% of normal time to completion) measure, which does not take into account transfer students, thus painting an incomplete picture of community college completion (Juszkiewicz, 2016; AACC, 2016).
Although completion is often the primary measure of success, not all community college students attend with the intention of earning a certificate or degree. In addition, while 81% of students entering community colleges indicate the desire to earn a bachelor’s degree or higher, only 33% of those students transfer to a 4-year institution within six years (Horn & Skomsvold, 2011; Jenkins & Fink, 2016). Among first-time college students enrolled at a community college in 2010, 39% earned a certificate or degree from a 2- or 4-year institution within six years (Shapiro et al., 2016). Additionally, 78% of community college students who transfer to a 4-year institution do so without first earning a degree or certificate. In fact, more than two million students attended post-secondary education for at least two years between 2003-2013 without earning any degree (National Student Clearinghouse, 2017). These data point to an opportunity to recognize the academic credit already earned by students and often applicable to an associate degree but not yet awarded. Reverse transfer initiatives have been developed as one way to award degrees to some of these students and have driven some activities among national and state education groups (Anderson, 2015).
Reverse transfer has, up until recently, been defined as the “intentional transfer from a 4-year institution to 2-year institution.” However, the definition of reverse transfer has shifted over time, along with student enrollment patterns. More recently, Hannenmann and Hazenbush (2014) define reverse transfer as “the process of retroactively granting associate degrees to students who have not completed the requirements of an associate degree before they transferred from a 2- to a 4-year institution” (p. 6). Hannenmann and Hazenbush’s definition refers to an intentional process of conferring more associate degrees to students who have completed requirements while at their 4-year institution, even if they are unaware of their eligibility to earn that degree (Anderson, 2015). Sometimes with the help of outside organizations, institutions use enrollment data to identify students who would benefit from reverse transfer. For example, five national foundations developed the Credit When Is Due (CWID) program in 2012. CWID aims to help states facilitate reverse transfer programs. It began with 12 states in 2012 and later expanded to 15 (Credit When It’s Due, n.d). The Family Educational Rights and Privacy Act (FERPA) hampers these initiatives because it requires that institutions obtain permission to share a student’s 4-year institution transcript with the 2-year institution even though the student previously attended that 2-year institution.

American Association of Collegiate Registrars and Admissions Officers
12
The not-for-profit Complete College America (CCA) was founded in 2009. CCA focuses primarily on state higher education policy as a means to implement five of what it calls “game changers” for institutions and state systems to achieve increased completion rates (Complete College America, 2014). The five game changers identified by CCA include:
1. Math pathways; 2. Corequisite remediation; 3. 15 to Finish (which encourages students to take 15 credits per semester or 30 per year); 4. Structured schedules; and 5. Guided pathways through meta-majors.
Like many other initiatives, CCA is funded by philanthropic organizations; however, its approach has been viewed by some as more controversial than others. One issue of contention is CCA’s push to increase performance-based funding for colleges, an aspect of higher-education reform seeking to incentivize institutions to focus on outcomes over enrollment. Calling CCA “the standard bearer of the completion agenda,” Walters (2012, p. 34) critiques the reform of performance funding, citing concern the effort forces institutions to comply by punitively withholding funds from them. Additionally, CCA has focused heavily on reforming developmental education, including through corequisite education. Corequisite education places academically underprepared students in credit-bearing courses with extra academic support instead of directing them into separate developmental-education courses (Fain, 2012). A bill supported by CCA in Connecticut that proposed eliminating remedial courses was met with resistance from some community-college leaders and scholars, prompting an opinion piece from the Community College Research Center in The Hartford Courant opposing the proposed legislation (Bailey, Hughes, & Jaggars, 2012).
Harbour and Smith (2016) describe the completion agenda narrative as having three parts:
1. The American Dream is in peril with both social mobility and family incomes stagnant. 2. The economic growth of the United States is falling behind other nations. 3. An educated workforce is critical to the economic and social health of our country and
democracy.
The completion agenda is designed to address these three challenges. In 2010, the heads of six of the nation’s leading community college advocacy organizations released “Democracy’s Colleges: Call to Action,” a signed statement calling for community colleges to commit to increasing the number of credentialed students by 50% by 2020 (McPhail, 2011). The call to action states “our democracy needs every one of us” (AACC, 2010).
Adopting this narrative, in 2012 AACC released Reclaiming the American Dream: Community Colleges and the Nation’s Future a seminal policy document in the higher education reform movement. The document states:
“Community colleges have served this nation and its communities and families, well. Now community colleges are asked to take part in a great rebirth of America. The nation’s future is at risk, in part because of inadequate investment in our human capital” (AACC, 2012b, p. xi).

American Association of Collegiate Registrars and Admissions Officers
13
AACC also makes recommendations for reforming community colleges, promoting “the three Rs,” which include:
1. Redesigning students’ educational experiences; 2. Reinventing institutional roles; and 3. Resetting the system (pp. ix-x).
Although the initiatives discussed in this review share a common goal, they vary in their approach to achieve increased completion rates. A large focus of the completion agenda is on state policy through elected officials and boards of trustees (Rhoades, 2012; Humphreys, 2012). This is primarily because it is at the state level where political pressure can most effectively be applied to drive institutional change (Walters, 2012). Additional approaches to increasing completion rates include but are not limited to: identifying “nearbies” (Bers & Schuetz, 2013, p. 167), students who have already completed, or are near completing, a program of study; changing developmental education (Venezia & Hughes, 2013); creating guided pathway to reduce confusion and better track student progress (Jenkins & Cho, 2013), and high schools and community colleges working closer together (Valdez & Marshall, 2013).
Critique of the Completion Agenda
The goal of increasing the number of Americans with postsecondary degrees is a shared goal for many, but there is disagreement and concern about the various approaches to the completion agenda. In the winter 2012 issue of Liberal Education, which was devoted to the completion agenda, Rhoades argues that numeric goals alone fail to address real educational, economic, and social challenges facing the United States and provide no mechanisms for improving education quality. Harbour and Smith (2016) identify three primary camps of resistance:
1. Some are concerned that the completion agenda prioritizes credentials over student learning and quality of education;
2. There has not been adequate discussion of the completion agenda’s guiding purposes and there is a lack of consensus on what is effective; and
3. The numerical goals are unrealistic and the focus on numbers might negatively impact the success of low-income students and students of color.
It has been more than eight years since the launch of the national completion agenda and it is less than three years until the 2020 deadline to increase the number of Americans with postsecondary credentials. Has the college completion agenda worked? There are few clear answers. According to the most recent data from OECD, the United States ranks 10th globally in the percentage of 25-34 year olds with an associate degree or higher. The national completion agenda has by all appearances succeeded in both improving the percentage of the population with a college degree. In addition, these efforts have sparked conversation among higher education leaders, policymakers and nongovernmental entities and produced numerous initiatives aimed at increasing the number of students who complete a certificate or earn a degree. Many community colleges in the United States have experimented with ideas, practices
American Association of Collegiate Registrars and Admissions Officers
14
and policies for the past eight years to improve completion, with varying degrees of success. This experimentation has created a trove of institutional data that must be used to identify what works, how and why it works and for whom it works, so it could be scaled on a national level. To do this, higher education leaders cannot view 2020 as the end of the completion agenda; rather it must be the beginning of a national, data-driven effort to make sure every student who seeks to do so succeeds in earning a certificate or degree.
Results
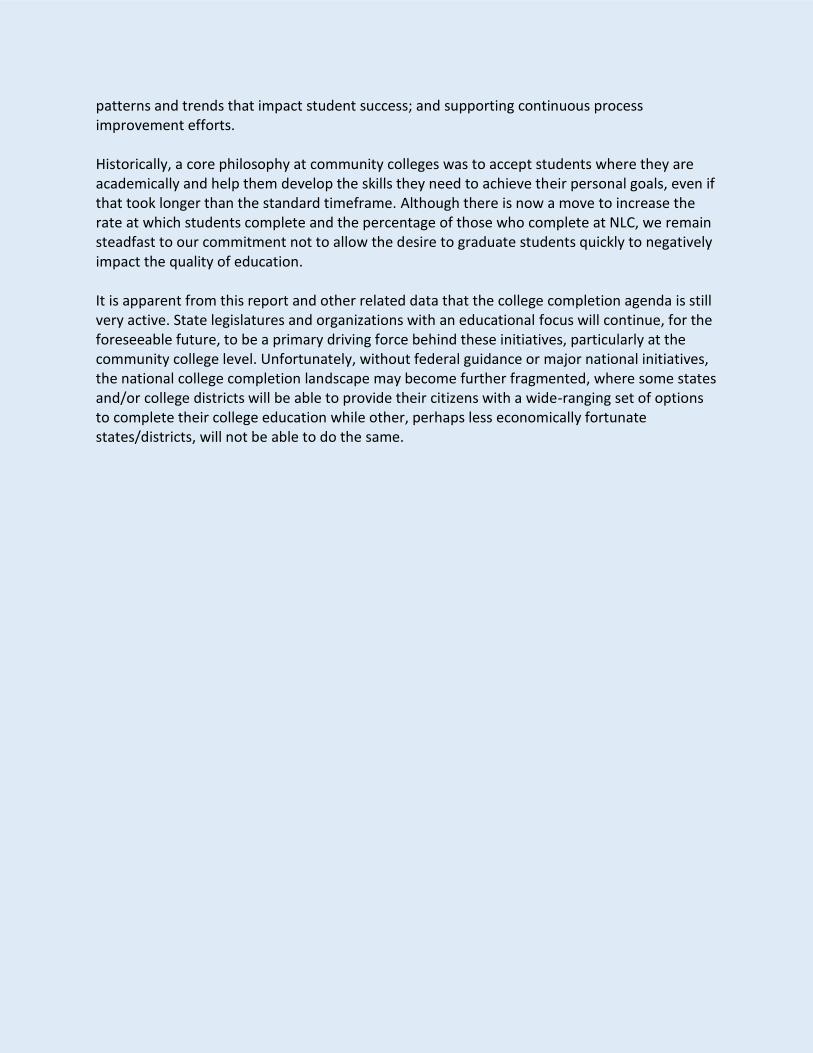
Of the 97 community colleges in the United States that responded to at least the first question in the survey, 95 are actively engaged in one or more formal college completion initiatives at the national, state or local level (Figure 1). Examples of national- and state-level completion initiatives were included in the survey, as well as the option to add others not proffered. Almost three-quarters report engagement in more than one initiative simultaneously. The institutional data is reported in two groups – those with just one initiative and those with more than one initiative.
We hypothesize that the low number of initial respondents who indicated their institution did not have at least one active completion initiative points to survey bias rather than serving as a representative sample of practices at U.S. community colleges. We surmised that perhaps the subject heading for the survey invitation led some who do not have an initiative to skip the survey completely, rather than answer the first question, “Is your institution actively engaged in at least one college completion initiative?”
Figure 1: Location of Participating Institutions*
*locations identified by IP address of respondent captured by Qualtrics

American Association of Collegiate Registrars and Admissions Officers
15
With the above hypothesis in mind, a second one-question survey was distributed to a subset of the original invitees plus some new potential institutional contacts based on AACRAO’s membership database. The email invitation subject line indicated it was a one-question survey about college completion initiatives. Response choices included:
“Yes, our institution is engaged in one or more formal college completion initiatives”
“No, our institution is not engaged in any formal college completion initiative. However, we do have institutional practices and/or policies in place that support college completion”
“Other, please describe”
An additional 89 institutions responded to the one-question survey. Some who indicated “Yes, our institution is engaged in one or more formal college completion initiatives” subsequently chose to complete the comprehensive survey bringing the response total to the 97 reported in this study.
After removing those who subsequently completed the comprehensive survey from the results of the one-question survey, the remaining 69 institutions, with and without formal completion initiatives, were more closely balanced than the sample captured in the comprehensive survey. That is, 57% indicated having at least one initiative versus 43% who reported not having one. These results allude to completion initiatives being moderately prevalent at U.S. community colleges. However, due to the sample size captured by each survey, a conclusion cannot be drawn about the absolute pervasiveness of formal completion initiatives at U.S. community colleges.
Multi-Initiative Institutions (MIIs)
Among institutions that reported more than one active college completion initiative, institution level initiatives are the most common, with nearly nine in ten reporting an initiative at this level. However, additional survey data highlighted a limitation to the accuracy of this data point. Several respondents listed institutional practices, rather than a comprehensive initiative. On the other hand, almost three-quarters reported they are involved in at least one national initiative and more than half stated they are involved in a state level initiative (Figure 2).

American Association of Collegiate Registrars and Admissions Officers
16
Complete College America1, Achieving the Dream2, the AACC’s Pathways Project3 and federal grants of some kind are the top four reported national initiatives among the selections provided in the survey (Figure 3). A Title III grant was mentioned the most for those who provided additional information for the “federal grant” category. Others included Title V (HSI), NSF and TRIO.
Other national initiatives listed by respondents include:
The League for Innovation Pathways Project
Credit When It’s Due from the Lumina Foundation, Kresge Foundation, Helios Education Foundation, USA Funds and Bill & Melinda Gates Foundation
Frontier Set grant by the Bill & Melinda Gates Foundation
Persistent and Completion Academy Experience by the Higher Learning Commission
Improving persistence through financial-aid regulation enforcement
1 http://completecollege.org/ 2 http://achievingthedream.org/ 3 http://www.aacc.nche.edu/Resources/aaccprograms/pathways/Pages/default.aspx
70%58%
88%
At least one national-level initiative(e.g., AACC's Pathways Project,
Complete College America)
At least one state-level initiative(e.g. "Drive to 55", "Complete
Florida", "Mathways")
At least one institutional basedinitiative
Figure 2: MIIs Engagement by Initiative Type (all that apply)

American Association of Collegiate Registrars and Admissions Officers
17
Several of the state-level initiatives listed by respondents included the term “Complete College” or “Guided Pathways” as the title of the initiative (Appendix B). For some, the response clearly differentiates the state level “Complete College” and “Guided Pathways” programs from any national initiatives with the same name. Additionally, some state initiatives focus on math and/or English courses, while others focus on transfer pathways.
More than 50 institutions supplied descriptions of their institution-level initiatives and the results are fairly evenly split between formal programs and less formally-organized practice interventions. Formal programs include “15 months to your future,” “One and Done,” “Degree Advantage,” “Proactive Advising for Student Success (PASS),” ”Student Pathways Project,” and “Finish the Race,” to name a few. Although the survey was not intended to capture individual practices, interventions provided by respondents included intrusive advising, reverse transfer,
0%
0%
0%
0%
0%
2%
4%
6%
6%
9%
11%
17%
26%
30%
34%
45%
49%
Adult College Completion Network
AACC Community College/Career Collaboration
Alternative Credit Project
Ensuring America's Future by Increasing Latino CollegeCompletion (EAF)
Talent Pipeline Management U.S. Chamber of CommerceFoundation
AACC Plus 50 (Encore) Initiative
AACC College Completion Challenge
iPASS Grant Challenge EDUCAUSE
The New Mathways Project (NMP)
Jobs for the Future
Community College Completion Corps (C4)
Completion by Design
Other
A federal grant such as Title III
AACC Pathways Project
Achieving the Dream
Complete College America
Figure 3: MIIs Participation in National Level Initiatives (all that apply)

American Association of Collegiate Registrars and Admissions Officers
18
special math and science courses for those who tested into developmental-level courses, case management and success coaching.
Measures of Institutional Engagement and Commitment to Initiatives
The survey included questions about the general awareness of the initiatives across the institution, adequacy of staffing, the level of faculty engagement and funding. Not surprisingly, administrators were described as generally “very aware” of the initiatives, compared to staff or faculty who are more likely to be described as “moderately” or “slightly” aware (Figure 4)4. About half either “agreed” or “somewhat agreed” there are enough full-time administrators and staff to adequately support the initiatives (Figure 5).
4 Note: When the data was rounded to whole numbers, some chart totals in this report rounded up to 101% or down to 99%
75%
28%20%16%
52%45%
7%
20%29%
1% 0%6%
Administrators Staff Faculty
Figure 4: MIIs Level of Awareness of Initiatives among Administrators, Staff and Faculty
Very aware Moderately aware Slightly aware Not aware at all
3%5%
24%
29%
25% 24%
4%
8%
22%
15%
10%12%
10%8%
Staff Administrators
Figure 5: MIIs Initiatives are Adequately Staffed
Strongly agree
Agree
Somewhat agree
Neither agree nor disagree
Somewhat disagree
Disagree
Strongly disagree

American Association of Collegiate Registrars and Admissions Officers
19
With regard to the level of faculty engagement, more than half report their faculty are either “extremely engaged” or “moderately engaged” in completion initiatives. Almost a third more reported their faculty as “slightly engaged” (Figure 6). About one-quarter each identify their funding level as “moderately well-funded” or “neither well-funded nor underfunded,” while 4% portray their initiatives as “extremely well-funded” or “extremely underfunded” and 6% report no funding (Figure 7).
Student Engagement at Multi-Initiative Institutions
12%
43%29%
1%4%
7%
3%
Figure 6: Level of Faculty Engagement in Completion Initiatives
Extremely engaged
Moderately engaged
Slightly engaged
Neither engaged nor disengaged
Slightly disengaged
Moderately disengaged
Extremely disengaged
6%
4%
10%
12%
26%
24%
13%
4%
No funding is allocated specifically for initiatives
Extremely underfunded
Very underfunded
Moderately underfunded
Neither well-funded nor underfunded
Moderately well-funded
Very well-funded
Extremely well-funded
Figure 7: MIIs Level of Funding Available to Support the Completion Initiatives

American Association of Collegiate Registrars and Admissions Officers
20
Completion initiatives are often directly tied to certain student cohorts (e.g., first generation, remedial) and/or practice interventions (e.g., success coaching, mandatory advising). We were interested in differentiating active and passive student engagement activities and asked, “Do any of the initiatives require active engagement on the part of the student? That is, are students (or targeted populations of students) required to participate in specific activities (e.g., create an education plan, mandatory advising, student success skills class)?”
Nearly all institutions in this sample require active engagement on the part of the student for all, most, or some of the initiatives (Figure 8). From the 15 proffered activities, more than half of respondents selected the following as requiring active participation from students:
academic advising
orientation
course assessment/placement
communication with student success coaches
use of guided pathways and
tutoring (Figure 9).
Early alert notifications requiring action by the student, career-planning activities and tours of local businesses were provided by respondents as other activities required of students but not proffered in the survey.
19%
38%
34%
9%
Figure 8: MIIs Percentage who Require Active Engagement from Students Completion Initiative Activities
Yes, all of the initiatives require activeengagement.
Yes, most of the initiatives require activeengagement.
Yes, some of the initiatives require activeengagement.
No. The initiatives consist only of passiveengagement on the part of the student.

American Association of Collegiate Registrars and Admissions Officers
21
Reporting and Measures of Effectiveness
Reporting requirements were of interest for this project, particularly at MIIs because manpower is required to identify and analyze the data needed for each initiative. We asked to whom the institution must report, the ability to access the needed data and the level of difficulty associated with meeting reporting requirements. Based on this sample, state-level initiatives are more likely to have external reporting requirements than national or institutional initiatives. Surprisingly, 13% of respondents indicated there is no reporting requirement for national initiatives, 8% for state initiatives and 15% institutional-level initiatives (Figure 10). However, further examination is needed on this data point because it seems unlikely a national-level or state-level initiative would not have a reporting requirement.
7%
7%
10%
25%
26%
30%
30%
43%
46%
54%
62%
67%
72%
77%
79%
Other
Mandatory block scheduling
Mandatory meetings with faculty
Required to complete a FAFSA
Participate in supplemental instruction
Mandatory First Year Experience
Mandatory student success/study skills class/program
Required to complete an educational plan of study
Use of cohorts
Participate in tutoring
Guided pathways
Communicate with student success coaches
Mandatory assessment/course placement
Mandatory orientation
Mandatory academic advising
Figure 9: MIIs Active Engagement Activities Required of Students (all that apply)

American Association of Collegiate Registrars and Admissions Officers
22
Although the data collected in the survey did not lend itself to differentiating between institutions with internal reporting requirements and external reporting requirements versus those with only one or the other. The data was reexamined in its raw form to produce Figure 11. We found, in the aggregate and regardless of initiative level, almost half are required to report both internally and externally. Most respondents stated they are able to access data needed for assessing and reporting on the initiatives either “always” or “most of the time” for all initiative types (Figure 12). Just 2% indicated they are unable to access data for institutionally-based initiatives. Institutions generally characterize the ability to meet reporting requirements as “moderately” challenging” (Figure 13). However, about one-third find the reporting requirements for all types of initiatives to be either “extremely” or “very” challenging.
55%
38%
81%77%
90%
27%
13%8%
15%
National initiative State initiative Institutional initiative
Figure 10: MIIs Internal and External Reporting Requirements by Initiative Type
Internal reporting External reporting No reporting requirement
33%
11%46%
11%
Figure 11: MIIs Aggregated Reporting Requirements
External reporting
Internal reporting
Internal and External reporting
No reporting requirement

American Association of Collegiate Registrars and Admissions Officers
23
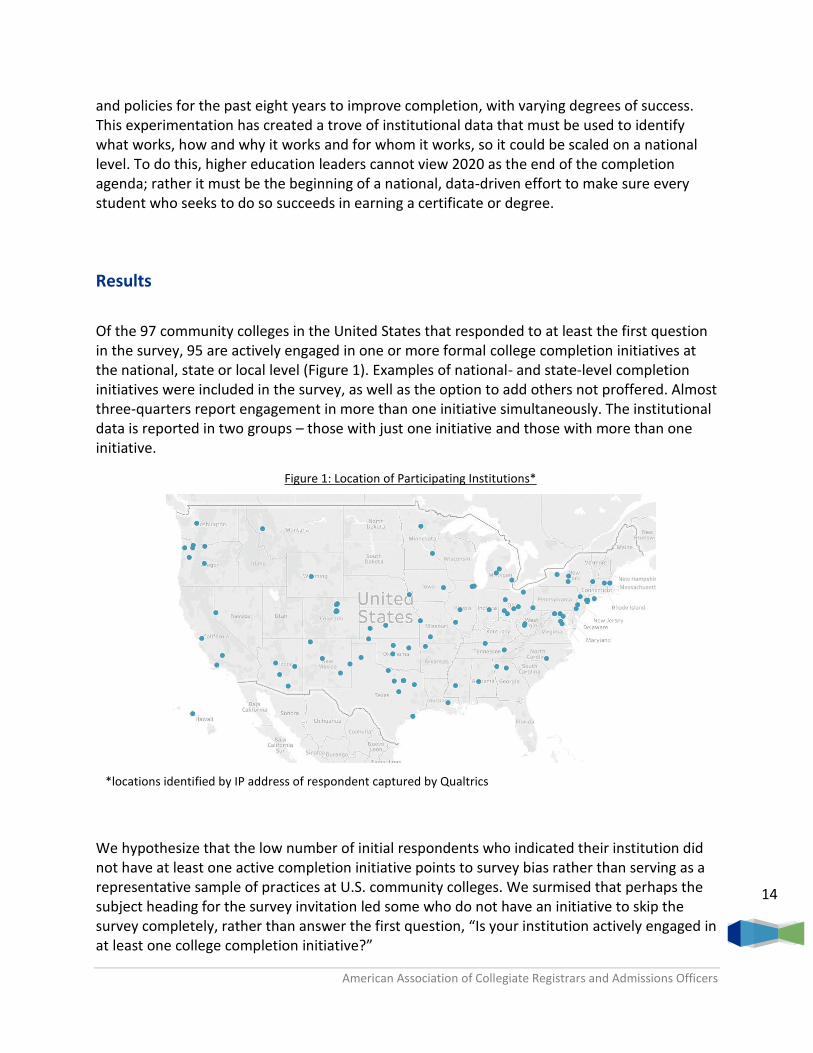
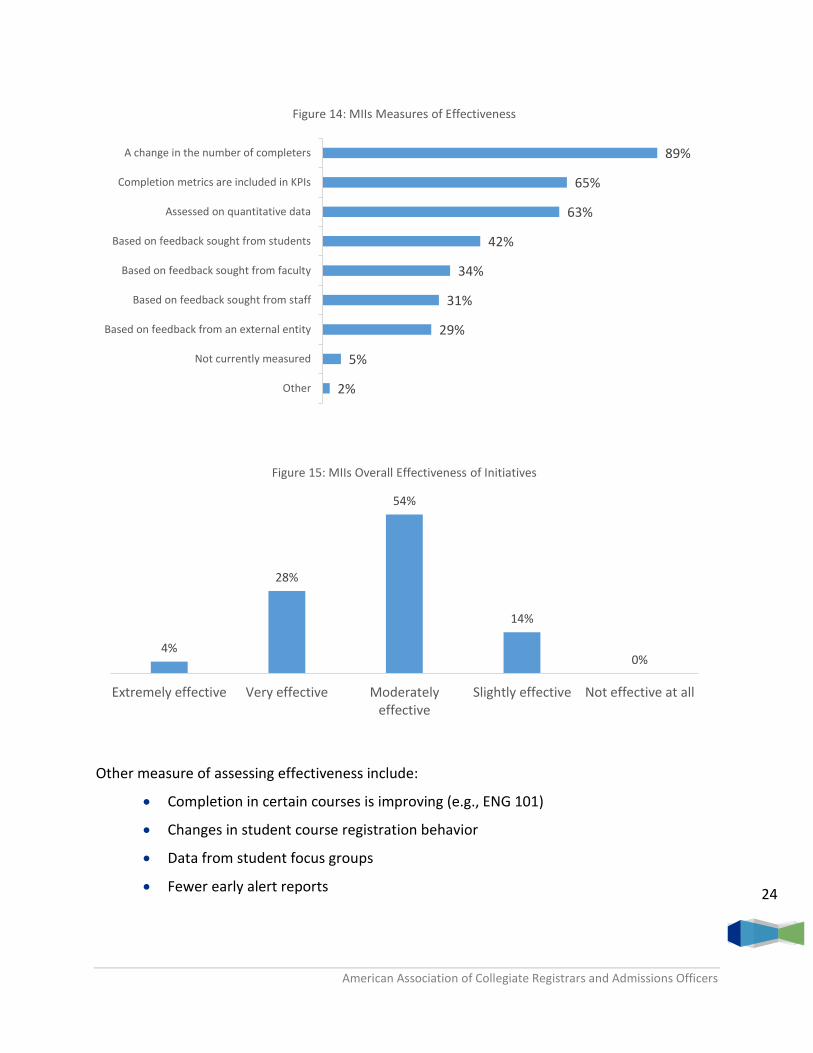
As one would expect, a change in the number of college completers is the measure of an initiative’s effectiveness, most frequently selected and followed by key performance indicators (KPIs) and other assessments based on quantitative data (Figure 14). Only 5% indicated their institution does not measure the effectiveness of their initiatives. Nearly one-third believe the initiative(s) is/are either “extremely” or “very” effective. A further 54% rate the initiatives “moderately” effective. Remarkably none selected “not effective at all” although some noted that it is too early to tell (Figure 15).
44%
31%34%
29%
44%40%
7%11%
14%20%
14%10%
0% 0% 2%
National initiative State initiative Institutional initiative
Figure 12: MIIs Ability to Access Data for Reporting and Assessments
Always Most of the time About half the time Sometimes Never
8%14%
10%
26%
11%
22%
44%49%
41%
15%20%
16%8% 6%
10%
National initiative State initiative Institutional initiative
Figure 13: MIIs Level of Difficulty in Meeting Reporting Requirements
Extremely challenging Very challenging Moderately challenging
Slightly challenging Not challenging at all
American Association of Collegiate Registrars and Admissions Officers
24
Other measure of assessing effectiveness include:
Completion in certain courses is improving (e.g., ENG 101)
Changes in student course registration behavior
Data from student focus groups
Fewer early alert reports
2%
5%
29%
31%
34%
42%
63%
65%
89%
Other
Not currently measured
Based on feedback from an external entity
Based on feedback sought from staff
Based on feedback sought from faculty
Based on feedback sought from students
Assessed on quantitative data
Completion metrics are included in KPIs
A change in the number of completers
Figure 14: MIIs Measures of Effectiveness
4%
28%
54%
14%
0%
Extremely effective Very effective Moderatelyeffective
Slightly effective Not effective at all
Figure 15: MIIs Overall Effectiveness of Initiatives

American Association of Collegiate Registrars and Admissions Officers
25
Questions related to whether or not initiative goal contradiction and goal overlap exists at MIIs were included in the survey. About half of respondents indicated some goal contradiction and half indicated goal overlap. Among those who mentioned at least one contradiction in the measures of initiative success, half either selected “a little” or “a moderate amount” (Figure 16). Several chose to provide insight into how the measures of success contradict one another. A selection of the remarks included:
“Only in our ability to spread limited resources (time and money) across multiple initiatives at once.”
“State prescribed completion goals are much more modest than those of the institution.”
“Most initiatives do not consider the time students must spend in remedial education.”
“It's not as much contradiction as a focus on short-term versus long-term goals.”
“Timelines for outcomes such as completion goals, strategies for achieving goals, e.g., increasing credit hours attempted versus manageable course loads that slow time to completion.”
“Some of the outcomes data/KPIs are a bit different, along with some definitional aspects.”
“There are many different definitions of cohorts that we're asked to track for the various initiatives - first time in college versus all new students, students who have enrolled with us in dual credit while in high school versus not, earning of all credit versus just earning college credit. Many external initiatives have their own unique set of metrics. Internally we base metrics for all initiatives on our scorecard and are able to define a consistent set of metrics to track.”
“Faculty promote transfer over institutional completion.”
2% 0%
10%
32%57%
Figure 16: MIIs Level of Goal Contradiction between Initiatives
A great deal
A lot
A moderate amount
A little
None at all

American Association of Collegiate Registrars and Admissions Officers
26
Presumably the half who did not believe there is goal contradiction indicated there is either “a great deal” or “a lot” of goal overlap among the initiatives (Figure 17). This is because the initiatives all have the same end goal -- increasing college completion. Comments on goal overlap provided by respondents included the following:
“The end product is the same in all instances; however, the process to the targets can be very different, complicated, expensive, time consuming and not well supported by the culture.”
“We need to improve our ability to be outcomes based when planning our activities and interventions. They are developed in silos instead of using a program/curriculum based approach with outcomes.“
“Generally, these initiatives involved similar groups of students (at risk, socially and economically disadvantaged students.) Additionally, the same staff resources are the ones developing. Implementing and deploying such strategies.”
“Some of the initiatives may involve much of the same staff and require the engagement with students or strategies that are facilitating student success, completion, or retention.”
About two-thirds of respondents indicated the institution has a vision of college completion that unites the components of the multiple initiatives. Rather than paraphrasing the institutional visions, some are recorded below:
“We have a student completion plan that is required by ODHE to outline all of the completion initiatives and implement a plan to execute.”
“Our Quality Initiative team (PASS) coordinates and monitors our completion efforts.”
“Ensuring the ability of the student to earn an associate degree in 5 semesters or less.”
26%
18%29%
9%
17%
Figure 17: MIIs Goal Overlap among Initiatives
A great deal
A lot
A moderate amount
A little
None at all

American Association of Collegiate Registrars and Admissions Officers
27
“70% student completion rate (degree, certificate or transfer) by the year 2020.”
“The vision is to integrate the various tools for early alert, online orientation, transfer, learning management system, guide pathways, etc. and to provide the staff resources for academic advisement, intervention and engagement to facilitate student success, retention and completion.”
“Our ‘One Door, Many Options for Success’ umbrella is the theme overlays all of our retention/completion work and initiatives.”
“It's emerging. Generally the vision is that students will either complete a bachelor's degree and/or earn a salary that's at least the minimum required to be considered middle class within six years after leaving our CC. That hasn't been crafted into a formal statement yet, but our president talks about it at every opportunity.”
“Institutional ARC model (Access, Retention, Completion).”
“To engage in an education that enables all of us to participate in, contribute to and benefit from the cultural richness and economic vitality of our communities.”
“The college uses our Completion Plan as a unifying force for our work. It's organized around momentum points, is circulated widely and is familiar to faculty, staff and administrators.”
“The vision of the College is to ensure every student that enters the institution has the opportunity to achieve their academic goal via completion of credential, successfully transitioning to a transfer institution or successfully entering the workforce.”
When asked about level of attention being paid to initiatives in the next year or so, 34% definitely anticipate a change in the level of attention and a further 38% will probably see a change in the attention (Figure 18). Of those who anticipate a change, 98% see an increase in that attention. Attention will increase for several reasons, including an increase in performance-based funding models, a need to increase retention, an institutional culture of continuous improvement, a new strategic plan, plans to engage faculty and being tied to a grant.
34%
38%
13%
10%
5%
Figure 18: MIIs Anticipated Level of Institutional Attention to Completion
Definitely yes
Probably yes
Might or might not
Probably not
Definitely not

American Association of Collegiate Registrars and Admissions Officers
28
Participants were provided the opportunity to submit additional comments. While a few are clearly positive, most address challenges with staying on course with an initiative, difficulty with changing the culture and the need for effective leadership to make the necessary changes in structure and/or practice.
Single Completion Initiative Institutions (SIIs)
Twenty-five institutions report just having one completion initiative: Of those 25 institutions, 44% have a national initiative, 20% have a state initiative and 36% have an institutional initiative. National initiatives included Complete College America, AACC Pathways, Completion by Design, AACC College completion Challenge and the New Mathways Project. Data presented here which compares multi-initiative institutions with single-initiative institutions, should be viewed with a fairly high degree of prudence given the relative sample sizes of the two groups.
Measures of Institutional Engagement and Commitment to the Initiative at Single Initiative Institutions
The level of initiative awareness among administrators, staff and faculty was comparable to that of multi-initiative institutions (Figure 19). A smaller percentage of single-initiative institutions than multi-initiative institutions agree their institutions have been able to adequately staff the initiative (Figure 20 and Figure 5). However, faculty engagement was similar to multi-initiative institutions with almost half described as “extremely engaged” or “moderately engaged” (Figure 21).
64%
24%
32%
20%
36%
20%16%
28%
40%
0%
12%8%
Administrators Staff Faculty
Figure 19: SIIs Level of Awareness of Initiative among Administrators, Staff and Faculty
Very aware Moderately aware Slightly aware Not aware at all

American Association of Collegiate Registrars and Admissions Officers
29
Single-initiative institutions report a considerably higher percentage of unfunded mandates (28% single vs. 6% multi). Just 28% of SIIs consider themselves to be either “moderately,” “very” or “extremely well-funded” compared to 41% of MIIs (Figure 22).
13% 12%
17%20%
25%
16%
25%
36%
17%
12%
4% 4%0% 0%
Staff Administrators
Figure 20: SIIs Initiative is Adequately Staffed
Strongly agree
Agree
Somewhat agree
Neither agree nor disagree
Somewhat disagree
Disagree
Strongly disagree
12%
32%
28%
16%
4%4% 4%
Figure 21:SIIs Level of Faculty Engagement in Completion Initiative
Extremely engaged
Moderately engaged
Slightly engaged
Neither engaged nor disengaged
Slightly disengaged
Moderately disengaged
Extremely disengaged

American Association of Collegiate Registrars and Admissions Officers
30
Student Engagement at Single Initiative Institutions
Single-initiative institutions are considerably less likely to require active engagement from the student than multi-initiative institutions (40% single vs. 91% multi). In addition, MIIs are most likely to require academic advising whereas SIIs’ most frequently required activity is tutoring (Figure 23).
Reporting and Measures of Effectiveness at Single Initiative Institutions
As stated in the previous section, data was not collected in a manner that lends itself to differentiating between institutions with internal reporting requirements and external reporting requirements versus those with only one or the other. Figure 24 was developed by disaggregating the question data. Among SIIs, an internal-only reporting requirement is more
28%
0%
4%
24%
16%
8%
20%
0%
No funding is allocated specifically for initiative
Extremely underfunded
Very underfunded
Moderately underfunded
Neither well-funded or underfunded
Moderately well-funded
Very well-funded
Extremely well-funded
Figure 22: Level of Funding Available to Support Completion Initiative
0%
0%
0%
10%
20%
20%
20%
30%
30%
40%
40%
50%
60%
70%
70%
Mandatory block scheduling
Mandatory First Year Experience
Participate in supplemental instruction
Required to complete a FAFSA
Guided pathways
Other
Use of cohorts
Mandatory student success/study skills class/program
Required to complete an educational plan of study
Communicate with student success coaches
Mandatory meetings with faculty
Mandatory academic advising
Mandatory assessment/course placement
Mandatory orientation
Participate in tutoring
Figure 23: SIIs Active Engagement Activities Required of Students

American Association of Collegiate Registrars and Admissions Officers
31
common than at MIIs (29% vs. 11%). More than half of SIIs are able to access data “always” or “most of the time” (Figure 25) and three quarters find meeting reporting requirements only “moderately” or “slightly” challenging (Figure 26).
21%
29%38%
13%
Figure 24: SIIs Reporting Requirements
External reporting
Internally reporting
Internally reporting,External reporting
No reporting requirements
24%
33%10%
29%
5%
Figure 25: SIIs Ability to Access Data for Reporting and Assessment
Always
Most of the time
About half the time
Sometimes
Never

American Association of Collegiate Registrars and Admissions Officers
32
The top six selected measures of initiative effectiveness among SIIs are the same as those selected by MIIs, with the change in the number of completers coming out on top (Figure 27). The reported level of effectiveness is also similar between the two groups, with most reporting “moderately effective” (Figure 28).
0%
14%
57%
24%
5%
Extremely challenging Very challenging Moderately challenging Slightly challenging Not challenging at all
Figure 26: SIIs Level of Difficulty in Meeting Reporting Requirements
4%
4%
4%
16%
20%
24%
44%
44%
72%
Other
Based on feedback from an external entity.
The institution does not currently measure theeffectiveness of the initiative.
Based on feedback sought from staff.
Based on feedback sought from faculty.
Based on feedback sought from students.
Assessed on multiple values based on quantitative data.
Completion metrics are included in college KeyPerformance Indicators.
Measured by a change in the number of completers.
Figure 27: SIIs Measures of Effectiveness (all that apply)
American Association of Collegiate Registrars and Admissions Officers
33
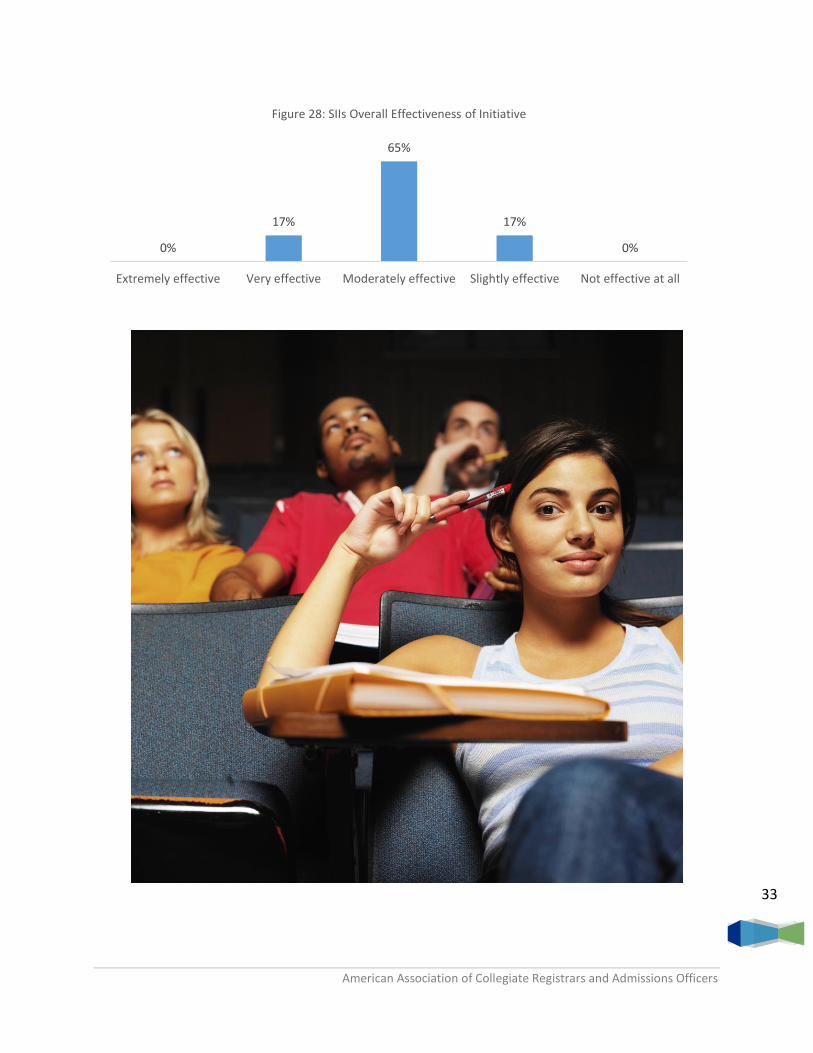
0%
17%
65%
17%
0%
Extremely effective Very effective Moderately effective Slightly effective Not effective at all
Figure 28: SIIs Overall Effectiveness of Initiative

American Association of Collegiate Registrars and Admissions Officers
34
Stories from the Field
Administrators from 11 colleges were interviewed for this project and asked to provide insights into the successes and challenges with their completion initiative(s). Common themes from the interviews include the need for access to data, the use of data to evaluate the initiative, changing institutional culture, changing practices, and increasing the level of faculty and staff engagement in student success.
______________________________________________________________________________
Identifying Intentions and Creating Guided Pathways | Pima Community College Interviewed: Dr. Karrie Mitchell, Assistant Vice Chancellor
Completion is one of three focus areas of Pima Community College’s (Pima) strategic enrollment plan. Pima participates in multiple completion efforts including national and multiple institutional initiatives. To know if a student has successfully achieved their completion goals, the institution had to focus on collecting better data to more accurately know the intentions of the more than 45,000 students studying on its six campuses in Southern Arizona, including one virtual campus for distance learners.
Pima redeveloped its admissions application to better capture students’ intentions, as many non-degree seeking students initially chose an area of study that did not align with their actual enrollment classification. To address this, Pima developed a responsive application to guide students through the admissions process, allowing the application to change based on students’ responses. The application enables Pima to capture more accurate data regarding student intent while it also allows them to know what type of support incoming students might need. Developing
the new application demonstrated Pima’s need for professionals with technical and IT expertise. The lack of staff with this background caused delays in launching some tools and initiatives.
Data on student intent impacts completion efforts at multiple levels. Dr. Mitchell states that awareness of completion rates in many certificate and degree programs has been minimal because the faculty does not always trust the enrollment data, particularly among non-selective admissions programs (e.g., automotive technology). This is due to completion rates being calculated using the programs of study that students initially select on their admissions applications, even if those students do not end up in the program they indicated. As part of its data integrity project, the administration worked with faculty from 23 programs, which house 48 of the college’s degrees and certificates, to identify who was actually in their program versus relying solely on admissions application data. This resulted in more confidence in the data among faculty and administrators and resulted in a model that will be used in other departments. In the coming year, faculty will assist other programs in identifying accurate program enrollment, which will enable programs to

American Association of Collegiate Registrars and Admissions Officers
35
be more involved in monitoring student success and completion.
Pima’s push to improve data on student intent aligns with its focus on guided pathways for both academic and career and technical education. In 2016, a new Vice President was hired to focus on developing pathways. Orientation is mandatory for new students and is the first point at which students receive academic advising. Beginning in fall 2017, Pima will shift away from general advising as part of its Assigned
Advising Initiative. The goal is to help streamline the flow of accurate information to students as well as place students in appropriate pathways. The shift to assigned advising and guided pathways has been mostly welcome by the advising staff. Dr. Mitchell said, “Our advising staff, they are really seeing the advantage in that, because sometimes they feel like they don’t have the guidance to be able to advise a student appropriately and it’s been very chaotic. So trying to get some of our systems and processes in place to support their role, they’re thrilled about that.”

American Association of Collegiate Registrars and Admissions Officers
36
Presidential and Faculty Leadership for Completion| Cuyahoga Community College Interviewed: Dr. Karen Miller, Provost and Executive Vice President
Cuyahoga Community College (Tri-C) is the oldest community college in Ohio, serving a diverse population of more than 55,000 credit and non-credit students. Tri-C has served more than 900,000 students on its four Cleveland-area campuses, two of which have majority-minority student enrollment. For the past four years, Tri-C has specifically focused on increasing completion rates, identifying Tri-C’s share of additional completions needed to achieve the goals of President Obama’s American Graduation Initiative. In 2013, Tri-C’s new president arrived to a 3.7% IPEDS graduation rate, a number that was little talked about or understood across the College. Under new leadership, Tri-C focused heavily on increasing their IPEDS graduation rate, which has risen in subsequent years to 5.2% in 2013-14, then to 8% in 2014-15 and to 13% in 2015-16. Tri-C is on track to achieve its 16.5% completion goal for 2016-2017 IPEDS cohort.
Tri-C’s success in increasing completion rates required the institution to change many practices and comes with caveats. Currently, Tri-C participates in several national completion initiatives including Achieving the Dream, Complete College America and AACC Pathways Project. The State of Ohio requires public institutions to create and implement a completion plan and shifted its funding model in recent years away from enrollment to tying all state funding to success metrics, including retention and completion. Specific efforts
include simultaneously tracking three IPEDS cohorts each year, with three to five professionals at each campus charged with tracking the cohorts. Tri-C developed a case management approach to student success and a communication plan that targeted students who comprise the IPEDS cohort (first-time, full-time, fall students), which directly impacts the student completion rates by which the institution is measured by state and federal agencies. Nearly 65% of Tri-C students are part-time and are not counted in the IPEDS rates.
According to Dr. Karen Miller, “The culture of the college is now one of success and completion. Everybody talks about it, everybody understands that they’re aligned to that work, our president talks about it at every opportunity that he can, everybody knows what IPEDS means.” Dr. Miller developed the institution’s first strategic enrollment plan in 2015, which aligns with the college’s strategic plan. The changing culture around completion resulted in strategic funding and staffing shifts. Without the prospect of an increase in state funding, college leaders reprioritized funding and restructured jobs of existing full-time employees in lieu of creating new positions.
The college has implemented a mandatory first-year experience program that requires a one-credit class, orientation and convocation. Tri-C is currently building a second semester requirement to further develop the academic pathways initiative by requiring students to take a one-credit “pathway” course followed by pairing students to faculty who will work with them to develop an academic plan by the end of

American Association of Collegiate Registrars and Admissions Officers
37
their second semester. This is followed by students being assigned a faculty advocate or mentor after the course ends in order to support and mentor students through the end of their academic journey. Faculty were involved from the beginning in creating the FYE and orientation program at Tri-C and faculty leadership created the model for the second semester pathway course and faculty advocate or mentorship role. Dr. Miller said faculty is “at the heart” of completion efforts across campus, including the creation of care teams that provide support and resources to students.
Scholarships are a tool used by Tri-C to encourage students to complete their degree within three years. Completion scholarships were created to help students who have exhausted financial aid or who need just a class or two to complete. The college has incentivized students to take 15 credits per semester and successfully complete 30 credits per year by refunding 50% of tuition for credits over 12 hours per semester. The institution is currently developing incentives for students to take summer classes if they are unable to take more than 12 credits in each fall and spring semester. Tri-C has also developed a summer internship program to keep students engaged over the summer, providing them a paid work experience either on campus or with a local business. The college also pays for tuition and required course books.
The state’s funding shift also led Tri-C to focus more on awarding certificates and degrees for students near completion. A robust reverse transfer process was created in collaboration with 4-year partner colleges
and universities, which resulted in an initial awarding of 200+ degrees (certificates are not awarded using reverse transfer) and an additional 10 to 20 degrees per year since implementing reverse transfer.

American Association of Collegiate Registrars and Admissions Officers
38
10,604 | Harper College
Interviewed: Maria Moten, Assistant Provost and Dean of Enrollment
Located in the northwest suburbs of Chicago, Harper College (Harper) is a comprehensive community college serving 35,000 students a year, 25,000 of whom are credit seeking. The college is in a district with 12 high schools in an area that has seen significant demographic shifts. The area is now home to more immigrants, primarily Latino, as well as families who qualify for free and reduced lunch programs. As the population changes, the institution has changed as well. Harper’s new president began on July 1, 2009, just weeks before President Obama announced the American Graduation Initiative (AGI), which called for an additional five million community college graduates by 2020. Harper’s new President quickly adopted the goals of AGI and through research, the college identified the need to graduate an additional 10,604 students by 2020 to do its part to fulfill AGI. As the institution developed a plan to achieve its ambitious goal,”10,604” became common parlance across campus.
Harper is involved in a number of initiatives at the federal, state and local level that focus on college-level readiness, curriculum alignment, dual credit and student success, most of which complement and support Harper’s Completion Commitment - an institutional commitment to help students complete their goal of graduating with a certificate, degree, or transferring to a 4-year institution. The culmination of these efforts is a redesign of the overall student experience with support services built in
from the time the student applies to their successful completion or transfer.
This new student flow is a process that moves students in a clear, personalized manner from application to completion. There are several major components of this redesign. First, the college changed the admissions application to delineate between degree-seeking, certificate-seeking and non-degree-seeking students. Harper now defines ‘momentum points’ in the new student enrollment flow through the creation of communication plans, interactions with staff and checklists for students to follow as they progress through the registration cycle. The college instituted a policy requiring all new degree-seeking students (full or part-time) to demonstrate ability in math, English and reading. Students who cannot demonstrate college-level readiness upon entry will be required to enroll in the appropriate developmental course(s) during their first semester at Harper and each semester subsequently until they fulfill the developmental education sequence.
Additionally, Harper created a Completion Concierge position, a staff member charged with ensuring all certificate- and degree-seeking students complete their program through tracking their progress and connecting students with support services as needed. New technologies were introduced to support students more holistically. The College is using predictive analytic software to track progress and connect students with resources. Fall 2017 will see the introduction of guided pathways at Harper. The college introduced a new advising model where new, degree- and certificate-seeking students are assigned to an academic advisor. A process

American Association of Collegiate Registrars and Admissions Officers
39
has been established to integrate students’ individual academic and educational plans and assessment results in a first semester schedule. Students are assigned an advisor based on their areas of interest as part of a case management model that sees students through graduation. Students are also given access to a personalized portal dashboard that will allow them to monitor their academic progress, financial details and review critical alerts and announcements.
The College also entered into a regional partnership with the high school districts referred to as the Northwest Educational Council for Student Success (NECSS). It is a secondary and postsecondary regional educational collaborative focused on student success via career planning and opportunities. The partnership has developed a three to five year plan outlining the development of future early college opportunities, both in the career programs as well as transferable programs. The goal is for every district high school student to graduate with at least 15 college credits. Overall enrollment has increased from 546 students in FY2010 to 4,057 students in FY2017.
Curriculum alignment in math, reading and English is an area of collaboration and success for Harper and local high schools. The goal of this initiative is to “increase the percentage of first-time, full-time freshman from Harper’s feeder high school districts who begin in credit bearing courses.” In fall 2012, the math instructors at the NECSS partner high schools and at Harper College agreed to offer Harper’s highest level developmental math course in high school as an option for a targeted population in addition to using the most fitting adaptive assessments of college readiness. The end goal is reducing enrollment in remedial
courses and improving college course readiness and completion outcomes.
There has been an upward trend in entering college-ready math courses (45.9%-74.0%) in the past seven years. An English alignment project has been established as well. This student success program is a joint initiative that aligns the content requirements in the core academic area of English. All education levels share a common understanding of the secondary Illinois Learning Standards, Common Core and postsecondary content and skill expectations.
Harper College reached its 10,604 goal in spring 2017 – three years before the 2020 goal. Spring commencement celebrated the milestone with the former Secretary of Education, Arne Duncan, who implemented and supported AGI during his tenure in the Obama Administration. The success has not come easily; it requires great effort from professionals across campus. Aware of the strain put on staff, Assistant Provost and Dean of Enrollment Maria Moten said, “Achieving collective impact requires the fundamental mindset shifts around who is involved, how we work together and how progress happens. Although it has been hard work and very labor intensive for all involved, there is a sense of commitment across the board to assure student success.”

American Association of Collegiate Registrars and Admissions Officers
40
The Messy Middle | Metropolitan Community College Interviewed: Dr. Kathrine Swanson, Vice Chancellor of Student Success and Engagement
Metropolitan Community College (MCC) is an institution in the midst of a culture shift regarding student completion. Located in Kansas City, Missouri, MCC serves nearly 23,000 students at five campuses throughout the district and is redesigning much of the student experience. MCC is engaged in multiple completion initiatives at the state and institution levels.
The Missouri Department of Higher Education has worked with Complete College America (CCA) for the past several years, including hosting the Missouri Completion Academy in 2013. MCC is currently involved with the state’s concurrent enrollment and guided pathways pilot programs as well as 15 to Finish and the Missouri Math Pathways Initiative. At the institutional level, MCC is developing meta-majors and guided pathways for students. Beginning in fall 2017, students will be assigned an advisor, shifting from the general advising model that the institution previously used. The goal, according to Dr. Kathrine Swanson, Vice Chancellor of Student Success and Engagement at MCC, is to transform the advising experience for students from one of simply registering students to helping students plan both academically and financially through “intentional, intrusive advising.” The institution is moving toward students developing an academic plan with an advisor in their first semester.
Implementing this new model of advising does not happen overnight. The advisers at MCC had to be retrained as the role is significantly changing. Additionally, students who had been served by the old model and were accustomed to it required the institution to provide both models until all students served by the institution are under the new model, resulting in a murky, and at times difficult, transition period. Referring to the impact on staff during the shift, Dr. Swanson said, “It feels like an extra heavy load when you’re in the messy middle of making change.”
MCC primarily utilizes two sets of metrics to plan and assess their progress. First, since some state funding is tied to performance, the institution focuses on those metrics outlined by the state. Second, the National Community College Benchmarking Project allows MCC to compare their progress with other community colleges in Missouri as well as peer group institutions across the country in areas such as developmental education, gateway courses, retention, completion and job placement rates.
MCC is in the middle of implementing many of these initiatives, so it is too early to say what impact they will have, but data have proven to be an area of challenge. As the institution relies more on data to make decisions and as completion initiatives have different data reporting requirements, the institution has identified the need to increase their institutional research (IR) capacity. The strain on the IR office has resulted in delays in internal reporting so that ever-changing external reporting requirements can be met. Data was a factor in MCC’s decision to not move forward with

American Association of Collegiate Registrars and Admissions Officers
41
one national completion initiative, as that initiative required extensive tracking and reporting that would have further strained the IR office’s capacity. The changing role of institutional data impacts the college and demonstrates how the messy middle impacts a variety of campus partners as MCC changes the way it operates to implement completion initiatives.

American Association of Collegiate Registrars and Admissions Officers
42
Aligning Accreditation and Completion | Northland Pioneer College Interviewed: Jeremy Raisor, Director of Enrollment Services
Northland Pioneer College (Northland) is a comprehensive community college located in a remote part of Arizona, with nine campuses across its 21,000 square mile service area – roughly the size of West Virginia. The area includes three Native American tribes including the Apache, Hopi and Navajo people. Of Northland’s approximately 9,000 students per year, 30% are Native American. Northland is engaged in one major institutional completion initiative called Proactive Advising for Student Success (PASS).
PASS was developed to increase retention and completion as part of the institution’s accreditation plan. Northland identified interventions that it believed would best serve its student population. Having many distance learners, using technology is an effective way to reach a broad section of students. In spring 2016, Northland adopted Hobson’s Starfish solution, which utilizes early alerts to notify the institution of students at risk of not successfully completing courses and connects students to campus resources and services like academic and financial advisors, among others. The rollout occurred in stages. The first stage involved a small group of faculty volunteers piloting the technology in their classes. The second stage began in spring 2017, when Starfish was made available to all faculty. By fall 2017, just over 70% of faculty were utilizing Starfish in their courses to some degree, with the level of faculty usage varying.
The institution has set a minimum expectation for faculty to use Starfish to complete a student progress survey once per semester in addition to the midterm grade report, providing a minimum of two touch points on student progress throughout the semester. Northland budgets funds for faculty ambassadors who encourage and train other faculty in their departments and across campus to use the early alert system. The goal is to continue the momentum among faculty using the system. Funds have also been set aside to train adjunct faculty to use the system in the future.
In addition to the electronic outreach to students, academic advisors also call students to discuss their progress. Director of Enrollment Services Raisor said, “When our academic advisors call to follow up, it just makes a big difference to students to know that there is someone there to watch out for them, who cares about their success and performance. When they receive the interaction, whether it’s by phone or email, it has a positive impact on their willingness to try harder and make a difference in their performance and participation.”
Completion played a significant role in Northland’s 10-year accreditation cycle with the Higher Learning Commission (HLC). HLC requires institutions to be on one of three pathways for accreditation and Northland is on the Open Pathway, which requires a Quality Initiative in years five to nine of the 10 ten-year cycle. The college reports its progress to HLC every six months. Northland also participates in HLC’s Persistence and Completion Academy,

American Association of Collegiate Registrars and Admissions Officers
43
which, according to HLC’s website, “provides participating institutions a structured, mentor-facilitated, 4-year program aimed at evaluating and improving student persistence and completion rates.” The academy includes a collaboration network that allows schools to check in on other participating schools’ progress. The network gives Northland and other participating two- and 4-year institutions the ability to reach out to colleges doing similar work on completion, facilitating collaboration and the sharing of best practices.
In addition to PASS, Northland has made completing a certificate or degree more affordable. The college established Finish Line scholarships for students who have stopped attending and need 12 credits or fewer to finish. A smaller change made was the elimination of the graduation fee. The fee was minimal but still a completion barrier, particularly for students in certificate programs. Eliminating the fee resulted in an increase of certificates awarded by the institution.

American Association of Collegiate Registrars and Admissions Officers
44
High-Tech, High-Touch | Bakersfield College Interviewed: Sue Vaughn, Director of Enrollment Services
Bakersfield College (Bakersfield) is 102 years old and one of the longest-operating community colleges in the United States. Located in an oil and agriculture industry-heavy region of south central California, Bakersfield is a Hispanic Serving Institution with more 30,000 students – 55% of whom are first generation. Bakersfield is engaged in multiple completion initiatives, including Achieving the Dream (ATD) and AACC Pathways Project at the national level as well as state and institutional efforts. Bakersfield’s ATD participation began in summer 2013 as a project of the college’s new president. The institution has developed ten pathways for its students and the president is part of a working group tasked with developing pathways for all of California’s 114 community colleges.
At the institutional level, Bakersfield is engaged in efforts to change its developmental education approach. Over the past five years, the institution has developed eight-week compressed courses in reading, writing and math. This allows students to complete developmental course requirements in one semester rather than one year, which means students can begin earning college credit sooner.
The college has also changed how they place students in courses by adopting multiple measures developed by the state. Rather than relying solely on students’ placement test scores, Bakersfield now considers a variety of metrics. The college
goes to high schools in its service region to give the placement exams and works with the schools to upload student information, including demographic information and GPA, which factors into their course placement. At the end of the exam, students learn what course level they will be placed into, though they do not know if their placement is based on their exam results or GPA. For example, a student with a 2.6 GPA or higher is automatically placed into a college-level composition course. The state is finalizing the California Common Assessment and plans to launch it in fall 2017. The assessment allows students to take only one placement test, allowing California colleges to access the centralized results through the chancellor’s office.
Created four years ago, Summer Bridge is a required daylong orientation designed for new students’ success. Students meet with academic and financial advisors as well as faculty. As a result, students receive a half unit of college credit. Summer Bridge is just the beginning of support for incoming students. In fall 2017, Bakersfield is launching Completion Coaching Communities for students in each of its ten Pathways. The communities are modeled after existing support communities for veterans and students with disabilities and consist of faculty members, a counselor, a financial aid advisor and an educational advisor. Completion Coaching teams use a “high-tech, high-touch” approach to student support. The use of technology in tandem with in-person support allows for more frequent touch points with students. Completion Coaches use email, text messages, phone calls and in-person advising to track students, identify their needs and connect them to resources early.

American Association of Collegiate Registrars and Admissions Officers
45
Bakersfield has attempted to use reverse transfer for the past four years, but it has been challenging. Bakersfield is one of three institutions in their community college district, which means that IT support is shared among the three institutions. This makes changing the way technology is used
a long and, at times, arduous process. In 2015, Bakersfield changed its admissions process to require students to opt out of being awarded a certificate or degree via reverse transfer rather than making them request it. IT challenges have also delayed a reverse transfer program with CSU-Bakersfield. Despite the prolonged process, the college is committed to making reverse transfer a reality.

American Association of Collegiate Registrars and Admissions Officers
46
Moving Toward an Integrated First Year Experience | Central Oregon Community College Interviewed: Alicia Moore, Dean of Student and Enrollment Services
Over the past several years, Central Oregon Community College (COCC) has implemented many initiatives to support, retain and graduate their students. COCC is one of 17 independent community colleges in Oregon, each reporting to its own governing board. COCC experienced significant growth in recent years, doubling its enrollment in the span of three years during the Great Recession. Currently, COCC serves about 10,000 students per year on its main campus and three branches.
COCC does not participate in a national- or state-level completion initiative, but has implemented institutional-level initiatives over the past several years with varying levels of success. COCC spent two years developing a reverse transfer process and after two years of work, the institution was only able to award six additional credentials. In an effort to focus the institution’s efforts in accordance with its strategic plan, the institution assessed its efforts and decided to train its energy on developing a comprehensive First Year Experience (FYE) program. To make data gathering and sharing easier, COCC agreed on five common indicators used across all student success initiatives, which include: course completion rate, first-to-second term retention rate, completion of 15 credits, completion of 30 credits and certificate or degree completion.
Fall 2016 was the start of the Oregon Promise, the state’s free community college tuition program. Students who want to be eligible for a second year of free tuition through the program are required by the
state to participate in an institutionally approved student success program. With only a few months to implement student success programs to meet the state’s requirement, COCC launched a mini-FYE program for Oregon Promise students, which includes required advising (already a requirement for students), attending new student orientation, successfully completing a college success course and receiving student success coaching with intrusive outreach and advising. The data from the first year of the program show Oregon Promise students who participated in these active engagement components “just knocked it out of the ballpark in terms of retention and course completion,” said Moore. Promise students who participated in all three components boasted a course completion rate of 96% compared to a 78% course completion rate among their peers, with first-to-second quarter retention rates being equally as impressive.
While advising, orientation and the college success course all existed prior to the development of the Oregon Promise FYE initiative, they were largely disconnected from each other. The success of Oregon Promise students furthered the institution’s commitment to developing an integrated FYE program for all first-year students. In October 2016, COCC received a five-year, $500,000 annual Title III grant to implement its FYE initiative. The funds enabled the institution to hire FYE consultants to guide the institution through the more challenging aspects of program implementation, including target population, scalability and organizational structure. Additionally, COCC is using the funds to redesign its developmental math curriculum, as successful math course completion continues to be an area in which many students struggle.

American Association of Collegiate Registrars and Admissions Officers
47
Leading the (Path) Way | Monroe Community College Interviewed: Dr. Andrea C. Wade, Provost and Vice President for Academic Services
Monroe Community College (MCC) is one of 30 community colleges in the SUNY system, serving approximately 30,000 students annually, split evenly among credit and non-credit students. MCC is located in Rochester, New York, surrounded by several other institutions of higher education. MCC is a community college leader in both the state and country. It is a member of the League for Innovation in the Community College and participates in both the AACC Pathways and Plus 50 programs.
MCC’s shift to guided pathways began with a developmental education faculty member who attended a conference and first learned about the model. She thought the model would be beneficial for the students with whom she worked, so she presented the idea to other faculty members and gained their support. Together, the faculty spent two years developing buy-in and creating an implementation plan for what such a model might look like at MCC. When the faculty presented the plan to MCC’s president, they indicated that they believed guided pathways have the potential to assist all students at the College, not just those in developmental education courses. Once the institution decided to make guided pathways the norm across its campuses, two large committees were formed to gather both feedback and support. MCC went full scale with guided pathways in fall 2016 with the launch of the Schools@MCC.
The committee work resulted in many changes to the way students experience MCC. A major goal of pathways is to simplify academic processes for students. Prior to the change, students worked with faculty in individual departments, but did not really have an academic “home.” The Schools model focuses on meta-majors so that students are connected to other students in similar programs and with similar career paths; each School has a dedicated staff and its own sub-brand with an associated color theme. Provost and Vice President for Academic Services Andrea C. Wade said, “It sounds like a small thing, but it’s what makes it all cohesive. Students and faculty members know the color of their school. It’s on our banners. It’s on the lanyards the students wear. When they log into Blackboard, their school color comes up. When they look at different programs, they’re keyed by school color so at a glance they can see the meta-majors.” The College is working to align academic advising with the pathways model and plans to begin helping students identify pathways while they are still in high school, requiring collaboration with local school districts.
Implementing guided pathways across the College required extensive staff and faculty time and effort. MCC has a full-time coordinator focused solely on guided pathways and most people at the institution now do pathways work in some form. There was some initial resistance to the changes made at MCC among faculty and staff, many of whom wondered if the pathways talk was just that – talk about a fad that would eventually go away. It took some time to build consensus and understanding that this was a cultural shift. Now, well into the institution’s transition to

American Association of Collegiate Registrars and Admissions Officers
48
pathways, most of the College community is fully engaged in the model. Administrators have tried to find the right balance between providing a clear, decisive vision for moving forward with the pathways model while making it an inclusive process that solicits feedback from the college community.
In addition to the work MCC has done for its students, the College is now assisting other colleges in New York State to create and implement their own pathways models. In spring 2017, MCC received a grant through the State University of New York to create and implement the Pathways model for ten SUNY schools. Speaking about the institution’s role, Dr. Wade said, “Being part of that group of community college movers and shakers gives us a chance to both share best practices and learn from others. Where we are strong, we can share and where we need help, we can learn from others.”

American Association of Collegiate Registrars and Admissions Officers
49
Building Relationships to Increase Completion | Columbus State Community College Interviewed: Jennifer Anderson, Director of Institutional Effectiveness
Columbus State Community College (CSCC) is a large, urban institution in Ohio’s capital. CSCC’s 25,000 students are diverse and representative of the region. CSCC is engaged in four national completion initiatives as well as initiatives at the state and institutional levels. A growing number of CSCC students are in high school, a result of the state’s College Credit Plus program, which aims to expand access to dual enrollment. CSCC had a number of smaller initiatives prior to joining Achieving the Dream (ATD) in 2012 and decided that the ATD framework would allow it to address persistent gaps in student success and completion. In fall 2015, CSCC became an ATD Leader College. To build on its work through ATD, CSCC joined the AACC Pathways Project.
CSCC has applied for and won several grants that have allowed them to pilot programs for completion. With Title III grant funding, CSCC developed an early alert system using Hobson’s Starfish solution. The staff member tasked with developing and implementing the early alert system took a grassroots approach to getting faculty involvement. They worked directly with departments and individual instructors to strategize the best ways to utilize the system, resulting in a successful scaling of the program in 2012. The institution has seen improvements in course success metrics since implementing the system. Now that the solution has been scaled for use across campus, the college is looking at
what aspects of the early alert system are most effective. Early results show that using kudos – flags that provide positive reinforcement to students – has a positive impact on student performance. Additionally, data analysis shows a positive correlation between the number of interactions a student has with support services and student success.
CSCC was the state leader in reverse transfer in 2016. Strong relationships with 4-year institutions are key to their success, with The Ohio State University, the largest recipient of CSCC transfer students, being an exemplar. Anderson said, “The key to success so far has been data sharing, the ability for OSU to pull a list of students who have previously attended Columbus State and have them run their data and come back to us and run our degree audit and see [who qualifies for a credential]. CSCC has strong relationships with other 4-year institutions and hopes to make the process automatic. This requires 4-year partners to ask students for permission to share data with CSCC and the plan is to build the permission into the CSCC application for admission.

American Association of Collegiate Registrars and Admissions Officers
50
Redesign to Align | Linn-Benton Community College Interviewed: Dr. Bruce Clemetsen, Vice President for Student Affairs
Located in west central Oregon, Linn-Benton Community College (Linn-Benton) serves 22,000 students a year, 6,800 full-time equivalent students. The college lies in a two-county district, which includes Oregon State University. The region’s agriculture, healthcare, metal and timber industries are major employers, providing high-skill, high-wage jobs that require postsecondary training, creating partnership opportunities for the college.
Linn-Benton is currently involved with the AACC Pathways Project and previously was part of Achieving the Dream (ATD). The Pathways Project aligns with state and institutional initiatives, of which Linn-Benton is a part, that aim to prepare students for college and career readiness for improved employment and transfer success.
Linn-Benton redesigned developmental math and writing courses in recent years as a result of their participation in ATD, which began in 2012. Developmental writing courses were changed to be co-requisite with college-level courses, which is now the standard. Currently, the college offers only one stand-alone developmental writing course. Students in the co-requisite writing class succeed at levels similar to those who place into college-level writing. The college has moved toward having all students take writing in their first semester; in any given quarter, more than 70% of first-term students are enrolled in writing. However,
resources are a barrier to fully implementing this as Linn-Benton is unable to offer enough sections.
Developmental math redesign has been underway for more than four years. In the 2017-18 academic year, Linn-Benton is changing from a four-course to a three-course developmental sequence. For the past four years, the college has offered a math boot camp to improve students’ math placement. Only one or two boot camp sections are offered each quarter so far, but more than 50% of the students involved have raised their math placement by one level and approximately 10% increase placement by two levels. Three years ago a non-calculus based math path was developed for transfer programs and contextualized math was embedded into some career technical programs. Additionally, this fall the college will offer ALEKS for self-paced remediation in math.
For two years as part of their shift to guided pathways, students have selected broad interest areas instead of majors as part of the redesigned admission and matriculation process. The new process includes guidance at orientation at which students can select a major. Linn-Benton finalized its meta-major framework in spring 2017, which requires further changes to the advising model. Advising has been an area of significant human and financial resource investment. All contract faculty have an advising load and the college’s Counseling Center has been renamed the Advising Center to better reflect its work. Now the Advising Center will primarily focus on undecided students and be connected to a meta-major advising team, with faculty advising students in their

American Association of Collegiate Registrars and Admissions Officers
51
respective programs. Each program’s faculty has developed a preferred first-term schedule that includes writing and math to make sure students begin their program taking meaningful general education and program courses.
The college has become more reliant on data as a result of their completion efforts. A challenge has been making sure the institution is collecting accurate, usable data while educating users of the data to be able to analyze and interpret it correctly.
During its 2016 accreditation process with the Northwest Commission on Colleges and Universities, the institution was critiqued for using too many data points – nearly 80 – for its three focus areas, one of which is completion. The institution has narrowed it to fewer than 20 data points moving forward. Data from pilot programs aimed at increasing completion are being used to determine whether to stop or scale programs. This practice has become more common as grants typically only provide seed money for new initiatives.

American Association of Collegiate Registrars and Admissions Officers
52
“Changing the Way We Work” | Tulsa Community College Interviewed: Dr. Jan Clayton, Senior Student Affairs Officer
Tulsa Community College (TCC) is the only community college in Tulsa, OK, serving more than 24,000 students from the region at its four campuses. TCC is active in multiple completion initiatives at the federal, state and institutional level. The Oklahoma State Regents for Higher Education, the coordinating board for all public colleges and universities, set an expectation of participation in Complete College America (CCA) as well as set state goals for increasing completion. For TCC, a former Achieve the Dream (ATD) school, there is alignment between the work that began under ATD and CCA. Additionally, TCC was selected in 2016 to be part of the AACC Pathways Project.
The State Regents recently required institutions to revamp their developmental education programs to offer alternative ways to assess student placement in developmental education courses and implement a co-requisite model for developmental education. Prior to the State Regents push, TCC faculty had implemented pilot programs in developmental courses, giving them a head start on the work. In fall 2017, TCC will offer co-requisite sections in math, reading, writing and English.
TCC’s student affairs and academic affairs divisions have undergone restructuring in recent years to be able to achieve its completion goals. Each of the colleges’ 200+ transfer and CTE programs are now housed in one of seven schools. A Vice President for Workforce Development position was created as well as a centralized student assessment office headed by an Assistant Director of Student Assessment. Degree
maps for each academic program were created by the faculty, a result of TCC’s work with Pathways. Career Services, housed in student affairs, is now centralized in one location and works closely with both academic and student affairs to ensure students are workforce or transfer ready.
The college has profoundly changed the way students receive advising and has increased the number of advisors. Recently TCC had a 1100:1 student to advisor ratio, but now it is 520:1, with a goal of 350:1, which is recommended by NACADA standards for an institution like TCC. Additionally, advisors are now assigned to academic schools, a shift from generalist advising. The college is developing a process for students who are undecided on an area of study that will assess their career interests when they apply in order to identify which school most closely aligns with their interests. The goal is to direct students into a school before they arrive on campus, even if they are undecided. Until that process is finalized, career advisors are supporting the academic advising process by reaching out to undecided students, inviting them to appointments to help place them in a school and begin conversations about their academic and career goals.
These efforts require a great deal of time and energy on the part of staff, faculty and administrators over several years and beyond the scope of formal positions. Clayton said: “We look at it as changing the way we work. So if we look at this as one more set of things to do – this additional completion work on top of the rest of the work – then we’re already defeated because that’s impossible to do. What we’ve had to do is look at it as redesigning the way we work. And it’s prioritizing the work to say that we will put our time and energy into the work that will best support student success.”

American Association of Collegiate Registrars and Admissions Officers
53
Student Experience
We partnered with Qualtrics5 to survey more than 1,000 currently enrolled community college students on their perceptions of their college’s activities and policies designed to help students complete their degree. Qualtrics partners with incentives-based panel survey companies. We attempted to confirm that respondents were in fact currently enrolled at a community colleges through the use of attention filters at the beginning of the survey aimed at identifying the target population. The open-ended response data was also reviewed for nonsensical inputs and those responses were removed in their entirety from the data set. We targeted 1,000 valid responses and finished with 1,087. The data was geotagged, and Figure 29 represents the respondents’ IP addresses and is mapped with the institutional participants. Students were asked to submit the name of their community college in a text box. From the information provided by students, we identified that 62 of the 97 institutions who participated in the study also had one or more students respond to the survey. Although about 150 students are from participating institutions, this is too few students per institution to draw any conclusions about a particular institution’s completion initiative efforts and that comparison was not part of this project.
About half of the participants attend college full time, another third reported attending part time and the remainder was a mix of full and part time. Although “I am not seeking a degree or
5 qualtrics.com
Figure 29: Student and Institution IP Address Locations*
* Location identified by IP address of respondents

American Association of Collegiate Registrars and Admissions Officers
54
certificate or to transfer to another institution” was proffered as an answer choice, none selected this option. The largest percentage selected “I intend to complete an associate’s degree and then transfer to a 4-year institution” (Figure 30). In addition, 63% of respondents indicated they are either “extremely,” “very” or “moderately” familiar with the national goal to increase the number of adults who have a college degree; 17% of respondents indicated they were “slightly” familiar; and 21% stated they were “not familiar at all.”
Universally, students were positive about their institution and the efforts made by the institution to help students reach their educational goals. None identified an institutional barrier to success. This result seems remarkable from a sample of more than 1,000 students and the results do not appear to be due to survey design bias. Most (71%) believe their institution has recently increased efforts to help students complete their educational goals.
Participants were asked to rate how much they agree with the following statement, “My college has programs and/or services in place that help me reach my educational goal.” Interestingly, even though the following answer choices were offered—“neither agree nor disagree,” “somewhat disagree,” “disagree,” and “strongly disagree,”—none selected any of these response choices. Fifty percent (50%) selected the “strongly agree” response to the statement (Figure 31).
18%
45%
23%
10%4%
Figure 30: Primary Reason for Attending Community-college
I intend to complete a certificate program.
I intend to complete an associate's degreeand then transfer to a 4-year institution.
I intend to complete an associate degree.
I intend to complete some coursework andthen transfer to a 4-year institution.
I currently attend a 4-year institution and alsotake some courses at a community college.

American Association of Collegiate Registrars and Admissions Officers
55
The above question was followed by an open-ended text response, inquiring how the institution is providing help to the student. Responses were coded using standard qualitative analysis techniques. Twelve institutional help themes emerged from this process with the most prevalent being “advisor/guidance counselor,” “getting me on the right path to succeed/graduate,” “helpful/assisting professors” and “preparing me for my future/ a career” (Figure 32). Since no students selected anything less than “somewhat agree” on the question regarding institutional barriers to success, no open-ended response was triggered for any participants.
50%
38%
13%
0% 0% 0% 0%
Strongly agree Agree Somewhatagree
Neither agreenor disagree
Somewhatdisagree
Disagree Stronglydisagree
Figure 31: Level of Agreement with Statement that the College has Programs/Services in Place to Help Reach Educational Goal
1%
2%
4%
5%
6%
7%
9%
10%
13%
13%
14%
15%
15%
21%
Smaller classes / more intimate and personalized settings
Improving my life / Becoming a better person
Financial Aid / Scholarships
Getting a degree
Flexibility of Schedule
Other
Educating me / teaching me new information
Tutoring
Offering the courses I need
Student Services and assistance programs
Preparing me for my future / a career
Helpful / assisting professors
Getting me on the right path to succeed / graduate
Advisor / Guidance Counselor
Figure 32: Student Reported Observations about how Institutions are helping Students Reach Their Educational Goal(all that apply)

American Association of Collegiate Registrars and Admissions Officers
56
Students were asked which of the proffered college services they took advantage of and which of those were mandatory versus voluntary. The services listed were identical across surveys. Completion of the FAFSA, orientation, course placement and academic advising were all selected by more than 50 percent of respondents (Figure 33). Although guided pathways and educational plans of study are listed as means to support college completion among the institutional participants, just 33% of students reported completing an educational plan of study and only 24% reported using a guided pathway.
What institutions report as mandatory activities for students (Figure 9 and Figure 25) differs slightly in the frequency of selected activity than what students report (Figure 34). Although we have data from students at 62 of the participating institutions, this is not enough data to draw any conclusions about the differences between the students’ perceptions of mandatory services and what the colleges report as mandatory services. Further inquiry completed at the respective institutions could determine if there is a mismatch between what the institutions believe they are communicating as mandatory and what the students believe is mandatory.
4%
11%
12%
12%
21%
22%
24%
26%
29%
33%
52%
58%
60%
64%
None of the above.
Part of a student cohort (a group of students who move…
Assigned to a student success coach
Block scheduling (a group of classes designed to be registered…
Participate in a First Year Experience
Meet with faculty outside of the class experience
Use a set of Guided Pathways to tell you what courses to take
Tutoring or other supplemental instruction
Student success or study skills class or program
Complete and educational plan of study
Academic advising
Course placement testing/assessment
Orientation
Complete the FAFSA (Free Application for Federal Student Aid)
Figure 33: Self-reported Use of Student Success Related Services (all that apply)

American Association of Collegiate Registrars and Admissions Officers
57
Closing
According to National Student Clearinghouse data the Fall 2010 cohort, 6-year college completion rates increased over the previous year and the trend is expected to continue (Shapiro, 2016). It is clear from the results of this multi-perspective examination of college completion initiatives at U.S. community colleges that efforts in this direction have, for most, improved completion rates and that interest from colleges to further improve completion rates continues to be a focus. It is also clear that institutions face similar challenges around access to data, institutional buy-in and change management. Most surprising is the universal satisfaction
91%
85%
79%
73%
72%
72%
69%
66%
65%
59%
48%
43%
31%
9%
15%
21%
27%
28%
28%
31%
34%
35%
41%
52%
57%
69%
0% 10% 20% 30% 40% 50% 60% 70% 80% 90% 100%
Tutoring or other supplemental instruction
Meet with faculty outside of the class experience
Student success coach
Academic advising
Guided pathways
Student success skills or study skills course/program
Complete the FAFSA
Complete a plan of study
Part of a student cohort
First Year Experience
Block scheduling
Orientation
Course placement testing/assessment
Figure 34: Mandatory or Voluntary Participation in Student Success Services
I was required to participate I participated voluntarily

American Association of Collegiate Registrars and Admissions Officers
58
with the efforts of community colleges to help students reach their educational goal among the students surveyed.
A December 2016 Inside Higher Education article summarized the thoughts of 20 experts on completion and the value of college under the new U.S. Administration (Fain, 2016). Among those interviewed was Eloy Ortiz Oakley, chancellor of California’s community college system, who said: “The job of the community college is going to be more important in the new administration … The administration is going to challenge us to be better connected to the economy and work force needs. But that’s something we’re doing already.” The Inside Higher Education author noted that “Whether or not the college completion momentum continues could depend on how ‘college’ is defined. One-year certificates earned at a community college or for-profit institution count as ‘college’ too.” Whether or not interest in degree completion may not be the focus of the current U.S. Administration, David Baime, senior vice president for government relations and policy analysis for AACC stated in this article that “[t]he completion agenda is deeply ingrained in the operating systems of our institutions.”
Even with a waning in the apparent interest in the completion agenda from the current Administration, non-government organization sponsored national level initiatives continue to thrive. In addition, interest in college completion is increasing at the state level particularly when tied to performance-based funding. The Education Commission of the States recently released its policy snapshot on statewide longitudinal data systems (SLDS) and relevant 2016 and 2017 legislation (Perez, 2017). Perez found that “37 states plus the District of Columbia (D.C.) connect data between at least two educational systems and only 6 states plus D.C. have a full P20W system.” Several use their systems to measure student success and have introduced legislation based on the data. He further found that in 2017, 16 states considered SLDS legislation and six have been enacted in Nevada, Virginia, Maryland and South Carolina.
From the information garnered from this project, we can comfortably conclude that U.S. community colleges will continue to embrace change and seek creative, scalable, repeatable and measurable means to increase college completion rates.

American Association of Collegiate Registrars and Admissions Officers
59
References
AACC (2010). Democracy’s colleges call to action. Retrieved from http://www.aacc.nche.edu/About/completionchallenge/Pages/default.aspx
AACC (2012a). The Voluntary Framework of Accountability: Developing measures of community college effectiveness and outcomes.
AACC (2012b). Reclaiming the American dream: A report from the 21st century commission on the future of community colleges. Washington, DC. Author. Retrieved from www.aacc.nche.org/21st Century Report
AACC (2016). Community college legislative priorities, January 2016. Washington, DC. Retrieved from http://www.aacc.nche.edu/Advocacy/Documents/AACC_Legislative_Priorities_ Jan2016Final.pdf
Achieving the Dream (2017). About us. Website. Retrieved from http://achievingthedream.org/about-us
Anderson, L. (2015). Reverse transfer: the path less traveled. ECS Education Trends, May 2015. Retrieved from http://www.ecs.org/clearinghouse/01/18/77/11877.pdf
APLU (n.d). Voluntary System of Accountability. Retrieved from http://www.aplu.org/projects-and-initiatives/accountability-and-transparency/voluntary-system-of-accountability/index.html
Bailey, Hughes, & Jaggars (2012). Hartfort Courant Retrieved from http://articles.courant.com/2012-05-18/news/hc-op-bailey-college-remedial-education-bill-too-r-20120518_1_remedial-classes-community-college-research-center-remedial-education
Bers, T., & Schuetz, P. (2014). Nearbies: A missing piece of the college completion conundrum. Community College Review, 42(3), 167–183.
Carnegie Math Pathways. (2017) Website. Accessed 9-1-2017.
Complete College America (2014). About section. Website. Accessed 3-1-17.
Credit When It’s Due (n.d). Retrieved from https://www.luminafoundation.org/credit-when-its-due
Engle, J., & Lynch, M. (2009). Charting a Necessary Path: The Baseline Report of Public Higher Education Systems in the Access to Success Initiative. Education Trust. Retrieved from http://eric.ed.gov/?id=ED507873
Fain, P. (2012). Overkill on remediation? Inside Higher Education. Retrieved from https://www.insidehighered.com/news/2012/06/19/complete-college-america-declares-war-remediation
Fain, P. (2016). Completion and the Value of College. Inside Higher Education. Retrieved from https://www.insidehighered.com/news/2016/12/08/experts-talk-about-college-completion-push-and-what-comes-next
Hannenmann, L. & Hazenbush, M. (2014) On the Move: Supporting Student Transfer. Boston, MA: New England Board of Higher Education.
Harbour, C. P., & Smith, D. A. (2016). The completion agenda, community colleges, and civic capacity. Community College Journal of Research and Practice, 40(2), 100–112. Retrieved from https://doi.org/10.1080/10668926.2014.996923
Hauptman, A. M. (2012). Increasing higher education attainment in the United States: Challenges and opportunities. In A. P. Kelly & M. Schneider (Eds.) Getting to graduation: The completion agenda in higher education. Baltimore: Johns Hopkins University Press.
Horn, L., & Skomsvold, P. (2011). Web tables: Community college student outcomes: 1994–2009 (NCES 2012-253). Retrieved from U.S. Department of Education, National Center for Education Statistics website: https://nces.ed.gov/pubsearch/pubsinfo.asp?pubid=2012253

American Association of Collegiate Registrars and Admissions Officers
60
Itzkowitz, M. (2017). New data counts more students, but still doesn’t count them all. Third Way. Retrieved from https://medium.com/third-way/new-data-counts-more-students-but-still-doesnt-count-them-all-ba928ec90d1b
Jenkins, D., & Cho, S. W. (2013). Get with the program … and finish it: Building guided pathways to accelerate student completion. New Directions for Community Colleges, 2013(164), 27–35. Retrieved from https://doi.org/10.1002/cc.20078
Jenkins, D., & Fink, J. (2016). Tracking transfer: New measures of institutional and state effectiveness in helping
community college students attain bachelor’s degrees. Community College Research Center, Teachers College, Columbia University. Retrieved from https://eric.ed.gov/?id=ED563499
Jones, G. (2017). Expanding student success rates to reflect today’s college students, NCES Blog October 12, 2017. Retrieved from U.S. Department of Education, National Center for Education Statistics website the https://nces.ed.gov/blogs/nces/post/expanding-student-success-rates-to-reflect-today-s-college-students
Juszkiewicz, J. (2016). Trends in community college enrollment and completion data, 2016. Washington, DC: American Association of Community Colleges.
Kelly, A & Schneider, M. (2012). Getting to graduation: The completion agenda in higher Education
League for Innovation in the Community College (2017). Retrieved from https://www.league.org/about
League for Innovation in the Community College (2007). Career pathways as a systematic framework: rethinking education for student success in college and careers. Phoenix, AZ: League for Innovation in the Community College.
Ma, J., & Baum, S. (2016). Trends in community colleges: Enrollment, prices, student debt, and completion. College Board Research Brief. Retrieved from http://trends.collegeboard.org/sites/default/files/trends-in-community-colleges-research-brief.pdf
McClenney, B. N. (2013). Leadership Matters: Addressing the Student Success and Completion Agenda: Leadership Matters: Addressing the Student Success and Completion Agenda. New Directions for Community Colleges, 2013(164), 7–16. Retrieved from https://doi.org/10.1002/cc.20076
McPhail, C. J. (2011). The Completion Agenda: A Call to Action. Summary Report from the November 10-11, 2010, Meeting of the American Association of Community Colleges Commissions and Board of Directors. American Association of Community Colleges (NJ1). Retrieved from http://eric.ed.gov/?id=ED532208
National Student Clearinghouse (2017). Reverse transfer project. Retrieved from http://reversetransfer.org
NCHEMS (2017). Increasing college attainment in the United States: Variations in returns to states and their residents. Retrieved from http://www.nchems.org/projects/increasing-college-attainment-in-the-united-states/
Obama, B. (2009a). Remarks of President Barack Obama, as prepared for delivery Address to Joint Session of Congress. Retrieved from https://obamawhitehouse.archives.gov/the-press-office/remarks-president-barack-obama-address-joint-session-congress
Obama, B. (2009b). Remarks of President Barack Obama. Retrieved from https://obamawhitehouse.archives.gov/the-press-office/remarks-president-american-graduation-initiative-warren-mi
OECD (2017). Population with tertiary education (indicator). Retrieved from https://doi: 10.1787/0b8f90e9-en (Accessed on 13 October 2017)
Phillips, B. C., & Horowitz, J. E. (2013). Maximizing data use: A focus on the completion agenda. New Directions for Community Colleges, 2013(164), 17–25. Retrieved from https://doi.org/10.1002/cc.20077

American Association of Collegiate Registrars and Admissions Officers
61
Rhoades, G. (2012). The incomplete completion agenda: Implications for academe and the academy. Liberal Education, Winter 2012, (98)1
Russell, A. (n.d.). American Association of State Colleges and Universities A Higher Education Policy Brief. October 2011. Retrieved from http://www.isac.org/dotAsset/dbf0788e-4c9b-4ccd-8649-65361d6ff059.pdf
Shapiro, D., Dundar, A., Huie, F., Wakhungu, P., Yuan, X., Nathan, A & Hwang, Y., A. (2017). Completing college: A national view of student attainment rates by race and ethnicity – fall 2010 cohort (Signature Report No. 12b). Herndon, VA: National Student Clearinghouse Research Center.
UCAN (2013) http://www.ucan-network.org/about-u-can
Valdez, S., & Marshall, D. (2013). Working across the segments: High schools and the college completion agenda. New Directions for Community Colleges, 2013(164), 47–55. Retrieved from https://doi.org/10.1002/cc.20080
Venezia, A., & Hughes, K. L. (2013). Acceleration strategies in the new developmental education landscape. New Directions for Community Colleges, 2013(164), 37–45. Retrieved from https://doi.org/10.1002/cc.20079
Walters, G. (2012). It's not so easy: The completion agenda and the states. Liberal Education, Winter 2012, (98)1
Zachry Rutschow, E., Richburg-Hayes, L., Brock, T., Orr, G. E., Cerna, O., & Cullinan, D. (2011). Turning the tide: Five years of Achieving the Dream in community colleges. Retrieved from https://papers.ssrn.com/sol3/papers.cfm?abstract_id=2031257

American Association of Collegiate Registrars and Admissions Officers
62
Appendix A: List of active National College Completion Initiatives
AACC College Completion Challenge
AACC Community-college/Career Collaboration (another C4)
AACC Pathways Project
AACC Plus 50 (Encore) Initiative
Achieving the Dream
Adult College completion Network
Alternative Credit Project
Community-college College completion Corps (C4)
Complete College America
Completion by Design
Credit When It’s Due from the Lumina Foundation, Kresge Foundation, Helios Education Foundation, USA Funds and Bill & Melinda Gates Foundation
Ensuring America's Future by Increasing Latino College completion (EAF)
Frontier Set grant by the Bill & Melinda Gates Foundation
iPASS Grant Challenge EDUCAUSE
Jobs for the Future
Persistent and Completion Academy Experience by the Higher Learning Commission
Talent Pipeline Management U.S. Chamber of Commerce Foundation
The League for Innovation Pathways Project
The New Mathways Project (NMP)

American Association of Collegiate Registrars and Admissions Officers
63
Appendix B: List of State Level Completion Initiatives Provided by Respondents
15 to Finish
66% Completion by 2030 - Governor's Challenge
Accelerated Developmental Education -Math; Integrated Reading/Writing;
California Pathways Project
Career pathways
College Career Readiness for High School Graduates
Common Numbering, Programs to 60 Credits
Commonwealth Commitment and Reverse Transfer
Complete College for our state - it is set as a state level initiative also.
Complete College Georgia
Complete College Ohio
Complete College Wyoming
Degrees within Reach (Colorado)
Drive to 55
Drive to 55, TN Promise, TN Reconnect, Co-requisite remediation, Academic Foci, Pathways
Gateway courses...math and English
Guided Pathways
ICAPS model expansion which provides support course along with in class assistance for students
Illinois' Pathways to Results
Maryland's College and Career Readiness and College completion Act of 2013
Math alignment and Dual Credit
Math Pathways Taskforce
Meta-majors, common course numbering
Missouri - Concurrent Enrollment Pilot; Guided Pathways to Success Pilot; 15 to Finish; Missouri Math Pathways
Ohio Learning Network
One step away
Oregon Promise

American Association of Collegiate Registrars and Admissions Officers
64
Oregon Promise, Oregon Student Success Center through Oregon Community-colleges Association
Pathways
Redesign of developmental coursework into a co-requisite model
Reverse Transfer; Credit when It's Due
SSLI
State completion agenda
State Initiative Completion Plan, PLA Credit Pilot, OACC AmeriCorps Completion Coach Program, Ohio Math Initiative, Co-Req Model, Statewide Guarantee Credit Transfer Initiatives, OACC Ad Astra, SSLI, AmeriCorps Summer Vista Program
State perspective of "completion by design" with Peer Coaching and mapping of degree programs
Texas 60x30TX
Texas 60x30TX
Texas 60x30TX
Texas Completion by Design
Texas Pathways to Progress
The Virginia Community-college system has drawn on all of the national initiatives I checked in the previous question to help all of the individual colleges create guided pathways. We formed a Student Success Leadership Institute to support individual colleges' efforts. We're also launching an IPASS project using EAB's navigate, which was piloted by three colleges in the system (including mine) prior to system-wide adoption.
Transfer Program Alignment