Embed Size (px)
Citation preview

The State Bar of California
COST ALLOCATION PLAN REVIEW
January 2016
Attachment A

The State Bar of California
COST ALLOCATION PLAN REVIEW
TABLE OF CONTENTS
Report Purpose 1
Summary of Findings and Recommendations 1
Cost Allocation Plan Concepts and Principles 4
Purpose of Cost Allocation Plans 4
Plan Goal: Reasonable Allocation of Costs 5
Determining Direct and Indirect Costs 5
Allocating Indirect Costs 5
One-Step versus Sequential Allocation of Indirect Costs 7
Cost Allocation Plan Uses 7
Plan Preparation 8
Summary 8
Findings and Recommendations 8
Technically Sound Methodology 8
Not All Indirect Costs Allocated 10
Limited Allocation Bases 11
Allocation Level: Too Many Cost Centers 13
One-Step versus Sequential Allocation Process 14
Timing: Monthly Preparation and Posting Unusual 15
Technical Versus Policy Document 16
Capital Project Costs and Debt Service 17
Plan Approval 18
Cost Recovery Policy 18
Fiscal Impact on Indirect Cost Allocations 19
“Fairness” of Current Allocations and Proposed Changes 19
Conclusion 21
APPENDIX
A. 2001 Deloitte & Touche Report
B. Examples of Cost Allocation Plan as Policy Document

- 1 -
January 25, 2016
The State Bar of California COST ALLOCATION PLAN REVIEW
REPORT PURPOSE
The purpose of this report is to review the State Bar’s current Cost Allocation Plan,
which includes the following tasks:
Assessing the reasonableness of the existing cost allocation methodology in spreading
“overhead” administrative costs among the programs that benefit from such costs.
Analyzing cost and allocation base data sources.
Reviewing the current model for allocation methodology.
Recommending changes as appropriate.
As reflected above, the workscope for this review includes an assessment of the current
methodology and recommended changes, if any. It does not include actually making
revisions to the Cost Allocation Plan or otherwise implementing any of the recommended
changes: that would be a separate step following decisions to adopt some or all of the
report’s recommendations.
SUMMARY OF FINDINGS AND RECOMMENDATIONS
The Short Story. As detailed later in this report, there are ten key findings and
recommendations:
Technically Sound Methodology. The methodology for preparing the State Bar
indirect cost allocations is technically sound and documented via an extensive Excel
spreadsheet. It is based on a model initially developed in 1999 by Deloitte & Touche
(now Deloitte, currently one of the “Big Four” accounting firms) and updated in
2001. The State Bar has made some changes to the model since then. As discussed
below, in some cases those changes should remain in place; and in others, the State
Bar should go “back to the future” and reinstate the 2001 approach.
124 Cerro Romauldo Avenue San Luis Obispo, CA 93405 805.544.5838 Cell: 805.459.6326 [email protected]
www.bstatler.com
William C. Statler
Fiscal Policy Financial Planning Analysis Training Organizational Review
. . . . . . . . .
COST ALLOCATION PLAN REVIEW
- 2 -
Not All Indirect Costs Allocated. The current model does not allocate all indirect
costs. While this is consistent with the 2001 methodology, all indirect costs should be
allocated in achieving the goal of cost allocation plans of identifying the total cost of
delivering services. However, as discussed in a separate finding regarding cost
recovery policies, after determining total program costs, the State Bar has the
discretionary option (subject to statutory limitations) of not requiring full cost
recovery.
Limited Allocation Bases. As described later in this report, the State Bar currently
uses a limited number of allocation bases. While this could be expanded, it would
require additional work in developing the costs and data bases, for which there may
not be commensurate value in significantly improving indirect cost allocations.
Accordingly, no additional allocation bases are recommended.
Allocation Level: Too Many Cost Centers. The model allocates indirect cost to 118
cost centers. This is a change from the 2001 update, which recommended allocating
indirect costs to nineteen major programs (primarily based on departments/funds). In
discussions with State Bar staff, there are no readily identifiable benefits to allocating
indirect costs to such a detailed level. On the other hand, doing so makes the results
more complicated and less intuitively understandable. Accordingly, the State Bar
should return to allocating indirect costs to major programs areas based on
departments/funds.
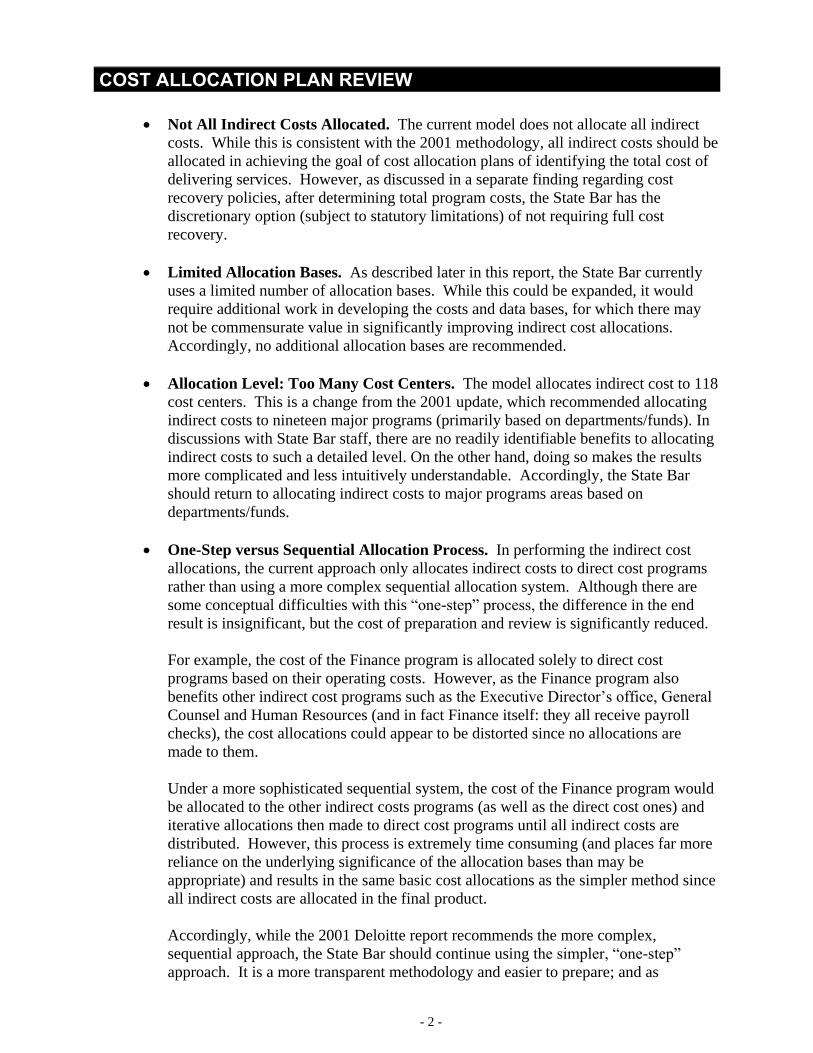
One-Step versus Sequential Allocation Process. In performing the indirect cost
allocations, the current approach only allocates indirect costs to direct cost programs
rather than using a more complex sequential allocation system. Although there are
some conceptual difficulties with this “one-step” process, the difference in the end
result is insignificant, but the cost of preparation and review is significantly reduced.
For example, the cost of the Finance program is allocated solely to direct cost
programs based on their operating costs. However, as the Finance program also
benefits other indirect cost programs such as the Executive Director’s office, General
Counsel and Human Resources (and in fact Finance itself: they all receive payroll
checks), the cost allocations could appear to be distorted since no allocations are
made to them.
Under a more sophisticated sequential system, the cost of the Finance program would
be allocated to the other indirect costs programs (as well as the direct cost ones) and
iterative allocations then made to direct cost programs until all indirect costs are
distributed. However, this process is extremely time consuming (and places far more
reliance on the underlying significance of the allocation bases than may be
appropriate) and results in the same basic cost allocations as the simpler method since
all indirect costs are allocated in the final product.
Accordingly, while the 2001 Deloitte report recommends the more complex,
sequential approach, the State Bar should continue using the simpler, “one-step”
approach. It is a more transparent methodology and easier to prepare; and as

COST ALLOCATION PLAN REVIEW
- 3 -
discussed below, the cost allocation plan’s goal is a reasonable allocation of costs, not
a “perfect” one.
Timing: Monthly Preparation and Posting Unusual. The State Bar prepares and
posts indirect allocations monthly. This is unusual. Most public agencies prepare an
annual cost allocation plan as a freestanding policy document based on the adopted
budget. As discussed later in this report, this serves three purposes: treats the
allocation of resources as a policy matter; provides transparency in how allocations
are determined; and improves predictability. Where significant variances between
budget and actual are likely, this can be accounted for via annual true-ups that are
reflected in the following year’s cost allocation plan.
Annual preparation and true-up is the recommended approach in the 2001 Deloitte
report. The State Bar should return to annual preparation of the Cost Allocation Plan;
and it should be published as a separate policy document that describes its purpose,
methodology, key assumptions, any significant changes in methodology from the
prior year and results at a summary and detailed level.
Technical Versus Policy Document. The current Cost Allocation Plan is a large
spreadsheet that requires 11x17 paper to print-out (in very small print); has no
narrative regarding assumptions; and has deeply imbedded formulas that make
following the allocations difficult. While this works as a technical document that
only has to be understandable to the staff preparers, it does not work well as a policy
document.
The Cost Allocation Plan makes significant resource allocations whose purpose and
methodology should be clear and understandable to governing bodies, senior
managers, program managers and others affected by the allocations (“stakeholders”)
as well as Finance staff. Accordingly, as noted above, the State Bar should prepare
the Cost Allocation Plan as a separate policy document.
Capital Projects and Debt Service. As discussed below, cost allocation plans
typically focus on direct and indirect operating costs; and exclude from the direct cost
base capital project and debt service expenditures. Accordingly, decisions regarding
funding capital projects and indirect cost debt service obligations should be made on
a case-by-case basis depending on circumstances at the time when capital projects
and debt service are approved. This has generally been the State Bar’s past practice
and no changes are recommended.
Plan Approval. As a “technical document” that closely follows the 2001 Deloitte
report recommendations (albeit with modifications since then), the Cost Allocation
Plan is currently approved and implemented by Finance staff. However, assuming it
is prepared annually as a freestanding policy document, it should be formally
approved by the Board of Trustees.

COST ALLOCATION PLAN REVIEW
- 4 -
Cost Recovery Policy. While the Cost Allocation Plan identifies total program costs,
setting rates and fees at levels that fully recover these costs is a policy decision. Full
cost recovery where possible may be implicit. However, in accordance with “best
practices” (and subject to any statutory limitations), the Board should formally adopt
a cost recovery policy that sets forth programs where it expects full cost recovery; and
for any programs where full cost recovery is not expected, the reason for this and the
cost recovery goal.
COST ALLOCATION PLAN CONCEPTS AND PRINCIPLES
The following provides background information on cost allocation plan concepts and
principles along with an overview of the State Bar’s practices regarding them.
Purpose of Cost Allocation Plans
The purpose of cost allocation plans is to identify the total costs of providing specific
services. Why is a separate cost accounting analysis required to do this? Because in
almost all organizations—whether in the private or the public sector—the cost of
producing goods or delivering services can be classified into two basic categories: direct
and indirect costs. “Direct costs” by their nature are usually easy to identify and relate to
a specific service. However, this is not the case for “indirect costs.” As such, if we want
to know the “total cost” of providing a specific service, then we need to develop an
approach—a plan—for reasonably allocating indirect costs to direct cost programs.
What Are Direct and Indirect Costs? Direct costs are those that can be specifically
identified with a particular cost objective. For the State Bar, this includes services such
as Admissions, Client Security, Education, Lawyer Assistance and Legal Services.
On the other hand, indirect costs are not readily identifiable with a specific direct
operating program, but rather, are incurred for a joint purpose that benefits more than one
cost objective. Common examples of indirect costs include finance, human resources,
information technology, insurance and building maintenance. Although indirect costs are
generally not readily identifiable with direct cost programs, their cost should be included
if we want to know the total cost of delivering specific services.
Budgeting and Accounting for Indirect Costs. Theoretically, all indirect costs could be
directly charged to specific cost objectives; however, practical difficulties generally
preclude such an approach for organizational and accounting reasons. As such, almost all
organizations, whether in the private or public sector, separately budget and account for
direct and indirect costs at some level depending on their financial reporting needs and
the complexity of their operations.
Distributing Indirect Costs. However, in order to determine the total cost of delivering
specific services, some methodology for determining and distributing indirect costs must
be developed, and that is the purpose of cost allocation plans: to identify indirect costs
and to allocate them to benefiting direct cost programs in a logical, consistent and
reasonable manner.

COST ALLOCATION PLAN REVIEW
- 5 -
Plan Goal: Reasonable Allocation of Costs
It is important to stress that the goal of cost allocation plans is a reasonable allocation of
indirect costs, not a “perfect” one. By their very nature, indirect costs are difficult to link
with direct costs. As such, in developing an allocation approach, it is important to keep
this goal in mind balancing the cost and effort of complicated allocation methods with the
likely benefits from the end results.
Essential Features. Effective cost allocation plans have two key components: technical
and policy.
Technical: Indirect cost allocations should be logical, reasonable and consistent.
Policy: Indirect cost allocations should be clear, transparent, understandable and
reasonably predictable.
As discussed below, the State Bar’s current Cost Allocation Plan meets the “technical”
criteria; however, this report recommends improvements in meeting the “policy” criteria.
Determining Direct and Indirect Costs
The first step in preparing cost allocation plans is determining direct and indirect costs.
For the State Bar, program costs that primarily provide services to members or the public
should be identified as direct costs, whereas the cost of programs that primarily provide
services to the organization should be identified as indirect costs. Typically, only
operating costs are considered in preparing cost allocation plans. As such, capital outlay,
debt service costs related to direct cost programs, interfund transfers, offsetting rental
income related to space costs and “pass-through” costs should be excluded from the
calculations.
Allocating Indirect Costs
Organization-Wide Indirect Cost Rate. For general purposes (and smaller agencies in
both the private and public sectors), the organization-wide indirect cost rate can be used
as the basis for allocating indirect costs. The indirect cost rate is simply the ratio between
indirect and direct costs, which can be easily computed for the organization as a whole
once the direct and indirect cost base has been determined. Provided in Table 1 below is a
sample of direct and indirect costs for the State Bar based on the 2016 Budget along with
the resulting organization-wide indirect cost rate.

COST ALLOCATION PLAN REVIEW
- 6 -
Table 1. State Bar Direct and Indirect Cost Sample
By applying the overall indirect cost rate to any specific direct cost program, the total
cost of the program can be determined. For example, with a sample overall indirect cost
rate of 33.9%, the total cost for a direct program cost of $100,000 in the State Bar would
be $133,900.
Bases of Allocation. Using the “organization-wide” rate for indirect cost allocations
assumes that all indirect costs are incurred proportionately to the direct cost of the
program. However, this may not be a reasonable assumption in all cases, as the benefit
received from certain types of support service programs may be more closely related to
another indicator of activity than cost.
For example, if a program service is primarily delivered through contract and does not
have any staffing directly associated with it, distributing human resources costs to it may
result in an inequitable allocation of costs. Because of this, separate bases for allocating
major indirect cost areas are used by many agencies. Common allocation bases include:
Full-time equivalent employees for human resources and payroll
Assigned space for building maintenance and utilities
Assigned computers for information technology
Operating costs for accounting
In accordance with “best practices,” the State Bar’s Cost Allocation Plan establishes
separate bases of allocation for each major indirect cost category. With this approach,
indirect costs can be allocated to each direct cost program in a fair, convenient, logical
and consistent manner. The State Bar’s bases of allocation are discussed in more detail
later in this report.
Admissions 19,504 Executive Director 3,419
Chief Trial Counsel 32,081 Finance 5,213
Probation 985 Budget & Performance Analysis 856
Client Security Fund 7,262 General Counsel 5,107
Mandatory Fee Arbitration 782 Human Resources 2,237
State Bar Court 7,858 Information Technology 6,518
Member Records & Compliance 2,642 General Services 7,342
Professional Competence 1,936 Communications 1,746
Education 9,766 Non-Departmental 5,930
Diversity & Bar Relations 744
Lawyer Assistance Program 1,410
Legal Services 28,084
TOTAL DIRECT COSTS $113,054 TOTAL INDIRECT COSTS $38,368
* In Thousands
Total Costs $151,422
Indirect Cost Rate 33.9%
DIRECT COSTS * INDIRECT COSTS *
COST ALLOCATION PLAN REVIEW
- 7 -
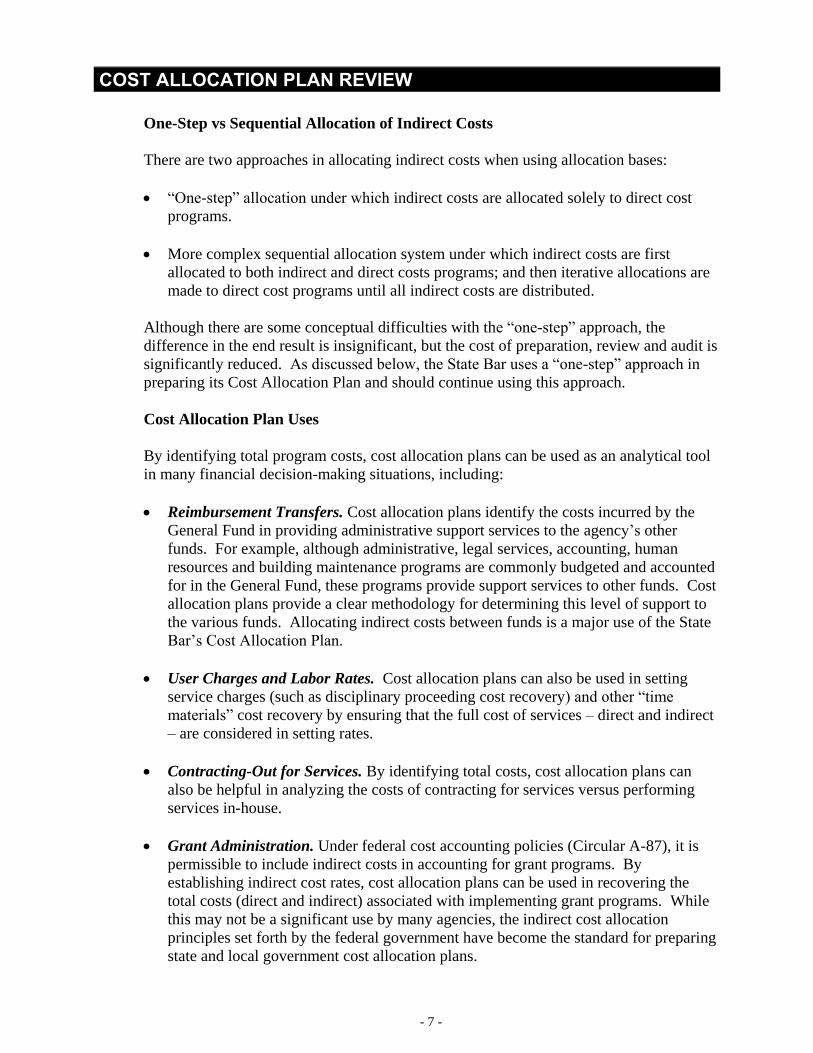
One-Step vs Sequential Allocation of Indirect Costs
There are two approaches in allocating indirect costs when using allocation bases:
“One-step” allocation under which indirect costs are allocated solely to direct cost
programs.
More complex sequential allocation system under which indirect costs are first
allocated to both indirect and direct costs programs; and then iterative allocations are
made to direct cost programs until all indirect costs are distributed.
Although there are some conceptual difficulties with the “one-step” approach, the
difference in the end result is insignificant, but the cost of preparation, review and audit is
significantly reduced. As discussed below, the State Bar uses a “one-step” approach in
preparing its Cost Allocation Plan and should continue using this approach.
Cost Allocation Plan Uses
By identifying total program costs, cost allocation plans can be used as an analytical tool
in many financial decision-making situations, including:
Reimbursement Transfers. Cost allocation plans identify the costs incurred by the
General Fund in providing administrative support services to the agency’s other
funds. For example, although administrative, legal services, accounting, human
resources and building maintenance programs are commonly budgeted and accounted
for in the General Fund, these programs provide support services to other funds. Cost
allocation plans provide a clear methodology for determining this level of support to
the various funds. Allocating indirect costs between funds is a major use of the State
Bar’s Cost Allocation Plan.
User Charges and Labor Rates. Cost allocation plans can also be used in setting
service charges (such as disciplinary proceeding cost recovery) and other “time
materials” cost recovery by ensuring that the full cost of services – direct and indirect
– are considered in setting rates.
Contracting-Out for Services. By identifying total costs, cost allocation plans can
also be helpful in analyzing the costs of contracting for services versus performing
services in-house.
Grant Administration. Under federal cost accounting policies (Circular A-87), it is
permissible to include indirect costs in accounting for grant programs. By
establishing indirect cost rates, cost allocation plans can be used in recovering the
total costs (direct and indirect) associated with implementing grant programs. While
this may not be a significant use by many agencies, the indirect cost allocation
principles set forth by the federal government have become the standard for preparing
state and local government cost allocation plans.

COST ALLOCATION PLAN REVIEW
- 8 -
Plan Preparation
For virtually all government agencies, frequent updating (such as monthly or quarterly)
of their cost allocation plans would not serve any specific purpose—such as unit price
control in a manufacturing company. However, it would consume significant accounting
resources. As such, most local agencies prepared their cost allocation plans on annual
basis based on the adopted budget (or biennially if they prepare two-year budgets). This
approach works well when significant variances are not expected between budget and
actual. However, where large variances are possible, then at the end of the fiscal year,
many agencies prepare a “true-up” based on actual costs. Any variances (either over or
under cost allocation plan amounts) are applied to the following year’s cost allocation
plan.
As discussed below, the State Bar currently prepares and posts indirect cost allocations
monthly. Instead, the State Bar should prepare the Cost Allocation Plan annually as a
freestanding policy document, with an annual true-up in the following year.
Summary
Cost allocation plans make determining total program costs possible by establishing a
reasonable methodology for identifying and allocating indirect costs to direct cost
programs. Because of this, cost allocation plans can be a valuable analytical tool in a
number of situations, including establishing fees designed for full cost recovery,
allocating support service costs to all funds and recovering indirect costs associated with
grant programs.
FINDINGS AND RECOMMENDATIONS
The following findings and recommendations are based on:
Detailed reviews of the current Cost Allocation Methodology and spreadsheet
calculations.
2001 report prepared by Deloitte & Touche.
Reviews of other policy documents, including the 2016 Budget.
“Kick-off briefings” with Section representatives, senior managers, other stakeholders
and Finance staff.
Follow-up interviews and discussions with State Bar staff.
Technically Sound Methodology. The methodology for preparing the State Bar
indirect cost allocations is technically sound and documented via an extensive Excel
spreadsheet. It is based on a model initially developed in 1999 by Deloitte & Touche
(now Deloitte, currently one of the “Big Four” accounting firms) and updated in 2001.
(This report, which was prepared in November 2001 and presented to the Board and
Planning, Program Development and Budget Committee in January 2002, is provided in
Appendix A).

COST ALLOCATION PLAN REVIEW
- 9 -
Since then, the State Bar has made some changes to the 2001 model. While several of
these are discussed in greater detail below with individual findings and recommendations,
Table 2 below summarizes key assumptions where the State Bar’s current practices are
different than those recommended in 2001, along with my recommendations as to
whether the State Bar should continue with its current practice, return to the
recommendations in the 2001 report or do something else.
Table 2. Summary of Assumptions: 2001 Deloitte Report, Current Practice and Recommendation
2001 Deloitte Report Current State Bar Practice Recommendation
Allocate only portions of
some indirect costs
Allocate only portions of
some indirect costs
Allocate all indirect costs
Treat some
Communications costs as
indirect costs, allocated
based on time records
Treat some
Communications costs as
indirect costs (currently
7%), allocated based on
operating costs
Consider all
Communications costs as
direct costs
Separately allocate Board
and Appointment indirect
costs
Separately allocate Board,
Appointment and Elections
indirect costs
Do not separately allocate
these costs (very small
component of indirect costs
does not warrant added
work)
Allocate Executive
Director and General
Counsel based on time
records
Allocate Executive
Director and General
Counsel based on operating
costs
Continue current practice
Allocate Finance payroll
costs based on full-time
equivalent employees
Allocate all Finance costs
based on operating costs
Continue current practice
(Finance payroll costs are
minor part of total Finance
costs and do not warrant
added work)
Allocate indirect costs via
sequential process
Allocate indirect costs via
one-step process
Continue current practice
(One-step allocation
provides similar results
with greater transparency
and reduced effort)
Allocate indirect costs to
major program areas (19
proposed in 2001 report),
not to cost centers
Allocate indirect costs to
118 cost centers
Return to 2001 Report
recommended approach:
allocate indirect costs to
major program areas (fund
level, perhaps at the
Department level in the
General Fund)

COST ALLOCATION PLAN REVIEW
- 10 -
2001 Deloitte Report Current State Bar Practice Recommendation
Prepare Cost Allocation
Plan annually, with true-up
in the following year
No formal plan
preparation; allocate
indirect costs monthly
Return to 2001 Report
recommended approach:
prepare formal cost
allocation plan annually,
with Board approval and
true-up in the following
year
Not All Indirect Costs Allocated. The current model does not allocate all indirect
costs. In three cases – allocating only 50% of Executive Director, 25% of Board and a
portion of Communication costs – this is consistent with the recommendations of the
2001 Deloitte report.
However, the 2001 Deloitte report provides very lean justification for allocating only a
portion of these costs. For example, in the case of the Executive Director, the report says
that: “Considering only a portion of the Executive Director as an Administrative Cost
Pool is consistent with the federal and state guidelines for Cost Allocation Plans.” While
this may be the case as a discretionary reduction in indirect costs that will be recovered
by from federal or state grant programs, it is not required under federal or state grant
guidelines. Moreover, there is no justification for excluding 50% of the cost, versus 25%,
33% or 75%.
Setting aside this methodological issue, as reflected below in Table 3, the current practice
is to exclude significant portions of other indirect costs as well:
Table 3: Indirect Cost Allocation Portions
Recommendation. Unless there is a compelling methodological reason for doing
otherwise, all indirect costs should be allocated in the Cost Allocation Plan in achieving
the goal of identifying the total cost of delivering services. An example of where
exclusion might make sense is where the Executive Director’s office provides direct
oversight and supervision to direct programs. In that case, this cost should be allocated
directly to the direct cost program, not excluded from the indirect cost allocations.
However, as discussed in a separate finding regarding cost recovery policies, after
determining total program costs, the State Bar has the discretionary option (subject to any
statutory limitations) of not requiring full cost recovery.
Indirect Cost Program Percent
Executive Director 50%
Appointments 50%
Board of Directors 25%
Deputy Director (COO) 25%
Elections 25%
Communications 7%
COST ALLOCATION PLAN REVIEW
- 11 -
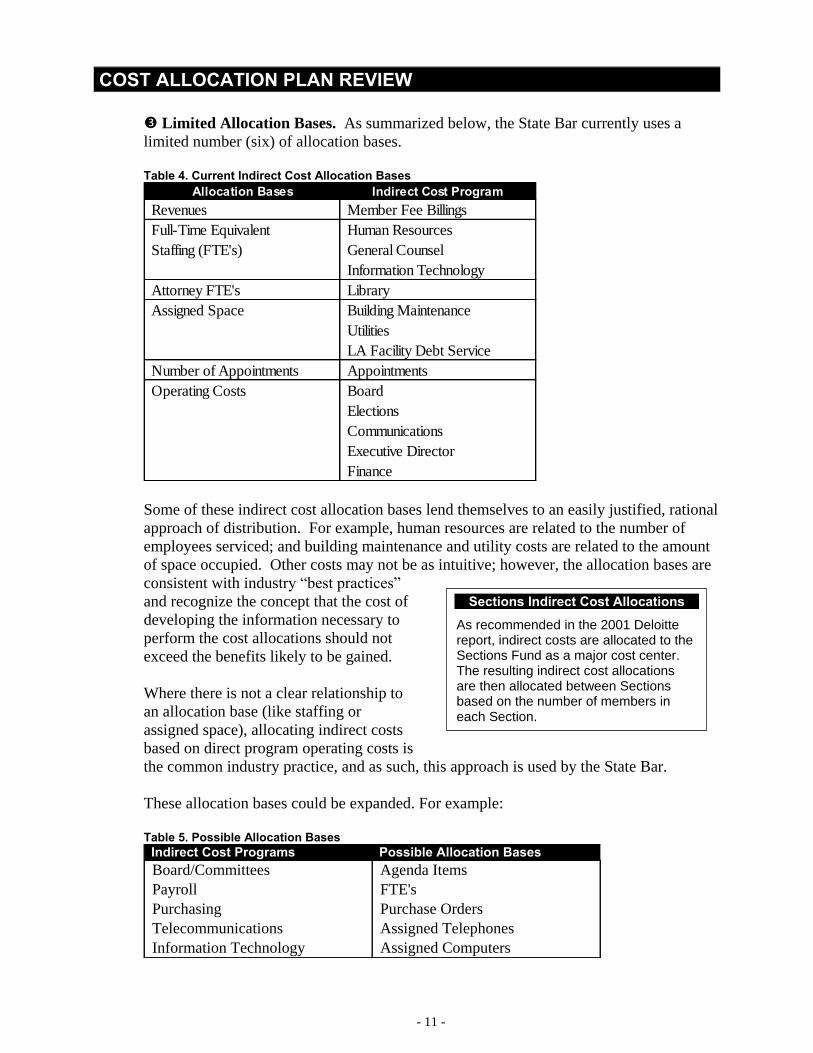
Limited Allocation Bases. As summarized below, the State Bar currently uses a
limited number (six) of allocation bases.
Table 4. Current Indirect Cost Allocation Bases
Some of these indirect cost allocation bases lend themselves to an easily justified, rational
approach of distribution. For example, human resources are related to the number of
employees serviced; and building maintenance and utility costs are related to the amount
of space occupied. Other costs may not be as intuitive; however, the allocation bases are
consistent with industry “best practices”
and recognize the concept that the cost of
developing the information necessary to
perform the cost allocations should not
exceed the benefits likely to be gained.
Where there is not a clear relationship to
an allocation base (like staffing or
assigned space), allocating indirect costs
based on direct program operating costs is
the common industry practice, and as such, this approach is used by the State Bar.
These allocation bases could be expanded. For example:
Table 5. Possible Allocation Bases
Indirect Cost Programs Possible Allocation Bases
Board/Committees Agenda Items
Payroll FTE's
Purchasing Purchase Orders
Telecommunications Assigned Telephones
Information Technology Assigned Computers
Allocation Bases Indirect Cost Program
Revenues Member Fee Billings
Full-Time Equivalent Human Resources
Staffing (FTE's) General Counsel
Information Technology
Attorney FTE's Library
Assigned Space Building Maintenance
Utilities
LA Facility Debt Service
Number of Appointments Appointments
Operating Costs Board
Elections
Communications
Executive Director
Finance
Sections Indirect Cost Allocations
As recommended in the 2001 Deloitte report, indirect costs are allocated to the Sections Fund as a major cost center. The resulting indirect cost allocations are then allocated between Sections based on the number of members in each Section.
COST ALLOCATION PLAN REVIEW
- 12 -
However, this would require additional work in developing the costs and data bases, for
which it is unlikely that there will be commensurate value in significantly improving
indirect cost allocations.
Moreover, in a predominately office environment like the State Bar, there is likely to be a
very close relationship between services like telecommunications and information
technology with FTE’s. On the other hand, there may not be commensurate value in
separately allocating Board, Appointment and Election Costs.
Recommendations. As noted above, the goal in allocating indirect costs is “reasonable,”
not perfect. This means balancing added work effort and understandability with more
detail and complexity in trying to achieve a “better” allocation of indirect costs. Based
on this, it is recommended that the State Bar retain its current bases of allocation, with
two exceptions where the bases should be reduced:
Board, Appointment and Election costs should no longer be broken out as separate
indirect cost areas from the Executive Director’s office. This will improve
transparency and reduce preparation costs with no significant impact on results. For
example, in the case of Board and Election costs, these are already allocated on the
same basis as the Executive Director’s office (operating costs); and Appointment
costs are very minor, representing only 0.5% of all indirect costs allocated in 2014.
All Communications costs should be considered as direct costs. This follows the
concept discussed above that program costs that primarily provide services to
members or the public should be identified as direct costs. This appears to be the
case for all Communications costs.
The 2001 Deloitte report recommended considering some Communications costs as
indirect since they “support various program activities, specifically the management
of the State Bar Web page on the Internet.” Since the purpose of the State Bar’s web
site is to provide information to members and the public, it is not clear why the report
viewed this function as different from other Communications functions.
The 2001 Deloitte report also recommended that this cost be identified and “allocated
based on time records.” However, the current practice is to consider 7% of
Communications costs as indirect and to allocate them based on operating costs (other
than history, there is no documentation for the percentage or the allocation basis). In
short, making this change will result in a closer alignment with the underlying
foundation for determining direct versus indirect costs, greater consistency in
allocating costs and improved understandability and transparency.
This will result in the following ten indirect cost program areas and related bases of
allocation:

COST ALLOCATION PLAN REVIEW
- 13 -
Table 6. Recommended Indirect Cost Programs and Allocation Bases
Allocation Level: Too Many Cost Centers. The current model allocates indirect
costs to 118 cost centers. This is a change from the 2001 Deloitte report, which
recommended allocating indirect costs to nineteen major programs (primarily based on
departments/funds). In discussions with State Bar staff, there are no readily identifiable
benefits to allocating indirect costs to such a detailed level. On the other hand, doing so
makes the results more complicated and less intuitively understandable.
Recommendation. The State Bar should return to allocating indirect costs to major
programs areas based on departments/funds. This will reduce preparation efforts while
improving understandability and transparency. Similar to those in the 2001 Deloitte
report, suggested “major program areas” are:
General Fund (See Discussion Below)
Chief Trial Counsel
State Bar Court
Member Records & Compliance
Other General Fund Programs
Restricted Funds
Client Security Fund
Elimination of Bias and Bar Relations Fund
Equal Access Fund
Justice Gap Fund
Lawyer’s Assistance Fund
Legislative Activities Fund
Legal Services Trust Fund
Legal Specialization Fund
Allocation Bases Indirect Cost Program
Revenues Member Fee Billings
Full-Time Equivalent Human Resources
Staffing (FTE's) General Counsel
Information Technology
Attorney FTE's Library
Assigned Space Building Maintenance
Utilities
LA Facility Debt Service
Operating Costs Executive Director
Finance
COST ALLOCATION PLAN REVIEW
- 14 -
Special Revenue Funds
Admissions Fund
Annual Meeting Fund
Grants Fund
Sections Fund
Breaking-out major cost areas within the General Fund is solely for the purpose of
establishing indirect cost rates for special cost recovery purposes, such as setting
disciplinary proceedings fees. After further review by State Bar staff, this may not be
needed and setting indirect cost rates at the General Fund level may be sufficient.
However, even if indirect costs are allocated to major program areas within the General
Fund, I do not recommend actually posting indirect cost allocations to them within the
General Fund, since the total allocated to the General Fund remains the same.
On the other hand, reimbursements from the other funds for indirect costs initially
accounted for in the General Fund should be posted as expenditures in the other funds,
and recorded as a reduction to expenditures in the General Fund. Examples of how to
record and display these reimbursements are available upon request.
One-Step versus Sequential Allocation Process. In performing the indirect cost
allocations, the current “one-step” process only allocates indirect costs to direct cost
programs rather than using a more complex sequential allocation system. As discussed
above, there are some conceptual difficulties with this approach. However, the difference
in the end result is insignificant, but the cost of preparation, review and audit is
significantly reduced.
For example, the cost of the Finance program is allocated solely to direct cost programs
based on their operating costs. However, as the Finance program also benefits other
indirect cost programs such as the Executive Director’s office, General Counsel and
Human Resources (they all receive paychecks), the cost allocations could appear to be
distorted since no allocations are made to them.
Under a more sophisticated sequential system, the cost of the Finance program would be
allocated to the other indirect costs programs (as well as the direct cost ones) and iterative
allocations then made to direct cost programs until all indirect costs are distributed.
However, this process is extremely time consuming (and places far more reliance on the
underlying significance of the allocation bases than may be appropriate) and results in the
same basic cost allocations as the simpler method since all indirect costs are allocated in
the final product.
The 2001 Deloitte report recommends the more complex, sequential approach. Table 7
below is an example from the report illustrating the sequential model.

COST ALLOCATION PLAN REVIEW
- 15 -
Table 7. Sample Sequential Allocation Process: 2001 Deloitte Report
Even for someone familiar with cost allocation models, this can be difficult to follow –
and this example is based on just three indirect cost programs and four direct cost
program areas (and without showing the allocation calculations). For the State Bar, this
becomes even more difficult to display and understand when there are likely to be ten
indirect cost programs and sixteen direct cost programs.
Recommendation. The State Bar should continue with the simpler, “one-step” approach.
It is a more transparent methodology and easier to prepare; and as discussed previously,
the Cost Allocation Plan goal is a reasonable allocation of costs, not a “perfect” one. That
said, a possible refinement is to allocate the costs of space used by direct programs based
on assigned space; and the cost of space used by indirect cost programs based on
operating costs. (An example of this is provided in Appendix B).
Timing: Monthly Preparation and Posting Unusual. The State Bar prepares and
posts indirect allocations monthly. This is unusual. Most public agencies prepare an
annual cost allocation plan as a freestanding policy document based on the adopted
budget. This serves three purposes:
Treats the allocation of resources as a policy matter.
Provides transparency in how allocations are determined.
Improves predictability.
Where significant variances between budget and actual are likely, this can be accounted
for via annual true-ups that are reflected in the following year’s cost allocation plan.
(“True-up” examples are available upon request.)
Recommendation. Annual preparation and true-up is the recommended approach in the
2001 Deloitte report. Consistent with industry practice, the State Bar should return to
annual preparation of the Cost Allocation Plan; and it should be published as a separate

COST ALLOCATION PLAN REVIEW
- 16 -
policy document that describes its purpose, methodology, key assumptions any
significant changes in methodology from the prior year and results at a summary and
detailed level. Along with reducing preparation efforts and improving transparency and
predictability, it will also strengthen the Cost Allocation Plan as a policy document
(which is discussed next).
Technical Versus Policy Document. The current Cost Allocation Plan is a large
spreadsheet that requires 11x17 paper to print-out (in very small print: see Table 8
below); has no narrative regarding assumptions; and has deeply imbedded formulas that
make following the allocations difficult.
Table 8. Current Cost Allocation Plan Model (Page 1 of 2)
While this works as a technical document that only has to be understandable to the staff
preparers (and even then, this can be a difficult spreadsheet to follow in ensuring that all
calculations are made correctly), it does not work well as a policy document. The Cost
Allocation Plan makes significant resource allocations whose purpose and methodology
should be clear and understandable to governing bodies, senior managers, program
managers and others affected by the allocations (“stakeholders”) as well as Finance staff.
Recommendation. The Cost Allocation Plan should be prepared as a separate policy
document that describes its purpose, methodology, key assumptions, any significant
changes in methodology from the prior year and results at a summary and detailed level.
COST ALLOCATION PLAN REVIEW
- 17 -
Appendix B provides examples of a Cost Allocation Plan as a policy document that
reflects these features:
Introduction describing the Plan’s purpose, methodology, key assumptions and any
significant changes in methodology from the prior year (Appendix B.1).
Summary of direct and indirect costs (Appendix B.2)
Summary of excluded costs and reconciliation to the Budget (Appendix B.3)
Indirect cost allocation bases (Appendix B.4)
Indirect cost summary by fund type (Appendix B.5)
Indirect cost summary by fund (Appendix B.6: totals roll-up to Appendix B.5)
Individual indirect cost allocations (Appendix B.7: totals roll-up to Appendix B.6)
- General administration costs allocated based on operating costs (Appendix B.7a)
- Human resources costs allocated based on FTE’s (Appendix B.7b)
- Utilities allocated based on assigned space and operating costs (Appendix B.7c)
Fund indirect cost allocations: budget versus actual (Appendix B.8).
Allocation base data (sample): Full-Time Equivalent Employees (Appendix B.9).
Labor rates for billing and cost recovery purposes including salary, benefits and
indirect costs (Appendix B.10: sample for Police labor rates)
Capital Projects and Debt Service. As discussed above, cost allocation plans
typically focus on direct and indirect operating costs; and exclude from the direct cost
base capital project and debt service expenditures. Accordingly, decisions regarding
funding capital projects and indirect cost debt service obligations should be made on a
case-by-case basis depending on circumstances at the time when capital projects and debt
service obligations are approved. This has been the State Bar’s past practice.
Capital projects. In the case of major capital projects, such as building and technology
improvements, special fee assessments were put in place that largely funded these
improvements. Where direct supplemental funding is not available, or will not fully fund
project costs, project costs should be allocated on a case-by case basis, taking into
account the circumstances at the time, using a methodology based on benefit similar to
that used in the Cost Allocation Plan.
Debt service. Where debt service is an indirect cost, it should also be allocated based on
benefit. In the current case of debt service related to the Los Angeles facility, there two
equally appropriate approaches:

COST ALLOCATION PLAN REVIEW
- 18 -
Debt service costs could be allocated based on all space used by the State Bar, on the
assumption that the use of space between the San Francisco and Los Angeles offices
is not largely driven by unique program needs that could not be conceptually
accommodated at either location. With this assumption, all programs benefit from the
availability of space, and as such, facility debt service costs could be allocated based
on all assigned space and related total costs.
On the other hand, in the interest of transparency and understandability, it may be
more intuitive to allocate the debt service costs for the Los Angeles facility only to
the programs that are located there. This is the State Bar’s current approach.
Recommendation. No changes are recommended to the current case-by-case approach.
However, in the case of capital projects, the basis for allocating project costs between
funds should be clearly articulated when the Board approves the project budget (or makes
subsequent amendments to it). Similarly, in the case of debt service for facilities, either
of the options discussed above can be appropriate. However, the assumption and its basis
should be clearly stated. Preparing the Cost Allocation Plan on an annual basis as a
freestanding policy document (as recommended above) will provide the opportunity to do
so.
Plan Approval. As a “technical document” that closely follows the 2001 Deloitte
report recommendations (albeit with modifications since then), the Cost Allocation Plan
is currently approved and implemented by Finance staff. However, as noted above, the
Cost Allocation Plan allocates significant resources between funds. As such, either
implicitly or explicitly, it is a major policy document, similar to the Budget, which are
typically approved by the Board.
Recommendation. Assuming it is prepared annually as a freestanding policy document,
the Cost Allocation Plan should be formally approved by the Board. (If the Cost
Application Plan is prepared concurrently with the Budget, formal Board approval of the
Plan may not be required if the budgeted allocations are based on the Plan. However, in
this case the Plan should be provided to the Board for its review).
Cost Recovery Policy. While the Cost Allocation Plan identifies total program costs,
setting rates and fees at levels that fully recover these costs is a policy decision (although
there may be statutory requirements for full indirect cost recovery or limits on full cost
recovery).
Recommendation. Full cost recovery where possible may be an implicit understanding
(and as noted above, there may be statutory provisions regarding indirect cost recovery).
However, in accordance with “best practices” (and following a review for possible
statutory limitations), the Board should formally adopt a cost recovery policy that sets
forth programs where it expects full cost recovery; and for any programs where full cost
recovery is not expected, the reason for this and the cost recovery goal.

COST ALLOCATION PLAN REVIEW
- 19 -
FISCAL IMPACT ON INDIRECT COST ALLOCATIONS
Without actually performing the calculations and updating the model, it is not possible to
fully assess the fiscal impact of implementing the recommended changes. That said,
most the proposed changes are modest and as such should have modest impacts.
However, there are two areas where there are likely to be reductions and increases in
allocated indirect costs in the restricted and special revenue funds:
Identifying all Communications costs as direct costs will reduce indirect cost
allocations. Since only 7% of Communications costs are currently being allocated as
indirect costs, this impact should be modest.
Allocating all indirect costs (and not just portions of Executive Director, Board,
Appointment and Elections costs) will increase indirect cost allocations. This impact
is likely to be significant.
“FAIRNESS” OF CURRENT ALLOCATIONS AND PROPOSED CHANGES
Are the current allocations and proposed changes “fair?”
As some pundit once noted: fairness is in the eye of the beholder. In the case of cost
allocations, fairness can best be determined by the key technical and policy criteria
discussed above:
Are the allocations logical, consistent and reasonable (albeit not perfect)?
Are the allocation assumptions and calculations clear, transparent and
understandable?
If the answer to these questions is “yes,” the resulting allocations most likely will be
“fair,” recognizing that regardless of methodology, allocating indirect costs is a “zero
sum game.” At the end of the day, all indirect costs have to be allocated to direct cost
programs. Accordingly, a basis of allocation that lowers indirect costs for one program
will result in higher costs for another (and thus why “fairness” in the context of cost
allocation plan is likely to be in the eye of the stakeholder).
That said, there are three “acid tests” for fairness based on the overall indirect cost rate:
Is the overall indirect cost rate significantly higher than 35%?
All organizations account for direct and indirect costs differently, and as such, there can
be significant variances in overall indirect cost ratios. However, if this ratio is
significantly higher than 35%, there should clear, compelling and reasonable basis for
this. In the State Bar’s case, the overall ratio of indirect to direct costs for 2014 was
28.0%, based on allocated indirect costs of $21.6 million and direct costs of $77.1
million.

COST ALLOCATION PLAN REVIEW
- 20 -
How does the overall indirect cost rate change over time?
If it changes significantly, there should be a clear, compelling and reasonable basis for
this. For example:
The 2001 Deloitte
report shows an
overall indirect
cost rate for 2002
of 29.3% (Table 9)
based on direct
program costs of
$58.3 million and
indirect costs of
$17.1 million.
This compares
favorably with the
2014 ratio of
28.0% for 2014.
It also compares
favorably with the
with the very “high
level” sample
estimate for 2016
presented earlier in
Table 1 of 33.9%, which is based on allocating all indirect costs and doesn’t make
adjustments for excluded costs.
How do major program indirect cost rates compare with the overall indirect cost rate?
There should be variances, since indirect costs are allocated to each major cost area under
separate allocation bases. That said, where there are significant variances, again there
should be a clear, compelling and reasonable basis for this.
For example, the Sections have expressed concern in the past that the indirect cost
allocations to them are “too high.” To place this in context, indirect cost allocations to
the Sections Fund in 2014 were $1.365 million compared with direct costs of $6.739
million. The resulting indirect cost rate of 20.2% compares very favorably with the
organization-wide cost rate of 28.0%.
Table 9. 2001 Deloitte Report Indirect Cost Allocations ndi

COST ALLOCATION PLAN REVIEW
- 21 -
CONCLUSION
The State Bar’s current Cost Allocation Plan is technically sound and largely follows the
methodology set forth in the 2001 Deloitte report. However, there are recommended
changes that will reduce preparation efforts while improving transparency and
understandability. In many cases, this is done by following Albert Einstein’s advice:
“Make everything as simple as possible, but not simpler. Any idiot can make things more
complicated.”
. . . . . . . . . . . . . . . . . . . . .
APPENDIX
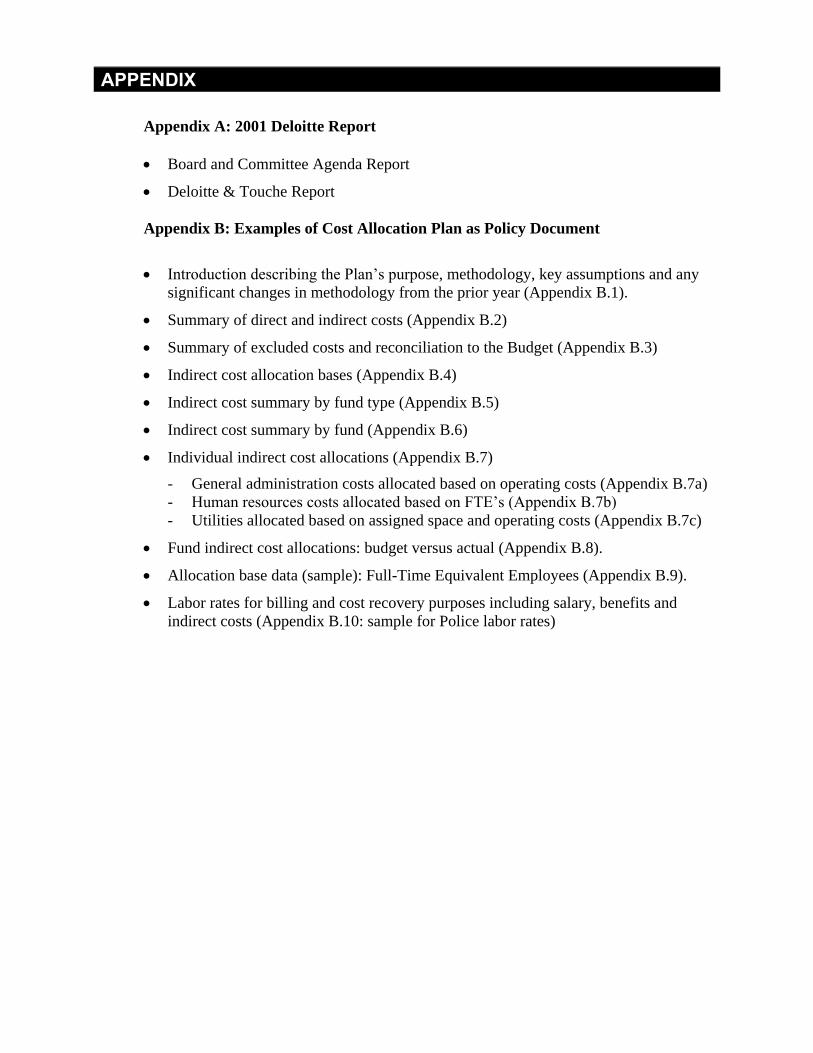
Appendix A: 2001 Deloitte Report
Board and Committee Agenda Report
Deloitte & Touche Report
Appendix B: Examples of Cost Allocation Plan as Policy Document
Introduction describing the Plan’s purpose, methodology, key assumptions and any
significant changes in methodology from the prior year (Appendix B.1).
Summary of direct and indirect costs (Appendix B.2)
Summary of excluded costs and reconciliation to the Budget (Appendix B.3)
Indirect cost allocation bases (Appendix B.4)
Indirect cost summary by fund type (Appendix B.5)
Indirect cost summary by fund (Appendix B.6)
Individual indirect cost allocations (Appendix B.7)
- General administration costs allocated based on operating costs (Appendix B.7a)
- Human resources costs allocated based on FTE’s (Appendix B.7b)
- Utilities allocated based on assigned space and operating costs (Appendix B.7c)
Fund indirect cost allocations: budget versus actual (Appendix B.8).
Allocation base data (sample): Full-Time Equivalent Employees (Appendix B.9).
Labor rates for billing and cost recovery purposes including salary, benefits and
indirect costs (Appendix B.10: sample for Police labor rates)

AGENDA ITEM
DATE: January 10, 2002
JANUARY 54-141
Update to Indirect Cost Allocation Methodology
TO: Members, Board Planning, Program Development and Budget Committee
Members, Board of Governors
FROM: David Jensen, Manager of Budget and Planning
SUBJECT: Update to Indirect Cost Allocation Methodology
Executive Summary
In 1999, the State Bar engaged the consulting firm of Deloitte and Touche, LLP, to study and recommend an appropriate methodology for allocating Administration and Support costs to the various State Bar program areas. The consultants recommended a step-down methodology originally developed by the federal government to allow state and local governments to recover the costs of administering federal grants without placing an undue burden on the grant recipient to track all related administrative costs. This is also the same methodology used by the State of California. In August of 1999, the Board of Governors adopted the step-down methodology recommended by De/oitte and Touche and the utilization of their model to calculate allocations. Subsequently the State Bar has incurred organizational changes that needed to be incorporated into the model. Following the adoption of the 2002 State Bar Budget, Deloitte and Touche reviewed the methodology as applied to the State Bar and updated the model accordingly. As the methodology remains the same, the Board needs to take no action. The model results for 2002 are presented for the Board's information.
When the Board of Governors adopted the 2002 State Bar budget in October 2001, they also
adopted some changes in the State Bar organizational structure. The most notable of these
changes are the creation of the Attorney Diversion and Assistance Fund and the transfer of
Certification activities from the General Fund to the newly created Certification Fund. These
organizational changes necessitated an update to the State Bar's Indirect Cost Allocation Model as the new programs needed to be assessed their share of Administration and Support costs (i.e., indirect costs) for 2002.
The State Bar engaged the consulting firm of Deloitte and Touche, LLP, to review the State Bar's organizational structure and update the model for 2002. Attached is the Draft Final
Report reflecting the Revised Indirect Cost Allocation Methodology for 2002 as prepared by Deloitte and Touche, November 2001. The model results are presented on page 3 of this
report.
The report is being presented as an information item to the Board Committee on Planning, Development and Budget.
Appendix A

State Bar of California
Revised Indirect Cost Allocation Methodology
Draft Final Report
November, 2001
Deloitte &Touche
Appendix A

Table of Contents
Executive Summary
II Background and Process
Ill Model Assumptions
IV Methodology Description
v Administrative Cost Pools
·v1 Model Results
VII Implementation Issues
Appendices
A Cost Pools and Program Areas
B Model Allocation Spreadsheet
Page
1
5
6
7
10
14
15
16
17
Deloitte &Touche
Appendix A

I · Executive Summary
Background
The State Bar of California engaged Deloitte & Touche to update the Indirect Cost Allocation Plan originally developed in 1999. This update involved interviews with administrative management personnel, document reviews and presentations to the Council of Section Chairs and the Executive Committee of the Conference of Delegates at the 2001 Annual Meeting.
Goal and Assumptions
The goal of an Administrative Cost Allocation Plan is a system that is:
Fair (based on usage)
Simple (easy to understand)
Predictable (consistent over time)
To meet this goal requires a balance between the three.
Assumptions of the plan include: ·
Allocation of 100% of administrative costs
Allocation of costs to major areas, not cost centers
Allotment for annual adjustments to reflect actual patterns
Updates with the FY2002 budget
Reviged Indirect Cost Allocation Methodology Draft Final Repol't Page 1 Deloitte BrTouche
Appendix A

I · Executive Summary (Continued)
Methodology Description
The methodology used in the model was originally developed by the federal government to allow state and local governments to recover the costs of administering federal grants without placing an undue burden on the grant recipient to track all administrative related costs. This same process is used by the State of California.
The plan identifies twelve (12) Administrative Cost Pools and defines the method of allocation for each of these pools. There were a total of nineteen (19) Program Areas defined. The actual allocation process is a "step-down, process where the first Administrative Cost Pool is allocated to the other Administrative Cost Pools and the Program Areas. The second Administrative Cost Pool's direct costs plus the amount allocated from the first pool are then allocated to the remaining Administrative and Program Areas. This continues until all Administrative Cost Pools are allocated. Section V discusses the Administrative Cost Pools and allocation methods, while Appendix A provides a list of all Administrative Cost Pools and Program Areas.
Rnis•d /Niinct Co.rt AllocatiDtl MethodoiOfY Drofl FlMl Report Page2 Deloltte &Touche
Appendix A

I · Executive Summary (Continued)
Model Results
The table shows the impact of applying this methodology to the FY2002 State Bar proposed budget. This table shows the direct and indirect costs for each of the Program Areas. The details of these calculations are shown in Appendix B.
Summary of Administrative Cost Allocations Fiscal Year 2002
Direct Allocated Costs Costs
Program Area ($000) ($000)
DiscipUne $31,986 $9,354 Administration of Justice 747 202 Governance 1,322 2,276 Legal Services Access 1,240 290 Admin. of the Profession 682 281 Communicaitons 2,517 327 Admissions 8,702 2,002 CUent Security Fund 962 515 Legal Services Trust 827 208 Equal Access Fund 330 10 Certifications Fund 1,341 317 Legal SpeciaUzation 1,178 198 Sections 3,544 549 Annual Meeting 555 84 Conference of Delegates 118 14 Legislatiw Activities 603 124 Elimination of Bias 385 74 Attorney Diversion 750 65 Legal Education 586 196 Program Area Total $58,375 $17,087 Exempt Costs 1,943 22,631
Total Costs ($000)
$41,340 949
3,598 1,530
963 2,844
10,705 1,477 1,035
340 1,659 1,376 4,093
639 132 727 459 815 782
$75,462 24,574
Total Budget $60,318 $39,718 $100,036 Note: Totals may not sum do to rounding ·
Revised Indirect C03t Allocation Methodology Draft FinD/ Report Page3
Allocated as Percent
of Direct
22.6% 21.3% 63.3% 19.0% 29.2% 11.5% 18.7% 34.8% 20.1%
3.0% 19.1% 14.4% 13.4% 13.1% 10.5% 17.0% 16.1%
7.9% 25.1% 22.6%
Deloitte &Touche
Appendix A

I · Executive Summary (Continued)
Changes from the Prior Year
There were a number of changes from the initial (FY2000) plan based on the current understanding of the fee bill and the current organization of the Bar. For 2002, there are new Administrative Cost Pools for this plan:
Board of Governors
Appointments
Membership Billing
Communications
There are also new Program Areas that receive costs, based on the current organization. All Administrative Cost Pools and Program Areas are listed in Appendix A.
Support by State Bar Staff
This update for 2002 could not have been completed without the support of the staff of the Finance Department and the General Counsel. Also, members of the Council of Section Chairs and the Executive Committee of the Conference of Delegates provided relevant comments.
Rn�i.s�d lndinct COlt Allocation M�thodology Draft Final R�port Page 4 Deloitte &Touche
Appendix A

I I • Background and Process
Background
The State Bar of California (State Bar) is funded through a number of sources, including the membership fee bill, voluntary fees and charges. The Cost Allocation Plan was developed in 1999 prior to the reinstatement of the fee bill. The fee bill, and reorganization within the State Bar in response to legitimate legislative concerns, requires that the Allocation Plan be updated for 2002.
Process
The update of the Cost Allocation Plan was focused internally. The project team met with representatives from the Finance Department and the General CourBel's Office to review the changes in the State Bar organization and interpretations of the fee bill requirements since the 1999 study. A presentation was also made to the Council of Section Chairs and the Executive Committee of the Conference ofDelegates at the 2001 Annual Meeting.
The updated cost allocation model uses FY2002 budget and allocation metrics provided by staff. This is a spreadsheet based model used by the Manager of Budget and Planning to recalculate the cost allocations for FY2002 and will be used to update the plan on an annual basis.
The following sections of this document discuss the model assumptions, the cost allocation methodology, individual Administrative Cost Pools, the proposed allocation method for each cost pool, and the results and future implementation issues.
Revised Indirect Cost Allocation Methodology Draft Firral Report Page S Deloitte &Touche
Appendix A

Ill • Model Goals and Assumptions
Goal
The original focus groups agreed that the goal of a Cost Allocation Plan is a system that is:
Fair (based on usage)
Simple (easy to understand)
Predictable (consistent over time)
The goal that the plan be "fair", "simple" and "predictable" requires balancing. A plan that is completely "fair" would be based totally on usage, would require the tracking of numerous measures not currently captured by State Bar staff and would entail a detailed time tracking system. A plan that is completely "simple" would ignore real differences in usage of the different administrative services. A plan that is "predictable" would allow Program Areas to plan for cost allocation charges and not be surprised because of unforeseen circumstances, but would not reflect changes immediately, but rather over a period of time these changes would be captured.
Assumptions
There are three key assumptions that a Cost Allocation Plan must include to meet the overall goal:
100% of administrative costs will be allocated
Allocations will be to major areas, not each cost center
Allocations will be adjusted annually
Revised /Nlirect Cost Allocation Methodology Draft Final Report Page6 Deloitte &Touche
Appendix A

IV · Methodology Description
The Indirect Cost Allocation Methodology is designed to meet the goals and asswnptions discussed above. The methodology also makes two additional assumptions, (1) that the State Bar will continue to pass through costs directly to users through billings for such quantifiable items as postage, printing, copying, telephone, etc; and (2) that no additional staff will be needed to maintain the cost allocation system.
The methodology used in the model was originally developed by the federal government to allow state and local governments to recover the costs of administering federal grants without placing an undue burden on the grant recipient to track all administrative related costs. This same process is used by the State of California.
The methodology requires that all costs be categorized into two areas: (1) administrative costs and (2) Program Areas. Certain administrative costs may be excluded from the allocation where these costs are directly passed through to the actual users (e.g. postage fees) or used to offset overall costs (e.g. non-Bar tenant rentals).
The remaining administrative costs are then grouped into Administrative Cost Pools. These groupings are driven in part by the management and organization structure and a common method of allocating costs. For the State Bar, there are a total of twelve Administrative Cost Pools. (See Section V for descriptions.)
The Program Areas are also determined in part by the management and organization structure. For the State Bar, a total of nineteen (19) Program Areas were defined. These Program Areas are logical combinations of cost centers, e.g. all l6 Sections are grouped into the Sections Fund Program Area. (See Appendix A).
Revised Indirect C01t Allocotion Methodology Draft FiMI Report Page7 Deloitte &Touche
Appendix A

IV • Methodology Description (Continued)
The methodology used in this model is called a "step-down" allocation. The costs associated with the first Administrative Cost Pool are allocated to all other areas, both the remaining Administrative Cost Pools and Program Areas in proportion to
an agreed upon quantifiable category, such as number of Full Time Equivalents (FTEs). The costs of the next Administrative Cost Pool (which now includes the amount allocated from the first pool) are then allocated to all remaining Administrative Cost Pools and Program Areas. At the end of the allocation process, all Administrative Cost Pools will be allocated and sum to zero, and the total cost of the State Bar will be reflected in the various Program Areas. An example of a step-down allocation model is shown below. Note that the Administrative Cost Pools (columns three through five) sum to zero and these costs are added to the Program Areas (columns six through nine).
Example of a Step-Down Allocation Model
1 2 3 4 5 6 7 8 Anocation AdmmlstratiVe cost Pools Program Areas
Method Area1 Area2 Area3 Program 1 Program 2 Program 3 -- -- -- --
Administrative C..ost Pools Area 1 $5,000
FTEs (5,000) $500 $250 $1.000 $250 $2,000
Area2 6,000 Square Feet (6,500) 525 525 550 3,300
Area3 5,000 Hours (5,n5) 1,750 1,225 1,950
Program Areas Program Area 1 5,000 Program Area 2 4,000 Program Area 3 10,000 Program Area 4
Total Budget $0 $0 $0 $8,275 $6,025 $17,250
Iavued Indirect Co.st Allocation Methodology Draft Final Report PageS
9
Program4
$1,000
1,600
850
20,000
$23,450
10 I Allocation
Totals --
$5,000 (5,000)
6,000 (6,000)
5,000 (5,000)
5,000 4,000
10,000 20,000
$39,000
Deloitte &Touche
Appendix A

IV· Methodology Description {Continued)
For this model, the estimated budget for FY2002 was used. The allocation factors are based on either the estimated budget or metrics gathered explicitly for this model. Some of these estimates will remain constant over time (e.g. space usage) while others will change (e.g. FTEs) on an annual basis.
To ensure that costs are predictable for the year, the allocations will be set at the beginning of the fiscal year. The actual numbers at the end of the year will vary and the model will adjust for these changes in subsequent years. For example, the plan adopted for FY2001 was used for FY2001. For FY 2002, the budget for FY2002 will be used and the plan allocations adopted. In FY2003, the actual information for FY2001 will be used to recalculate the amounts which should have been allocated to programs in FY2001. The FY2004 allocations will then be adjusted by these amounts. Thus, over time each area will pay its fair share, while having a known allocation at the start of the year.
RniHd Indirect C01t Allocation M1thodology Draft FiMI Report Page9 Deloltte a Touche
Appendix A

V • Administrative Cost Pools
The definition of Administrative Cost Pools and method of allocating each of these cost centers is the key component of the cost allocation model. A total of twelve ( 12) distinct cost pools have been identified as Administrative Cost Pools. Each of these will be discussed in tum.
Executive Director The Executive Director Cost Pool includes half of the Office of the Executive Director. Considering only a portion of the Executive Director as an Administrative Cost Pool is consistent with the federal and state guidelines for Cost Allocation Plans. The costs for the Executive Director will be allocated based on the Executive Director's time records.
General Counsel The Office of General Counsel provides legal services to staff and programs of the State Bar and represents the State Bar in any court of law. The costs of the General Counsel will be allocated to programs based on the time records of the attorneys.
Board of Governors This is a new Administrative Cost Pool. The Board of Governors is included as both an Administrative Cost Pool and as a program. Under federal guidelines, the Board of Governors would not be considered an allocable Administrative Cost Pool, but under state guidelines it is. There is also a belief that the existing state legislation requires some of the Board of Governor's expenses be allocated to the Program Areas funded by voluntary contributions. (Voluntary contributions support the Elimination of Bias Fund, the Conference of Delegates Fund, the Legislative Activities Fund and the Sections Fund.) Twenty·five percent of the Board of Governors will be allocated based on the net budget.
Revised lndinct Cost Allocation Methodology Draft Final Report Page 10 Deloitte &Touche
Appendix A

V - Administrative Cost Pools (continued)
Appointments This is also a new Administrative Cost Pool. The Appointments function provides assistance to all the volunteer organizations by recommending personnel for the various boards and committees. This area will be allocated based on the number of appointments in the prior year.
Communications This is also a new Administrative Cost Pool. The Communications function includes some services that support various program activities, specifically the management of the State Bar Web page on the Internet. The relevant portion of Communications will be allocated based on time records.
Administration and Support Management The management of Administration and Support and the Financial Planning and Analysis staff provide management to the various areas within Administration and Support. These costs are allocated to the other Administration and Support functions based on the FTEs within each area.
Finance The Finance Department maintains the fmancial records, manages cash and investments, and manages the payroll processing. Payroll processing costs will be excluded from Finance and allocated with the Human Resources cost pool. The Finance activities are best measured by the number of financial transactions, however this information is not currently available from the data processing system. Until this transaction information is available, the Finance Department costs will be allocated based on the adjusted budget for each area. (Note, adjusted budget is the total budget less specific large dollar items that have minimal financial transactions, e.g. the cost of scoring the multistate bar exam.)
Rni8ed lrtdiract Cost Allocation Methodology Draft Final Report Page 11 Deloitte &Touche
Appendix A

V - Administrative Cost Pools (continued}
Membership Billing
This is the final new Administrative Cost Center. Membership billing collects the dues and voluntary fees from all attorneys who wish to practice within the State of California. Allocation of membership billing will be based on the revenues collected.
Property Related Services
There are a number of services provided to programs and administrative areas that are related to the facilities. These include the costs of space, reception, switchboard and security in both San Francisco and Los Angeles. There are some additional functions included in Support Services, Administrative Services and Staff and Building Services cost centers. These other costs include purchasing, mailroom and printing services. The mailroom currently charges each user for outgoing mail and the print shop charges for printing and copier services. These costs will continue to be charged directly and are included in the individual program or administrative budgets. The remaining costs within the Property Related Services cost pool will be allocated based on the square footage occupied by each area.
Library .
The law libraries in both San Francisco and Los Angeles are the next Administrative Cost Pool. The primary users of these libraries are judges, attorneys and paralegals. Thus, the law library costs will be allocated based on the number of judges, attorneys, and paralegals in each area.
Rr�is«d Indirect Cost Allocation M«thodology Draft Final Report Page 12 Deloitte &Touche
Appendix A

V • Administrative Cost Pools (Continued)
Human Resources
This cost center is responsible for all personnel related activities of the State Bar, including recruiting, promotions, benefits management, COBRA and training. Services are provided in both San Francisco and Los Angeles. As noted above, the costs of the payroll function of Finance will be included within the Human Resources cost pool. These costs will be allocated based on the number of FTEs in each area.
Information Technology
Information Technology provides various services to users, including programming, application support, personal computer support and telecommunications. Telecommunications charges are currently directly billed to the users, both the cost of the telephone and long distance charges. The major cost component within Information Technology is the maintenance of the computing capacity at the user workstation, the PC. The remaining costs (after telecommunications is removed) for Information Technology will be allocated based on FTEs, a proxy for PC use.
Rnued 11tliirect Cost AIIOCtJtlt»t MetlrodoiOID' Draft FiMI Report Page 13 Deloitte &Touche
Appendix A

VI · Model Results
The State Bar's estimated FY2002 Budget is $100,036,277.* Of these costs, a total of$24,574,294 is exempted from the allocation calculations for various reasons. A total of $17,087,142 are designated as part of the Administrative Cost Pools, leaving $58,374,841 as Program Area costs. Administrative Costs add 22.6% to the total direct costs of the Program Areas.
The following table shows the direct, allocated and total costs for each of the Program Areas. The details of the allocation are shown in the model, Appendix B.
Summary of Administrative Cost Allocations Fiscal Year 2002
Direct Allocated Total Costs Costs Costs
Program Area ,. ($000) ,. ($000) ,. ($000)
Discipline $31,986 $9,354 $41,340 Administration of Justice 747 202 949 Governance 1,322 2,276 3,598 Legal Services Access 1,240 290 1,530 Admin. of the Profession 682 281 963 Communicaitons 2,517 327 2,844 Admissions 8,702 2,002 10,705 Client Security Fund 962 515 1,477 Legal Services Trust 827 208 1,035 Equal Access Fund 330 10 340 Certifications Fund 1,341 317 1,659 Legal Speciafization 1,178 198 1,376 Sections 3,544 549 4,093 Annual Meeting 555 84 639 Conference of Delegates 118 14 132 legislative Activities 603 124 727 Elimination of Bias 385 74 459 Attorney Diversion 750 65 815 Legal Education 586 196 782 Program Area Total $58,375 $17,087 $75,462 E)(Bmpt Costs 1,943 22,631 24,574 Total Budget $60,318 $39,718 $100,036 Note: Totals may not sum do to rounding
• Source: State Bar draft 2002 budget. Total may not sum due to rounding.
Rnised lrtdinlct Cost Allocation Methodology Draft Final Report Page 14
Allocated as Percent
of Direct
22.6% 21.3% 63.3% 19.0% 29.2% 11.5% 18.7% 34.8% 20.1%
3.0% 19.1% 14.4% 13.4% 13.1% 10.5% 17.0% 16.1%
7.9% 25.1% 22.6%
Deloitte &Touche
Appendix A
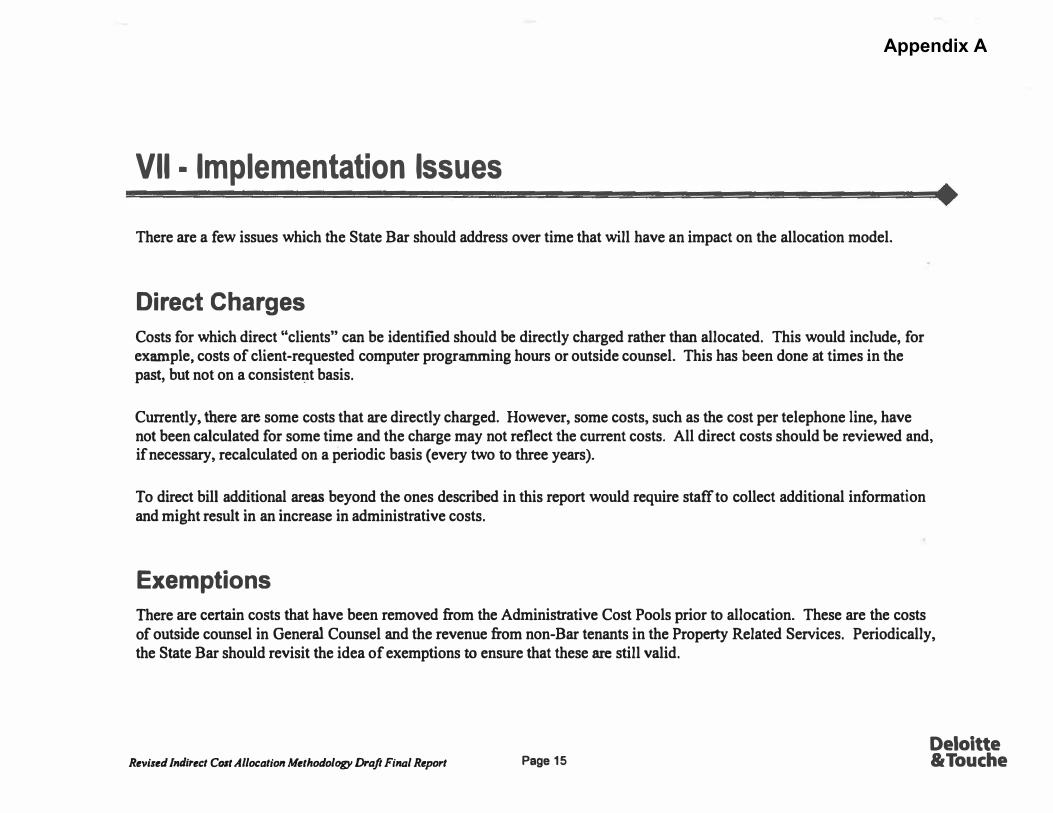
VII • Implementation Issues
There are a few issues which the State Bar should address over time that will have an impact on the allocation model.
Direct Charges
Costs for which direct "clients, can be identified should be directly charged rather than allocated. This would include, for example, costs of client-requested computer programming hours or outside counsel. This has been done at times in the past, but not on a consistent basis.
Currently, there are some costs that are directly charged. However, some costs, such as the cost per telephone line, have not been calculated for some time and the charge may not reflect the current costs. All direct costs should be reviewed and, if necessary, recalculated on a periodic basis (every two to three years).
To direct bill additional areas beyond the ones described in this report would require staff to collect additional information and might result in an increase in administrative costs.
Exemptions
There are certain costs that have been removed from the Administrative Cost Pools prior to allocation. These are the costs of outside counsel in General Counsel and the revenue from non-Bar tenants in the Property Related Services. Periodically, the State Bar should revisit the idea of exemptions to ensure that these are still valid.
Revised lrulirect C01t Allocation Methodology Dt-aft Firuzl Report Page 15 Deloitte &Touche
Appendix A

Appendix A · Cost Pools and Program Areas
Administrative Cost Pools Program Areas • Executive Director • Discipline
• General Counsel • Administration of Justice
• Board of Governors • Governance
• Appointments • Legal Services Access
• Communications • Administration of the Profession
• Administration and Support Management • Communications
• Finance • Admissions
• Membership Billing • Client Security Fund
• Property Related Services • Legal Services Trust Fund
• Library • Equal Access Fund
• Human Resources and Payroll • Certifications Fund
• Information Technology • Legal Specialization Fund • Sections Fund • Annual Meeting Fund • Conference of Delegates • Legislative Activities • Elimination of Bias Fund • Attorney Diversion and Assistance • Legal Education
Rnued Indirect Cost .Allocation Methodology Draft Final Report Page 16 Deloitte &Touche
Appendix A
Appendix B • Model Spreadsheet
• Spreadsheet submitted electronically.
Paga 17 Deloitte &Touche
Appendix A

INTRODUCTION
- 1 -
OVERVIEW
Purpose of the Cost Allocation Plan
The purpose of the City’s Cost Allocation Plan is to identify the total costs of
providing specific City services. Why is a separate cost accounting analysis
required to do this? Because in almost all organizations—whether in the
private or the public sector—the cost of producing goods or delivering
services can be classified into two basic categories: direct and indirect costs.
“Direct costs” by their nature are usually easy to identify and relate to a
specific service. However, this is not the case for “indirect costs.” As such,
if we want to know the “total cost” of providing a specific service, then we
need to develop an approach—a plan—for reasonably allocating indirect
costs to direct cost programs.
What Are Direct and Indirect Costs? Direct costs are those that can be
specifically identified with a particular cost objective, such as street
maintenance, police protection and water service. Indirect costs are not
readily identifiable with a direct operating program, but rather, are incurred
for a joint purpose that benefits more than one cost objective.
Common examples of indirect costs include accounting, purchasing, legal
services, personnel administration, insurance and building maintenance.
Although indirect costs are generally not readily identifiable with direct cost
programs, their cost should be included if we want to know the total cost of
delivering specific services.
Budgeting and Accounting for Indirect Costs. Theoretically, all indirect
costs could be directly charged to specific cost objectives; however, practical
difficulties generally preclude such an approach for organizational and
accounting reasons. As such, almost all organizations separately budget and
account for direct and indirect costs at some level depending on their
financial reporting needs and the complexity of their operations.
Distributing Indirect Costs. However, in order to determine the total cost of
delivering specific services, some methodology for determining and
distributing indirect costs must be developed, and that is the purpose of cost
allocation plans: to identify indirect costs and to allocate them to benefiting
direct cost programs in a logical, consistent and reasonable manner.
Plan Goal: Reasonable Allocation of Costs
It is important to stress that the goal of the Cost Allocation Plan is a
reasonable allocation of indirect costs, not a “perfect” one. By their very
nature, indirect costs are difficult to link with direct costs. As such, in
developing an allocation approach, it is important to keep this goal in mind
balancing the cost and of effort of complicated allocation methods with the
likely benefits from the end results.
Determining Direct and Indirect Costs
The first step in preparing the City's Cost Allocation Plan is determining
direct and indirect costs. Program costs that primarily provide service to the
public are identified as direct costs, whereas the cost of programs that
primarily provide services to the organization are identified as indirect costs.
Additionally, use allowance costs for facilities and equipment have also been
developed. In accordance with generally accepted accounting principles, only
operating costs are considered in preparing the Cost Allocation Plan. As
such, capital outlay, debt service, interfund transfers and “pass-through”
costs are excluded from the calculations.
ALLOCATING INDIRECT COSTS
For general purposes, the City-wide indirect cost rate can be used as the basis
for allocating indirect costs. The indirect cost rate is simply the ratio between
indirect and direct costs, which can be easily computed for the City as a
whole once the direct and indirect cost base has been determined.
Citywide Indirect Cost Rate
Provided in Table 1 (page 4) is a summary of direct and indirect costs for the
City of Greenfield based on the approved 2015-16 Budget along with the
resulting citywide indirect cost rate. By applying the overall indirect cost
rate to any specific direct cost program, the total cost of the program can be
determined. For example, with an overall indirect cost rate of 28.1%, the
total cost for a direct program of $100,000 in Greenfield would be $128,100
Appendix B.1
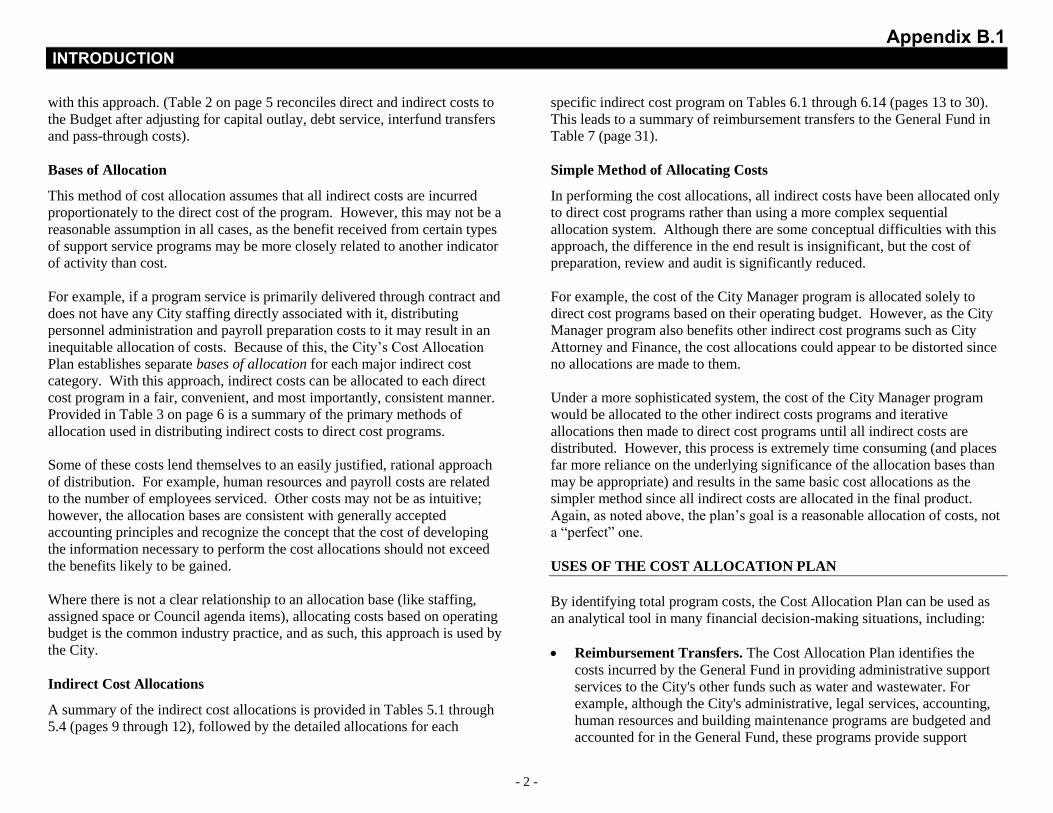
INTRODUCTION
- 2 -
with this approach. (Table 2 on page 5 reconciles direct and indirect costs to
the Budget after adjusting for capital outlay, debt service, interfund transfers
and pass-through costs).
Bases of Allocation
This method of cost allocation assumes that all indirect costs are incurred
proportionately to the direct cost of the program. However, this may not be a
reasonable assumption in all cases, as the benefit received from certain types
of support service programs may be more closely related to another indicator
of activity than cost.
For example, if a program service is primarily delivered through contract and
does not have any City staffing directly associated with it, distributing
personnel administration and payroll preparation costs to it may result in an
inequitable allocation of costs. Because of this, the City’s Cost Allocation
Plan establishes separate bases of allocation for each major indirect cost
category. With this approach, indirect costs can be allocated to each direct
cost program in a fair, convenient, and most importantly, consistent manner.
Provided in Table 3 on page 6 is a summary of the primary methods of
allocation used in distributing indirect costs to direct cost programs.
Some of these costs lend themselves to an easily justified, rational approach
of distribution. For example, human resources and payroll costs are related
to the number of employees serviced. Other costs may not be as intuitive;
however, the allocation bases are consistent with generally accepted
accounting principles and recognize the concept that the cost of developing
the information necessary to perform the cost allocations should not exceed
the benefits likely to be gained.
Where there is not a clear relationship to an allocation base (like staffing,
assigned space or Council agenda items), allocating costs based on operating
budget is the common industry practice, and as such, this approach is used by
the City.
Indirect Cost Allocations
A summary of the indirect cost allocations is provided in Tables 5.1 through
5.4 (pages 9 through 12), followed by the detailed allocations for each
specific indirect cost program on Tables 6.1 through 6.14 (pages 13 to 30).
This leads to a summary of reimbursement transfers to the General Fund in
Table 7 (page 31).
Simple Method of Allocating Costs
In performing the cost allocations, all indirect costs have been allocated only
to direct cost programs rather than using a more complex sequential
allocation system. Although there are some conceptual difficulties with this
approach, the difference in the end result is insignificant, but the cost of
preparation, review and audit is significantly reduced.
For example, the cost of the City Manager program is allocated solely to
direct cost programs based on their operating budget. However, as the City
Manager program also benefits other indirect cost programs such as City
Attorney and Finance, the cost allocations could appear to be distorted since
no allocations are made to them.
Under a more sophisticated system, the cost of the City Manager program
would be allocated to the other indirect costs programs and iterative
allocations then made to direct cost programs until all indirect costs are
distributed. However, this process is extremely time consuming (and places
far more reliance on the underlying significance of the allocation bases than
may be appropriate) and results in the same basic cost allocations as the
simpler method since all indirect costs are allocated in the final product.
Again, as noted above, the plan’s goal is a reasonable allocation of costs, not
a “perfect” one.
USES OF THE COST ALLOCATION PLAN
By identifying total program costs, the Cost Allocation Plan can be used as
an analytical tool in many financial decision-making situations, including:
Reimbursement Transfers. The Cost Allocation Plan identifies the
costs incurred by the General Fund in providing administrative support
services to the City's other funds such as water and wastewater. For
example, although the City's administrative, legal services, accounting,
human resources and building maintenance programs are budgeted and
accounted for in the General Fund, these programs provide support
Appendix B.1
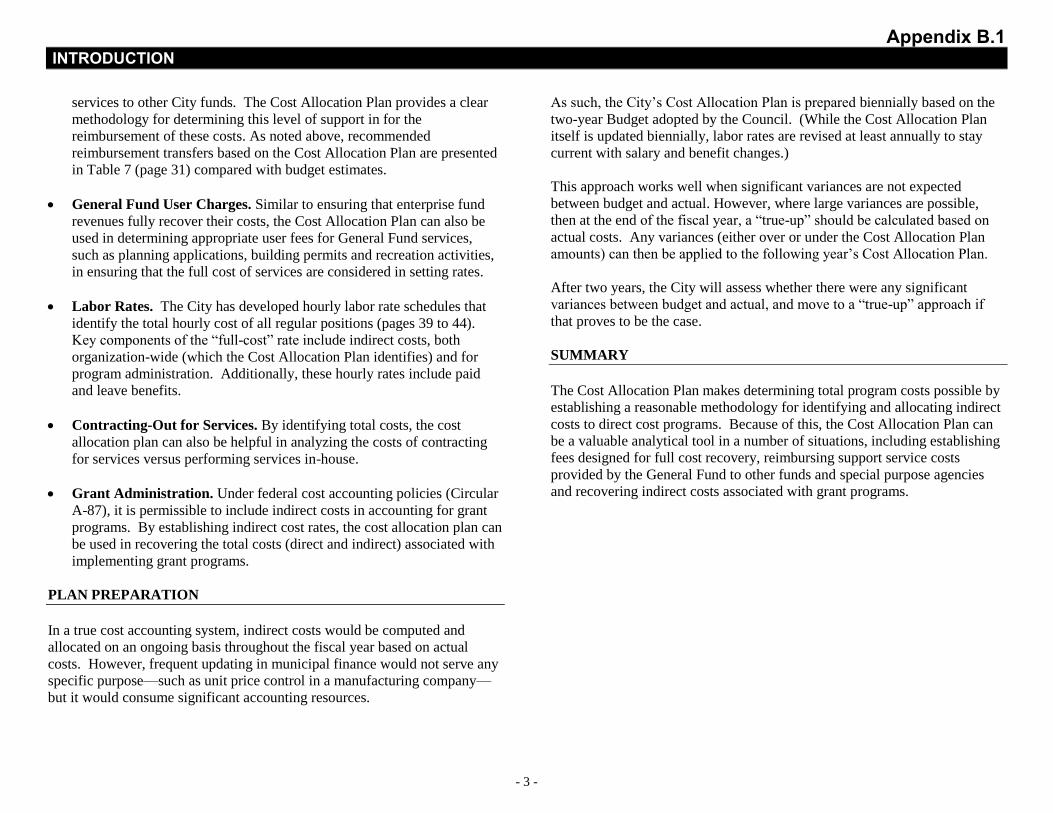
INTRODUCTION
- 3 -
services to other City funds. The Cost Allocation Plan provides a clear
methodology for determining this level of support in for the
reimbursement of these costs. As noted above, recommended
reimbursement transfers based on the Cost Allocation Plan are presented
in Table 7 (page 31) compared with budget estimates.
General Fund User Charges. Similar to ensuring that enterprise fund
revenues fully recover their costs, the Cost Allocation Plan can also be
used in determining appropriate user fees for General Fund services,
such as planning applications, building permits and recreation activities,
in ensuring that the full cost of services are considered in setting rates.
Labor Rates. The City has developed hourly labor rate schedules that
identify the total hourly cost of all regular positions (pages 39 to 44).
Key components of the “full-cost” rate include indirect costs, both
organization-wide (which the Cost Allocation Plan identifies) and for
program administration. Additionally, these hourly rates include paid
and leave benefits.
Contracting-Out for Services. By identifying total costs, the cost
allocation plan can also be helpful in analyzing the costs of contracting
for services versus performing services in-house.
Grant Administration. Under federal cost accounting policies (Circular
A-87), it is permissible to include indirect costs in accounting for grant
programs. By establishing indirect cost rates, the cost allocation plan can
be used in recovering the total costs (direct and indirect) associated with
implementing grant programs.
PLAN PREPARATION
In a true cost accounting system, indirect costs would be computed and
allocated on an ongoing basis throughout the fiscal year based on actual
costs. However, frequent updating in municipal finance would not serve any
specific purpose—such as unit price control in a manufacturing company—
but it would consume significant accounting resources.
As such, the City’s Cost Allocation Plan is prepared biennially based on the
two-year Budget adopted by the Council. (While the Cost Allocation Plan
itself is updated biennially, labor rates are revised at least annually to stay
current with salary and benefit changes.)
This approach works well when significant variances are not expected
between budget and actual. However, where large variances are possible,
then at the end of the fiscal year, a “true-up” should be calculated based on
actual costs. Any variances (either over or under the Cost Allocation Plan
amounts) can then be applied to the following year’s Cost Allocation Plan.
After two years, the City will assess whether there were any significant
variances between budget and actual, and move to a “true-up” approach if
that proves to be the case.
SUMMARY
The Cost Allocation Plan makes determining total program costs possible by
establishing a reasonable methodology for identifying and allocating indirect
costs to direct cost programs. Because of this, the Cost Allocation Plan can
be a valuable analytical tool in a number of situations, including establishing
fees designed for full cost recovery, reimbursing support service costs
provided by the General Fund to other funds and special purpose agencies
and recovering indirect costs associated with grant programs.
Appendix B.1
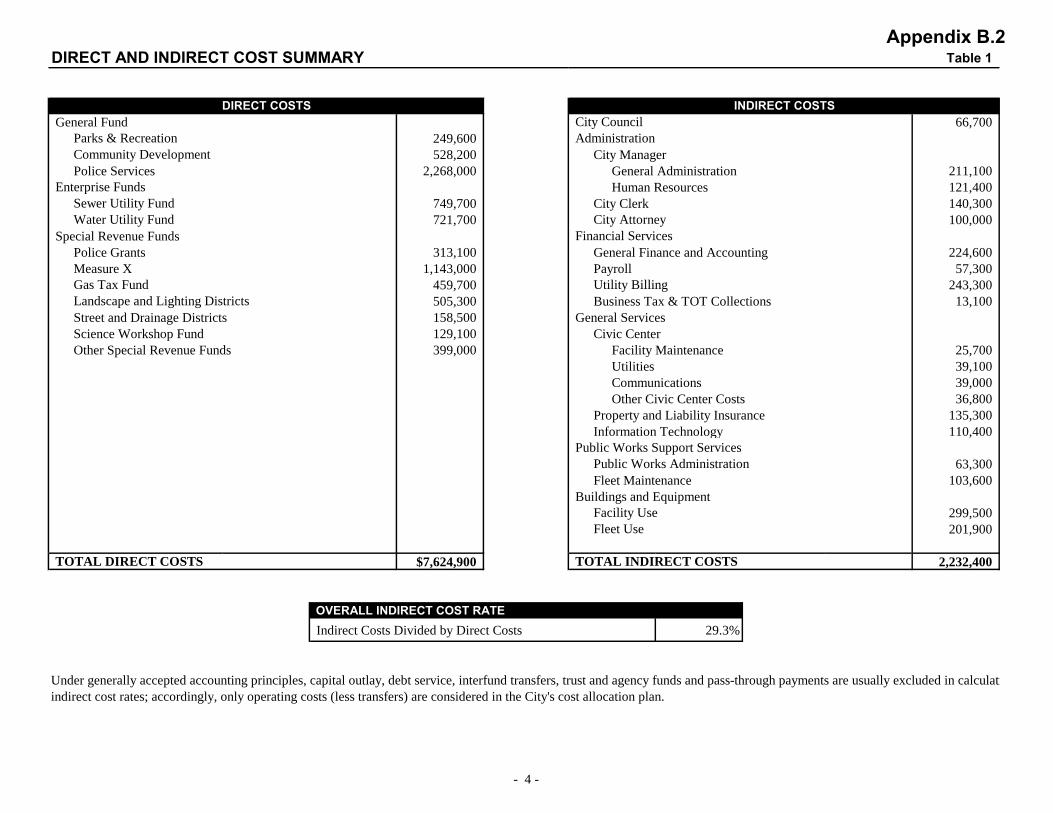
DIRECT AND INDIRECT COST SUMMARY Table 1
General Fund City Council 66,700
Parks & Recreation 249,600 Administration
Community Development 528,200 City Manager
Police Services 2,268,000 General Administration 211,100
Enterprise Funds Human Resources 121,400
Sewer Utility Fund 749,700 City Clerk 140,300
Water Utility Fund 721,700 City Attorney 100,000
Special Revenue Funds Financial Services
Police Grants 313,100 General Finance and Accounting 224,600
Measure X 1,143,000 Payroll 57,300
Gas Tax Fund 459,700 Utility Billing 243,300
Landscape and Lighting Districts 505,300 Business Tax & TOT Collections 13,100
Street and Drainage Districts 158,500 General Services
Science Workshop Fund 129,100 Civic Center
Other Special Revenue Funds 399,000 Facility Maintenance 25,700
Utilities 39,100
Communications 39,000
Other Civic Center Costs 36,800
Property and Liability Insurance 135,300
Information Technology 110,400
Public Works Support Services
Public Works Administration 63,300
Fleet Maintenance 103,600
Buildings and Equipment
Facility Use 299,500
Fleet Use 201,900
TOTAL DIRECT COSTS $7,624,900 TOTAL INDIRECT COSTS 2,232,400
OVERALL INDIRECT COST RATE
Indirect Costs Divided by Direct Costs 29.3%
Under generally accepted accounting principles, capital outlay, debt service, interfund transfers, trust and agency funds and pass-through payments are usually excluded in calculating
indirect cost rates; accordingly, only operating costs (less transfers) are considered in the City's cost allocation plan.
DIRECT COSTS INDIRECT COSTS
- 4 -
Appendix B.2
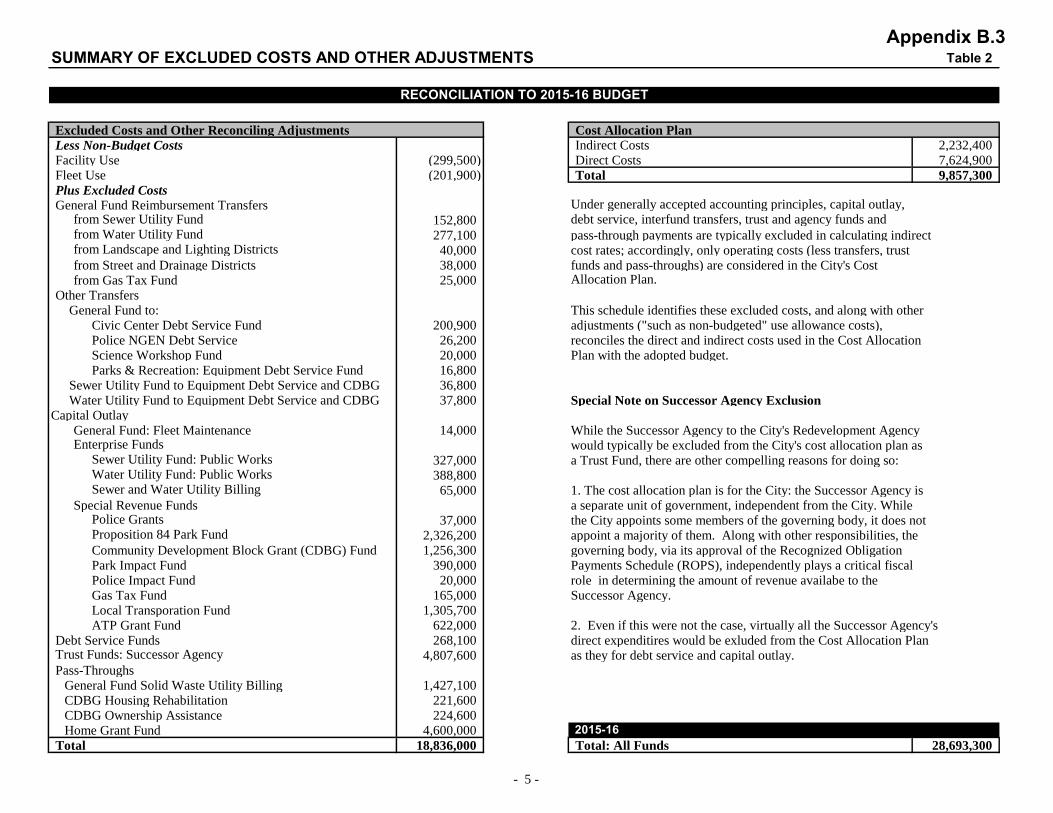
SUMMARY OF EXCLUDED COSTS AND OTHER ADJUSTMENTS Table 2
Excluded Costs and Other Reconciling Adjustments Cost Allocation Plan
Less Non-Budget Costs Indirect Costs 2,232,400 Facility Use (299,500) Direct Costs 7,624,900 Fleet Use (201,900) Total 9,857,300
Plus Excluded Costs
General Fund Reimbursement Transfers Under generally accepted accounting principles, capital outlay,from Sewer Utility Fund 152,800 debt service, interfund transfers, trust and agency funds andfrom Water Utility Fund 277,100 pass-through payments are typically excluded in calculating indirectfrom Landscape and Lighting Districts 40,000 cost rates; accordingly, only operating costs (less transfers, trustfrom Street and Drainage Districts 38,000 funds and pass-throughs) are considered in the City's Costfrom Gas Tax Fund 25,000 Allocation Plan.
Other TransfersGeneral Fund to: This schedule identifies these excluded costs, and along with other
Civic Center Debt Service Fund 200,900 adjustments ("such as non-budgeted" use allowance costs),Police NGEN Debt Service 26,200 reconciles the direct and indirect costs used in the Cost AllocationScience Workshop Fund 20,000 Plan with the adopted budget.Parks & Recreation: Equipment Debt Service Fund 16,800
Sewer Utility Fund to Equipment Debt Service and CDBG 36,800 Water Utility Fund to Equipment Debt Service and CDBG 37,800 Special Note on Successor Agency Exclusion
Capital OutlayGeneral Fund: Fleet Maintenance 14,000 While the Successor Agency to the City's Redevelopment AgencyEnterprise Funds would typically be excluded from the City's cost allocation plan as
Sewer Utility Fund: Public Works 327,000 a Trust Fund, there are other compelling reasons for doing so:Water Utility Fund: Public Works 388,800 Sewer and Water Utility Billing 65,000 1. The cost allocation plan is for the City: the Successor Agency is
Special Revenue Funds a separate unit of government, independent from the City. WhilePolice Grants 37,000 the City appoints some members of the governing body, it does notProposition 84 Park Fund 2,326,200 appoint a majority of them. Along with other responsibilities, theCommunity Development Block Grant (CDBG) Fund 1,256,300 governing body, via its approval of the Recognized ObligationPark Impact Fund 390,000 Payments Schedule (ROPS), independently plays a critical fiscalPolice Impact Fund 20,000 role in determining the amount of revenue availabe to theGas Tax Fund 165,000 Successor Agency.Local Transporation Fund 1,305,700 ATP Grant Fund 622,000 2. Even if this were not the case, virtually all the Successor Agency's
Debt Service Funds 268,100 direct expenditires would be exluded from the Cost Allocation PlanTrust Funds: Successor Agency 4,807,600 as they for debt service and capital outlay.Pass-Throughs
General Fund Solid Waste Utility Billing 1,427,100CDBG Housing Rehabilitation 221,600CDBG Ownership Assistance 224,600Home Grant Fund 4,600,000 2015-16
Total 18,836,000 Total: All Funds 28,693,300
RECONCILIATION TO 2015-16 BUDGET
- 5 -
Appendix B.3

BASIS OF INDIRECT COST ALLOCATIONS Table 3
INDIRECT COST PROGRAM BASIS OF ALLOCATION
City Council Council Agenda Items
Administration
City Manager
General Administration Operating Budget
Human Resources Full-Time Equivalent Staffing
City Clerk Council Agenda Items
City Attorney Operating Budget
Financial Services
General Finance and Accounting Operating Budget
Payroll Full-Time Equivalent Staffing
Business Tax & TOT Collections General Fund Operating Budget
Utility Billing Water and Sewer Funds
General Services
Civic Center
Facility Maintenance Assigned Space/Operating Budget
Utilities Assigned Space/Operating Budget
Communications Assigned Telephones
Other Civic Center Costs Operating Budget
Property and Liability Insurance Full-Time Equivalent Staffing
Information Technology Assigned Computers
Public Works Support Services
Public Works Administration Assigned Programs Operating Budget
Fleet Maintenance Value of Assigned Vehicles
Buildings and Equipment
Facility Use Assigned Space/Operating Budget
Fleet Use Assigned Vehicles
- 6 -
Appendix B.4

SUMMARY OF INDIRECT COST ALLOCATIONS Table 5.1
Special
General Enterprise Revenue
Fund Funds Funds Total
City Council 30,400 8,600 27,700 66,700
Administration
City Manager
General Administration 84,300 40,800 86,000 211,100
Human Resources 46,300 25,400 49,700 121,400
City Clerk 64,200 18,000 58,100 140,300
City Attorney 40,000 19,300 40,700 100,000
Financial Services
General Finance and Accounting 89,600 43,400 91,600 224,600
Payroll 21,900 12,000 23,400 57,300
Utility Billing - 243,300 - 243,300
Business Tax & TOT Collections 13,100 - - 13,100
General Services
Civic Center
Facility Maintenance 19,800 2,000 3,900 25,700
Utilities 30,400 3,100 5,600 39,100
Communications 35,300 3,000 700 39,000
Other Civic Center Costs 14,800 7,100 14,900 36,800
Property and Liability Insurance 51,800 28,300 55,200 135,300
Information Technology 102,600 6,200 1,600 110,400
Public Works Support Services
Public Works Administration 5,300 31,300 26,700 63,300
Fleet Maintenance 38,200 32,600 32,800 103,600
Buildings and Equipment
Facility Use 232,900 23,000 43,600 299,500
Fleet Use 56,500 99,500 45,900 201,900
TOTAL INDIRECT COSTS 977,400 646,900 608,100 2,232,400
Total Direct Costs 3,045,800 1,471,400 3,107,700 7,624,900
Total Costs 4,023,200 $2,118,300 $3,715,800 $9,857,300
Indirect Cost Rate 32.1% 44.0% 19.6% 29.3%
INDIRECT COST ALLOCATION SUMMARY
- 9 -
Appendix B.5

SUMMARY OF INDIRECT COST ALLOCATIONS Table 5.3
Sewer Water Total
City Council 1,000 7,600 8,600
Administration
City Manager
General Administration 20,800 20,000 40,800
Human Resources 17,000 8,400 25,400
City Clerk 2,000 16,000 18,000
City Attorney 9,800 9,500 19,300
Financial Services
General Finance and Accounting 22,100 21,300 43,400
Payroll 8,000 4,000 12,000
Utility Billing 121,650 121,650 243,300
Business Tax & TOT Collections
General Services
Civic Center
Facility Maintenance 1,000 1,000 2,000
Utilities 1,600 1,500 3,100
Communications 1,500 1,500 3,000
Other Civic Center Costs 3,600 3,500 7,100
Property and Liability Insurance 18,900 9,400 28,300
Information Technology 3,100 3,100 6,200
Public Works Support Services
Public Works Administration 15,900 15,400 31,300
Fleet Maintenance 15,100 17,500 32,600
Buildings and Equipment
Facility Use 11,700 11,300 23,000
Fleet Use 55,400 44,100 99,500
TOTAL INDIRECT COSTS 330,150 316,750 646,900
Total Direct Costs 749,700 721,700 1,471,400
Total Costs 1,079,850 1,038,450 2,118,300
Indirect Cost Rate 44.0% 43.9% 44.0%
ENTERPRISE FUNDS
- 11 -
Appendix B.6

INDIRECT PROGRAM COST ALLOCATION Table 6.2(a)
Indirect Cost Program City Manager: General Administration
Budget $211,100
Base of Allocation Operating Budget
Base of Percent Cost
Direct Cost Program Allocation of Total Allocation
General Fund
Parks & Recreation 249,600 3.3% 6,900
Community Development 528,200 6.9% 14,600
Police Services 2,268,000 29.7% 62,800
Enterprise Funds
Sewer Utility Fund 749,700 9.8% 20,800
Water Utility Fund 721,700 9.5% 20,000
Special Revenue Funds
Police Grants 313,100 4.1% 8,700
Measure X 1,143,000 15.0% 31,600
Gas Tax Fund 459,700 6.0% 12,700
Landscape and Lighting Districts 505,300 6.6% 14,000
Street and Drainage Districts 158,500 2.1% 4,400
Science Workshop Fund 129,100 1.7% 3,600
Other Special Revenue Funds 399,000 5.2% 11,000
Total Direct Cost Programs 7,624,900 100.0% $211,100
- 14 -
Appendix B.7a

INDIRECT PROGRAM COST ALLOCATION Table 6.2(b)
Indirect Cost Program City Manager: Human Resources
Budget $121,400
Base of Allocation Full-Time Equivalent Staffing
Base of Percent Cost
Direct Cost Program Allocation of Total Allocation
General Fund
Parks & Recreation 0.7 1.6% 2,000
Community Development 1.4 3.1% 3,800
Police Services 14.4 33.5% 40,500
Enterprise Funds
Sewer Utility Fund 6.0 14.0% 17,000
Water Utility Fund 3.0 7.0% 8,400
Special Revenue Funds
Police Grants 2.0 4.7% 5,700
Measure X 10.0 23.3% 28,300
Gas Tax Fund 3.1 7.2% 8,700
Landscape and Lighting Districts 0.1 0.3% 400
Street and Drainage Districts 0.3 0.7% 900
Science Workshop Fund 2.0 4.7% 5,700
Other Special Revenue Funds
Total Direct Cost Programs 42.9 100.0% $121,400
- 15 -
Appendix B.7b
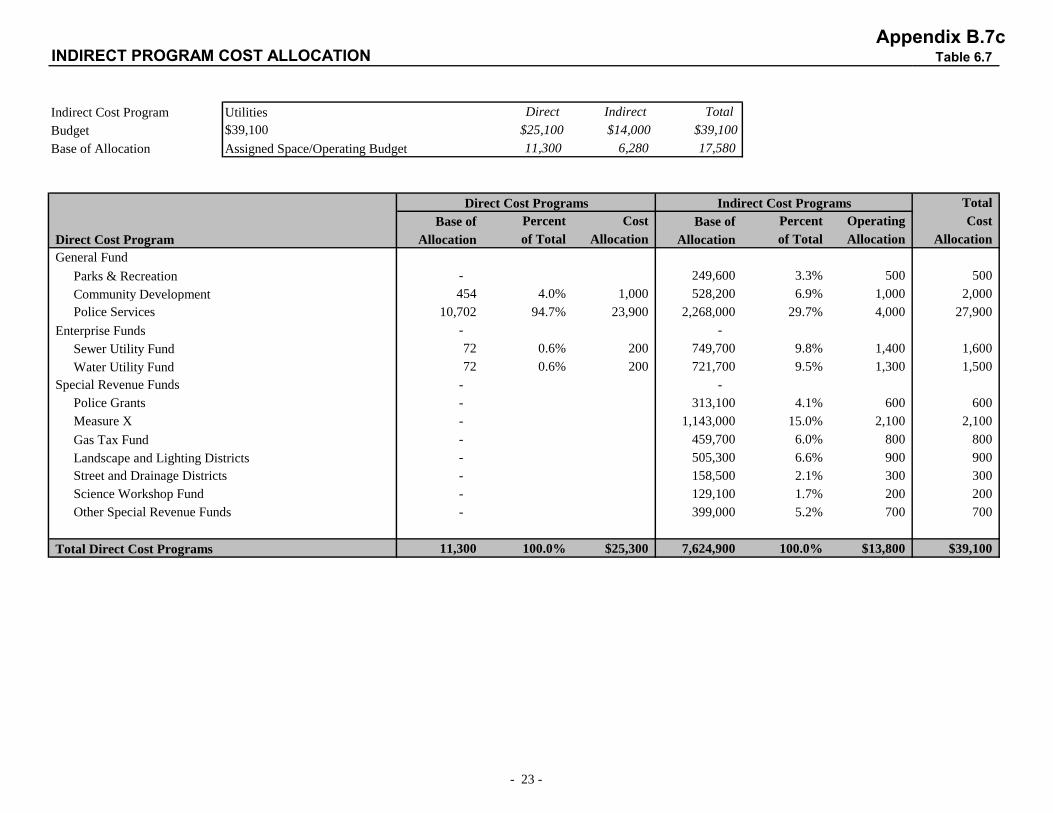
INDIRECT PROGRAM COST ALLOCATION Table 6.7
Indirect Cost Program Utilities Direct Indirect Total
Budget $39,100 $25,100 $14,000 $39,100
Base of Allocation Assigned Space/Operating Budget 11,300 6,280 17,580
Total
Base of Percent Cost Base of Percent Operating Cost
Direct Cost Program Allocation of Total Allocation Allocation of Total Allocation Allocation
General Fund
Parks & Recreation - 249,600 3.3% 500 500
Community Development 454 4.0% 1,000 528,200 6.9% 1,000 2,000
Police Services 10,702 94.7% 23,900 2,268,000 29.7% 4,000 27,900
Enterprise Funds - -
Sewer Utility Fund 72 0.6% 200 749,700 9.8% 1,400 1,600
Water Utility Fund 72 0.6% 200 721,700 9.5% 1,300 1,500
Special Revenue Funds - -
Police Grants - 313,100 4.1% 600 600
Measure X - 1,143,000 15.0% 2,100 2,100
Gas Tax Fund - 459,700 6.0% 800 800
Landscape and Lighting Districts - 505,300 6.6% 900 900
Street and Drainage Districts - 158,500 2.1% 300 300
Science Workshop Fund - 129,100 1.7% 200 200
Other Special Revenue Funds - 399,000 5.2% 700 700
Total Direct Cost Programs 11,300 100.0% $25,300 7,624,900 100.0% $13,800 $39,100
Direct Cost Programs Indirect Cost Programs
- 23 -
Appendix B.7c
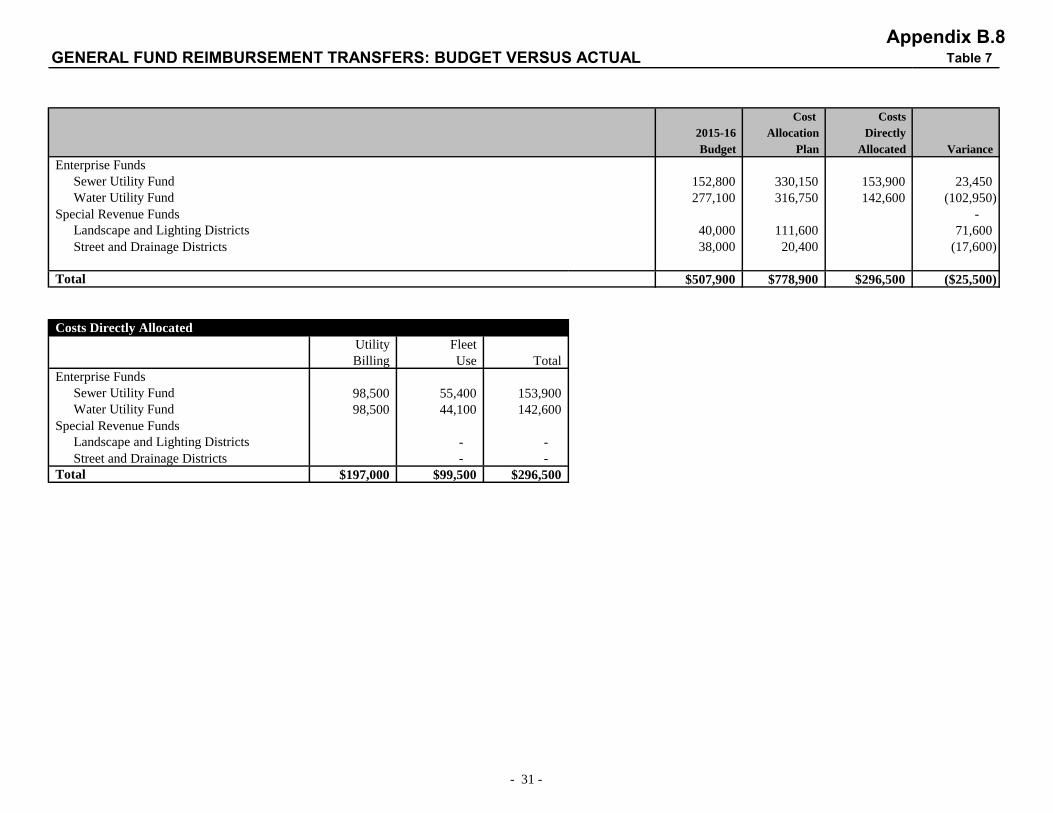
GENERAL FUND REIMBURSEMENT TRANSFERS: BUDGET VERSUS ACTUAL Table 7
Cost Costs
2015-16 Allocation Directly
Budget Plan Allocated Variance
Enterprise Funds
Sewer Utility Fund 152,800 330,150 153,900 23,450
Water Utility Fund 277,100 316,750 142,600 (102,950)
Special Revenue Funds -
Landscape and Lighting Districts 40,000 111,600 71,600
Street and Drainage Districts 38,000 20,400 (17,600)
Total $507,900 $778,900 $296,500 ($25,500)
Costs Directly Allocated
Utility Fleet
Billing Use Total
Enterprise Funds
Sewer Utility Fund 98,500 55,400 153,900
Water Utility Fund 98,500 44,100 142,600
Special Revenue Funds
Landscape and Lighting Districts - -
Street and Drainage Districts - -
Total $197,000 $99,500 $296,500
- 31 -
Appendix B.8

ALLOCATION BASES: FULL-TIME EQUIVALENT STAFFING Table 8.2
General Fund City Council 5.00
Parks & Recreation 0.70 Administration
Community Development 1.35 City Manager 2.00
Police Services 14.36 General Administration
Enterprise Funds Human Resources
Sewer Utility Fund 6.01 City Clerk 1.00
Water Utility Fund 2.99 City Attorney
Special Revenue Funds Financial Services 3.00
Police Grants 2.00 General Finance and Accounting
Measure X 10.00 Payroll
Gas Tax Fund 3.09 Utility Billing
Landscape and Lighting Districts 0.13 Business Tax & TOT Collections
Street and Drainage Districts 0.31 General Services
Science Workshop Fund 2.00 Civic Center
Other Special Revenue Funds Facility Maintenance
Utilities
Communications
Other Costs
Property and Liability Insurance
Information Technology
Public Works Support Services
Public Works Administration 0.43
Fleet Maintenance 1.00
Buildings and Equipment
Facility Use
Fleet Use
TOTAL DIRECT COSTS 42.93 TOTAL INDIRECT COSTS 12.43
TOTAL 55.36
DIRECT COSTS INDIRECT COSTS
- 33 -
Appendix B.9
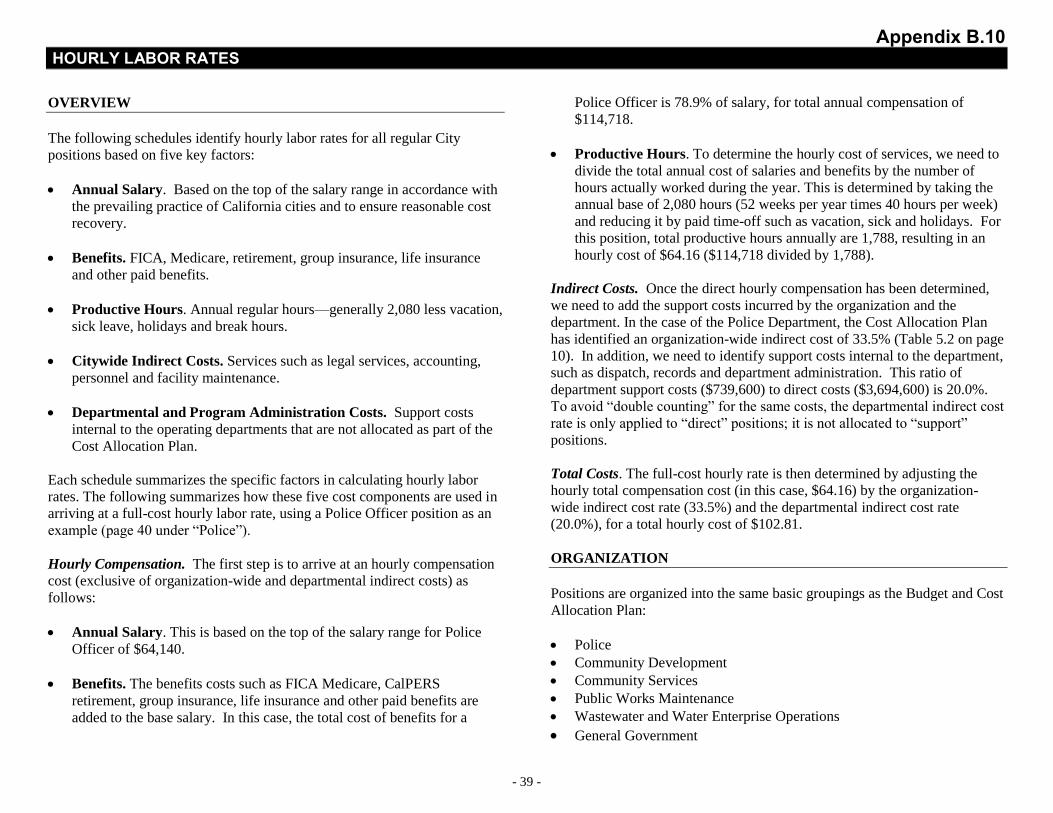
HOURLY LABOR RATES
- 39 -
OVERVIEW
The following schedules identify hourly labor rates for all regular City
positions based on five key factors:
Annual Salary. Based on the top of the salary range in accordance with
the prevailing practice of California cities and to ensure reasonable cost
recovery.
Benefits. FICA, Medicare, retirement, group insurance, life insurance
and other paid benefits.
Productive Hours. Annual regular hours—generally 2,080 less vacation,
sick leave, holidays and break hours.
Citywide Indirect Costs. Services such as legal services, accounting,
personnel and facility maintenance.
Departmental and Program Administration Costs. Support costs
internal to the operating departments that are not allocated as part of the
Cost Allocation Plan.
Each schedule summarizes the specific factors in calculating hourly labor
rates. The following summarizes how these five cost components are used in
arriving at a full-cost hourly labor rate, using a Police Officer position as an
example (page 40 under “Police”).
Hourly Compensation. The first step is to arrive at an hourly compensation
cost (exclusive of organization-wide and departmental indirect costs) as
follows:
Annual Salary. This is based on the top of the salary range for Police
Officer of $64,140.
Benefits. The benefits costs such as FICA Medicare, CalPERS
retirement, group insurance, life insurance and other paid benefits are
added to the base salary. In this case, the total cost of benefits for a
Police Officer is 78.9% of salary, for total annual compensation of
$114,718.
Productive Hours. To determine the hourly cost of services, we need to
divide the total annual cost of salaries and benefits by the number of
hours actually worked during the year. This is determined by taking the
annual base of 2,080 hours (52 weeks per year times 40 hours per week)
and reducing it by paid time-off such as vacation, sick and holidays. For
this position, total productive hours annually are 1,788, resulting in an
hourly cost of $64.16 ($114,718 divided by 1,788).
Indirect Costs. Once the direct hourly compensation has been determined,
we need to add the support costs incurred by the organization and the
department. In the case of the Police Department, the Cost Allocation Plan
has identified an organization-wide indirect cost of 33.5% (Table 5.2 on page
10). In addition, we need to identify support costs internal to the department,
such as dispatch, records and department administration. This ratio of
department support costs ($739,600) to direct costs ($3,694,600) is 20.0%.
To avoid “double counting” for the same costs, the departmental indirect cost
rate is only applied to “direct” positions; it is not allocated to “support”
positions.
Total Costs. The full-cost hourly rate is then determined by adjusting the
hourly total compensation cost (in this case, $64.16) by the organization-
wide indirect cost rate (33.5%) and the departmental indirect cost rate
(20.0%), for a total hourly cost of $102.81.
ORGANIZATION
Positions are organized into the same basic groupings as the Budget and Cost
Allocation Plan:
Police
Community Development
Community Services
Public Works Maintenance
Wastewater and Water Enterprise Operations
General Government
Appendix B.10

POLICE LABOR RATESAnnual Paid Total Productive Hourly Hourly
Salary Benefits Rate Compensation Hours Rate Citywide * Program Billing Rate
Patrol Services
Police Officer $64,140 78.9% $114,718 1,788.0 $64.16 33.5% 20.0% $102.81
Police Sergeant 77,304 78.9% 138,263 1,788.0 77.33 33.5% 20.0% 123.92
Police Admin
Police Chief 135,200 35.7% 183,439 1,788.0 102.59 33.5% 0.0% 136.98
Police Commander 110,000 35.7% 149,248 1,676.3 89.04 33.5% 0.0% 118.88
Records Supervisor 57,624 52.1% 87,632 1,676.3 52.28 33.5% 0.0% 69.80
Police Services Technician 44,640 52.1% 67,886 1,676.3 40.50 33.5% 0.0% 54.07
Paid Benefits and Productive Hours Program Indirect Cost Rate
Non-Sworn Police Administration 524,600
Management Other Office Dispatch 215,000
Total Paid Benefits Rate 35.7% 78.9% 52.1% Program Indirect Costs 739,600
Fica and Medicare 7.65% 7.65% 7.65% Other Police Costs 3,694,600
Health Insurance 8.48% 13.52% 23.89% Police Direct Costs $4,434,200
Life/LTD Insurance 0.28% 0.40% 0.39% Program Indirect Cost Rate 20.0%
Retirement 11.15% 32.59% 12.62%
Workers Compensation 8.11% 10.98% 6.78% * Program indirect costs are not allocated to
POST Incentive 0.00% 5.00% 0.00% support positions.
Uniform 0.00% 1.22% 0.75%
Special Assignment Pay 0.00% 7.50% 0.00%
Total Productive Hours 1,788.0 1,788.0 1,676.3
Total Days (2080 hours) 260.0 260.0 260.0
Vacation Leave * (15.0) (15.0) (15.0)
Sick Leave ** (7.5) (7.5) (7.5)
Holidays (14.0) (14.0) (14.0)
Productive Days 223.5 223.5 223.5
Productive Hours 1,788.0 1,788.0 1,788.0
Breaks (30 minutes daily) (111.8)
* Based on five years of service
** Based on 50% use of accrual
Sworn
Indirect Cost Rate
- 40 -
Appendix B.10

Attachment B
Indirect Cost Allocation Plan Review –
Summary of Recommendations and Implementation Status
Recommendations Status
1. Allocate out 100% of indirect costs Implemented
2. Communication costs should be considered as direct costs instead of indirect costs Implemented
3. Allocate indirect costs at fund level/major program areas Implemented
4. One-step versus sequential allocation process No Changes
5. Monthly cost allocation based on budget and annual true-up Will implement in 2016
6. Allocation of capital improvement cost and debt service Pending Board decision
7. Board adoption of Indirect Cost Plan Presented
8. Set cost recovery policy Will implement in 2016
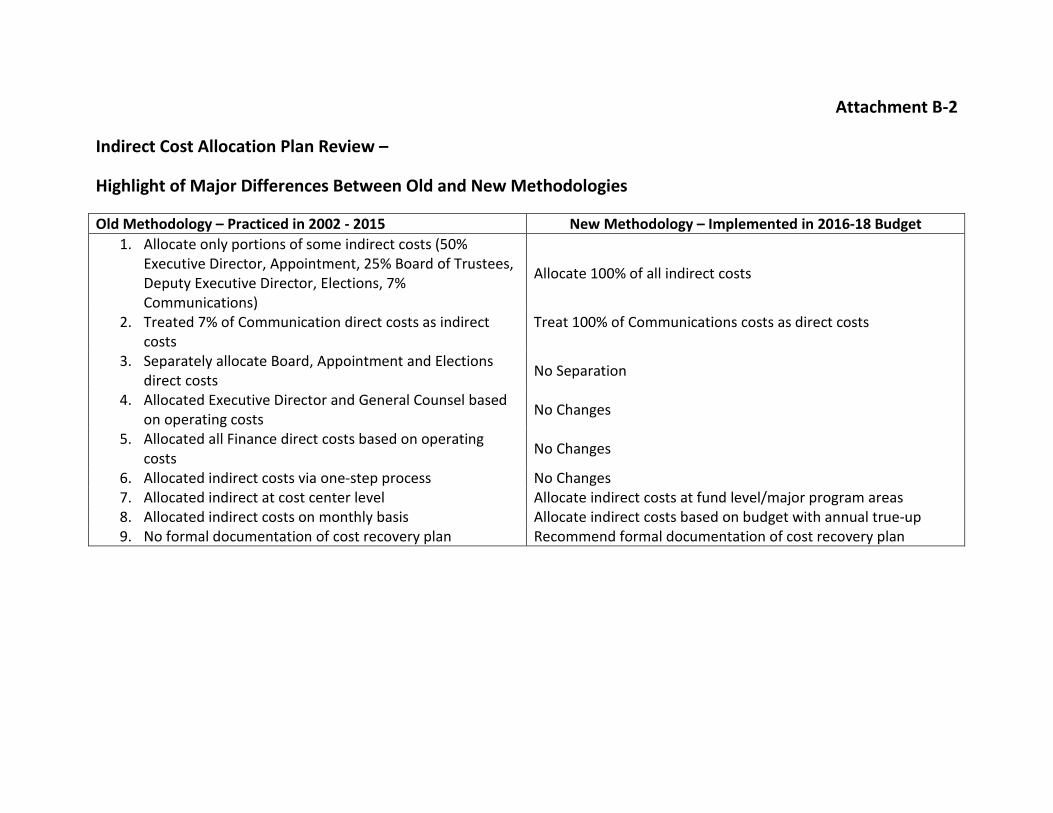
Attachment B-2
Indirect Cost Allocation Plan Review –
Highlight of Major Differences Between Old and New Methodologies
Old Methodology – Practiced in 2002 - 2015 New Methodology – Implemented in 2016-18 Budget 1. Allocate only portions of some indirect costs (50%
Executive Director, Appointment, 25% Board of Trustees, Deputy Executive Director, Elections, 7% Communications)
Allocate 100% of all indirect costs
2. Treated 7% of Communication direct costs as indirect costs
Treat 100% of Communications costs as direct costs
3. Separately allocate Board, Appointment and Elections direct costs No Separation
4. Allocated Executive Director and General Counsel based on operating costs No Changes
5. Allocated all Finance direct costs based on operating costs No Changes
6. Allocated indirect costs via one-step process No Changes 7. Allocated indirect at cost center level Allocate indirect costs at fund level/major program areas 8. Allocated indirect costs on monthly basis Allocate indirect costs based on budget with annual true-up 9. No formal documentation of cost recovery plan Recommend formal documentation of cost recovery plan

Cost Allocation Plan - 2016 Budget Attachment C-1
Administrative Area Allocation BasisGeneral Fund
(10)Annual Mtg Fund (14)
Legislative Activities Fund
(16)
Elimination of Bias / Bar
Relations Fund (17)
Legal Educ and Dev Fund
(18)Admissions Fund (20)
Lawyer Assistance
Program Fund (21)
Legal Spec Fund (24)
Client Security Fund (27)
Legal Service Trust Fund
(28)Equal Access
Fund (29)Justice Gap Fund (32)
Sections Funds (70-89)
Total Indirect Cost Pool
Membership Billing Revenues 1,488,065 - 16,959 17,418 - - 45,138 - 171,662 141,467 - 22,783 131,308 2,034,800
Board of Trustees/ Actual Direct Costs as % of 148,014 1,667 1,281 2,474 876 49,360 3,345 3,028 4,622 4,208 562 - 18,964 238,400 Election Total State Bar Direct Costs
Appointments Actual Direct Costs as % of 62,645 706 542 1,047 371 20,891 1,416 1,281 1,956 1,781 238 - 8,026 100,900 Total State Bar Direct Costs
Property Related-SF Square Footage 3,097,242 - 43,319 86,638 35,380 984,986 22,008 169,794 - 180,520 - - 393,214 5,013,100 Property Related-LA Square Footage 3,685,083 - - 26,546 - 661,404 106,186 - 132,281 - - - - 4,611,500
General Counsel FTE 3,544,375 16,189 20,236 40,472 8,094 647,559 70,827 80,945 111,299 111,299 - - 197,303 4,848,600
Executive Director Actual Direct Costs as % of 1,381,613 15,563 11,955 23,092 8,176 460,739 31,227 28,263 43,140 39,275 5,246 - 177,012 2,225,300 Total State Bar Direct Costs
Library # of Attorneys 673,079 - - - - - - - 26,421 - - - - 699,500
Human Resources FTE 1,121,077 5,121 6,401 12,801 2,560 204,821 22,402 25,603 35,204 35,204 - - 62,407 1,533,600
Information TechnologyFTE 4,717,792 21,549 26,936 53,871 10,774 861,943 94,275 107,743 148,146 148,146 - - 262,623 6,453,800
Finance Actual Direct Costs as % of 1,950,575 21,972 16,879 32,601 11,543 650,475 44,086 39,902 60,906 55,449 7,406 - 249,907 3,141,700 Total State Bar Direct Costs
Non-Departmental 276,099 3,110 2,389 4,615 1,634 92,073 6,240 5,648 8,621 7,849 1,048 - 35,374 444,700
Total Cost Allocated 22,145,660 85,876 146,897 301,576 79,408 4,634,251 447,150 462,206 744,258 725,197 14,500 22,783 1,536,136 31,345,900
Total Direct Costs: 80,768,659
% of Total Direct Costs: 27.4% 0.1% 0.2% 0.4% 0.1% 5.7% 0.6% 0.6% 0.9% 0.9% 0.0% 0.0% 1.9%
Allocation basesMembership Billing – Fund Membership Dues received as a percentage of total State Bar Membership Dues.Actual Direct Costs as % of Total State Bar Direct Costs – Fund Direct Costs as a percentage of total State Bar Direct Costs Square Footage – Fund Square Footage Occupancy as a percentage of total building square footage. FTEs – Fund FTEs as a percentage of total direct cost center FTEs
2016 Indirect Costs Allocated
Revised Cost Allocation Plan

Cost Allocation Plan - 2015 Actual Attachment C-2
Administrative Area Allocation BasisGeneral Fund
(10)
Annual Mtg Fund
(14)
Legislative Activities Fund (16)
Elimination of Bias / Bar Relations Fund (17)
Legal Educ and Dev Fund
(18)Admissions Fund (20)
Lawyer Assistance Program Fund (21)
Legal Spec Fund (24)
Client Security
Fund (27)
Legal Service Trust Fund
(28)Equal Access
Fund (29)Justice Gap Fund (32)
Sections Funds (70-
89)Total Indirect
Cost Pool
Membership Billing Revenues 1,300,562 - 14,822 15,224 - - 39,450 - 150,032 123,642 - 19,912 114,763 1,778,406
Board of Trustees/ Actual Direct Costs as % of 142,552 2,416 1,217 2,414 1,599 48,405 3,620 3,459 5,085 2,940 1,232 - 21,149 236,088 Election Total State Bar Direct Costs
Appointments Number 12,887 - 4,250 1,371 1,782 548 137 8,637 548 1,234 - - 18,782 50,177
Property Related-SF Square Footage 2,897,815 - 40,519 81,038 33,110 921,549 20,591 158,888 - 168,898 - - 367,892 4,690,300 Property Related-LA Square Footage 4,869,835 - - 35,081 - 874,045 140,325 - 174,809 - - - - 6,094,095
General Counsel FTE 2,774,948 23,995 16,838 33,677 6,735 471,472 58,934 67,353 92,611 67,353 - - 135,969 3,749,884
Executive Director Actual Direct Costs as % of 220,662 3,739 1,883 3,736 2,475 74,928 5,604 5,354 7,872 4,550 1,907 - 32,737 365,450 Total State Bar Direct Costs
Library # of Attorneys 528,155 - - - - - - - 20,732 - - - - 548,887
Human Resources FTE 1,115,604 9,646 6,769 13,539 2,708 189,544 23,693 27,078 37,232 27,078 - - 54,663 1,507,555
Information TechnologyFTE 3,849,744 33,288 23,360 46,720 9,344 654,083 81,760 93,440 128,481 93,440 - - 188,633 5,202,294
Finance Actual Direct Costs as % of 2,331,543 39,512 19,899 39,479 26,156 791,697 59,215 56,571 83,176 48,079 20,154 - 345,905 3,861,386 Total State Bar Direct Costs
Communications Actual Direct Costs as % of 55,294 937 472 936 620 18,776 1,404 1,342 1,973 1,140 478 - 8,203 91,575 Total Direct Bar Program Costs
Total Cost Allocated 20,099,601 113,533 130,029 273,215 84,530 4,045,047 434,735 422,122 702,550 538,354 23,772 19,912 1,288,697 28,176,097
Total Direct Costs: 77,940,457
% of Total Direct Costs: 25.8% 0.1% 0.2% 0.4% 0.1% 5.2% 0.6% 0.5% 0.9% 0.7% 0.0% 0.0% 1.7%
Allocation basesMembership Billing – Fund Membership Dues received as a percentage of total State Bar Membership Dues.Actual Direct Costs as % of Total State Bar Direct Costs – Fund Direct Costs as a percentage of total State Bar Direct Costs Square Footage – Fund Square Footage Occupancy as a percentage of total building square footage. FTEs – Fund FTEs as a percentage of total direct cost center FTEs
2015 Indirect Costs Allocated

Cost Allocation Plan - 2014 Actual Attachment C-3
Administrative Area Allocation BasisGeneral
Fund (10)
Annual Mtg Fund
(14)
Legislative Activities Fund (16)
Elimination of Bias / Bar Relations Fund (17)
Legal Educ and Dev
Fund (18)Admissions Fund (20)
Lawyer Assistance Program Fund (21)
Legal Spec Fund (24)
Client Security
Fund (27)
Legal Service
Trust Fund (28)
Equal Access Fund (29)
Justice Gap Fund
(32)
Sections Funds (70-
89)Total Indirect
Cost Pool
Membership Billing Revenues 1,202,525 - 14,333 14,652 - - 36,540 - 138,910 88,740 - 17,764 99,445 1,612,908
Board of Trustees/ Actual Direct Costs as % of 121,127 2,297 1,465 2,020 1,146 40,581 3,033 2,438 4,507 3,147 424 0 17,441 199,626 Election Total State Bar Direct Costs
Appointments Number 28,275 - 10,367 3,142 - 1,571 1,257 18,536 1,257 1,885 - - 42,726 109,014
Property Related-SF Square Footage 2,904,165 - 40,608 81,215 33,184 923,569 20,636 159,236 - 169,264 - - 368,697 4,700,574 Property Related-LA Square Footage 4,640,997 - - 33,433 - 832,973 133,731 - 166,595 - - - - 5,807,729
General Counsel FTE 3,063,393 - 19,033 38,066 17,130 532,929 66,616 47,583 104,683 85,649 - - 190,332 4,165,415
Executive Director Actual Direct Costs as % of 329,947 6,258 3,991 5,502 3,121 110,543 8,262 6,642 12,276 8,572 1,154 0 47,510 543,777 Total State Bar Direct Costs
Library # of Attorneys 483,919 - - - - - - - 20,269 - - - - 504,188
Human Resources FTE 1,000,646 - 6,217 12,434 5,595 174,080 21,760 15,543 34,194 27,977 - - 62,171 1,360,618
Information TechnologyFTE 3,698,024 - 22,976 45,952 20,679 643,334 80,417 57,441 126,369 103,393 - - 229,762 5,028,347
Finance Actual Direct Costs as % of 1,984,035 37,631 23,999 33,085 18,767 664,716 49,678 39,939 73,821 51,543 6,937 0 285,687 3,269,839 Total State Bar Direct Costs
Communications Actual Direct Costs as % of 54,911 1,041 664 916 519 18,397 1,375 1,105 2,043 1,427 192 0 7,907 90,498 Total Direct Bar Program Costs
Total Cost Allocated 19,511,963 47,228 143,654 270,417 100,141 3,942,694 423,304 348,463 684,923 541,597 8,707 17,764 1,351,679 27,392,533
Total Direct Costs: 77,117,550
% of Total Direct Costs: 25.3% 0.1% 0.2% 0.4% 0.1% 5.1% 0.5% 0.5% 0.9% 0.7% 0.0% 0.0% 1.8%
Allocation basesMembership Billing – Fund Membership Dues received as a percentage of total State Bar Membership Dues.Actual Direct Costs as % of Total State Bar Direct Costs – Fund Direct Costs as a percentage of total State Bar Direct Costs Square Footage – Fund Square Footage Occupancy as a percentage of total building square footage. FTEs – Fund FTEs as a percentage of total direct cost center FTEs
2014 Indirect Cost Allocated

Overhead Indirect Cost Allocation Analysis from 2014 to 2016 Attachment C-4
Administrative Area Allocation Basis 2016 Budget 2015 Actual 2014 Actual
Membership Billing Revenues 2,034,800 1,778,406 1,612,908
Board of Trustees/ Actual Direct Costs as % of 238,400 236,088 199,626 Election Total State Bar Direct Costs
Appointments Number 100,900 50,177 109,014
Property Related-SF Square Footage 5,013,100 4,690,300 4,700,574 Property Related-LA Square Footage 4,611,500 6,094,095 5,807,729
General Counsel FTE 4,848,600 3,749,884 4,165,415
Executive Director Actual Direct Costs as % of 2,225,300 365,450 543,777 Total State Bar Direct Costs
Library # of Attorneys 699,500 548,887 504,188
Human Resources FTE 1,533,600 1,507,555 1,360,618
Information TechnologyFTE 6,453,800 5,202,294 5,028,347
Finance Actual Direct Costs as % of 3,141,700 3,861,386 3,269,839 Total State Bar Direct Costs
Communications Actual Direct Costs as % of 91,575 90,498 Total Direct Bar Program Costs
Non-Departmental 444,700
Total Cost Allocated 31,345,900 28,176,097 27,392,533
Allocation basesMembership Billing – Fund Membership Dues received as a percentage of total State Bar Membership Dues.Actual Direct Costs as % of Total State Bar Direct Costs – Fund Direct Costs as a percentage of total State Bar Direct Costs Square Footage – Fund Square Footage Occupancy as a percentage of total building square footage. FTEs – Fund FTEs as a percentage of total direct cost center FTEs

Attachment D
2016 Revised Indirect Cost Allocation Budget - Fiscal Impact Allocate Out $2.67M Capital Improvement Costs
Fund DescriptionAllocation Before
$2.67M Capital Improvement Costs
Fiscal Impact - Allocate Out $2.67M Capital
Improvement Costs**
Allocation After $2.67M Capital
Improvement Costs
Indirect Cost Pool from Administrative Areas: ($) ($) ($) - Membership Billing 2,034,800 2,034,800 - BOT, Election, Appt, Executive Director 3,009,300 3,009,300 - General Services - SF 5,013,100 2,670,000 7,683,100 - General Services - LA 4,611,500 4,611,500 - General Counsel 4,848,600 4,848,600 - Library 699,500 699,500 - Human Resources 1,533,600 1,533,600 - Information Technology 6,453,800 6,453,800 - Finance 3,141,700 3,141,700
31,345,900 2,670,000 34,015,900
Indirect Costs Allocated Out to Individual Fund:Consolidated General Fund:General Fund (10) 22,145,600 1,638,000 23,783,600 Legal Educ. And Dev. Fund (18) 79,400 18,700 98,100
Total Consolidated General Fund: 22,225,000 1,656,700 23,881,700
Special Revenue Fund Group:Admissions Fund (20) 4,634,300 520,900 5,155,200 Annual Mtg Fund (14) 85,900 - 85,900 Grant Fund (12) - - - Sections (70-89) 1,536,100 208,000 1,744,100
Total Special Revenue Fund Group: 6,256,300 728,900 6,985,200
Restricted Fund Group:Legislative Activities Fund (16) 146,900 23,000 169,900 Elimination of Bias & Bar Relations Fund (17) 301,600 46,000 347,600 Lawyer Assistance Program (21) 447,100 12,000 459,100 Legal Specialization Fund (24) 462,200 89,700 551,900 Client Security Fund (27) 744,300 - 744,300 IT Spec Assessment Fund (31) - - - Legal Service Trust Fund (28) 725,200 114,300 839,500 Equal Access Fund (29) 14,500 - 14,500 Justice Gap Fund (32) 22,800 - 22,800
Total Restricted Fund Group: 2,864,600 285,000 3,149,600
Grand Total: 31,345,900 2,670,600 34,016,500
** Based on 58% of $4.6 million capital improvement cost. The 58% represents the State Bar proportion of square footage.

ATTACHMENT E
6031.5 Conference of Delegates, State Bar Sections – Restriction on Funding, Voluntary Fees
(a) State Bar sections, as established under and pursuant to Article 13 of the Rules and Regulations of the State Bar, and their activities shall not be funded with mandatory fees collected pursuant to subdivision (a) of Section 6140.
The State Bar may provide an individual section, or two or more sections collectively, with administrative and support services, provided the State Bar shall be reimbursed for the full cost of those services out of funds collected pursuant to subdivision (b), funds raised by or through the activities of the sections, or other funds collected from voluntary sources. The financial audit specified in Section 6145 shall confirm that the amount assessed by the State Bar for providing the services reimburses the costs of providing them, and shall verify that mandatory dues are not used to fund the sections.
(b) Notwithstanding the other provisions of this section, the State Bar is expressly authorized to collect voluntary fees to fund the State Bar sections on behalf of those organizations in conjunction with the State Bar’s collection of its annual membership dues. Funds collected pursuant to this subdivision, and other funds raised by or through the activities of the sections, or collected from voluntary sources, for their support or operation, shall not be subject to the expenditure limitations of subdivision (b) of Section 6140.05.
(c) Notwithstanding any other provision of law, the State Bar is expressly authorized to collect, in conjunction with the State Bar’s collection of its annual membership dues, voluntary fees or donations on behalf of the Conference of Delegates of California Bar Associations, the independent nonprofit successor entity to the former Conference of Delegates of the State Bar which has been incorporated for the purposes of aiding in matters pertaining to the advancement of the science of jurisprudence or to the improvement of the administration of justice, and to convey any unexpended voluntary fees or donations previously made to the Conference of Delegates of the State Bar pursuant to this section to the Conference of Delegates of California Bar Associations. The Conference of Delegates of California Bar Associations shall pay for the cost of the collection. The State Bar and the Conference of Delegates of California Bar Associations may also contract for other services. The financial audit specified in Section 6145 shall confirm that the amount of any contract shall fully cover the costs of providing the services, and shall verify that mandatory dues are not used to fund any successor entity.
(d) The Conference of Delegates of California Bar Associations, which is the independent nonprofit successor entity to the former Conference of Delegates of the State Bar as referenced in subdivision (c), is a voluntary association, is not a part of the State Bar of California, and shall not be funded in any way through mandatory dues collected by the State Bar of California. Any contribution or membership option included with a State Bar of California mandatory dues billing statement shall include a statement that the Conference of Delegates of California Bar Associations is not a part of the State Bar of California and that membership in that organization is voluntary. (Added by Stats. 1999, ch. 342. Amended by Stats. 2002, ch.415, effective September 9, 2002; Stats. 2003, ch. 334.)

Sections - Overhead Indirect Cost Allocation Analysis from 2013 to 2016 Attachment F
2013 2013 2013 2014 2014 2014 2015 2015 2015 2016 2016 2016Actual Allocated % Actual Allocated % Actual Allocated % Budget Allocated %
Administrative Area Allocation Basis NotesTotal Indirect
Cost Pool
Indirect Cost Allocated to
SectionsTotal Indirect
Cost Pool
Indirect Cost Allocated to
SectionsTotal Indirect
Cost Pool
Indirect Cost Allocated to
SectionsTotal Indirect Cost
Pool
Indirect Cost Allocated to
Sections
(A)Membership Billing Revenues 1,531,501 5.87% 89,899 1,613,098 6.16% 99,445 1,778,406 6.45% 114,763 2,034,800 6.45% 131,308
Board of Trustees/ Actual Direct Costs as % of (B) 185,267 8.42% 15,599 199,632 8.74% 17,441 236,088 8.96% 21,149 238,400 7.95% 18,964 Election Total State Bar Direct Costs
Appointments Number 111,798 40.62% 45,412 109,014 39.19% 42,726 50,177 37.43% 18,782 100,900 7.95% 8,026
Property Related-SF Square Footage (C) 9,714,062 1.68% 163,196 4,700,574 7.79% 368,697 4,690,300 7.79% 367,892 5,013,100 7.79% 393,214 Property Related-LA Square Footage 5,807,729 - - 6,094,095 - - 4,611,500 - -
General Counsel FTE 4,030,251 4.31% 173,704 4,165,415 4.57% 190,332 3,749,884 3.63% 135,969 4,848,600 4.07% 197,303
Executive Director Actual Direct Costs as % of (D) 505,701 8.42% 42,580 543,792 8.74% 47,510 365,450 8.96% 32,737 2,225,300 7.95% 177,012 Total State Bar Direct Costs
Library # of Attorneys 502,591 - - 504,188 - - 548,887 - - 699,500 - -
Human Resources FTE 1,379,067 4.31% 59,438 1,360,618 4.57% 62,171 1,507,555 3.63% 54,663 1,533,600 4.07% 62,407
Information TechnologyFTE 4,983,130 4.31% 214,773 5,028,347 4.57% 229,762 5,202,294 3.63% 188,633 6,453,800 4.07% 262,623
Finance Actual Direct Costs as % of 3,369,992 8.42% 283,753 3,269,929 8.74% 285,687 3,861,386 8.96% 345,905 3,141,700 7.95% 249,907 Total State Bar Direct Costs
Communications Actual Direct Costs as % of 60,525 8.42% 5,096 90,500 8.74% 7,907 91,575 8.96% 8,203 - - - Total Direct Bar Program Costs
Non-Departmental - - - - - - - - - 444,700 7.95% 35,354
Total 26,373,885 1,093,451 27,392,836 1,351,678 28,176,097 1,288,696 31,345,900 1,536,118
Changes from year to year: 3.86% 23.62% 2.86% (4.66%) 11.25% 19.20%
Overall Allocation Percentage to total indirect cost pool: 4.15% 4.93% 4.57% 4.90%
Budget 1,458,700
(E) Variance 77,418
Notes(A) 2016 Budget Allocation methodology has been modified from 2015 to incorporate Bill Statler's recommendations.(B) Prior to 2016, only 25% of BOT/COO/Elections direct costs were allocated out. Beginning in 2016, 100% of these direct costs are allocated out as indirect costs.(C) The 2013 $9.7M represents direct costs for San Francisco and LA Facilities combined. In 2014 the square footage was adjusted from 1.68 % to 8.14% to reflect the correct occupancy percentage within 180 Howard Street.(D) Beginning in 2016, the Office of the Chief Operating Officer is combined with the Office of Executive Director. (E) The 2016 indirect cost allocated to Sections was budgeted at $1,458,700. Actual calculation is $1,536,118, with a variance of $77,418. This variance will be adjusted during the budget amendment.

Sections Bases 2008 2009 2010 2011 2012 2013 2014 20152016
Budget Notes
FTE 3.60% 3.90% 3.81% 4.69% 4.52% 4.31% 4.57% 3.63% 4.07% (A)Direct Costs 7.70% 8.20% 8.35% 8.09% 9.32% 8.42% 8.74% 8.96% 7.95% (B)Square footage 1.90% 1.90% 1.68% 1.68% 1.68% 1.68% 7.79% 7.79% 7.79% (C)Appointments 36.60% 40.50% 38.74% 38.69% 38.83% 40.62% 39.19% 37.43% 7.95% (D)OGC Hours 3.90% 8.60% NA N/A NA NA NA NA NA (E)Membership Billing/Revenue 6.24% 6.16% 5.91% 5.87% 6.16% 6.45% 6.45% (F)
Notes(A) FTE allocation base is derived by dividing Sections FTE over total State Bar FTE for non-cost-allocated cost centers.
(B) The Direct Cost allocation base is derived by dividing Sections direct costs by total Barwide direct costs for non-cost-allocated cost centers.
(C) Square footage allocation base is derived by dividing Sections occupied space by the total occupied space for non-cost-allocated cost centers. In 2014 the square footage was adjusted from 1.68 % to 8.14% to reflect the correct occupancy percentage within 180 Howard Street.
(D) Until 2015, Appointments base was the percentage of appointments going to sections. Beginning in 2016, the methodology changed to Direct Cost base.
(E) OGC Hours has not been used in the allocation methodology since 2010.
(F) Membership billing /revenue allocation base is derived by the Section Membership Dues divided by total Barwide Membership Dues for non-cost-allocated cost centers.

Support Costs for State Bar SectionsActual Actual Actual Actual Actual Actual Actual Actual Actual Budget
Sections Fund 70 2007 2008 2009 2010 2011 2012 2013 2014 2015 2016
Direct Support Costs 1,626,587 1,657,400 1,686,485 1,665,846 1,883,929 1,840,364 1,922,007 2,028,638 2,037,397 2,331,600 Council of State Bar Sections 41,200 41,200 41,200 41,200 41,500 50,000 55,000 55,000 55,000 55,000 Legislative Support 95,789 68,249 155,672 154,430 159,732 172,327 177,850 207,752 224,823 188,600 Indirect Costs (General Administrative Support) 679,834 725,364 975,961 857,348 1,074,945 1,065,582 1,093,451 1,351,679 1,288,697 1,536,118
Total 2,443,410 2,492,213 2,859,318 2,718,824 3,160,106 3,128,273 3,248,308 3,643,069 3,605,917 4,111,318
Section Membership Count 65,494 66,961 65,513 63,214 63,734 64,262 65,030 64,890 64,340 64,340
Estimated Cost per Member - (total overhead) 37.31$ 37.22$ 43.65$ 43.01$ 49.58$ 48.68$ 49.95$ 56.14$ 56.04$ 63.90$
Discretionary (Funds 71 to 89): - Travel 1,172,585 1,186,723 836,300 - Catering 1,400,035 1,667,884 1,152,200 - Meeting Room Rental 46,070 45,164 45,300
Total Discretionary Costs: 2,618,690 2,899,772 2,033,800
Cost Per Member - Direct Support Costs 31.26$ 31.67$ 36.24$
Cost Per Member - Indirect Costs 20.83$ 20.03$ 23.88$
Cost Per Member - Discretionary Costs 40.36$ 45.07$ 31.61$

Support Costs for State Bar Sections - Fund 70
2014 Actual
2015 Actual
2016 Budget
Direct Support CostsSalaries - Regular 1,246,923 1,231,372 1,509,200Salaries - Overtime 27,880 35,535 36,700Payroll Tax Allocation 94,024 92,978 113,200Fringe Allocation 345,714 348,269 392,400Misc Benefits 32,589 16,800Temporary Outside Help 124,492 112,874 85,000Dues & Membership 791Recruiting Expenses 75 525Rideshare Program Reimbursemen 26,104 27,734 27,700OPEB/ARC Expenses 58,621 74,510 42,000Travel - Staff 1,661 51 100Business Expenses 384Catering 16,213 50,057 46,600Postage 218 1,643 1,000Stationery and Office Supplies 9,987 15,041 16,400Telephone 34,707 35,829 34,900Computer Software Purchase 585Computer Supplies 27In House Copier Usages Alloc. 3,229 2,221 2,100Equipment Purchase-Non-Capital 167 44 100Equipment Rental 1,308 4,762 5,700Repairs and Maintenance - Equi 115Ergonomic Expenses 165Outside Services-Printing-Desi 865 1,000Outside services-others 129 401 500Delivery Services 328 128 100File Retention 2,491 2,087In House Printing Service 122 60 100
Total Direct Support Costs: 2,028,638 2,037,397 2,331,600
Council of State Bar SectionsSection Council Expenses 55,000 55,000 55,000
Total Council of State Bar Sections: 55,000 55,000 55,000
Legislative SupportProfessional Services 97,143 100,844 98,600Legislative Advocacy 110,609 123,979 90,000
Total Legislative Support: 207,752 224,823 188,600
Indirect Costs (General Administrative Support)Interfund Allocation 1,351,679 1,288,697 1,536,118
Total Indirect Costs: 1,351,679 1,288,697 1,536,118
Total Support Costs: 3,643,069 3,605,917 4,111,318

Discretionary Costs by Section Program vs. BOT and JNE
Fund Section ProgramTravel Catering Meetings Total Travel Catering Meetings Total Travel Catering Meetings Total
71 Antitrust 39,117 53,249 0 92,366 42,387 112,196 0 154,583 27,500 20,900 0 48,40072 Business Law 69,206 87,008 1,600 157,814 63,492 113,009 6,270 182,771 39,500 87,700 7,600 134,80073 Criminal Law 40,996 11,378 0 52,374 38,414 10,984 975 50,372 16,800 5,500 800 23,10074 Environmental Law 83,384 187,898 745 272,027 98,788 215,469 2,825 317,081 41,200 31,900 3,400 76,50075 Trusts & Estates 112,490 84,212 5,360 202,061 102,240 96,996 5,750 204,985 89,400 83,400 2,700 175,50076 Family Law 75,889 55,584 0 131,472 99,510 48,505 215 148,230 91,200 49,400 300 140,90077 Intellectual Property 94,467 88,337 0 182,804 127,511 113,067 554 241,132 80,400 155,500 700 236,60078 International Law 32,631 38,396 0 71,027 18,654 26,766 0 45,420 9,800 23,400 0 33,20079 Labor Law 95,020 158,025 14,465 267,511 88,995 244,495 13,612 347,103 63,600 166,100 14,100 243,80080 Law Practice Mgt 26,762 11,544 0 38,306 20,886 7,416 0 28,302 18,500 7,600 0 26,10081 Litigation 98,122 87,581 400 186,103 76,038 58,199 0 134,238 65,700 58,600 0 124,30082 Public Law 31,886 21,566 0 53,452 41,017 39,240 0 80,257 30,300 31,600 0 61,90083 Real Property Law 117,580 150,845 1,800 270,225 126,750 167,520 200 294,470 95,600 154,400 200 250,20084 Solo & Small Firm 36,502 17,435 0 53,936 27,210 12,392 0 39,602 24,800 12,600 0 37,40085 Taxation 111,331 165,390 18,700 295,420 112,288 190,612 7,959 310,860 69,600 80,100 7,300 157,00086 Worker's Comp 69,982 93,110 3,000 166,093 66,295 122,055 6,805 195,154 36,800 94,400 8,200 139,40087 Sections Council Fund 18,133 21,646 0 39,779 14,434 20,054 0 34,487 13,900 19,100 0 33,00088 Spring SEI Fund 19,088 66,831 0 85,919 6,788 285 0 7,073 6,400 0 0 6,40089 Winter SEI Fund 0 0 0 0 15,026 68,625 0 83,652 15,300 70,000 0 85,300
Total: 1,172,585 1,400,035 46,070 2,618,690 1,186,723 1,667,884 45,164 2,899,772 836,300 1,152,200 45,300 2,033,800
Travel Catering Meetings Total Travel Catering Meetings Total Travel Catering Meetings Total10003 Board of Trustees 148,531 43,250 1,004 192,785 232,560 47,851 1,200 281,610 118,500 44,500 1,500 164,50010101 Judicial Evaluation 202,798 14,355 0 217,153 166,930 26,697 0 193,627 126,700 14,000 0 140,700
Cost Center
2014 Actuals 2015 Actuals 2016 Budget
2014 Actuals 2015 Actuals 2016 Budget

Sections Assessment
Fund Section Program 2014 Actuals 2015 Actual 2016 Budget71 Antitrust 69,373 66,238 75,73772 Business Law 471,714 460,474 526,50773 Criminal Law 92,472 93,114 106,46774 Environmental Law 147,020 145,354 166,19875 Trusts & Estates 348,080 347,931 397,82576 Family Law 213,118 214,055 244,75277 Intellectual Property 381,270 373,295 426,82778 International Law 65,987 64,670 73,94479 Labor Law 409,051 417,136 476,95580 Law Practice Mgt 60,465 57,391 65,62181 Litigation 518,936 498,940 570,49082 Public Law 88,471 91,322 104,41883 Real Property Law 360,646 348,491 398,46684 Solo & Small Firm 84,526 80,796 92,38285 Taxation 184,662 178,893 204,54786 Worker's Comp 161,051 164,391 187,965
Total: 3,656,841 3,602,489 4,119,100
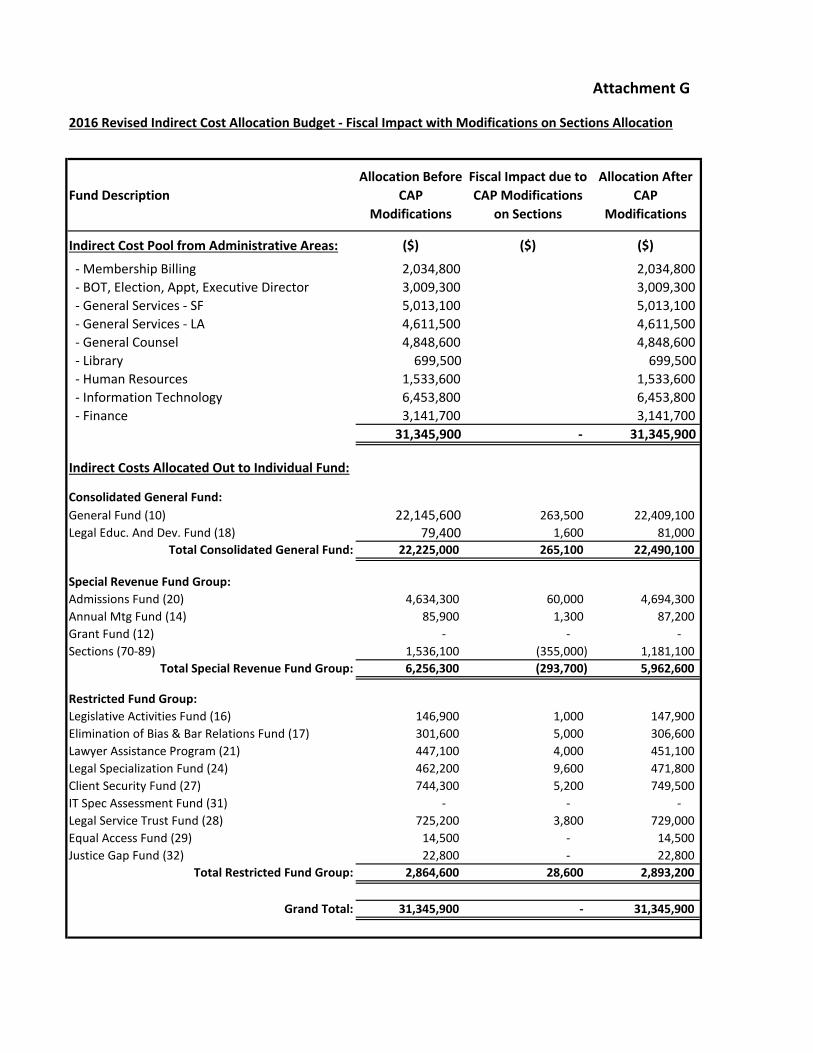
Attachment G
2016 Revised Indirect Cost Allocation Budget - Fiscal Impact with Modifications on Sections Allocation
Fund DescriptionAllocation Before
CAP Modifications
Fiscal Impact due to CAP Modifications
on Sections
Allocation After CAP
Modifications
Indirect Cost Pool from Administrative Areas: ($) ($) ($)
- Membership Billing 2,034,800 2,034,800 - BOT, Election, Appt, Executive Director 3,009,300 3,009,300 - General Services - SF 5,013,100 5,013,100 - General Services - LA 4,611,500 4,611,500 - General Counsel 4,848,600 4,848,600 - Library 699,500 699,500 - Human Resources 1,533,600 1,533,600 - Information Technology 6,453,800 6,453,800 - Finance 3,141,700 3,141,700
31,345,900 - 31,345,900
Indirect Costs Allocated Out to Individual Fund:
Consolidated General Fund:General Fund (10) 22,145,600 263,500 22,409,100 Legal Educ. And Dev. Fund (18) 79,400 1,600 81,000
Total Consolidated General Fund: 22,225,000 265,100 22,490,100
Special Revenue Fund Group:Admissions Fund (20) 4,634,300 60,000 4,694,300 Annual Mtg Fund (14) 85,900 1,300 87,200 Grant Fund (12) - - - Sections (70-89) 1,536,100 (355,000) 1,181,100
Total Special Revenue Fund Group: 6,256,300 (293,700) 5,962,600
Restricted Fund Group:Legislative Activities Fund (16) 146,900 1,000 147,900 Elimination of Bias & Bar Relations Fund (17) 301,600 5,000 306,600 Lawyer Assistance Program (21) 447,100 4,000 451,100 Legal Specialization Fund (24) 462,200 9,600 471,800 Client Security Fund (27) 744,300 5,200 749,500 IT Spec Assessment Fund (31) - - - Legal Service Trust Fund (28) 725,200 3,800 729,000 Equal Access Fund (29) 14,500 - 14,500 Justice Gap Fund (32) 22,800 - 22,800
Total Restricted Fund Group: 2,864,600 28,600 2,893,200
Grand Total: 31,345,900 - 31,345,900