Embed Size (px)
Citation preview

C H A P T E R F I V
The State of the American Dream:Race and Ethnic Socioeconomic Inequalityin the United States, 970-90
Charles Hirschman and C. Matthew Snipp
merica is a nation of immigrants, but not all immigrantgroups have experienced the same reception and oppor-tunities or have been accorded the same influence.
American ideals and cultural values were largely shaped by the Anglo her-
ii.i^e of the founding settlers. For most of the nation’s history, those ideals
huve continued to define the American experience for subsequent waves of
iiinvals. The millions of new immigrants were expected-as were native
Amcrican Indians and African slaves-to assimilate intoAmerican society andi<> conform to Anglo-American ideals and values. They were also expected to
.-iliMard their ethnic heritage as quickly as possible. Economic incentives,UK luding hope for their own and their children’s upward mobility, motivatedtin immigrants’ acceptance of cultural change and adaptation.
Despite the massive immigration during the late nineteenth and earlyiwcutieth centuries, the image ofAmerican society as an extension ofEng-
^l" iiuthors wish to acknowledge the support provided to the second author by the Vilas
^ *11 usi of the University ofWisconsin, support that was used for the processing and analysis of
^.ttiril.iia presented herein. Some of the data presented in this paper also appear in an unpub-^tslitlr-d manuscript, "Assimilation in American Society: Occupational Achievement and Earn-’^-ttiy.-. lor Ethnic Minorities in the United States, 1970 to 1990,’ by the same authors.
’89
In Phyllis Moen, Donna Dempster-McClain, and Henry Walker (eds.) A Nation Divided: Diversity, Inequality, and Community in American Society. Ithaca: Cornell University Press, pp. 89-107.

lish society persisted throughout the first six decades of the twentieth cen-
tury. As we near the end of the twentieth century and envision the future ofAmerican society, the patterns in the first halfofthe century-the exchangeof cultural conformity for a chance at upward mobility, the AmericanDream-seem obsolete. There appears to be less societal pressure on new
immigrants to surrender their culture, language, and traditions. In fact,group identities, including race, ethnicity, and gender, now frame claims to
political power and political participation. Sensing this shift in politicalroles, other groups, such as American Indians, have made a concertedeffort to assert the importance of their ethnic ancestry. Many traditionalistssee these trends as divisive forces, while others view the emphasis on cul-tural diversity as the defining character ofcontemporary American society.
It is important to assess the state of the American Dream as the twenti-eth century ends-to chart where we have been and to anticipate where weare going. In this chapter, we analyze patterns and trends in social and eco-nomic inequality among the major racial and ethnic groups in American
society. We track occupational and earnings attainment among men fromseven major racial and ethnic groups between 1970 and 1990. The yearsfrom 1970 to 1990 represent an especially important period in Americanhistory, given the government activism of the preceding decade. In the1960s, federal and local governments enacted civil rights laws, created affir-
mative action procedures, and developed equal employment opportunityprograms. For the first time in American history, public policy prohibiteddiscrimination against Americans who did not fit Anglo standards of
appearance, beliefs, and behavior. From the vantage point of the present,we look back over history to see if there has been progress in the upliftingof groups that historically have been outside the economic mainstream.We find that there has indeed been progress in the reduction of socio-
economic inequality across race and ethnic groups over the twenty yearsfrom 1970 to 1990. With the exception ofJapanese Americans, however,there remain wide socioeconomic gaps between minority populations andthe majority. In 1989, African Americans, Latinos, and American Indians
had an income gap from the majority population that was still around$10,000 for working men-only slightly less than the gap in 1969.
Inequality in American Society
Race and ethnic differences in occupational and economic attain-
ment raise three key issues. First is a concern about social justice. Ethnic
(and race) differences in life chances are at odds with values that are
deeply ingrained in American society: (1) that everyAmerican should have
an equal opportunity to compete for the wealth of the nation; and (2) the
AA Tka Mam Oamnaranhv nf Durable Ineaualitv
distribution of resources should be determined by a fair and open processinfluenced primarily by personal merit and achievement. The fact thatsome groups, despite hard work and ingenuity, receive less than othersraises questions about these values.A second issue concerns the rigidity of stratification in America. In open
societies, economic well-being is determined by effort and ability in a com-petition among equal actors (Lenski 1966). In rigidly stratified and closedsocieties, economic resources and personal well-being are disproportion-ately determined by ascribed characteristics (such as race or family back-ground). The measurement ofchanges in the structure and determinants ofinequality reveals whether American society is becoming more or less open.
Finally, the persistence of inequality is linked to the ideal of assimilation.he stratification literature in sociology (and especially studies of status
attainment) has traditionally viewed a reduction in economic differentialsi-s an important gauge of socioeconomic assimilation (Hirschman 1983).Fur example, recent data from the General Social Survey show that black-white differences persist although their magnitude lias declined (Gruskyand DiPrete 1990). The presence of black-white differences in education,income, occupational status, or other measures ofeconomic well-being arcpliina facie evidence that socioeconomic assimilation has not occurred.
The Origins and Development ofAssimilation Theory
Park and Burgess (1969, 360) defined assimilation as "a process ofimerpenetration and fusion in which persons and groups are incorpo-rated into a common cultural life." In subsequent work. Park’s race cycle’.heoi-y described a cycle of race relations in which culturally distinct groupscame into contact and eventually fused into a common culture and society.The cycle included four distinct phases: "contact, competition, accommo-dation, and assimilation" (Park 1950, 150).
Park and his colleagues at the University of Chicago conducted studiesin the 1920s when the city of Chicago was teeming with recent Europeanimmigrants. The process ofassimilation Park described captured the expe-rience of the European newcomers. Since Park, sociologists have tended(u think about assimilation as an evolutionary process taking place in more>.>r less discrete periods or phases.
Milton Gordon’s book Assimilation in American Life (1964) represents thenext major milestone in assimilation theory. Gordon described seven dif-ferent types of assimilation: cultural (acculturation), structural, marital
(amalgamation), identificational, attitude receptional (absence of preju-dice), behavioral receptional (absence of discrimination), and civic(absence ofvalue and power conflict). Gordon also posited that while tliese

different types of assimilation were connected to one another, one did not
necessarily follow from the other. He noted, for example, that AfricanAmericans (in the 1950s and early 1960s) had undergone cultural assimi-lation but had not experienced large-scale entrance into cliques, clubs, andinstitutions of the host society, that is, structural assimilation.
In the years since the publication of Gordon’s book, assimilation the-orists have proposed a variety ofschemes to describe the incorporation ofethnic minorities into the dominant society. For example, Greeley (1974)suggested that assimilation is neither linear nor unidirectional. AndYinger (1985) contended that the subprocesses Gordon (1964) had iden-tified could be found working independently of one another. These the-ories display an appreciation for the complexity of assimilation and implythat complete assimilation ofsome groups (e.g., blacks) is not likely in theforeseeable future.
Over the years, the ideal of assimilation and the race cycle theory haveendured a hail of criticism. Some of these criticisms were anticipated, even.
prior to the development of assimilation theory. Horace Kallen (1924)argued that immigrants should not be expected to surrender their cultureand identity as a condition for participation in American society. Critics, inthe 1960s, argued that ethnicity plays a central role in the lives of even themost acculturated groups (Glazer and Moynihan 1970). For many groupsin American society, ethnicity is largely a symbolic construction and has a
relatively minor role in their lives (Gans 1979; Waters 1990). Alba (1985),for example, wrote about the "twilight of ethnicity" among Americans of
Italian descent. More recently, the phenomenon of ethnic resurgence has
challenged the race cycle tlieory and the idea that assimilation i.s
inevitable. There has been a remarkable revival of ethnic awareness, even
among groups whose cultural identities were once considered destined for
extinction, such as American Indians (Cornell 1988; Nagel 1996).Why does ethnicity seem to matter for some groups and not for oth-
ers? Gordon’s theory suggests that prejudice and discrimination are crit-
ical. Acculturation is not sufficient for full participation in American
society as long as "gatekeepers" continue to restrict access to neighbor-hoods, primary group associations, and opportunities for economic
mobility. One prominent hypothesis is that "race"-physiological differ-
ences in skin color and other outward features-defines the essential dif-
ference between minority groups that are allowed to assimilate and those
that are not (Cox 1948; Jordan 1974). Other perspectives suggest thai
racism (the differential treatment of persons of different "races") is con-
tingent on historical conditions and that American society holds the
potential to assimilate persons of different races as well as of different
ethnic groups (Myrdal 1944; Wilson 1978).
wl*** ^sfr^r-^l^l^ l*A^ll^l!^f
Assimilation Research
There is a large body of empirical researcli on various dimensionsut assimilation, including studies ofsocioeconomic assimilation, segregationin schools and housing, inter-marriage, and prejudice (Hirschman 1983).Socioeconomic assimilation (as measured by occupational and earnings-utainment) is widely considered an indicator ofsecondary-group structural:is.similation (Gordon 1964; Lieberson 1980). Although it is not possible topresent a comprehensive review of the empirical studies of ethnic assimila-tion in American society, there are some important themes in the literatureon socioeconomic assimilation that inform and guide our study.Our analysis compares Anglo and other "white" Americans willi
Anican Americans; American Indians; Chinese, Filipino, and JapaneseAmericans; and Americans of Hispanic origin. European immigrants and;heir descendants have generally enjoyed considerable upward mobilityiiuuughout the twentieth century (Greeley 1978; Lieberson 1980). Tillsu not to say that none were affected by bigotry and discrimination. On(tic contrary, there is a long history of ethnic antagonism in this countryfc-.g., anti-Semitic and anti-Catholic sentiment; see Baltzell 1964; Higham1970). Nevertheless, the large socioeconomic differences that existed-iinong these European ethnics in 1900 had virtually disappeared by tlieiy6Us (Duncan and Duncan 1968; Neidert and Parley 1985; Lieberson-mcl Waters 1988).Compared with immigrants from Europe, American Indians, African
.-iiiericans, and nonwhite immigrants from Asia and Latin America
ti.-.’.e not fared as well. The American Indian population is small andh..:-- experienced discrimination, forced isolation, and intense pressuresroin the federal government to assimilate into American society. Despitet’K.-se efforts, many (perhaps most) American Indians remain outsidethe mainstream (i.e., the modern, largely urban) U.S. economy (Hoxieh’S4; Fixico 1986; Gundlach and Roberts 1978; Snipp 1989; Snipp and
S-uidefur 1989). Racial discrimination and segregation have been majorb;;iTiers to the advancement of blacks in American society (Duncan{"riy; Featherman and Hauser 1976; Parley and Alien 1987; Massey andDemon 1993).
Hispanic and Asian groups warrant separate consideration, as they liave
experienced explosive population growth since the immigration reformsw 1965 and 1986 (Chiswick and Sullivan 1995). The Latino populationip;ii licularly Mexican Americans) is an old and established American eth-r-ic group. During the 1960s and 1970s they also comprised the largest andCisiest-growing immigrant group. It is difficult to make generalizationsabout the assimilation ofLatinos because of their ethnic heterogeneity and
Rar^ anrl Ft-hnir C/wirtflMM/vi<- lr*afr^li** Si .1*.
the disparate circumstances of their immigration, internal migration, andsettlement patterns (Bean and Tienda 1987). Even within a small grouplike Cuban Americans, there are substantial differences with respect to the
circumstances of their immigration and the extent to which they havebecome assimilated (Portes and Bach 1985).
Although there is considerable diversity in the Latino population, thereare also commonalties such as language. However, compared with Latinos,
the so-called Asian and Pacific Islander population has spectacular diver-
sity. Except for the continent of origin, there are few visible similarities.
Many of these groups are exceedingly small in number, making it difficult
to obtain reliable data on their socioeconomic characteristics. However, in
the 1980s, Asian and Pacific Islanders were the fastest growing segment ofthe American population (Barringer, Gardner, and Levin 1993).
Asians, especially those ofJapanese and Chinese descent, pose an anom-aly for assimilationist thinking about racial and ethnic inequality. Despitelong histories of discrimination and persecution, Americans ofJapaneseand Chinese descent have, in fact, attained even higher levels of social and
economic well-being than the white population. Only part of this success
can be linked to their high levels of schooling and concentration in urban
areas (Hirschman and Wong 1984; Nee and Sanders 1985). Some observers
who attribute their success to hard work and ingenuity describe Asians as
"model minorities." But the evidence of the successful assimilation of all
groups ofAsians is mixed. Some recent Asian immigrants, especially those
who were forced to flee in the aftermath of the Vietnam War, have had a
much more difficult experience. Whether these disadvantages will persistinto the future is an open question.
Finally, there is compelling evidence to suggest that there is growingsocioeconomic diversity luithin each of these groups-African Americans,
Latinos, American Indians, and Asians. For example, studies have shown
that in recent years, some segments of the African American populationhave enjoyed greater opportunities and attained a middle-class lifestyle,while many more are left behind in inner city ghettos (Landry 1987; Wit-
son 1987; Parley and Alien 1987). The increasing socioeconomic inequal-ity within minority group populations is a crucial issue (but is not addressed
directly in our subsequent analysis).In this research, we measure the socioeconomic differences between
groups and estimate how much of the interethnic gap can be "explained"by antecedent characteristics. Interethnic inequality is measured as the
differences between the mean occupational and earnings attainment of
each minority group (African Americans, American Indians, Chinese,
Japanese, Filipinos, and Latinos) and those ofnon-Hispanic whites (Hirsch-man 1980).
04 The Now riomooranhv of Durable Ineoualitv
Data and Methods
Data
We use data from the Public Use Microdata Sample (PUMS) filest the decennial censuses of 1970, 1980, and 1990. These data permit us to
examine recent trends in the socioeconomic achievements of seven racialand ethnic minorities. Census data have virtues and liabilities. Large sam-
ples are a primary virtue. They allow us to study relatively small populationsthat are usually not represented in national surveys. Our analyses include
comparisons of the socioeconomic characteristics of whites, African Amer-icans, Latinos, Japanese, Chinese, Filipinos, and American Indians. The pri-mary liability of census data is the paucity of background variables dial
might explain relative levels and trends in race and ethnic inequality.We restrict the sample to men between the ages of twenty-five to sixty-
four who were working at the time of the census and received positive earn-ings the previous year. This sample does not completely represent theseethnic populations or even all adult men in these ethnic groups. But
important theoretical and practical considerations led us to restrict the
analysis to this subset of the population.First, women’s roles, and particularly their participation in the economy,
have changed dramatically since 1970. The question ofgender stratification
is intertwined with changes in racial and ethnic stratification in such com-
plex ways that a full study of the topic would exceed the scope of this chap-ter. Second, the age range was dictated by the fact thatwe are most interested
in persons who are economically active. Many persons younger than twenl.y-
tive years old are either still in school orjust entering the workforce. Per-sons age sixty-five and older are likely to be retired or very close to retirement.
Third, we selected men who were employed in order to facilitate compar-isons witli earlier studies of race and ethnic assimilation (Duncan 1969;
Hirschman and Wong 1984). Tliese restrictions limit our results to a select
segment of the population, but other work leads us to believe that our esti-
mates ofethnic differences will be conservative. In our prior study, we foundthat the restricted sample (only those in the labor force and with earningslast year) excluded 15 percent of white men in the working years, butexcluded 25 percent of black men (Hirschman and Wong 1984, 589). Eth-nic differences reported below would in all likelihood be larger if we
included persons who were not active members of the workforce.
Variables
Ourstudy focuses on ethnic differences in two indicators ofeconomic
well-being: occupational status and earnings, and changes in these indicators
Race and Ethnic Socioeconomic Inequality in the United States 95
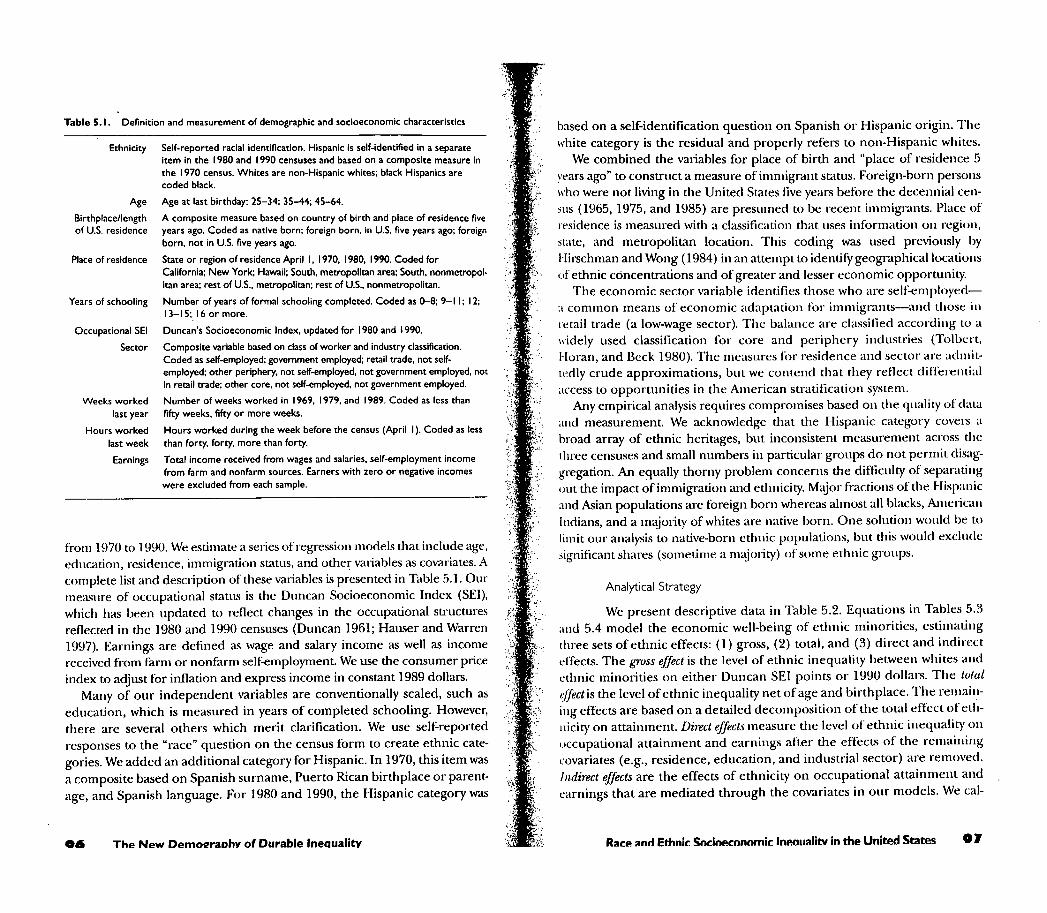
Table 5.1. Definition and measurement of demographic and socioeconomic characteristics
Ethnicity Self-reported racial identification. Hispanic is self-identified in a separateItem in the 1980 and 1990 censuses and based on a composite measure in
the 1970 census. Whites are non-Hispanic whites; black Hispanics are
coded black.
Age Age at last birthday: 25-34; 35-44; 45-64.
Birthplace/length A composite measure based on country of birth and place of residence fiveof U.S. residence years ago. Coded native born; foreign born, in U.S. five years ago; foreign
born, not in U.S. five years ago.
Place of residence State or region of residence April 1, 1970, 1980, 1990. Coded forCalifornia; New York; Hawaii; South, metropolitan area; South, nonmetropol-itan area; rest of U.S., metropolitan; rest of U.S.. nonmetropolitan.
Years of schooling Number of years of formal schooling completed. Coded as 0-8; 9-11; 12;13-15; 16 or more.
Occupational SEI Duncan’s Socioeconomic Index, updated for 1980 and 1990.
Sector Composite variable based on class of worker and industry classification.Coded as self-employed; government employed; retail trade, not self-employed; other periphery, not self-employed, not government employed, not
in retail trade; other core, not self-employed, not government employed.
Weeks worked Number of weeks worked in 1969, 1979, and 1989. Coded as less than
last year fifty weeks, fifty or more weeks.
Hours worked Hours worked during the week before the census (April I). Coded as less
last week than forty, forty, more than forty.
Earnings Total income received from wages and salaries, self-employment incomefrom farm and nonfarm sources. Earners with zero or negative incomes
were excluded from each sample.
from 1970 to 1990. We estimate a series ofregression models that include age,education, residence, immigration status, and other variables as covariates. A
complete list and description of these variables is presented in Table 5.1. Our
measure of occupational status is the Duncan Socioeconomic Index (SEI),which has been updated to reflect changes in the occupational structures
reflected in the 1980 and 1990 censuses (Duncan 1961; Hauser and Warren
1997). Earnings are defined as wage and salary income as well as income
received from farm or nonfarm self-employment. We use the consumer priceindex to adjust for inflation and express income in constant 1989 dollars.
Many of our independent variables are conventionally scaled, such as
education, which is measured in years of completed schooling. However,
there are several others which merit clarification. We use self-reportedresponses to the "race" question on the census form to create ethnic cate-
gories. We added an additional category for Hispanic. In 1970, this item was
a composite based on Spanish surname, Puerto Rican birthplace or parent-
age, and Spanish language. For 1980 and 1990, the Hispanic category was
06 The New Demograohv of Durable Inequality
based on a self-identification question on Spanish or Hispanic origin. Thewhite category is the residual and properly refers to non-Hispanic whites.
We combined the variables for place of birth and "place of residence 5
years ago" to construct a measure of immigrant status. Foreign-born personswho were not living in the United States five years before the decennial cen-
sus (1965, 1975, and 1985) are presumed to be recent immigrants. Place of
residence is measured with a classification that uses information on region,state, and metropolitan location. This coding was used previously byHirschman andWong (1984) in an attempt to identify geographical locations
of ethnic concentrations and of greater and lesser economic opportunity.The economic sector variable identifies those who are self-employed-
:i common means of economic adaptation for immigrants-and lliose in
retail trade (a low-wage sector). Tlie balance are classified according to a
widely used classification for core and periphery industries (Tolbert,Horan, and Beck 1980). The measures for residence and sector are admit-
tedly crude approximations, but we contend that they reflect differential
access to opportunities in the American stratification system.Any empirical analysis requires compromises based on the quality of data
and measurement. We acknowledge that the Hispanic category covers a
broad array of ethnic heritages, but inconsistent measurement across tlie
three censuses and small numbers in particular groups do not permit disag-
gregation. An equally thorny problem concerns the difficulty of separating(jut the impact of immigration and ethnicity. Major fractions of the Hispanicand Asian populations are foreign born whereas almost all blacks, American
Indians, and a majority of whites are native born. One solution would he to
limit our analysis to native-born ethnic populations, but this would exclude
significant shares (sometime a majority) ofsome ethnic groups.
Analytical Strategy
We present descriptive data in Table 5.2. Equations in Tables 5.3
and 5.4 model the economic well-being of ethnic minorities, estimatingthree sets of ethnic effects: (1) gross, (2) total, and (3) direct and indirect
effects. The gross effect is the level of ethnic inequality between whites and
ethnic minorities on either Duncan SEI points or 1990 dollars. The total
vjfectis the level ofethnic inequality net ofage and birthplace. The remain-
ing effects are based on a detailed decomposition of the total effect ofeili-
nicity on attainment. Direct effects; measure the level of ethnic inequality on
occupational attainment and earnings after the effects of the remaining
covariates (e.g., residence, education, and industrial sector) are removed.
Indirect effects are the effects of ethnicity on occupational attainment and
earnings that are mediated through the covariates in our models. We cat-
Race and Ethnic Sncinecnnomic Incoualitv in the United States 07

Ttte 5.2. Indicators of socioeconomic attainment among men aged twenty-five to sixty-four by ethnicity:lS70.1980.and 1990
Mean SEI Mean Annual Earnings* N
1970 1980 1990 1970 1980 1990 1970 1980 1990
WhiteBlackAm. Ind.
JapaneseChinese
FilipinoHispanic
36.524.027.438.442.933.728.6
1970
39.428.331.944.746.739.129.7
StandardDeviation
(SEI)
1980
40.130.231.247.446.138.232.7
1990 1970
$35,125$20,436$22,149$35,429$32,243$25,044$27,304
Coefficientof Variation
(SEI)
1980
$35,278$23,061$25,925$37,205$31,424$30.463$23,797
1990 1970
$35,523$23,172$21,511$42,750$32,017$28.945$25,760
StandardDeviation(earnings)
1980
3,1392,726939
1.130911611
1,394
1990
3,0632,5402.2721,647
1.8591,3792,231
197C
---------V ST3,013 ’1 y2.482 ,i F2.585 ^ |.3.037 ,) it:2,977 ^3,029 1 |2.841 %
--------1 fcCoefficientof Variation
W(earnings) ^0 1980 1993 ^,
WhiteBlackAm. Ind.JapaneseChineseFilipinoHispanic
Ratio of Mean White MinorityRatio of SEI White Minority Earnings to Gap (earnings In is;
to White Mean
1970 1980
20.013.916.421.924.123.217.5
20.516.418.321.323.522.717.5
20.917.717.620.923.221.218.8
1990
0.550.580.600.570.560.690.61
1970
0.520.580.570.480.500.580.59
Gap (SEI)
1980
0.520.590.560.440.500.550.57
White Mean thousands of dollars;
1990
23,72612,50016,05422,18922.95917,47319,561
1970
23,04214,89819,33423,24524,30723,80717,163
1980
31,47718,127
17.29333,909
30.03526,33223,803
1990 1970
0.680.610.720.630.710.700.72
0.650.650.750.620.770.780.72
1980
O.OT0.760.800.75o.^0.910.92
19%;
’i
W
8S--
ii’;’.fc’’.1,’’
!-’^1’
Ifi’..y
^’1:WhiteBlackAm. Ind.JapaneseChinese
FilipinoHispanic
10066751051189278
10072811131199975
10075781181159582
-12.5-9.11.96.4
-2.8-7.9
-11.1-7.55.37.3
-0.3-9.7
-9.9-8.97.36.0
-1.9-7.4
1005863101927178
1006573105898667
1006561120908173
-$14.7-$13.0
$0.3-$2.9
-$10.1-$7.8
-$12.2-$9.4$1.9
-$3.9-$4.8
-$11.5
-$12:*;-$IU;
s^-$3-’.’;-M-^
r
t̂.d’^Am. Ind. American Indian; SEI socioeconomic index.
*Adjusted to constant 1989 dollars.Sources: Public Use Microdaia Sample (PUMS) files of the 1970, 1980, and 1990 Census of Population, U.S. Bureau of;
Census.
98 The New Demoeraohv of Durable Inpnualitv
dilate indirect effects by estimating successive regression equations andsubtracting the ethnic coefficients with the intervening variable from theethnic coefficients in the preceding equation without the intervening vari-able (Alwin and Hauser 1975).
Results: Ethnic Differences in Socioeconomic Attainments
Table 5.2’ shows the means and standard deviations for SEI und
earnings for each ethnic group for the years 1970, 1980, and 1990. The SEIand earnings ofJapanese workers and the SEI of the Chinese exceed thoseof the white sample. On the other hand, the earnings and occupational sta-
ins of Hispanics, blacks, American Indians, and, to a lesser degree, Fil-ipinos are well below the earnings and occupational status of whites.The results are remarkably stable. The rankings of groups on SEI and
earnings are virtually unchanged between 1970 and 1990. The average SEIof all groups increased between 1970 and 1990. Most of the gains were in
ilie four- to six-point range except for Japanese workers who gained nine
points. There was little net change in the earnings hierarchy. However, the
pattern is more mixed than that for occupational status. In constant dollars,white earnings were stagnant from 1970 to l990. Blacks, on the oilier hand,enjoyed modest gains in each decade since 1970. The same is true forjapan-ese workers. Other groups experienced modest gains in one decade anddeclines in another. This instability might be the result ofcompositional dif-
ferences due to immigration, changing racial self-identification (in the case
of American Indians), or reporting errors in the earnings data.
Models of Ethnic Stratification, 1970-90
The patterns in Table 5.2 reveal the relative status (and change in
siatus) of ethnic minorities in American society. They do not lake into
account ethnic differences in education, place of residence, or other
attributes that may affect socioeconomic attainment entirely apart from
any consideration of ethnic relations. For example, some ethnic groupsmay have higher earnings because they are more heavily concentrated in
higher paying urban labor markets, not because they receive different
rewards for their work. We use regression analysis to decompose the eth-
nic effects on occupational and earnings achievements.
To present descriptive statistics, we selected representative sample ot whiles mid blacks in
llie public use files and included all PUMS observations of tlie smaller populations sncli as
American Indians and Asian Americans.

Occupational Attainment
The coefficients in Table 5.3 show the gross, total, direct, and indirect
effects of ethnicity on occupational SEI for the years of 1970, 1980, and 1990.
The first panel shows the gmss differences in SEI for each ethnic group com-
pared to white men. In spite of the overall upgrading ofaverage occupational
status (reported in Table 5.2), there has been remarkably little change m eth-
nic inequality over the twenty years observed here. The average employed
black man was thirteen SEI points behind the average employed white man in
1970 and ten points behind in 1990. The situation of American Indian and
Hispanic men was similar to that of black men, although both groups were
generally two to three SEI points closer to the status ofwhite men. All three of
these established minority groups held substantially lower-status occupations
than white men. In contrast, Asian American men were in occupations that
were, on average, as good as or better than those of white men. Whereas Fil-
ipino men held slightly lower statusjobs in 1990, Chinese andJapanese Amer-
ican men worked at higher-status positions than did white men.
The second panel shows ethnic differences net of the effects of age and
immigrant status. The total effects are almost identical to the gross effects.
Table 5.3. Effects of ethnicity on occupational attainment of men aged twenty-five to sixty-four
in the labor force 1970, 1980, and 1990 (average SEI points)
Gross
Total
Indirect via:Residence
Schooling
Sector
Direct
197019801990
197019801990
197019801990
197019801990
197019801990
197019801990
Black
-13-11-10
-13
-10
0
0
-7-6-5
00
-7-6-5
AmericanIndian
-9-8-9
-10-8-9
-1
-1
-6-4-5
000
-3-3-3
Japanese
2S7
268
-1-3-6
6710
000
-224
Chinese
676
587
-1
-4
567
000
34
Filipino
-30-2
-40
-1
-3-2-S
257
000
-3-3-3
Hispanic
-8-10-7
-9-10-7
-1
-1
-6-7-5
000
-2-2
SEI socioeconomic index.
...^--nku nf niirahio Inoniiallru
Because there are important ethnic differences in immigrant status
(Asians and Hispanics are more likely to be foreign born), one could con-
clude that there is little occupational handicap for immigrants.The third panel presents indirect effects (through which ethnic differ-
ences are mediated) in residence, schooling, and industrial sector. The
parameter estimates are dependent on the order in which the variables are
entered in successive equations. Although the temporal sequence of thesevariables cannot be specified with any assurance, we have estimated threeequations by adding each variable in a sequential and cumulative order.
First, place of current of residence is added to the model with ethnicity,age, and immigrant status as independent variables. In turn, the same exer-
cise is repeated for years of schooling and sector-adding the variable to
ilie prior equation and measuring the change in the ethnic coefficients.Die final equation shows the "direct effects" of ethnicity that remain afterall these other considerations are held constant.
Current place of residence has an unexpected role as a mediator of eth-nic advantage/disadvantage in occupational attainment. There is a slightdisadvantage for American Indians and Hispanics because they live in geo-graphical areas with a lower average SEI. Tlie effect on the black-white dif-
ferential is negligible. Residence appears to be a more serious handicapfor Asian Americans, especially in 1990. Japanese, Filipino, and Chinese
Americans have an average occupation that is four to six SEI points lowerin 1990 than they would have if their geographical distribution was thesame as for the population as a whole.
Educational composition plays two quite different roles for the six eth-
nic minorities in our samples. For the three disadvantaged minorities(blacks, American Indians, and Hispanics), having less education is the sin-
gle most important reason for their lower occupational attainment. The
absolute levels of occupational disadvantage associated witli education are
four to seven SEI points, and this accounts for about half or more of their
total SEI ethnic-disadvantaged status in 1990.In contrast, Asian Americans have much higher average levels of educa-
tion than the general population, and all other things being equal, this booststlieir occupational attainments. Indeed the occupational advantage associ-
ated with above-average levels of schooling for Asians has risen a bit over (lie
(wo decades, and there was about a seven-point SEI advantage for Chinese
and Filipinos and a ten-point SEI advantage forJapanese Americans in 1990.
In spite of the great attention given to "sector" or industry in the socio-
logical literature, this variable plays no role in mediating ethnic differences
in occupational attainment for any of the ethnic groups across the threelime periods represented here.
Race and Ethnic Snrinernnnmir Inonnalit" i" <+*> "!*’"< C-*"

The last panel in Table 5.3 shows the direct effects of ethnicity on occu-
pational attainment after all the relevant variablesfrom the census files are
included in the equations. The coefficients are modest, at least relative to
gross (or total) differences in occupational attainment. In 1990, holdingall measured variables constant, the average employed black man held an
occupation five SEI points lower than the average white man; American
Indian and Filipino men were three points lower; and Hispanics were one
point lower. The comparable direct effect of being Japanese or Chinesewas four SEI points above the white level.
Some interpret the net or direct effect as a measure of ethnic discrimi-
nation, but all we can really say is that the relationship is unexplained. Dis-
crimination (e.g., negative and positive preferences within certain labor
markets) may play a role, but other unmeasured factors, including familybackground and social networks, may also account for some of the differ-
ences. Moreover, discrimination may also be operating indirectly throughthe intervening variables (e.g., in funding for inner city or reservation
schools, funding that affects the quantity and quality of schooling).
Earnings Attainment
Table 5.4 presents comparable results for earnings attainment.
The twenty years from 1970 to 1990 was a period of stagnant wages and ris-
ing inequality in the American economy (Karoly 1993; Levy 1995). How
did the state of the economy play out in terms ofwage differences amongvarious subgroups of workers? The First panel ofTable 5.4 shows that eth-
nic differentials in male earnings were largely unchanged over the same
period. The black-white differential actually dropped a bit (from $14,700
in 1969 to $12,200 in 1979) and remained at $12,400 by 1989. American
Indian earnings fluctuated over the period, but their disadvantage relative
to whites of almost $13,000 in 1969 grew to $14,000 by 1989. Unlike all
other ethnic groups, Japanese men reached parity with the earnings of
whites in 1969 and had pulled ahead (by $7,000) in 1989. Chinese, Fil-
ipino, and Hispanic men earned less than whites in 1969 and continued to
do so in 1989, although the size of the differences peaked in 1979.
Holding constant age composition and immigrant status reveals the total
effects of ethnicity on earnings in the second panel of Table 5.4. By and
large, the pattern of ethnic advantage and disadvantage is similar to the
gross effects. Black and American Indian men are the most disadvantaged-about $12,000 to $13,000 below the average for white men. Hispanic men
are only slightly better off with a $9,300 earnings gap in 1989. Next are Fil-
ipinos and Chinese with deficits of $7,100 and $3,500 below white men.
Japanese Americans earned $7,600 more than white men in 1989.
Table 5.4. Effects of ethnicity on the earnings attainment of men aged twenty-five to sixty-fourin the labor force 1969, 1979, and 1989
Gross
Total
Indirect via:Residence
Schooling
Sector
Occupation
Weeks andHoursWorked
Direct
196919791989
196919791989
196919791989
196919791989
196919791989
196919791989
196919791989
196919791989
Black
-$14,691-$12,216-$12,351
-$14,664-$11,934-$12,062
-$115
$67-$465
-$4,084
-$3,360-$3,276
-$1,000-$1,081-$1,355
-$2,023-$1,638-$1,635
-$980
-$1,353-$1,618
-$9,036
-$6,342-$3,713
AmericanIndian
-$12,965-$9,351
-$14,012
-$12,772-$9,017
-$13,326
-$1,307
-$488-$843
-$3,476-$2,571-$3,777
-$1,118-$849-$912
-$1,030-$835-$992
-$1,118
-$1,344-$2,011
-$5,793
-$8,183-$4,791
Japanese
$301$1,930$7,227
$547$2,524
$7,634
$2,466
-$266-$3,911
$3,138$3,758$6,822
$456-$145-$327
-$571
$601$1,405
$20
-$46$162
-$2,723
$5,951$3,484
Chinese
-$2,885-$3,852-$3,507
-$1,858-$2.582
-$3.502
$1,682
$12-$2,451
$2,689$3,020$5.092
$220-$921
-$1,023
$348
$953
$1,361
-$318
-$514-$594
-$10,151-$10,055-$5,887
Filipino
-$10,083-$4,815-$6,578
-$8,232-$3,339
-$7,138
$2,017$5
-$3,398
$166$2,726$4,742
-$1,118-$541
-$1,178
-$959-$798-$877
-$652-$1.071
-$1.114
-$7,329-$8,183-$5,313
Hispanic
-$7,820-$11,481-$9,763
-$7.398-$10,665
-$9,329
-$1.307
$174-$561
-$4,165-$4,516-$3,518
-$730-$629-$539
-$763-$673-$421
-$763
-$721-$747
-$8.506
-$6.051-$3,543
We decompose the total effects of each ethnic group on earnings (aclu-;tlly the ethnic-white earnings gap) in the third panel. Place of residenceplays an unexpected role for Asian Americans. In 1969, the geographicalconcentration ofJapanese, Chinese, and Filipinos in Hawaii and Califor-nia was a distinct economic advantage-about $1,700 to $2,500-in com-
parison to whites. By 1989, these locations were a liability, with Asians
suffering a $2,500 to $3,900 deficit because of their concentrations in thesesame areas. The geographic distribution of black, American Indian, andHispanic men was a modest liability of several hundred dollars.
As with occupational attainment, education is the single most importantvariable mediating ethnic differentials in earnings. In 1989, about 25 to 33percent of the economic gap between black, American Indian, and Hispanic

men and white men can be explained by the lower educational attainment
of these minority groups; the difference is about $3,500 dollars. In contrast,
the higher education (compared to white men) ofJapanese, Chinese, and
Filipino men is the major reason for their higher earnings ($4,700 for Fil-
ipino men, $5,100 for Chinese men, and $6,800 forjapanese men).
Holding constant all of the measured background variables, including
education, minorities were usually found in occupations and sectors that
paid substantially less than those occupied by white men. The sum of the
indirect effects of ethnicity on earnings via both occupation and sector was
about $3,000 for black men, $2,000 for American Indians, and $1,000 for
Hispanic men. The job sorting process for Filipino men reveals an eco-
nomic disadvantage comparable to American Indian men. On the other
hand, Chinese andJapanese do relatively well in finding well-paying occu-
pations. However, all groups, with the exception ofJapanese men, have a
problem finding jobs that employ them for enough hours per week and
weeks per year to close the gap with white men. For black and American
Indian men, the problems of unemployment and underemployment cost
them about $2,000 relative to white men. The economic penalty for the
other groups is less, ranging from $600 to $1,100.
The final panel of Table 5.4 shows the direct effects of ethnicity after
controlling for all of the covariates included in prior models. The magni-
tude of the deficits due to direct effects is substantial: in the range of$5,000
to $10,000 for all ethnic groups (except Japanese) in 1969. There have
been changes, mainly in reducing the size of the deficit, for the twenty-year
period measured here: However, by 1989, all minority groups (with the
exception ofJapanese) still experienced very substantial direct deficits rel-
ative to whites-in the range of $3,500 to $5,900.
Rather than speculate on the reasons for the residual net effects, it may
be more instructive to consider the overall magnitude and patterns of eth-
nic inequality. There are three ethnic "patterns" of earnings inequality.
The first is represented by blacks, American Indians, and Hispamcs. These
groups suffer substantial inequality relative to whites (about $10,000 per
year) and there has been little moderation over time. About 25 to 33 per-
cent of the gap is due to lower educational levels, but the remainder is due
to differences on labor market factors: occupation, industry, weeks and
hours worked, and other unmeasured factors. The second type or pattern
is illustrated by Chinese and Filipinos. The size of the deficit for these
groups is about half the size of that for blacks, Hispanics, and American
Indians. The sources of the Chinese and Filipino disadvantage are current
residence labor market positions, and unmeasured factors. Their poten-
tial disadvantage is reduced by their higher levels of schooling. In fact,
tlieir educational advantage over whites generates (all else being equal)
about a $5,000 gain. Without this educational "boost," their economic sii-
nations would be similar to the level of blacks, American Indians, and His-
punics. Finally, the third pattern is represented by the Japanese. Japanesehave higher incomes than whites in 1979 and 1989. In large part, this is
due to their higher educational attainment, but they also experience an
"advantage" that is not measured by the variables in the model.
Conclusions
There was much talk in the 1990s about rffvmcdiscrimination, the
problems of white men who are unable to findjobs or obtain promotionsbecause of preferences given to minorities. These perceptions seem quiteai odds with the findings of this chapter, findings which show only modest’-lianges in race and ethnic stratification among male workers over tlie two
decades from 1970 to 1990.However, we show that the patterns of race and ethnic inequality are
(Oinplex. Looking first at occupational attainment, black, American
Indian, and Hispanic men suffer about a ten-point SEI occupational deficit
relative to whites, while Asian American men are equal to or above wliite
men in their occupational positions.For the groups that are behind whites, tlie "problem" is primarily edu-
cational deficits. If black, American Indian, and Hispanic men had educa-
tional attainments equal to whites, tlie results liere suggest that they wouldonly experience modest occupational disadvantages. There would still be
a five-point SEI deficit for black men, but this would be half of tlieir cur-
icnt handicap. The reason for the higher occupational attainment ofAsianAmerican men is simply their educational level. If the Asian American men
had the same education as white men, there would be only modest ethnic
)ccupational differences.
Turning to differences in income, earnings inequality is a much deeperproblem for racial and ethnic minorities in America. All minorities, witli
(lie exception ofjapanese, earn less than whites. For blacks, American Indi-
ans, and Hispanics, the financial shortfall relative to whites is huge-about510,000 per male worker for the period under study-and there lias been
little sign of progress. Chinese and Filipino men are also behind, but the
gap is somewhat less.These results-tlie persistence ofrace and ethnic differentials in late twen-
tieth-century America-challenge conventional theories about tlie decliningrole ofascribed factors in the American stratification system. There are three
"big" hypotheses in the stratification literature that need to be reviewed in
light of these findings. The first is the "inheritance of poverty" thesis-some
groups are disadvantaged because of their social origins. Without any mea-

sures of die characteristics of the families of origin, census data do not per-
mit a direct test of this hypothesis. Although not the most important factor,
some studies have demonstrated thatfamily-of-origin characteristics are a par-
tial explanation ofblack-white socioeconomic inequality (Duncan 1969). It is
plausible that differential social origins play an important role in the gener-
ation of socioeconomic differentials for other ethnic groups.The second hypothesis is the relative role of qualifications versus dis-
crimination in accounting for socioeconomic attainment. If the economy
worked according to meritocratic precepts, then measures such as educa-
tion and other personal attributes that make workers more productivewould be the major determinants ofsocioeconomic success. Ofcourse, the
economy is not an impersonal machine; it is human beings who in fact
recruit and promote workers. This leaves open the possibility that employ-
ers and supervisors hire and reward workers on the basis of invidious dis-
tinctions, not only according to their qualifications. By measuring the
impact of education on occupation and earnings, it is possible to get an
approximate reading on the role of "qualifications" versus other factors.
Our results show that education plays a critical role in reproducing inequal-
ity across race and ethnic lines. In other words, one path to economic attain-
ment is educational attainment. But most ethnic inequality is unexplained
by education and other measures of the relative quality of workers. Does
this mean that discrimination is operating? Perhaps. In slack labor markets,
employers can select among many qualified applicants. It would be sur-
prising if gatekeepers ignored ethnic characteristics as irrelevant to hiring
decisions. The traditional image of discrimination is one of a color bar-
where racial minorities are simply excluded. The modern style is to avoid
hiring certain minority groups because "they" are more prone to be unre-
liable, cause discipline problems, or not fit in with other workers.
A third hypothesis in the stratification literature that should be reviewed
is that ethnic inequality is generated by the structure of employing orga-
nizations. In addition to large public institutions and private corporations,
there are tens of thousands of small businesses whose ownership and man-
agement is closely lied to geographical, kinship, and ethnic boundaries.
The ethnic enclave is not simply a geographical concentration of enter-
prises, but loosely structured informal relationships among businesses for
whom ethnicity signals the presumption of trust. These informal ties serve
to organize the recruitment oflabor throughout many industries and firms
in the economy, meaning that some minority groups are found in partic-
ular sectors and not others. Although census data are not particularly
appropriate for examining this kind of hypothesis, our results suggest that
the informal economy may be an important dimension behind the high
levels of racial and ethnic inequality in the American labor market.
The economy of the latter half of the 1990s has been characterized byising opportunity, with a record low unemployment rate. Will this reduceihe kinds of persistent racial and ethnic inequalities we have documentedtor the 1970s and 1980s? Perhaps. Tight labor markets make it more costlylor employers to make invidious distinctions among workers. But the slowpace of change during the 1970s and 1980s suggests that racial inequalityi-< woven deeply into the fabric ofAmerican society.
Race and Ethnic Socioeconomic Ineniialitv in the Unit-pd States 101