Embed Size (px)
Citation preview

8/8/2019 The Spoores Report - November 1-2010
http://slidepdf.com/reader/full/the-spoores-report-november-1-2010 1/26
Cycles Converge to Eliminate Price Bump,Though Pressures Build for Higher Prices.
November 1, 2010

8/8/2019 The Spoores Report - November 1-2010
http://slidepdf.com/reader/full/the-spoores-report-november-1-2010 2/26
Welcome toThe Spoores Report
A knowledgeable buyer is an empowered buyer.
We closely follow hundreds of economic variables, price points, and experts inorder to eliminate guessing and speculation.
This is a general overview of a few key indicators. At internal and externalspeaking engagements, I typically get more detailed on the points made here.
What follows is a brief view of how we s ee the steel market. Feel free to emailquestions to [email protected]
Thank you for reading,Josh Spoores
To be included on our mailing list, register at http://research.majesticsteel.comFor more timely data, stay updated via twitter at www.twitter.com/steelresearchEntire report is © 2010 Majestic Steel USA, Inc.Disclaimer: Information and views expressed in this report are strictly those of the writer and do not necessarily reflect the views of Majestic Steel USA. This report contains forward looking statements meant only
to provide a view moving forward. Anyone using these views to plan their business assumes all liabili ty as these views do not and cannot replace thinking for oneself. Neither Majestic Steel USA nor JoshSpoores makes any representation or warranty, either express or implied, as to the accuracy, completeness or reliability of information presented. Majestic Steel USA word mark and logo and The SpooresReport trademarks are all owned by Majestic Steel USA, Inc. and cannot be reproduced without Majestic’s express consent. Further, any use of marks or materials owned by third parties are for descriptivepurposes only.
2

8/8/2019 The Spoores Report - November 1-2010
http://slidepdf.com/reader/full/the-spoores-report-november-1-2010 3/26
UpcomingSpeaking Engagements
• Session Chairman at CRUNorthAmerica Steel Conference
•
Presenting 2011 Forecast at SteelBusiness Briefing ’s Global SteelMarkets Conference in New York.
3
8/8/2019 The Spoores Report - November 1-2010
http://slidepdf.com/reader/full/the-spoores-report-november-1-2010 4/26
In This Issue
• Prices have fallen quickly, though pressures are building tostabilize or support prices in the near future:
– Several states have year end inventory tax, creatingartificially low inventories in some areas before rebuildingwith January delivery.
– Seasonal increases in Auto Production and Durable Goodswill soon create the need to lock in future steel production.
– Price arbitrage between the US and global markets mayallow mills to increase exports, tightening domestic supply.
– Mills set to seasonally slow production in November-December, extending lead times quickly into January,forcing a pickup in orders to secure needed steel.
4

8/8/2019 The Spoores Report - November 1-2010
http://slidepdf.com/reader/full/the-spoores-report-november-1-2010 5/26
Steel Prices/Lead Times
• The “price bump” has beenfully realized as prices havefallen quickly.
• Average FR Lead times havefallen to the lowest levels of the year.
– Why wasn’t this increasesustainable?
– When might a new “pricebump” occur?
5Source: Majestic Steel
4.0
5.0
6.0
7.0
8.0
9.0
10.0
$400
$450
$500
$550
$600
$650
$700
$750
May-10 Jun-10 Jul-10 Aug-10 Sep-10 Oct-10
HR Prices vs. Average FR Lead Times
HR Price Composite FR Lead Times (right axis)

8/8/2019 The Spoores Report - November 1-2010
http://slidepdf.com/reader/full/the-spoores-report-november-1-2010 6/26
Sustainability of Prices
The price increase wasn’tsustainable because:
1. Occurred as lead timesextended into seasonallyweaker demand.
2. Service Centers (largestsource of mill demand) hadfully built inventories.
3. Price bump pulled demandahead, weakening demandduring already seasonallyweaker 4 th quarter.
6
$500$520$540$560$580$600$620$640$660
CME Forward Price Curve - HRC
Source: CME – as of 10/28 settlement

8/8/2019 The Spoores Report - November 1-2010
http://slidepdf.com/reader/full/the-spoores-report-november-1-2010 7/26
Global Steel Production
• Global production is set toreach a new high of nearly 1.4billion mt, likely increasingfurther in 2011.
• With higher 2011 production,raw materials will likely behigher on average than 2010.
• Production in the UScontinues to come down fromspring highs as demandwanes.
7
0
200,000400,000
600,000
800,000
1,000,000
1,200,000
1,400,000
1,600,000
World Steel Production
Sources: WSA, Majestic Steel (daily annualized global production), and AISI
30.0%
40.0%
50.0%
60.0%
70.0%
80.0%
Steel Capacity In Use - USA

8/8/2019 The Spoores Report - November 1-2010
http://slidepdf.com/reader/full/the-spoores-report-november-1-2010 8/26
Flat Rolled (FR) Imports
• FR imports have remainedrelatively steady in 2010,though 42% lower than2004-08 average.
• Year to date, FR importsare 29% higher than 2009with HR up 53%, CR down19%, and HDG up 34%.
8
050,000
100,000150,000200,000
250,000300,000350,000400,000450,000
Jan-10 Feb-10 Mar-10 Apr-10 May-10 Jun-10 Jul-10 Aug-10 Sep-10
2010 Imports vs. 9 Month Avg
FR Imports 2010 Average
Source: Census
8/8/2019 The Spoores Report - November 1-2010
http://slidepdf.com/reader/full/the-spoores-report-november-1-2010 9/26
Flat Rolled Imports
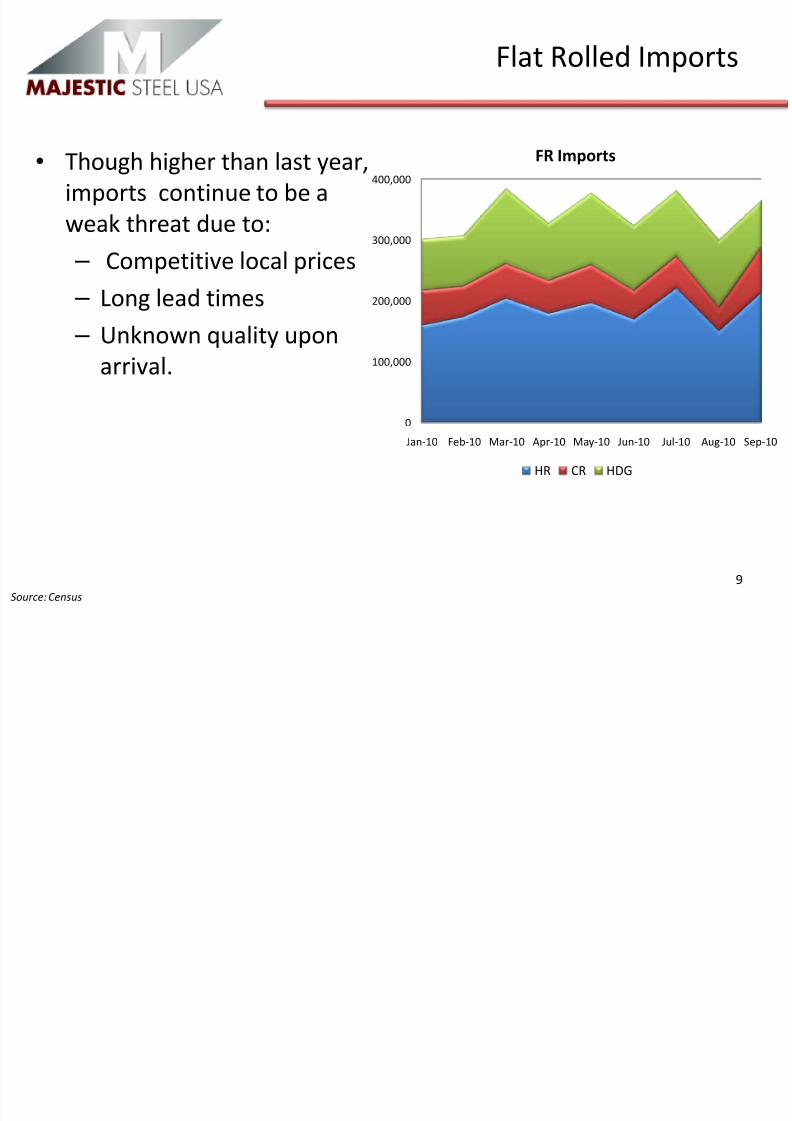
• Though higher than last year,imports continue to be aweak threat due to:
– Competitive local prices – Long lead times – Unknown quality upon
arrival.
9
0
100,000
200,000
300,000
400,000
Jan-10 Feb-10 Mar-10 Apr-10 May-10 Jun-10 Jul-10 Aug-10 Sep-10
FR Imports
HR CR HDG
Source: Census

8/8/2019 The Spoores Report - November 1-2010
http://slidepdf.com/reader/full/the-spoores-report-november-1-2010 10/26
Steel Price Arbitrage
• Latest spot and future pricesshow significant opportunitybetween domestic prices andhigher global prices.
• This price arbitrage may allowUS mills to export excessproduction in order to tighten
the supply of domesticmarkets.
10
$450
$500
$550
$600
$650
$700
US Northern EU Southern EU China
December Swap Prices
Source: CME, LCH.Clearnet, FIS

8/8/2019 The Spoores Report - November 1-2010
http://slidepdf.com/reader/full/the-spoores-report-november-1-2010 11/26
Service Center Statistics
• September shipments (per day)were the highest in 2 years,while relative inventories appearmanageable.
• Shipments may have been highdue to price increase pushingshipments through supply chain.
• Inventory growth showsincreasing gap betweenInventory and shipments asseasonality is set to slowshipments.
11
0
1,000
2,000
3,000
4,0005,000
6,000
7,000
Shipment vs Inventory
Shipments Inventory
25.030.035.040.045.050.055.060.0
65.0
0
1,000
2,000
3,000
4,000
5,000
Shipments Inventory Days of Inventory (rt side)
Source: MSCI, Majestic Steel

8/8/2019 The Spoores Report - November 1-2010
http://slidepdf.com/reader/full/the-spoores-report-november-1-2010 12/26
Service Center Statistics
• Inventory growth has surpassedshipment growth, with seasonalweakness ahead.
• With short lead times andunder-utilized capacity,inventory can stay low, thoughany seasonal increase in demandwill quickly pressure prices
higher until inventories can beadjusted.
12
-58.0%
-38.0%
-18.0%
2.0%
22.0%
42.0%
62.0%
Flat Rolled Year-Year % Change by Month
Daily Shipping Rate Inventory
Source: MSCI, Majestic Steel

8/8/2019 The Spoores Report - November 1-2010
http://slidepdf.com/reader/full/the-spoores-report-november-1-2010 13/26
Durable Goods
• New orders of durable goods(excluding aircraft) comparedto shipments show howmanufacturing led theeconomic recovery.
• Recent data appears to showthis momentum has leveledout.
13
-30.0%
-20.0%
-10.0%
0.0%
10.0%
20.0%
30.0% Year over Year % Change
New Orders Shipments
-30.0%
-15.0%
0.0%
15.0%
30.0%
$130,000
$140,000
$150,000
$160,000
$170,000
$180,000
$190,000
New Orders of Durable Goods
Yearly % Change New OrdersSource: Census

8/8/2019 The Spoores Report - November 1-2010
http://slidepdf.com/reader/full/the-spoores-report-november-1-2010 14/26
DurablesFabricated Metal Products
• Top segment of servicecenter demand shows aslowing level of growth.
• Relative inventory levelsmeanwhile have gotten backin line with orders, whilebacklogs have been flat for16 months.
14
-30.0%
-20.0%
-10.0%
0.0%
10.0%
20.0%
$20,000
$22,000
$24,000
$26,000
$28,000
New Orders-Fab Metal Products
% year to year New Orders
-30.0%
-20.0%
-10.0%
0.0%
10.0%
20.0%Year to Year % Change
New Orders Shipments
Source: Census
8/8/2019 The Spoores Report - November 1-2010
http://slidepdf.com/reader/full/the-spoores-report-november-1-2010 15/26
ConstructionNonresidential
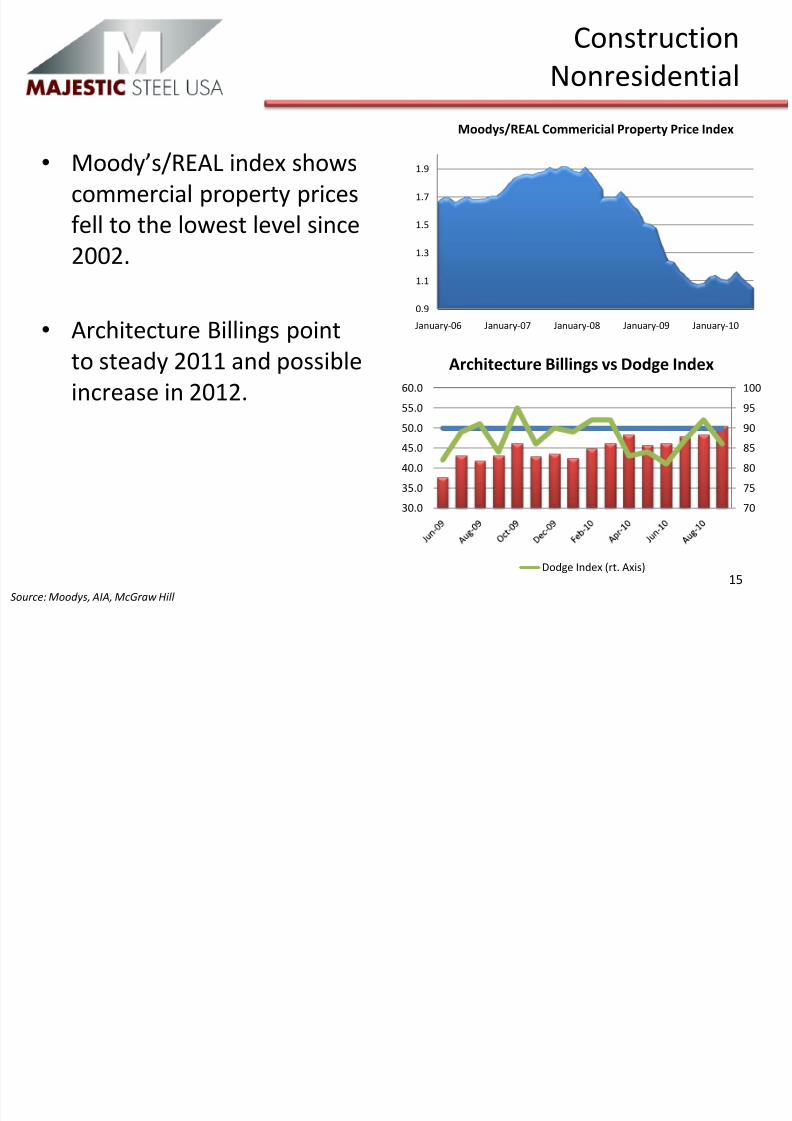
• Moody’s/REAL index showscommercial property pricesfell to the lowest level since2002.
• Architecture Billings pointto steady 2011 and possibleincrease in 2012.
15
0.9
1.1
1.3
1.5
1.7
1.9
January-06 January-07 January-08 January-09 January-10
Moodys/REAL Commericial Property Price Index
70
75
80
85
90
95
100
30.0
35.0
40.0
45.0
50.0
55.0
60.0
Architecture Billings vs Dodge Index
Dodge Index (rt. Axis)
Source: Moodys, AIA, McGraw Hill

8/8/2019 The Spoores Report - November 1-2010
http://slidepdf.com/reader/full/the-spoores-report-november-1-2010 16/26
ConstructionNonresidential
• McGraw Hill Constructiondata points to comingpositive growth.
• While Census data shows thecontinued deterioration of construction spending.
• Presentation at SBB GlobalSteel Conference will cover2011 and 2012 estimates.
16
-50.0%
-40.0%
-30.0%
-20.0%
-10.0%
0.0%
10.0%
20.0%
30.0%
40.0%
Nonresidential Construction Starts
Current to rolling 12 month average Year to year % Change
$200,000
$250,000
$300,000
$350,000
$400,000
$450,000
Jan-08 May-08 Sep-08 Jan-09 May-09 Sep-09 Jan-10 May-10
Private Nonresidential Construction Spending
Source: Census, McGraw Hill

8/8/2019 The Spoores Report - November 1-2010
http://slidepdf.com/reader/full/the-spoores-report-november-1-2010 17/26
ConstructionResidential
• Residential construction hasbeen skimming along thebottom after the tax credit.
• Seasonal weakness will likelyaffect net figures until thespring build.
• Inventories have declined,however the start to sold ratioat 125% is higher than 4 yearaverage of 73% and ispotential source of weakness.
17
20,000
30,000
40,000
50,000
60,000
70,000
80,000 Housing Starts vs Permits
Completions Permits Starts
0
100,000
200,000
300,000
400,000
500,000
600,000
0%
20%
40%
60%
80%
100%
120%
140%
Home Starts as % of Sold
New Inventory Start to Sold (left axis)Source: Census

8/8/2019 The Spoores Report - November 1-2010
http://slidepdf.com/reader/full/the-spoores-report-november-1-2010 18/26
Automotive
• Automotive sales have beenrelatively steady, and are setto come in around 11.2 millionin 2010, a 7.7% increase on2009.
• Well-managed inventory levelshave allowed production toincrease 50% so far YTD.
• Production in November andDecember looks to weakenseasonally before picking up inQ1.
18
0
200,000
400,000
600,000
800,000
1,000,000
1,200,000
1,400,000
Monthly Un-Adjusted Light Weight Auto Sales
0
20
40
60
80
100
Mar-09 Jun-09 Sep-09 Dec-09 Mar-10 Jun-10 Sep-10
Total US Inventory
Days of Inventory Ideal Inventory
Source: Wards Automotive

8/8/2019 The Spoores Report - November 1-2010
http://slidepdf.com/reader/full/the-spoores-report-november-1-2010 19/26
Appliances
• Appliance shipments haddemand pulled forward withappliance rebate and housingtax credit.
• Black Friday sales may help tospur more shipments andbridge production levels tospring strength.
19
-20.0%
-15.0%
-10.0%
-5.0%
0.0%
5.0%
10.0%
15.0%
20.0%AHAM-6 appliances
Source: AHAM

8/8/2019 The Spoores Report - November 1-2010
http://slidepdf.com/reader/full/the-spoores-report-november-1-2010 20/26
Zinc
• For Galvanized sheet, zinc canreflect as much as 25% of thetotal price, depending on thethickness.
• Goldman Sachs recently raisedestimate to $3,000/mt or$1.36/lb even thoughestimates by ILZSG show a
surplus in 2010 and 2011.
20
$0
$500
$1,000
$1,500
$2,000
$2,500
$3,000
$3,500
$4,000
$4,500
$5,000
0
100,000
200,000
300,000
400,000
500,000
600,000
700,000
800,000
900,000
1,000,000
Zinc 2005 Through Present Price vs Inventory
Inventory Price (right axis)
Source: LME

8/8/2019 The Spoores Report - November 1-2010
http://slidepdf.com/reader/full/the-spoores-report-november-1-2010 21/26
Zinc
• Though zinc is in a surplus, the2009 surplus was only 4% of usage, which is very minimal.
• As the Fed prints money andkeeps rates low, investmentfunds continue to seekinvestment opportunity andthey continue to pushcommodity prices higher.
21
0100000020000003000000400000050000006000000700000080000009000000
Metal Production Metal Usage Surplus
Tightening Zinc Surplus
2009 2010
Surplus data is YTD through August for both 2009 and 2010. Source: ILZSG
Source: ILZSG

8/8/2019 The Spoores Report - November 1-2010
http://slidepdf.com/reader/full/the-spoores-report-november-1-2010 22/26
Scrap Prices
• This price index represents thetypical cost of scrap to melt aton of steel, excluding othermetallics.
• Index shows scrap prices arethe highest ever for October.
• As a percent of HR price, meltmix represents 51% of spot HRprice, higher than 8 yearaverage of 38%, reflectingtight mill margins.
22
0.0
50.0
100.0
150.0
200.0
250.0
300.0
350.0Scrap Melt Price Index (2003=100)
*
*Note: scrap is priced in gross ton or 12% higher than a short ton,whereas index is to produce a short ton of steel.
Source: Market Data, Majestic Steel

8/8/2019 The Spoores Report - November 1-2010
http://slidepdf.com/reader/full/the-spoores-report-november-1-2010 23/26
Scrap Prices
• Recently presented at both AMM Scrap & Raw Materialsconferences and as always gained an invaluable amount of insight.
23
Scrap Factoid:Turkey is 16% of our exports,but US scrap is only 21% of their imports, making pricesand exchange rates increasinglyimportant to US exporters.
Scrap Factoid:Due to winter weather, scrap collectiontypically falls in winter months for key scrapgenerating regions. Checking my calendar, itseems far too early to tout this as a driver of prices in November or December.
Scrap Factoid:Scrap is primarily sold in first week of month making mid month dealssomething of note. Recently, the increased level of mid-month deals have ledto increased market chatter, and more confusion as monthly prices divergefrom the gossip.

8/8/2019 The Spoores Report - November 1-2010
http://slidepdf.com/reader/full/the-spoores-report-november-1-2010 24/26
Summary
• Prices have come down in line with seasonally slower forwarddemand. Service center inventories look ok, though OctoberMSCI shipments typically decline from September into Decemberas durable goods orders, construction, and automotive demandseasonally slows. If inventories stay relatively flat, they will revertto slightly excessive, which is why prices have been declining.
• Looking forward, January MSCI shipments will likely increase to arate higher than October, possibly September, creating a need forhigher inventory levels.
• Plenty of risk remains with the introduction of new flat rolledcapacity in the Southeast (2010 and 2011), as demand strugglesto truly grow.
24

8/8/2019 The Spoores Report - November 1-2010
http://slidepdf.com/reader/full/the-spoores-report-november-1-2010 25/26
Summary
• The dollar exchange rate is one key to the changing dynamic of the domestic steel market as it affects raw materials.
• It would not surprise me to see prices appear ready to move upbefore Thanksgiving, the only question is if it is another “pricebump” or something more sustainable.
• Price pressures are building and these are likely to either: – Help stabilize prices. – Push prices higher as seasonal effects change the
supply/demand balance.• Increased prices depend upon improved supply/demand balance
through mills slowing production and increasing exports.
25

8/8/2019 The Spoores Report - November 1-2010
http://slidepdf.com/reader/full/the-spoores-report-november-1-2010 26/26
Email with Questions or Comments [email protected]
Follow us www.twitter.com/steelresearch
26


![Cyclone Sidr Response Program Completion Report (November ... · Cyclone Sidr Response Program Completion Report (November 2007 to May 2010 ... [16 August 2010, Dhaka, Bangladesh]](https://img.pdfslide.us/doc/110x75/5ea5356967248655ff5bd938/cyclone-sidr-response-program-completion-report-november-cyclone-sidr-response.jpg)