Embed Size (px)
Citation preview
{
The Spatial Invasive Infestation and Priority Analysis (SIIPA) GIS tool
Deb Stone Invasive Plant Program Supervisor, SJRWMD

Figure 1. Flow chart for Adaptive Management of Weeds describing management actions and decisions confronting natural area managers (from Randall (1997), based on a diagram by Oren Pollak, personal communication).
Weed Management Template
1. Establish conservation targets and goals
2. Identify and prioritize species/infestations that threaten targets and goals
3. Assess control techniques
4. Develop and implement weed management plan
5. Monitor and assess impact of management actions
6. Review and modify
Taken from Ellen Jacquart
Never enough time and resources to get it all done Success is less likely without directed effort Identify goals Select winnable battles Direction keeps us from going crazy
Why Prioritize?
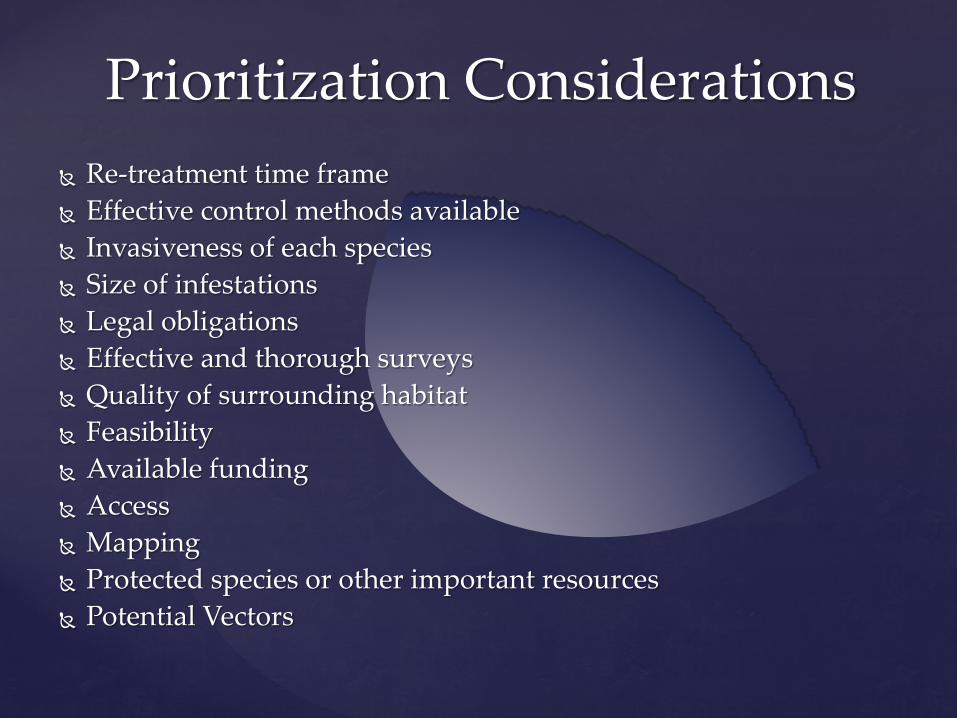
Re-treatment time frame Effective control methods available Invasiveness of each species Size of infestations Legal obligations Effective and thorough surveys Quality of surrounding habitat Feasibility Available funding Access Mapping Protected species or other important resources Potential Vectors
Prioritization Considerations
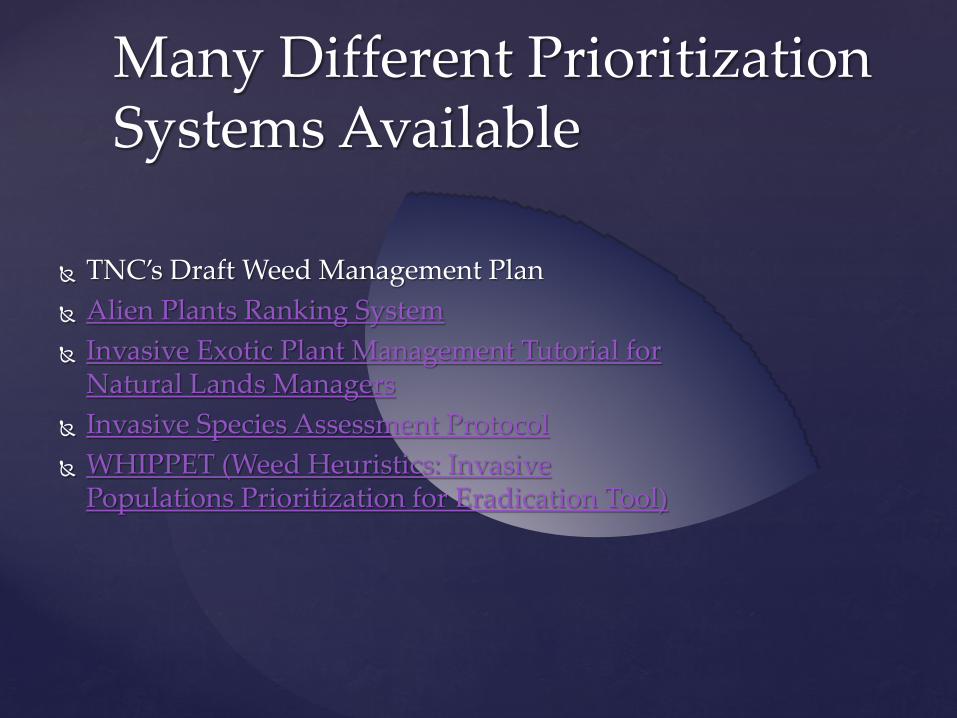
TNC’s Draft Weed Management Plan Alien Plants Ranking System Invasive Exotic Plant Management Tutorial for
Natural Lands Managers Invasive Species Assessment Protocol WHIPPET (Weed Heuristics: Invasive
Populations Prioritization for Eradication Tool)
Many Different Prioritization Systems Available
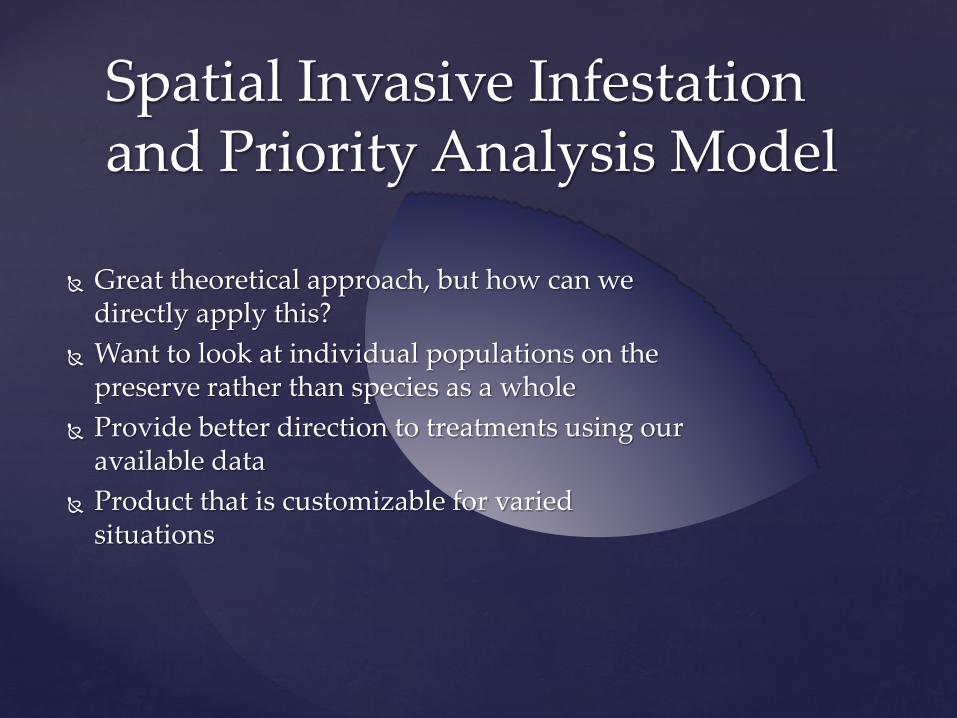
Great theoretical approach, but how can we directly apply this?
Want to look at individual populations on the preserve rather than species as a whole
Provide better direction to treatments using our available data
Product that is customizable for varied situations
Spatial Invasive Infestation and Priority Analysis Model
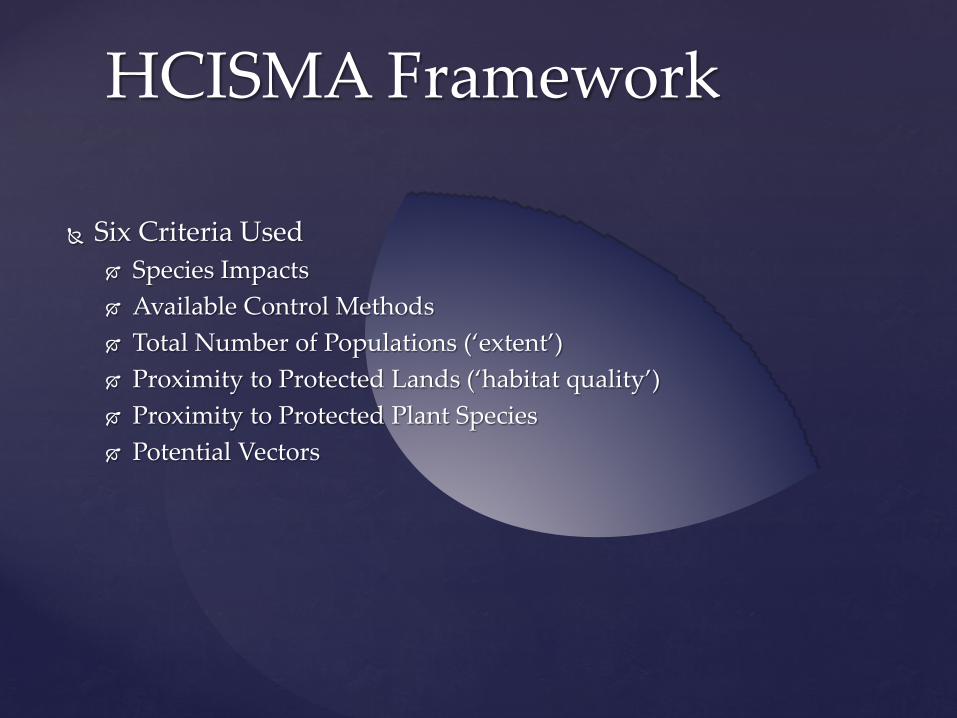
Six Criteria Used Species Impacts Available Control Methods Total Number of Populations (‘extent’) Proximity to Protected Lands (‘habitat quality’) Proximity to Protected Plant Species Potential Vectors
HCISMA Framework
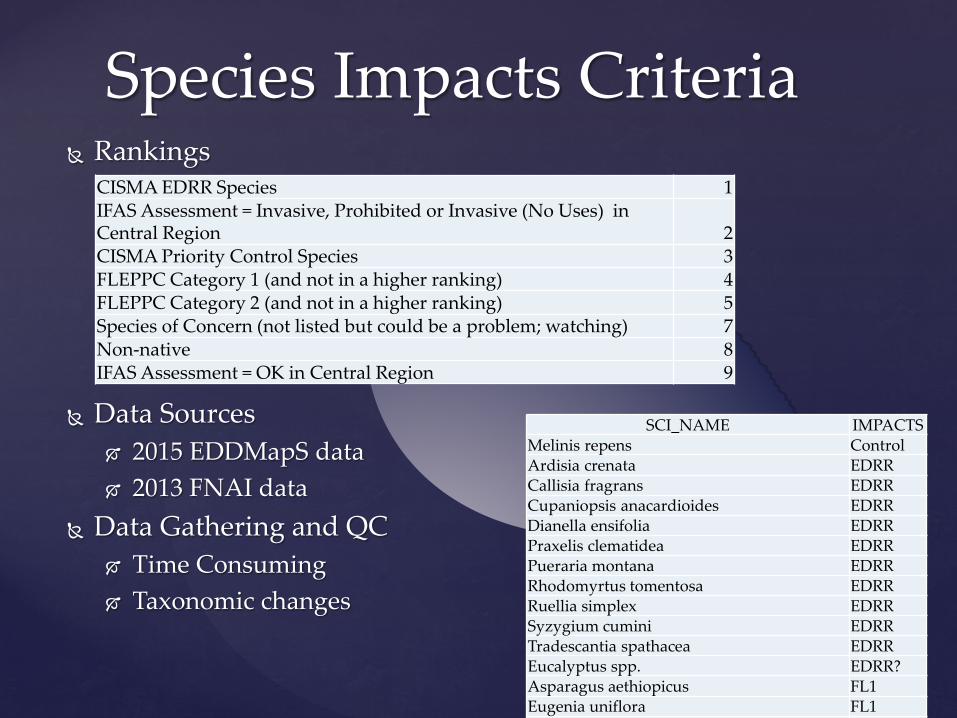
Rankings
Data Sources 2015 EDDMapS data 2013 FNAI data
Data Gathering and QC Time Consuming Taxonomic changes
Species Impacts Criteria CISMA EDRR Species 1 IFAS Assessment = Invasive, Prohibited or Invasive (No Uses) in Central Region 2 CISMA Priority Control Species 3 FLEPPC Category 1 (and not in a higher ranking) 4 FLEPPC Category 2 (and not in a higher ranking) 5 Species of Concern (not listed but could be a problem; watching) 7 Non-native 8 IFAS Assessment = OK in Central Region 9
SCI_NAME IMPACTS Melinis repens Control Ardisia crenata EDRR Callisia fragrans EDRR Cupaniopsis anacardioides EDRR Dianella ensifolia EDRR Praxelis clematidea EDRR Pueraria montana EDRR Rhodomyrtus tomentosa EDRR Ruellia simplex EDRR Syzygium cumini EDRR Tradescantia spathacea EDRR Eucalyptus spp. EDRR? Asparagus aethiopicus FL1 Eugenia uniflora FL1
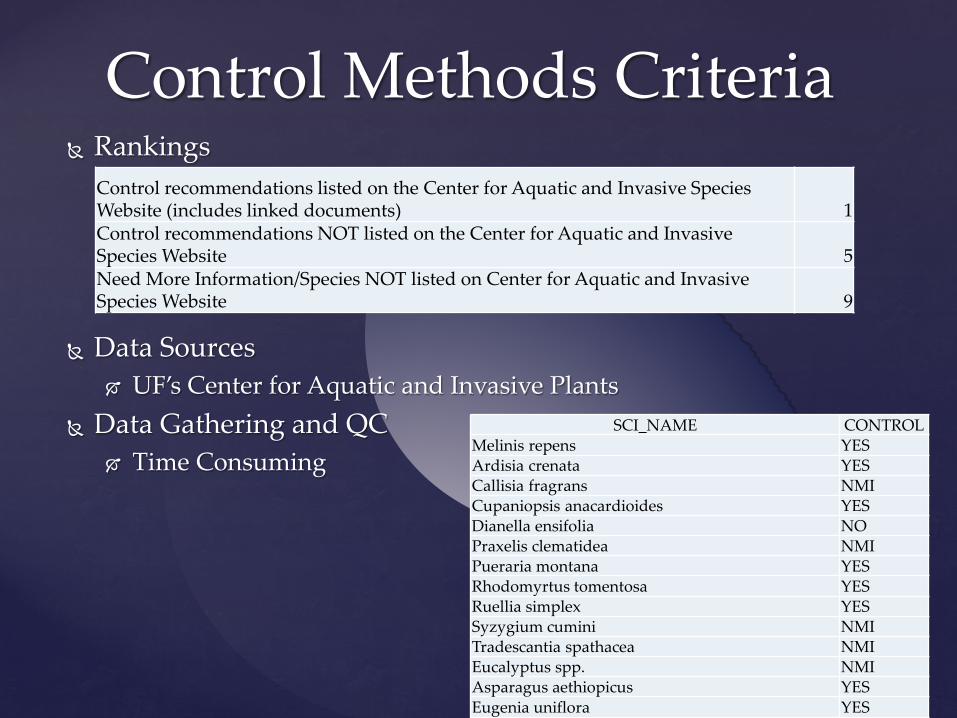
Rankings
Data Sources
UF’s Center for Aquatic and Invasive Plants Data Gathering and QC
Time Consuming
Control Methods Criteria Control recommendations listed on the Center for Aquatic and Invasive Species Website (includes linked documents) 1 Control recommendations NOT listed on the Center for Aquatic and Invasive Species Website 5 Need More Information/Species NOT listed on Center for Aquatic and Invasive Species Website 9
SCI_NAME CONTROL Melinis repens YES Ardisia crenata YES Callisia fragrans NMI Cupaniopsis anacardioides YES Dianella ensifolia NO Praxelis clematidea NMI Pueraria montana YES Rhodomyrtus tomentosa YES Ruellia simplex YES Syzygium cumini NMI Tradescantia spathacea NMI Eucalyptus spp. NMI Asparagus aethiopicus YES Eugenia uniflora YES
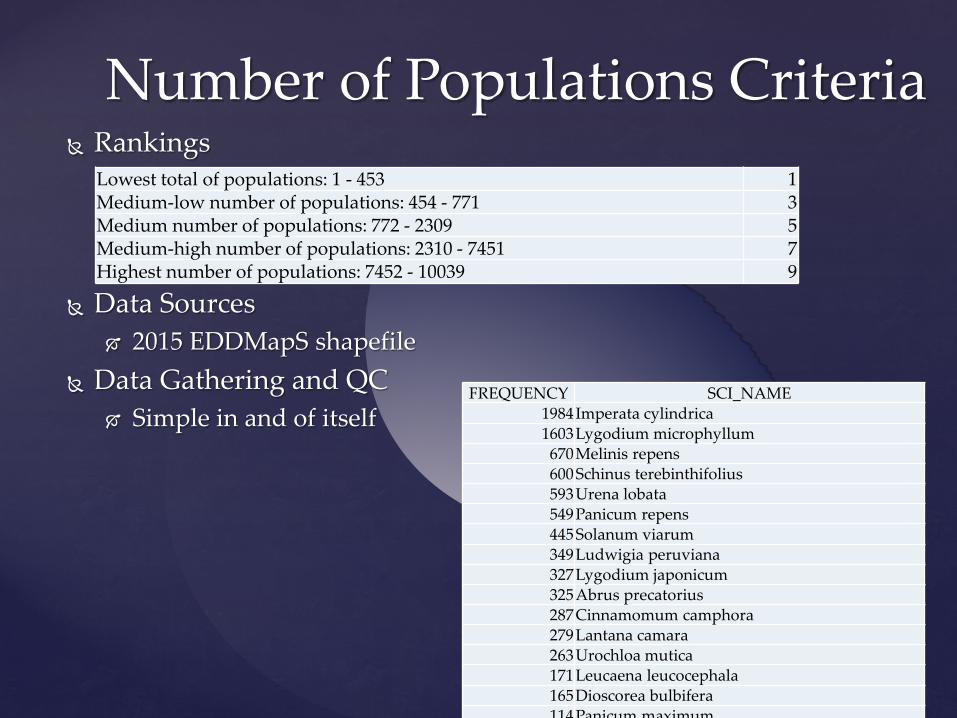
Rankings
Data Sources 2015 EDDMapS shapefile
Data Gathering and QC Simple in and of itself
Number of Populations Criteria Lowest total of populations: 1 - 453 1 Medium-low number of populations: 454 - 771 3 Medium number of populations: 772 - 2309 5 Medium-high number of populations: 2310 - 7451 7 Highest number of populations: 7452 - 10039 9
FREQUENCY SCI_NAME 1984 Imperata cylindrica 1603 Lygodium microphyllum 670 Melinis repens 600 Schinus terebinthifolius 593 Urena lobata 549 Panicum repens 445 Solanum viarum 349 Ludwigia peruviana 327 Lygodium japonicum 325 Abrus precatorius 287 Cinnamomum camphora 279 Lantana camara 263 Urochloa mutica 171 Leucaena leucocephala 165 Dioscorea bulbifera 114 Panicum maximum
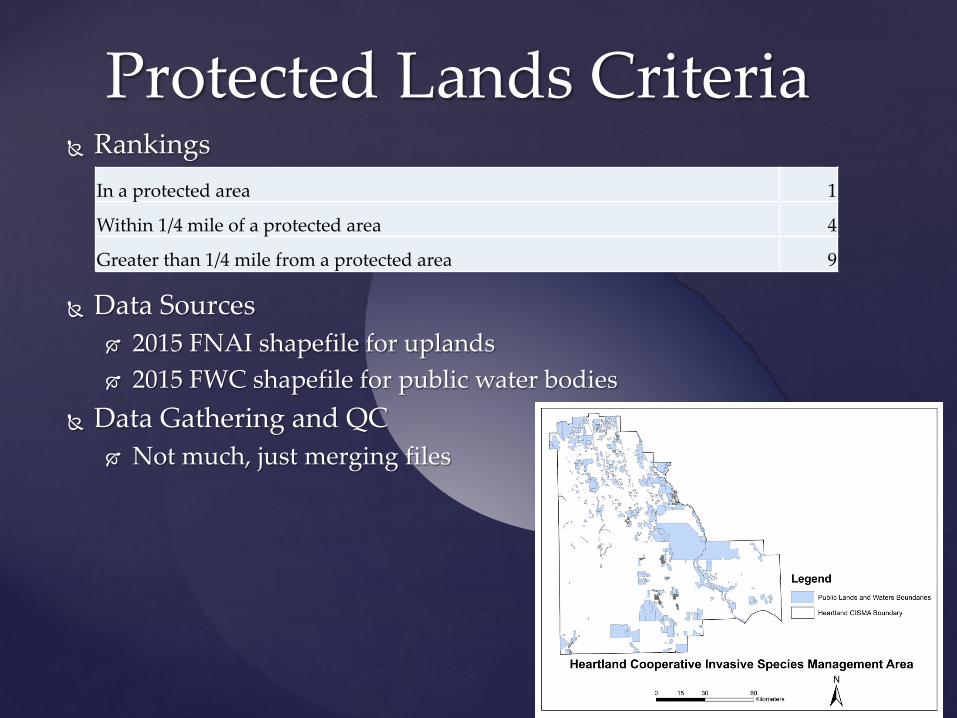
Rankings
Data Sources 2015 FNAI shapefile for uplands 2015 FWC shapefile for public water bodies
Data Gathering and QC Not much, just merging files
Protected Lands Criteria In a protected area 1
Within 1/4 mile of a protected area 4
Greater than 1/4 mile from a protected area 9
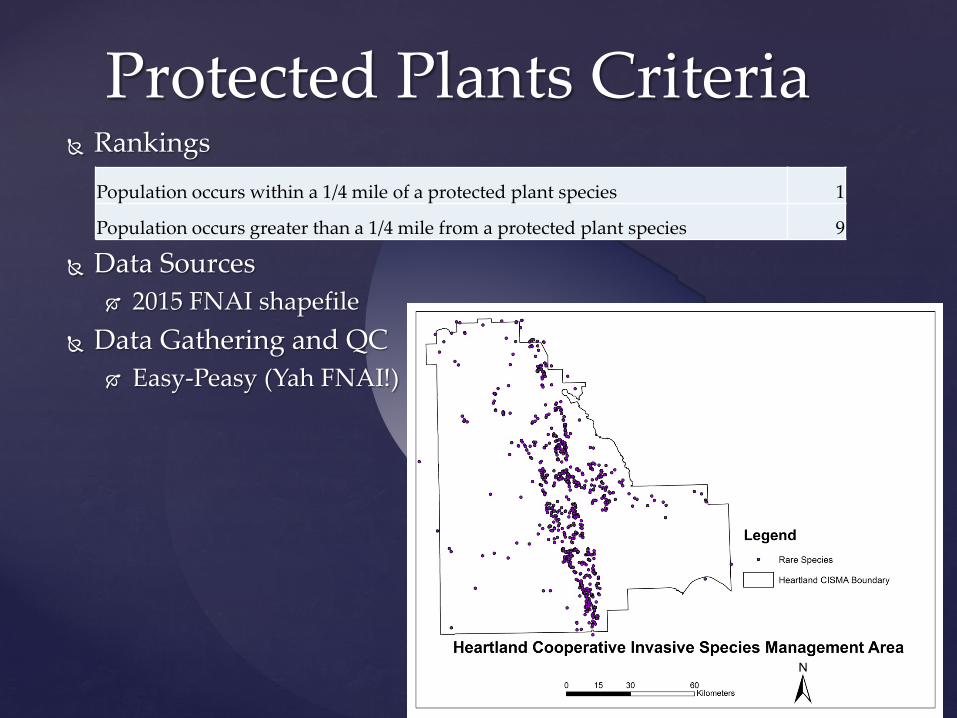
Rankings
Data Sources 2015 FNAI shapefile
Data Gathering and QC Easy-Peasy (Yah FNAI!)
Protected Plants Criteria Population occurs within a 1/4 mile of a protected plant species 1
Population occurs greater than a 1/4 mile from a protected plant species 9
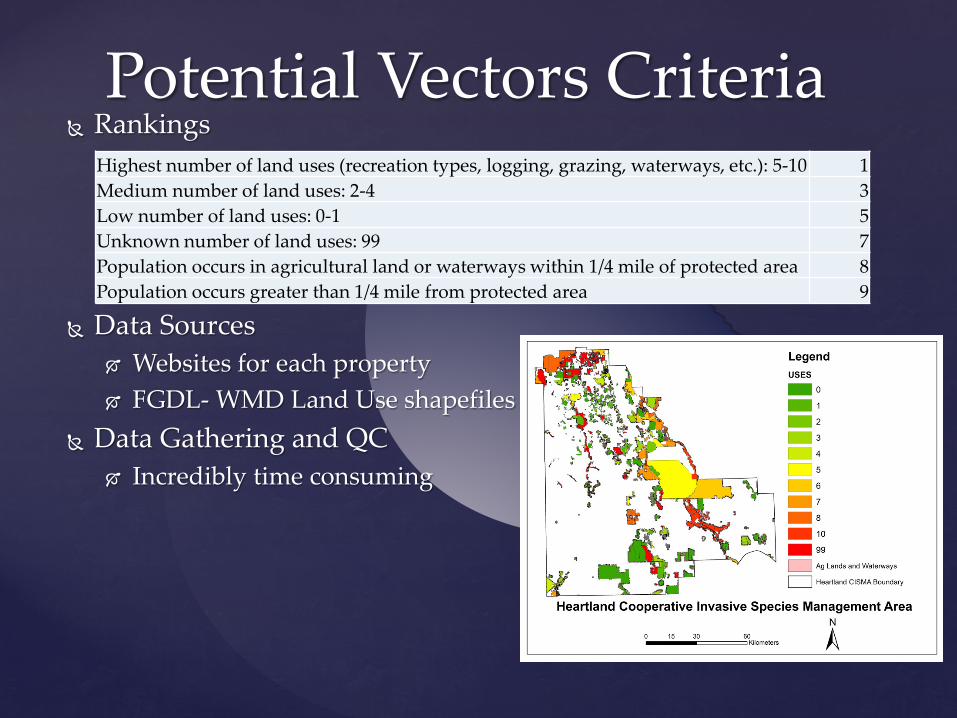
Rankings
Data Sources
Websites for each property FGDL- WMD Land Use shapefiles
Data Gathering and QC Incredibly time consuming
Potential Vectors Criteria Highest number of land uses (recreation types, logging, grazing, waterways, etc.): 5-10 1 Medium number of land uses: 2-4 3 Low number of land uses: 0-1 5 Unknown number of land uses: 99 7 Population occurs in agricultural land or waterways within 1/4 mile of protected area 8 Population occurs greater than 1/4 mile from protected area 9
Weighted averages Species Impacts- 25% Proximity to Protected Plant Species- 25% Available Control Methods- 20% Proximity to Protected Lands (‘habitat quality’)- 10% Total Number of Populations (‘extent’)- 10% Potential Vectors- 10%
Criteria Totals
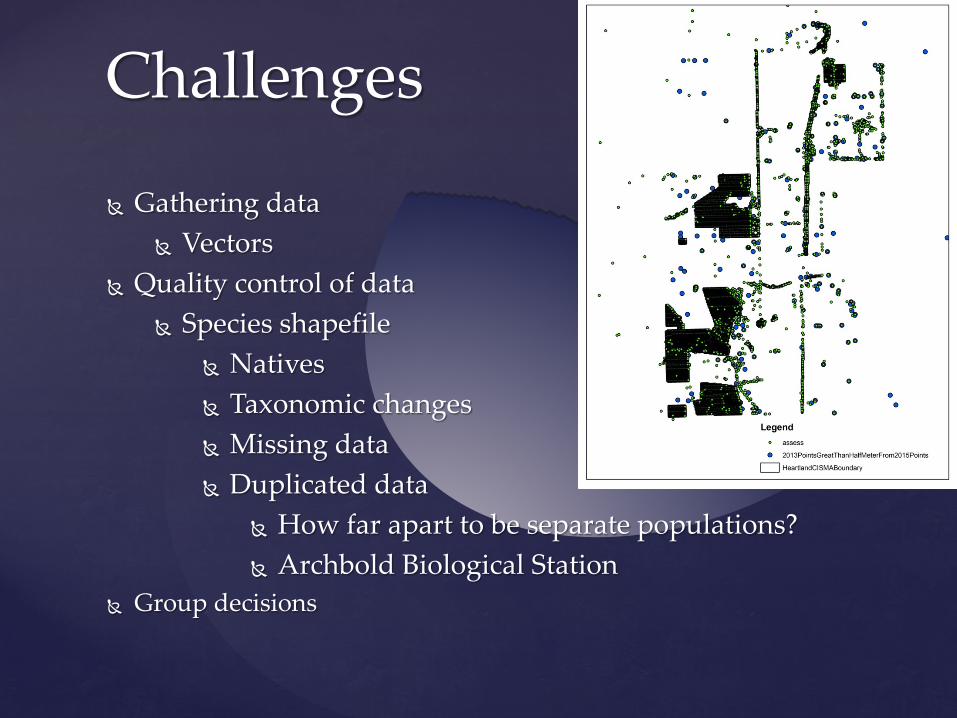
Challenges
Gathering data Vectors
Quality control of data Species shapefile
Natives Taxonomic changes Missing data Duplicated data
How far apart to be separate populations? Archbold Biological Station
Group decisions
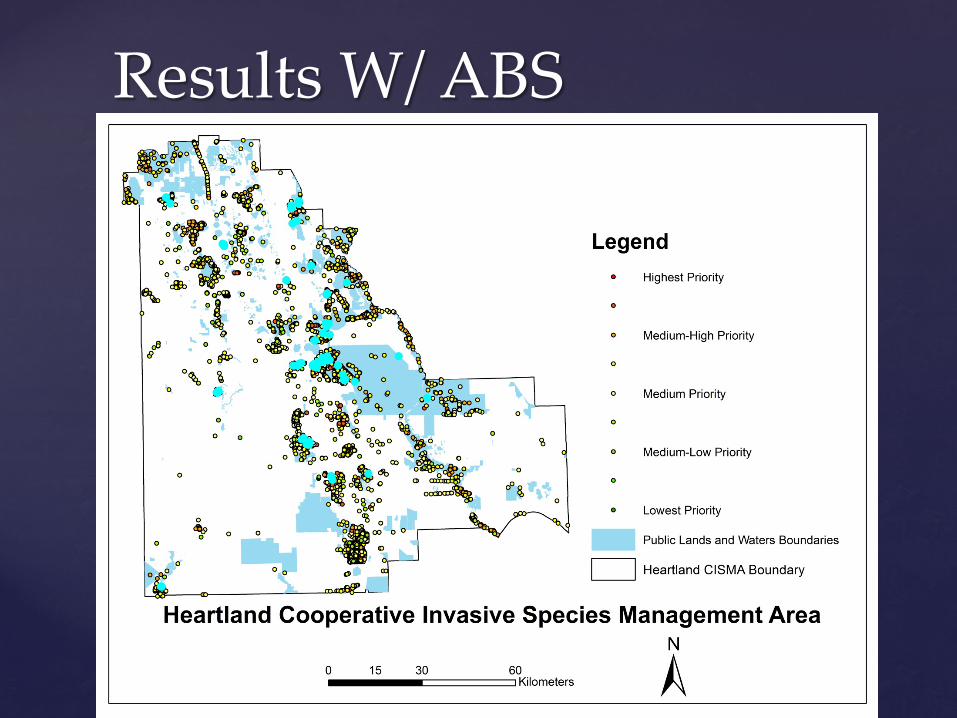
Results W/ ABS
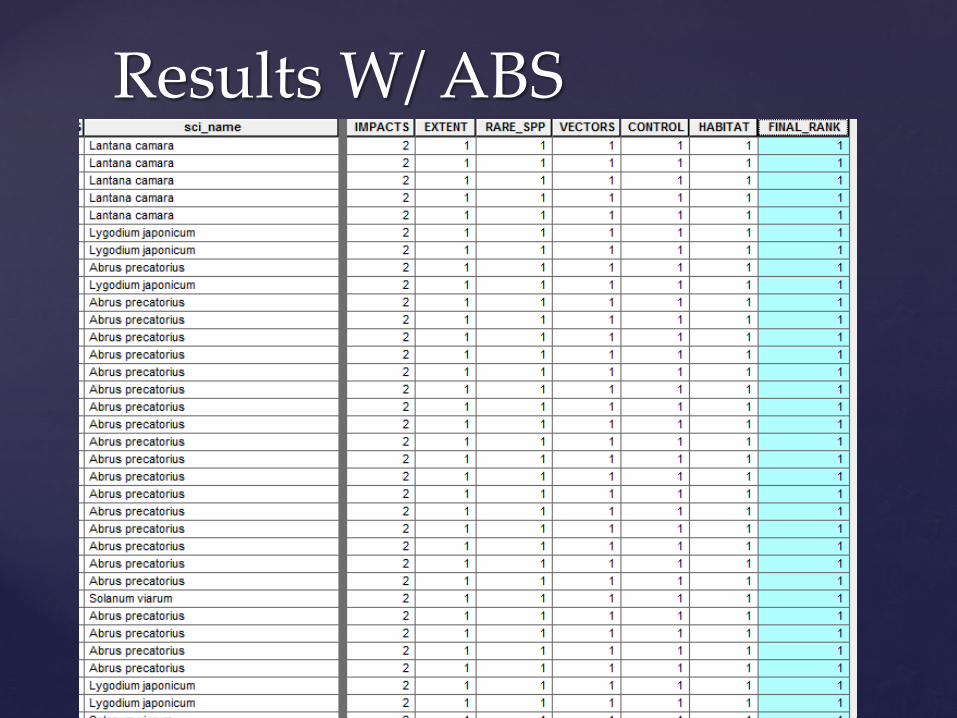
Results W/ ABS

Results w/o ABS

Results w/o ABS

Target outreach to private landowners Prioritize workdays Identify data gaps
Potential Applications
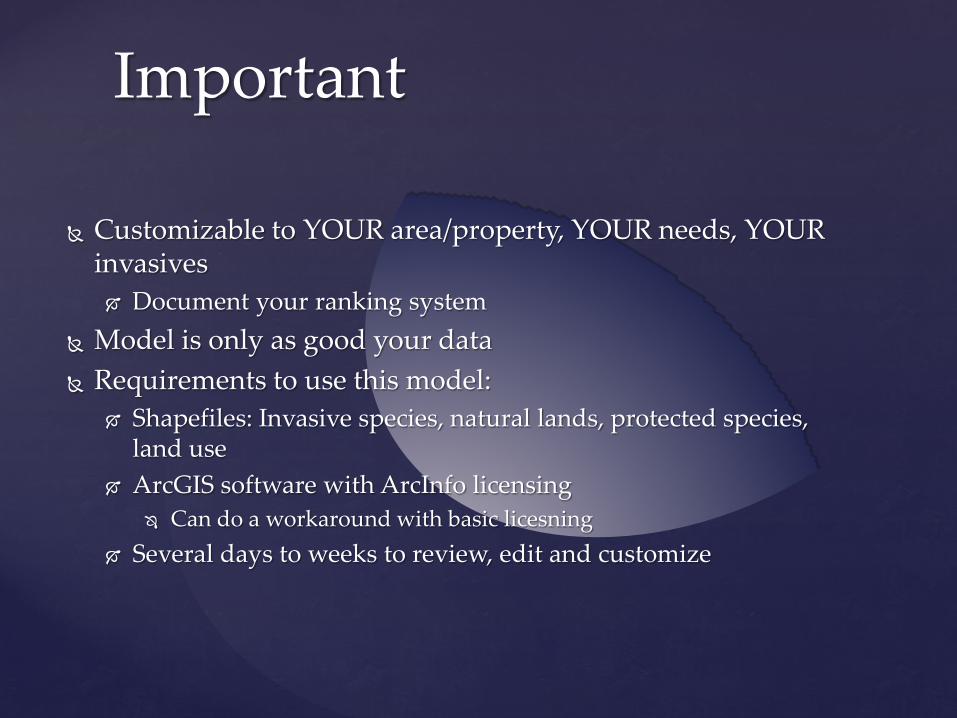
Customizable to YOUR area/property, YOUR needs, YOUR invasives Document your ranking system
Model is only as good your data Requirements to use this model:
Shapefiles: Invasive species, natural lands, protected species, land use
ArcGIS software with ArcInfo licensing Can do a workaround with basic licesning
Several days to weeks to review, edit and customize
Important
All 3 versions available for download at TNC’s Conservation Gateway
Submitting paper to Ecological Restoration Going to be adapted for EDDMapS
Coming Soon!

Any Questions?