Embed Size (px)
Citation preview

BearWorks BearWorks
MSU Graduate Theses
Fall 2017
The Spatial Ecology and Microhabitat Selection of the Pygmy The Spatial Ecology and Microhabitat Selection of the Pygmy
Rattlesnake (Sistrurus miliarius) in Southwestern Missouri Rattlesnake (Sistrurus miliarius) in Southwestern Missouri
Dylan Wallace Maag Missouri State University, [email protected]
As with any intellectual project, the content and views expressed in this thesis may be
considered objectionable by some readers. However, this student-scholar’s work has been
judged to have academic value by the student’s thesis committee members trained in the
discipline. The content and views expressed in this thesis are those of the student-scholar and
are not endorsed by Missouri State University, its Graduate College, or its employees.
Follow this and additional works at: https://bearworks.missouristate.edu/theses
Part of the Other Ecology and Evolutionary Biology Commons, and the Zoology Commons
Recommended Citation Recommended Citation Maag, Dylan Wallace, "The Spatial Ecology and Microhabitat Selection of the Pygmy Rattlesnake (Sistrurus miliarius) in Southwestern Missouri" (2017). MSU Graduate Theses. 3202. https://bearworks.missouristate.edu/theses/3202
This article or document was made available through BearWorks, the institutional repository of Missouri State University. The work contained in it may be protected by copyright and require permission of the copyright holder for reuse or redistribution. For more information, please contact [email protected].

THE SPATIAL ECOLOGY AND MICROHABITAT SELECTION OF THE
PYGMY RATTLESNAKE (SISTRURUS MILIARIUS) IN
SOUTHWESTERN MISSOURI
A Master’s Thesis
Presented to
The Graduate College of
Missouri State University
TEMPLATE
In Partial Fulfillment
Of the Requirements for the Degree
Master of Science, Biology
By
Dylan Wallace Maag
December 2017

ii
Copyright 2017 by Dylan Wallace Maag

iii
THE SPATIAL ECOLOGY AND MICROHABITAT SELECTION OF THE
PYGMY RATTLESNAKE (SISTRURUS MILIARIUS) IN SOUTHWESTERN
MISSOURI
Biology
Missouri State University, December 2017
Master of Science
Dylan Wallace Maag
ABSTRACT
Despite a wide distribution throughout the southeastern United States, pygmy
rattlesnakes (Sistrurus miliarius) have received less research attention than many other
rattlesnake species. I captured a total of 33 S. miliarius at the Drury-Mincy Conservation
Area (DMCA) and retained 14 large individuals (mostly gravid females) for a radio
telemetry study. Snakes were primarily captured during evening road driving surveys
and were encountered rarely with any other sampling technique. Sistrurus miliarius are
widespread at DMCA where they were encountered in forest, savanna, and glade
habitats. Snakes selected microhabitats with more vegetative cover and tree canopy
closure than random sites while avoiding areas with sparse cover. All telemetrically
monitored snakes were relatively sedentary and occupied very small (0–2.6 ha) home
ranges. Reproductive status of females strongly affected activity with mean home range
size of gravid females increasing five-fold following parturition. Births occurred in mid-
August with maternal attendance observed for several litters for up to three days.
KEYWORDS: snake, rattlesnake, pigmy, pygmy, Sistrurus miliarius, home range,
spatial ecology, movements, microhabitat, habitat, selection, mating, telemetry, radio,
telemetry
This abstract is approved as to form and content
_______________________________
Brian D. Greene, PhD
Chairperson, Advisory Committee
Missouri State University

iv
THE SPATIAL ECOLOGY AND MICROHABITAT SELECTION OF THE
PYGMY RATTLESNAKE (SISTRURUS MILIARIUS) IN
SOUTHWESTERN MISSOURI
By
Dylan Wallace Maag
A Master’s Thesis
Submitted to the Graduate College
Of Missouri State University
In Partial Fulfillment of the Requirements
For the Degree of Master of Science, Biology
December 2017
Approved:
_______________________________________
Brian D. Greene, PhD
_______________________________________
Sean P. Maher, PhD
_______________________________________
Day B. Ligon, PhD
_______________________________________
Julie Masterson, PhD: Dean, Graduate College
In the interest of academic freedom and the principle of free speech, approval of this thesis indicates the
format is acceptable and meets the academic criteria for the discipline as determined by the faculty that
constitute the thesis committee. The content and views expressed in this thesis are those of the student-
scholar and are not endorsed by Missouri State University, its Graduate College, or its employees.

v
ACKNOWLEDGEMENTS
There are many people that I would like to thank for their help, inspiration, and
support of me during this research. The first of which are all of the individuals who
helped me collect the data in the field in order for these analyses to be done. Thank you
Michael Eoff, Sabrina Messick, Julianna Harber, Kristen Kohlhepp, Kari Spivy, Tyler
Remick, Chelsea Martin, and Alec Schmacht. Furthermore, I would like to thank the
Hortans, Leah Sandberg, Missouri Department of Conservation, and the Bull Shoals Field
Station for allowing me access to the land where this research was done and to the
facilities where I lived during the field season. Without their assistance this project
would not have been possible. Funding for this project was provided by the Missouri
State University Graduate College and the Biology Department as well as Bull Shoals
Field Station. I am extremely grateful for the financial support that you have given me.
Finally, I would like to thank my committee members, especially my advisor Dr. Brian
Greene, for all of their input and help in the planning, analysis, and writing of this thesis.
Without you all, this thesis wouldn’t be half of what it is.
I dedicate this thesis to my wife, Chelsea Maag. She has always been there to support me
physically and emotionally throughout not only this thesis, but through my entire
graduate career at Missouri State University. I love you.

vi
TABLE OF CONTENTS
Introduction ..........................................................................................................................1
Methods................................................................................................................................5
Study site ..................................................................................................................5
Snake sampling and processing ...............................................................................6
Telemetry .................................................................................................................6
Home ranges and movements ..................................................................................8
Microhabitat selection ..............................................................................................9
Results ...............................................................................................................................14
Snake captures .......................................................................................................14
Body size ................................................................................................................14
Telemetry ...............................................................................................................17
Movements .............................................................................................................19
Home ranges ..........................................................................................................21
Microhabitat selection ............................................................................................23
Discussion ..........................................................................................................................29
Movements and home range sizes .........................................................................29
Habitat selection.....................................................................................................32
Evidence of r-selected reproduction ......................................................................34
Further questions ....................................................................................................35
Literature Cited ..................................................................................................................36
Appendix—Home Ranges ................................................................................................43

vii
LIST OF TABLES
Table 1. Structural variable definitions and sampling radii used to characterize
microhabitat selection ........................................................................................................10
Table 2. Summary of movement and home range data for 14 snakes radiotracked ..........18
Table 3. Top microhabitat models from the paired logistic regression .............................25
Table 4. Habitat selection results from averaging the top 24 models of the paired multiple
logistic regression ..............................................................................................................27

viii
LIST OF FIGURES
Figure 1. Capture locations of all Sistrurus miliarius ........................................................15
Figure 2. Mass vs Snout-Vent Length ...............................................................................16
Figure 3. Comparison of mean (± 1 SE) movement measures for seven gravid Sistrurus
miliarius before and after parturition .................................................................................20
Figure 4. Mean MCP sizes (±1 SE) for seven gravid female Sistrurus miliarius monitored
before and after parturition ................................................................................................22
Figure 5. Spearman correlations between home range size and number of days tracked,
and snake SVL for 11 radiotracked snakes ........................................................................24

1
INTRODUCTION
The use of space is a central component of animal ecology and considerable effort
has been directed toward understanding sources of variation in home range size. In
heterogeneous landscapes, the size of a home range and the time spent in different
locations is strongly influenced by the dispersion of key resources such that space use and
habitat selection are linked by movement responses (Van Moorter et al., 2016).
However, responses to resources may vary with body size (Schoener, 1968; Perry and
Garland, 2002; Tucker et al., 2014), diet (Myerstrud et al., 2001), social factors (Gaulin
and FitzGerald, 1988; Jetz et al., 2004), and energetic costs of movement (Slavenko et al.,
2016). Despite these important influences, a substantial amount of variation in home
range size may still be attributed to individual differences (Borger et al., 2006).
Disentangling a diverse collection of influences can complicate the understanding of
space use by animals. The study of spatial patterns and habitat selection is facilitated in
organisms such as snakes for which resource needs are easily identified and confounding
social influences are mostly lacking (Gregory et al., 1987).
Spatial patterns and habitat selection of snakes are primarily explained by four
key resource influences: prey availability, access to hibernacula, the thermal
environment, and the distribution of mates. In some temperate environments, spatial
segregation of hibernacula and foraging habitats can induce significant seasonal
migrations (e.g. Gregory and Stewart, 1975). Snakes may also track prey densities across
landscapes due to seasonal changes in prey distribution (e.g. Madsen and Shine, 1996) or
exhibit numerical responses to discrete habitat patches with high prey densities

2
(Wittenberg, 2012). In cooler environments, gravid females often select discrete
thermally favorable microhabitats that are spatially distinct from those used by males and
non-gravid females (Blouin-Demers and Weatherhead, 2001; Crane and Greene, 2008).
Adult males of many species exhibit consistently larger seasonal home range sizes and
rates of movement than females as a consequence of searching for mates (Roth, 2005;
Smith et al., 2009).
Radio telemetry has facilitated the growing body of literature on ecology and
conservation of rattlesnakes (Beaman and Hayes, 2008) and has contributed to their
characterization as model organisms (Beaupre and Duvall, 1998). In general, rattlesnakes
are ambush foraging strategists with low energetic demands that typically exhibit low
activity levels and reduced home range sizes compared to active foraging snakes (e.g.
Secor, 1995). Rattlesnake studies have elucidated causes of movement patterns,
including how prey distribution influences migration to foraging habitats (Duvall et al.,
1990), the influence of the thermal environment on habitat selection by gravid females
(Graves and Duvall, 1993; Harvey and Weatherhead, 2011), and the relationship between
search patterns and mating success for males (Duvall and Schuett, 1997). Telemetry
studies also have facilitated the acquisition of detailed quantitative information on
foraging behavior and predator-prey interactions (Reinert et al., 1984; Clark, 2005;
2006a; b) and trailing behavior of neonates (Cobb et al., 2005).
The pygmy rattlesnake, Sistrurus miliarius, is a very small crotalid that inhabits
coastal plains regions of the southeastern United States from North Carolina to eastern
Texas. Its range extends northward into eastern Oklahoma and the Ozark Plateau of
southern Missouri, which represents the northernmost range limit. Sistrurus miliarius

3
exhibit a fast life history relative to other crotalids, with attainment of sexual maturity
estimated at 2–3 years (Messenger, 2010). In Florida, where S. miliarius is active all year
(May et al., 1996), some females reproduce annually and have consistent patterns of
reproductive life history traits (Farrell et al., 1995; Farrell et al., 2009). Parturition occurs
mainly in August (Fleet and Kroll, 1978; Farrell et al., 1995; Messenger, 2010) and
females often exhibit maternal attendance of their litters (Greene et al., 2002). Mating
has been reported both in spring (Palmer and Braswell, 1995) and late summer or early
fall (Montgomery and Schuett, 1989; May et al., 1996; Messenger, 2010). Information
on spatial movement patterns of S. miliarius is limited to locality data from a mark-
recapture study (Hudnall, 1979) and preliminary movement data from four telemetrically
monitored snakes (Holder, 1988). Sistrurus miliarius reportedly occupy a diversity of
habitat types including forests, xeric uplands, glades, and floodplains (Trauth et al., 2004;
Gibbons and Dorcas, 2005) however, no quantitative assessment of habitat selection has
ever been attempted.
I conducted a single-season radio telemetry study of 14 S. miliarius to
characterize their movement patterns, home range sizes, and selection of microhabitat in
a managed Ozark landscape. Because males are expected to engage in mate searching, I
predicted movement frequencies and length, and possibly estimated home range sizes, to
be male-biased. Pregnancy imposes physiological constraints on movement and habitat
selection of viviparous snakes (Gregory et al., 1987; Reinert, 1993). Therefore, I also
expected that gravid snakes would be more sedentary and more selective of available
microhabitat features than males and non-gravid females. In addition to addressing
spatial and habitat selection objectives, I also summarized incidental observations of

4
mating and parental care in monitored snakes. I hope that my data will provide some
initial insight into the spatial patterns and habitat selection of S. miliarius, for which such
information does not currently exist, and provide a basis for comparative studies in
regions with contrasting environments.

5
METHODS
Study site
My field research was conducted 15 April through 15 November 2016 at the
Drury and Mincy Conservation Areas (DMCA) in southwestern Missouri (494885.2E,
4047377.7N, Zone 15). The DMCA is an 809-ha tract that is owned and managed by the
Missouri Department of Conservation (MDC). The Bull Shoals Field Station (BSFS),
operated by Missouri State University, facilitates research activities at DMCA and
coordinates such activities with MDC management objectives. The study area resides in
the Springfield Plateau of the Ozarks which is characterized by a karst landscape with
rolling terrain; elevation at DMCA ranges from 201–274 m above sea level. The DMCA
experiences hot summers and short cold winters; mean minimum and maximum monthly
temperatures range from -18.8–19.8 ˚C and 15.9–43.6 ˚C, respectively. Annual
precipitation at DMCA averages 1092.2 mm and is distributed relatively evenly
throughout the year (Bull Shoals Field Station, 2001–2015 averages).
The DMCA landscape is primarily a mixture of woodland and savanna with
scattered limestone/dolomite glades. Two intermittent streams flow into Bull Shoals
Reservoir which forms the eastern boundary of DMCA. A system of gravel roads
provides access to 51 discrete wildlife food plots and 21 small temporary or permanent
ponds. Much of the area is managed by prescribed burning to maintain an open
understory and prevent woody plant encroachment onto glades. Upland forested areas
are dominated by oaks (Quercus spp.) and hickories (Carya spp.), while riparian stream
corridors contain mainly sycamore (Platanus occidentalis), sweetgum (Liquidambar

6
styraciflua), hackberry (Celtis occidentalis), and green ash (Fraxinus pennsylvanica),
with an understory of buttonbush (Cephalanthus occidentalis), pawpaw (Asimina
triloba), and Ohio buckeye (Aesculus glabra). Ozark glades are open, xeric habitats with
thin soil and exposed bedrock outcrops dominated by warm-season grasses and other
prairie herbs (Baskin and Baskin, 2000). A detailed description of plant species found at
DMCA has been provided through recent botanical surveys (King et al., 2012).
Snake sampling and processing
Sistrurus miliarius were captured during nighttime road surveys, cover board
searches, and fortuitous encounters at DMCA. Collected snakes were individually
marked with a PIT tag (Biomark, Boise, ID), sexed by manual eversion of hemipenes, if
present, weighed (± 0.1 g), and measured for snout-vent length (SVL) and tail length
using a squeeze box (Bertram and Larsen, 2004). I palpated the abdomens of females to
detect enlarged ova or developing embryos for determination of reproductive status. All
activities involving live animals in this study were approved by the Missouri State
University Institutional Animal Care and Use Committee (IACUC) (Protocol #16-018).
Telemetry
Snakes retained for telemetry were transported to Missouri State University for
surgical implantation of transmitters (model SB-2, 3.8 g, five-month battery life, Holohil
Systems Ltd., Ontario, Canada,). Radio transmitters were coated in a 1:1 ratio of paraffin
and beeswax (Lutterschmidt et al. 2012) and surgically implanted into snakes, after being
anesthetized with isoflurane, using a composite of standard methods (Reinert and

7
Cundall, 1982; Hardy and Greene, 1999; 2000). Transmitters were always ≤ 5% (range =
3–5%) of snake body mass. Because of the diminutive size of S. miliarius only larger
adults were suitable for transmitter implants. Snakes of similar size but lower body
condition than other implanted snakes were maintained in captivity and fed one mouse
(Mus musculus) per week until a 5% transmitter mass threshold was achieved. Captive
feeding was short-term (2–5 weeks) for all snakes involved. After surgery, snakes were
individually caged and monitored for adverse reactions for 24–48 hours before being
released at their original capture locations. To minimize possible behavioral bias
associated with surgery, a seven-day post-release acclimation period was observed prior
to initial data collection (Goode et al., 2008).
Snakes were tracked two to four times per week between 0800 and 1700 using a
hand-held H-antenna and receiver (Telonics, TR-2 or Communications Specialist Inc. R-
1000) until the snake entered hibernation, was found deceased, or the transmitter battery
life expired. Upon locating a snake, a handheld Global Positioning System (GPS) device
(eTrex, vista HCx, Garmin Ltd.) was used to record the Universal Transverse Mercator
(UTM) coordinates of the location, at a precision of ±3 m. Only snakes that were found
concealed or in a coiled body posture were considered to have selected a location.
Snakes that appeared to be moving were relocated later the same day and their positions
recorded after they assumed a sedentary posture. To minimize monitoring disturbance,
snake-selected sites were flagged and dated to facilitate habitat measurements following
the snake’s departure.

8
Home ranges and movements
GPS coordinates and associated dates, were used to calculate home range
estimates and quantify movement patterns. To facilitate comparisons, I calculated
standard movement statistics of mean distance moved per day and mean distance per
movement. Mean distance moved per relocation (the average distance traveled between
the last known location and the current location of the snake), and frequency of
movement (mean number of moves per day) also were calculated. All movements were
measured as straight-line distances between successive points. To evaluate the potential
influence of GPS measurement error on spatial calculations, I jittered each snake location
by three meters 200 times. I then recalculated movement and home range estimates and
compared those to estimates derived from original points. Because estimates with and
without jittering were essentially identical, all calculations reported are based on raw
data.
Spatial studies commonly use multiple home range estimation methods because
each has contrasting strengths and weaknesses (Kernohan et al., 2001). The minimum
convex polygon (MCP) method defines a home range as the minimum area enclosed by
the outermost points occupied by an individual. While this method has important
deficiencies (White and Garrott, 1990; Powell, 2000) it is the most commonly used home
range estimator due to its historical prominence, simplicity of calculation, and ease of
interpretation. Because the MCP does not provide critical information about how the
area within a home range is used, many researchers advocate methods based on
utilization distributions, especially the kernel estimator (Powell, 2000). However,
accuracy of kernel estimates is hindered by low sample sizes (20–50 locations

9
recommended; Worton, 1987; Seaman et al., 1999) and autocorrelation of animal
locations (Swihart and Slade, 1985; Hansteen et al., 1997). Because spatial patterns in
my study were both autocorrelated, from repeated use of locations by snakes, and
typically had marginal sample sizes for kernel estimation as a consequence of short
transmitter battery life, I elected to report only MCP home range estimates with a three
meter buffer to account for GPS error.
Microhabitat selection
I analyzed habitat selection at the microhabitat scale using a paired multiple
logistic regression. This technique is increasingly favored in microhabitat selection
studies because the practice of pairing animal-selected points with random points ensures
that each random point is actually available to the animal and due to the frequent non-
normality of the data (Press and Wilson, 1978). Once microhabitat variables were
recorded at each snake location, a random location was generated by randomly picking a
compass bearing and distance using Random Number (Saranomy, v. gpv1.0.10) (Cross
and Petersen, 2001; Moore and Gillingham, 2006; Harvey and Weatherhead, 2006; Steen
et al., 2010). I constrained the distance of the sampling radius for random points to 1–
36m based on the 95% confidence interval of mean distance per move (1–36 m) from
four S. miliarius previously radio tracked in Southwestern Missouri (Holder, 1988). The
lower confidence limit was adjusted to 4 m to account for GPS measurement error (±3
m).
To characterize the habitat, 22 structural variables were measured, counted, or
estimated relative to the flagged location of each snake (Table 1). Each variable was

10
Table 1. Structural variable definitions and sampling radii used to characterize
microhabitat selection of Sistrurus miliarius at Drury-Mincy Conservation Areas.
Variable Definition Sampling radius
(m)
%CANCOV % canopy closure 1
%USCOV % understory closure 1
%VEG % of total vegetation cover 1
%VEGS %VEG that is 0-0.25 m tall 1
%VEGT %VEG that is 0.25-1.00 m tall 1
%LOG %Fallen log cover 1
#WSTEM Woody stem density 1
HWS Height of tallest woody stem (cm) 1
DLL Depth of leaf litter (m) 1
%LEAF % leaf litter cover 1
%ROCK % rock cover 1
%WATER % water coverage 1
%BARE % Bare Ground coverage 1
DLOG Distance to log ≥7.5 cm in diameter (m) 30
DIALOG Max diameter of nearest log 30
DIAOS Diameter at breast height of nearest overstory tree that is
≥7.5 cm DBH and > 2.0 m tall
30
DOS Distance to nearest overstory tree that is ≥7.5 cm DBH
and > 2.0 m tall
30
DUS Distance to understory tree (m) that is < 7.5 cm DBH and
> 2.0 m tall
30
DSHRUB Distance to nearest shrub (m) that is < 2.0 m tall 30
MDR Mean distance to nearest rocks (m) that were > 10.0 cm
long
30
LROCK Mean max length of rocks used in MDR (cm) 30
DRETREAT Distance to nearest retreat site (m) 30

11
assigned a sampling radius that reflected its spatial variation at DMCA. Cover variables
that would likely influence selection by snakes in close proximity were quantified within
a 1 m2 plot surrounding the snake location. Distance variables relating snake proximity
to large structural features were evaluated within a 30 m radius. Any feature occurring
beyond its respective sampling radius at a particular sampling point was considered to be
unavailable to the snake at that location and received a value of zero. Identical
measurement criteria were applied to data collected at random locations.
Telemetry studies attempt to make inferences from repeated measurements on a
limited number of individuals. Under these circumstances it is important to ensure that
the contribution of each individual to the data set is balanced, thus preventing an unusual
individual from biasing results (Reinert, 1984). Some snakes remained at a single site for
extended periods, especially when gravid, or returned to a single site on multiple
occasions. While repeated use of sites represents non-independent events, it is likely that
snakes re-used some sites disproportionately because of their biological importance (Row
and Blouin-Demers, 2006a). I addressed such repeated use of single sites by adjusting
the number of times a particular location was represented in the data set based on snake
movement frequency. Since it was found that snakes moved on average once every five
days, any string of relocations found within one meter of the same location was reduced
by randomly deleting observations so that the location was only represented once in any
five-day interval. Because snakes, on average, typically left any location after five days,
failing to do so constitutes repeated selection of a single site by snakes.
Because the proximity of habitat features to a snake location should logically
reflect selection of that feature (Wasko and Sasa, 2010), I adjusted distance variables by

12
subtracting each value from 30 m. This reformatted the data so that values of 30 mean
that the snake was on top of, inside, or underneath the feature, whereas values of 1 would
indicate maximal distances; values of 0 would be considered unavailable to the snake.
Next, I reduced the number of candidate variables to be used in microhabitat modeling
procedures by retaining only those variables with correlations < 0.70 (Harvey and
Weatherhead, 2006; Moore and Gillingham, 2006; Martino et al., 2012). This reduced
the number of variables from 22 to 13. The remaining variables were then standardized
by subtracting each value from its respective mean and dividing by the standard
deviation.
I evaluated microhabitat selection using multiple logistic regression. This method
has the advantage of pairing each location selected by an animal with an associated
spatially-relevant random location such that available habitat can be realistically
estimated for each individual (Compton et al., 2002). This procedure generated candidate
models with various combinations of variables which were evaluated and ranked with
Akaike’s Information Criterion (AIC) to determine which models best explained snake
microhabitat selection (Burnham and Anderson, 1998).
Statistical analyses were conducted in R (v. 3.3.1). Home range estimates were
generated using the MCP function in the adehabitatHR package (Calenge, 2006) and the
gBuffer function to account for the three meters of GPS error. Home range figures were
created in ArcGIS 10.5 (ESRI, 2016). Logistic regression was performed and evaluated
with AIC by the function dredge from the package MuMin (Barton, 2016). The function
model.avg was used on all models within two AIC units of the top model to generate

13
coefficient point estimates and their standard errors for the variables within those models.
All means are reported ±1 SE and statistical significance was accepted at α = 0.05.

14
RESULTS
Snake captures
From April to October of 2016, a total of 33 S. miliarius were captured (n = 11
males; 14 non-gravid females; 8 gravid females) (Figure 1). Most snakes (n = 24) were
found during nightly two-hour road driving surveys, starting 30 minutes before sundown.
Snakes were also found under coverboards (n = 4) and by fortuitous encounters (n = 5).
All captures from coverboards occurred before June whereas road survey captures mainly
occurred in summer (n = 24, 73% of S. miliarius). Encounter frequencies for S. miliarius
were highest around glades (n = 13) and forests (n = 13) but also occurred in association
within savannas (n = 7). Wildlife food plots and riparian corridors were the only habitat
types where snakes were never encountered. Although most snakes were collected
during road surveys and all home ranges were within 50 m of a roadside, traversal of
roads was apparently uncommon; telemetered individuals collectively crossed roads only
13 times during the study.
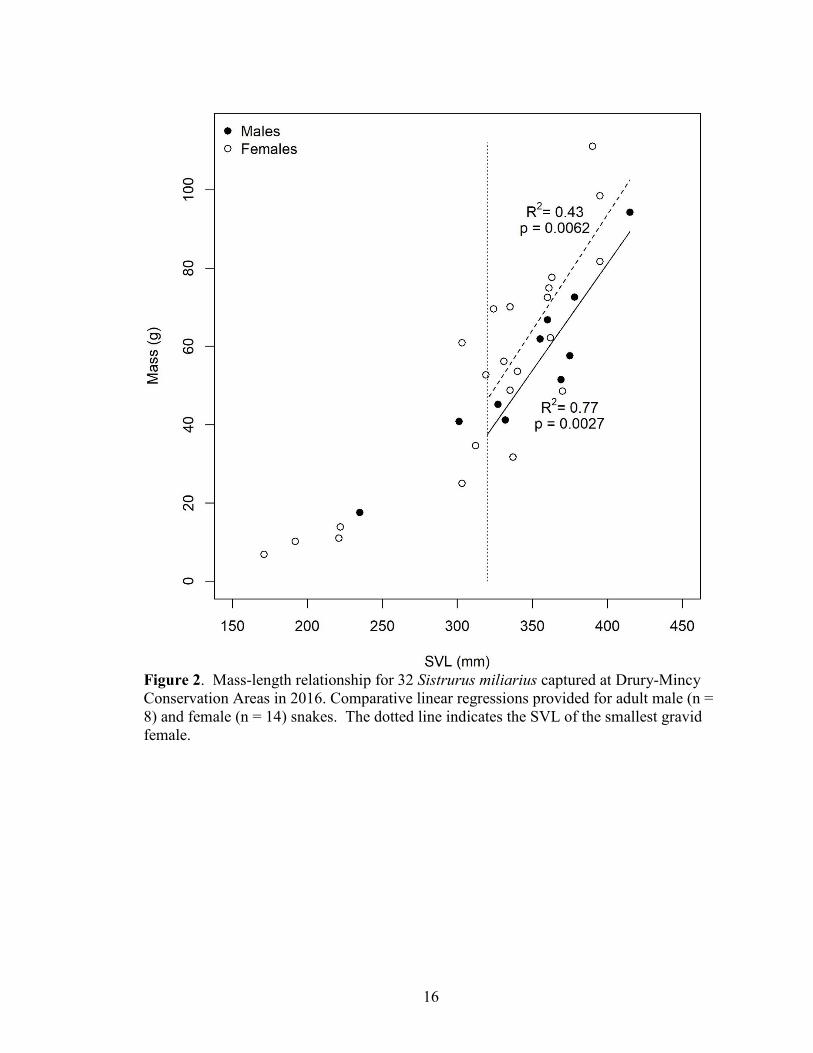
Body size
The body sizes of 32 S. miliarius captured in this study ranged from 171 – 415
mm SVL (mean = 327.8 ± 10.6 mm) and 6.9–111.1 g in mass (mean = 53.8 ± 4.63 g).
Body sizes of adult snakes (SVL > 300 mm) were similar between sexes for SVL
(females: mean = 357.0 ± 6.48 mm, n = 14; males: mean = 363.8 ± 9.85 mm, n = 8) and
mass (females: mean = 68.4 ± 5.54 g; males: mean = 61.4 ± 6.01 g) (Figure 2). Tail
lengths of adult males (mean = 55.6 ± 1.78 mm) were longer, and represented

15
Figure 1. Capture locations of 33 Sistrurus miliarius at Drury-Mincy Conservation
Areas in 2016.
16
Figure 2. Mass-length relationship for 32 Sistrurus miliarius captured at Drury-Mincy
Conservation Areas in 2016. Comparative linear regressions provided for adult male (n =
8) and female (n = 14) snakes. The dotted line indicates the SVL of the smallest gravid
female.

17
significantly greater proportions of SVL (Welch’s t-test, T = 7.28, df = 19.8, P < 0.0001),
than adult female tail lengths (mean = 43.8 ± 1.31 mm).
Telemetry
Fourteen S. miliarius (8 gravid females; 3 non-gravid females; 3 males) were
implanted with radio transmitters and tracked during July–October 2016, yielding 397
telemetry locations. Eight snakes died during the study, three from apparent predation
and five from undetermined causes. Tracking of three additional snakes ceased due to
transmitter battery failure before the end of the activity season. Three snakes were
tracked into hibernation. Three of the snakes that died were excluded from analyses
because the duration of observation was too brief (< 10 d) to contribute meaningful
information. I included data for the remaining five non-surviving snakes which were
each tracked for a minimum of 43 days (mean: 76.8 d). Thus, analyses were based on
386 telemetry locations of 11 snakes that were tracked for a mean duration of 96.6 ± 10.9
d (range: 43–150) and were relocated a mean of 40.6 ± 6.30 times (range: 11–77) (Table
2).
Tracking duration varied among snake categories because gravid females tended
to be captured earlier in the activity season than males. The overall mean tracking
duration for gravid females (n = 7) was 115.1 ± 11.6 d, including 55.3 ± 9.04 d before
and 57.5 ± 9.96 d after parturition. Tracking during gravid and non-gravid intervals
yielded corresponding means of 29.7 ± 5.65 and 14.9 ± 2.22 relocations. Non-gravid
females (n = 2) were tracked, on average, 47.3 ± 22.0 d, yielding an average of 14.3 ±
5.93 relocations per snake. Lastly, males (n = 2) were tracked, on average, 43.0 ± 19.6 d,

18
Table 2. Summary of movement and home range data for 14 Sistrurus miliarius radiotracked at the Drury-Mincy Conservation
Areas during 2016. SVLs and masses were taken at initial capture. Means are reported (±1 SE). Died (U) fates are snakes that died
from undetermined causes. Abbreviations: Repro = Reproductive and Reloc = Number of relocations.
Snake
I.D.
SVL
(mm)
Mass
(g) Repro Status
Track
Days Reloc X̅ Day⁄ (m) X̅ Move (m)⁄ X̅ Reloc⁄ (m)
Freq of
Movement
(moves/d)
100%
MCP
(ha)
Fate
1 335 70.1 Gravid 75 53 4.5 (1.85) 16.9 (3.60) 9.1 (2.68) 0.27 0.61
Died (U) Non-Gravid 63 16 12.0 (3.85) 50.3 (7.91) 47.1 (7.91) 0.24 1.48
2 363 77.6 Gravid 75 37 1.8 (0.77) 8.1 (1.63) 3.7 (1.12) 0.23 0.08
Battery failure Non- Gravid 75 17 4.9 (2.46) 28.8 (5.92) 22.0 (5.34) 0.17 0.28
4 395 81.7 Gravid 71 35 3.3 (1.34) 13.1 (2.67) 6.7 (1.94) 0.25 0.42
Battery failure Non-Gravid 74 20 13.3 (4.49) 54.6 (9.10) 49.1 (8.86) 0.24 2.63
7 361 74.9 Gravid 71 36 3.3 (1.37) 11.3 (2.53) 6.6 (1.96) 0.30 0.33
Battery failure Non-Gravid 37 7 5.6 (6.54) 52.3 (19.91) 29.9 (16.26) 0.11 0.41
8 327 45.2 Male 77 22 4.8 (2.01) 24.6 (4.55) 16.8 (3.85) 0.20 0.53 Hibernated
9 395 98.5 Gravid 48 24 0.3 (0.16) 2.3 (0.42) 0.7 (0.23) 0.15 0.01 Depredated
(Bird) Non-Gravid 18 6 9.7 (11.40) 43.8 (24.19) 29.2 (21.64) 0.22 0.26
10 335 48.8 Non-Gravid 79 23 6.3 (4.21) 33.3 (9.71) 21.7 (8.02) 0.19 0.95 Depredated
(Bird)
12 331 56.2 Gravid 8 3 N/A N/A N/A N/A N/A Died (U)
18 324 69.6 Gravid 30 15 0.3 (0.46) 9.4 (2.52) 0.6 (0.67) 0.03 0
Hibernated Non-Gravid 76 19 5.6 (3.87) 27.8 (8.61) 23.4 (8.12) 0.20 1.10
21 360 66.8 Male 9 5 N/A N/A N/A N/A N/A Depredated
(Mammal)
23 360 72.5 Non-Gravid 5 3 N/A N/A N/A N/A N/A Died (U)
24 390 111.1 Gravid 17 9 0.7 (0.36) 2.6 (0.67) 1.5 (0.53) 0.29 0.008
Hibernated Non-Gravid 76 19 5.3 (2.42) 25.4 (5.29) 21.5 (4.99) 0.21 1.13
25 362 62.2 Non-Gravid 58 17 1.3 (0.84) 8.7 (2.15) 4.6 (1.61) 0.16 0.07 Died (U)
27 415 94.3 Male 43 11 15.5 (15.6) 110.8 (42.02) 60.4 (32.54) 0.14 2.20 Died (U)

19
yielding an average of 12.7 ± 4.98 relocations per snake.
Occasionally telemetrically monitored snakes were observed engaging in
reproductive activities. Parturition for all gravid snakes occurred 11–25 August and five
of these individuals were observed with their young after parturition for up to three days.
Four post-partum females were also observed mating or with one or more males from late
August to early October. One non-gravid female (#25), was observed in association with
a male in late September. Neither of the male snakes that I tracked were observed
interacting with any females.
Movements
Overall, Sistrurus miliarius moved infrequently (0.199 ± 0.012 moves/d) and over
relatively short distances per move (mean: 31.6 ± 8.27 m), resulting in low mean
movement rates (distance/day: 5.95 ± 1.15 m; distance/relocation: 18.7 ± 4.55 m).
Reproductive status strongly affected the movements of females. Mean distances moved
by gestating females per day (2.06 ± 0.633 m), per movement (9.10 ± 2.01 m), and per
relocation (4.13 ± 1.28 m) all increased significantly (Wilcoxon Signed Rank tests, all V
= 28, n = 7, P = 0.0156) to 8.09 ± 1.33 m, 40.4 ± 4.80 m, and 31.7 ± 4.42 m after
parturition, respectively (Figure 3A, B, and C). However, mean movement frequency
(moves/d) was not significantly affected by reproductive status (gravid: 0.217 ± 0.036;
post-partum: 0.200 ± 0.018; Wilcoxon Signed Rank test, V = 10, n = 7 P = 0.578; Figure
3D), indicating that the magnitude of movements, but not the rate, increased after
parturition.
For non-gravid females, mean distances moved per day (3.84 ± 2.49 m), per

20
Figure 3. Comparison of mean (± 1 SE) movement measures for seven gravid Sistrurus
miliarius before and after parturition, including (A) daily distance moved, (B) distance
per movement, (C) distance per relocation, and (D) movement frequency. Means were
compared with the Wilcoxon-Signed Rank test.

21
movement (21.0 ± 12.3 m), and per relocation (13.2 ± 8.55 m) were roughly one-third of
the corresponding values for males (daily distance: 10.1 ± 5.33 m, movement distance:
67.7 ± 43.1 m, relocation distance: 38.6 ± 21.8 m). However, movement frequencies
were similar for both groups (non-gravid female: 0.173 ± 0.017 moves/d, male: 0.167 ±
0.028 moves/d), suggesting that males moved greater distances than non-gravid females
but not more often. Because of the small sample sizes (n = 2 for both non-gravid females
and males) no statistical comparisons were attempted.
There was a shift in the sampling regime from three to four times a week in the
summer to one to two times a week during the fall. To assess whether this change in
monitoring frequency affected movement estimates, I made paired comparisons of mean
relocation distances for six snakes (two gravid females after parturition, two non-gravid
females, and two males) tracked during both periods and found no significant difference
(Wilcoxon Signed Rank test, V = 6, n = 6, P = 0.438).
Home ranges
Area use was also substantially affected by reproductive status of females (Figure
4). Mean MCPs of gestating snakes (0.20 ± 0.092 ha) increased to 1.04 ± 0.320 ha after
giving birth (n = 7, Wilcoxon Signed Rank test, V = 28, n = 7, P = 0.015).
Comparatively, the mean home range sizes of non-gravid females and males were 0.50 ±
0.439 ha and 1.36 ± 0.834 ha, respectively. Variation in home range sizes was not
explained by snake SVL (Spearman’s, r = 0.16, P = 0 .63) or number of days tracked (r =
0.21, P = 0.52), suggesting that snakes were tracked long enough to achieve stable home

22
Figure 4. Mean MCP sizes (±1 SE) for seven gravid female Sistrurus miliarius
monitored before and after parturition.

23
range estimates (Figure 5). Home range size estimates for individual snakes are reported
in table 2 and graphically depicted in the appendix.
Microhabitat selection
Sistrurus miliarius were typically located on the surface within or surrounded by
ground-level vegetation (88.8% of all locations). Less frequently, snakes selected
underground refuges (2.8%), or surface locations in association with rocks (6.0%) or logs
(2.5%).
I characterized the microhabitat at 262 snake locations (24 male and 238 female)
and 262 paired random locations. Of the microhabitat variables measured, nine (%LOG,
%ROCK, DLL, %WATER, %VEGS, %VEGT, #WSTEM, HWS, and DOS) were
excluded from the logistic regression due to high intercorrelation (r > 0.70) with one or
more other variables. The remaining 13 variables were used to create a global multiple
logistic regression model with only first order interaction terms. From this global model,
a total of 8191 other models of different combinations of variables were constructed.
This result yielded 23 candidate models within two AIC units of the top model (Table 3).
Of the 13 variables included in the top 24 models, only five (%CANCOV,
DIALOG, DRETREAT, DSHRUB, and %LEAF) were contained in all of them. The
variables DLOG and %BARE were found in 22 and 20 models, respectively. The
remaining six variables were included in 14 or fewer models, suggesting that they were
less important in explaining habitat selection by snakes (Table 4). Based on the
interpretation of the variables that contributed significantly to top models, S. miliarius
selected sites with closed canopy cover close to retreat sites, small logs, and shrubs.

24
Figure 5. Spearman correlations between home range size and (A) number of days
tracked, and (B) snake SVL for 11 Sistrurus miliarius tracked at Drury-Mincy
Conservation Areas.

25
Table 3. Top microhabitat models from the paired logistic regression (First 12 models).
# Model df log
Likelihood AIC ΔAIC Weight
640 %BARE+%CANCOV+%DIALOG+DIAOS+
DLOG+DRETREAT+DSHRUB+%LEAF 9 -274.22 566.44 0.00 0.0218
632 %BARE+%CANCOV+%DIALOG+DLOG+
DRETREAT+DSHRUB+%LEAF 8 -275.22 566.45 0.01 0.0217
4736 %BARE+%CANCOV+%DIALOG+DIAOS+DLOG+
DRETREAT+DSHRUB+%LEAF+%VEG 10 -273.37 566.73 0.29 0.0189
631 %CANCOV+%DIALOG+DLOG+
DRETREAT+DSHRUB+%LEAF 7 -276.42 566.83 0.39 0.0180
4728 %BARE+%CANCOV+%DIALOG+DLOG+
DRETREAT+DSHRUB+%LEAF+%VEG 9 -274.52 567.03 0.59 0.0163
639 %CANCOV+%DIALOG+DIAOS+
DLOG+DRETREAT+DSHRUB+%LEAF 8 -275.58 567.15 0.71 0.0153
2680 %BARE+%CANCOV+%DIALOG+DLOG+
DRETREAT+DSHRUB+%LEAF+%USCOV 9 -274.81 567.62 1.18 0.0121
2679 %CANCOV+%DIALOG+DLOG+DRETREAT+
DSHRUB+%LEAF+%USCOV 8 -275.90 567.80 1.36 0.0111
2688 %BARE+%CANCOV+%DIALOG+DIAOS+DLOG+
DRETREAT+DSHRUB+%LEAF+%USCOV 10 -273.92 567.84 1.39 0.0109
4976 %BARE+%CANCOV+%DIALOG+DIAOS+
DRETREAT+DSHRUB+DUS+%LEAF+%VEG 10 -273.93 567.85 1.41 0.0108
896 %BARE+%CANCOV+%DIALOG+DIAOS+DLOG+
DRETREAT+DSHRUB+DUS+%LEAF 10 -273.95 567.91 1.46 0.0105
6784 %BARE+%CANCOV+%DIALOG+DIAOS+DLOG+
DRETREAT+DSHRUB+%LEAF+%USCOV+%VEG 11 -273.06 568.11 1.67 0.0095

26
Table 3 continued. Top microhabitat models from the paired logistic regression (Last 12 models and the cumulative
weight of all 24).
# Model df log
Likelihood AIC ΔAIC Weight
5760 %BARE+%CANCOV+%DIALOG+DIAOS+DLOG+
DRETREAT+DSHRUB+%LEAF+LROCK+%VEG 11 -273.06 568.12 1.68 0.0094
4992 %BARE+%CANCOV+%DIALOG+DIAOS+DLOG+
DRETREAT+DSHRUB+DUS+%LEAF+%VEG 11 -273.07 568.14 1.70 0.0093
6776 %BARE+%CANCOV+%DIALOG+DLOG+DRETREAT+
DSHRUB+%LEAF+%USCOV+%VEG 10 -274.09 568.17 1.73 0.0092
760 %BARE+%CANCOV+%DIALOG+DLOG+
DRETREAT+DSHRUB+MDR+%LEAF 9 -275.11 568.21 1.77 0.0090
4720 %BARE+%CANCOV+%DIALOG+DIAOS+
DRETREAT+DSHRUB+%LEAF+%VEG 9 -275.11 568.22 1.78 0.0090
4864 %BARE+%CANCOV+%DIALOG+DIAOS+DLOG+
DRETREAT+DSHRUB+MDR+%LEAF+%VEG 11 -273.13 568.26 1.81 0.0088
888 %BARE+%CANCOV+%DIALOG+DLOG+
DRETREAT+DSHRUB+DUS+%LEAF 9 -275.15 568.30 1.85 0.0086
768 %BARE+%CANCOV+%DIALOG+DIAOS+DLOG+
DRETREAT+DSHRUB+MDR+%LEAF 10 -274.16 568.31 1.87 0.0086
2687 %CANCOV+%DIALOG+DIAOS+DLOG+
DRETREAT+DSHRUB+%LEAF+%USCOV 9 -275.17 568.34 1.90 0.0084
1664 %BARE+%CANCOV+%DIALOG+DIAOS+DLOG+
DRETREAT+DSHRUB+%LEAF+LROCK 10 -274.17 568.34 1.90 0.0084
1656 %BARE+%CANCOV+%DIALOG+DLOG+
DRETREAT+DSHRUB+%LEAF+LROCK 9 -275.19 568.37 1.93 0.0083
4856 %BARE+%CANCOV+%DIALOG+DLOG+DRETREAT+
DSHRUB+MDR+%LEAF+%VEG 10 -274.19 568.39 1.94 0.0083
Total weight of top models: 0.2820

27
Table 4. Habitat selection results from averaging the top 24
models of the paired multiple logistic regression. Bold text
signifies important variables based on the second and fifth
columns.
Variable
# of
Models
Including
Estimate
(±1 SE) z-value P-value
%CANCOV 24 0.0081
(0.0033) 2.439 0.0147
DIALOG 24 -0.0510
(0. 0157) 3.247 0.0012
DRETREAT 24 0.3776
(0. 0495) 7.618 < 0.0001
DSHRUB 24 0.2911
(0. 1170) 2.482 0.0131
%LEAF 24 -0.0212
(0. 0063) 3.344 0.0008
DLOG 22 0.0666
(0. 0380) 1.75 0.0802
%BARE 20 -0.0128
(0. 0103) 1.238 0.2157
DIAOS 14 0.0071
(0. 0092) 0.775 0.4384
%VEG 10 -0.0032
(0. 0055) 0.581 0.5611
%USCOV 6 -0.0011
(0. 0035) 0.322 0.7475
DUS 4 0.0036
(0. 0148) 0.243 0.8082
MDR 4 -0.0031
(0. 0176) 0.174 0.8619
LROCK 3 -0.0002
(0. 0012) 0.131 0.8958

28
Snakes also avoided leaf litter and bare earth covering the substrate in favor of sites with
vegetation cover.

29
DISCUSSION
Sistrurus miliarius were encountered in nearly all habitat types at DMCA and
appear to be macrohabitat generalists that will use all habitat types that include dense
vegetative cover at ground level. Perhaps due to high prey availability and an apparent
abundance of suitable hibernacula, movements of S. miliarius were infrequent and short,
resulting in very small home range estimates relative to those reported in many previous
rattlesnake studies. Reproductive status was a substantial source of variation for spatial
patterns of females with movements and use of space increasing three-to five-fold
following parturition. Fortuitous observations on the timing of mating and parturition of
telemetered females were consistent with reports from populations with year-round
activity (Farrell et al., 1995).
Movements and home range sizes
Home range estimates for S. miliarius at DMCA were on the low end of values
reported for other small rattlesnakes. Elucidating possible explanations for home range
size values for snakes requires an understanding of the spacing and availability of key
resources (Macartney et al., 1988). For Sistrurus miliarius, insight into resource
influences may be provided by home range studies of the congeneric and similarly-sized
massasauga rattlesnake (S. catenatus), which has been studied extensively throughout its
range and exhibits interpopulational MCP sizes that vary over two orders of magnitude.
The high variability in home range size estimates among S. catenatus studies appears to
be explained by differences in resource distribution and habitat structure. Habitat

30
configuration was implicated as the main factor explaining differences among five S.
catenatus populations in Missouri and Wisconsin where mean MCP sizes varied from 2.4
ha, where only a single small basking area was available, to 135.8 ha, where multiple
open habitat patches were widely dispersed (Durbian et al., 2008). The mean MCP for a
Colorado population of S. catenatus, where snakes migrated approximately 2 km between
hibernacula and summer foraging habitats, was approximately 42 ha (Wastell and
MacKessy, 2011). In contrast, the MCP sizes reported for S. catenatus occupying open
meadows and fen habitats where prey, hibernacula, and basking sites all occur in close
proximity (Moore and Gillingham, 2006), were very similar to values of S. miliarius at
DMCA. In my study, all S. miliarius tracked into the fall hibernated within, or in very
close proximity to, their summer home ranges, and experienced high densities of small
mammal prey (T. Remick, personal communication).
The sensitivity of the MCP estimator to increasing sample size may provide
another explanation for the small home range size estimates observed for Sistrurus
miliarius. The small body sizes of S. miliarius constrained transmitter size and battery
life, which ultimately limited the duration of monitoring in my study. Because MCP
estimates may progressively increase as spatial locations accumulate (White and Garrott,
1990), failing to monitor individuals for an entire activity season could lead to
underestimation of home range sizes (Stone and Baird, 2002). However, if Sistrurus
miliarius continued to occupy new areas throughout the activity season, home range size
should be positively correlated with monitoring duration, which was not the case (Figure
5a). Thus, it appears that snakes were monitored for sufficient time to provide reliable
home range estimates.

31
The MCP estimator has historically been prominent in snake spatial ecology
studies. This method has been criticized for its tendency to include areas never used by
monitored individuals, resulting in mischaracterization of home range size (Powell,
2000). Sistrurus miliarius at DMCA generally stayed within a single habitat type and,
with the exception of roads, did not include areas that were unusable by these snakes.
Therefore, it appears that the MCP method provided accurate estimates of home range
size for telemetered snakes (Row and Blouin-Demers, 2006b).
Populations at the periphery of a species’ distribution often exhibit different
abundances, life history patterns, and demographic performance (e.g. population growth
rate) compared to core populations (Lawton, 1993). Some North American snake
populations at northern latitudes have larger home ranges than southern populations of
the same species. This pattern has been suggested to result from challenging thermal
environments with few hibernacula and wider dispersion of thermally favorable
microhabitats in colder climates (DeGregorio et al., 2011; Martino et al., 2012). The
Sistrurus miliarius population at DMCA lies on the northernmost edge of the species’
range in a cooler thermal environment than most other locations in its geographic range.
Snakes at this site appear to hibernate within their home ranges and likely experience
favorable environmental temperatures of habitats during most of the activity season.
Therefore, it is unlikely that range-wide variation in home range size would be influenced
by thermal differences between Missouri and more southern locations.
Aspects of the reproductive biology of pit vipers commonly result in sexually
distinct spatial patterns. Gravid pit vipers often occupy small home ranges centered on
discrete thermally favorable microhabitats during gestation (Gregory et al., 1987; Reinert,

32
1993), which may result in different spatial patterns between gravid and non-gravid
females (Crane and Greene, 2008). However, gestational constraints on movement may
vanish after parturition, resulting in strong within-season differences in movements and
area use for reproductive females (Privital et al., 2002). All of the aforementioned
patterns appear consistent with S. miliarius spatial patterns at DMCA. Gravid females
exhibited fidelity to specific locations during pregnancy and significantly increased their
home range sizes in late summer following parturition. Male crotalids often have the
largest home ranges in their respective populations (e.g. Weatherhead and Prior, 1992;
Roth 2005; Durbian et al., 2008) as a consequence of mate searching activities (Duvall
and Schuett, 1997). However, home range sizes of male S. miliarius at DMCA were
within the range of the females’ home range values. Whether this was a consequence of
the small number of males tracked, or limited movement of males, cannot be determined
without additional sampling.
Habitat selection
Sistrurus miliarius were found throughout the major habitat types at DMCA,
suggesting little selection by snakes at the landscape scale. This result is consistent with
the species being a described as a habitat generalist that inhabits habitats ranging from
upland hardwood areas and sand hills to lowland floodplain environments and marshes
(Mount, 1975; Gibbons and Dorcas, 2005). In addition to forests, S. miliarius is also
associated with glades in the Missouri Ozarks (Johnson, 2000). Despite the apparent lack
of habitat selection at the landscape level, multiple logistic regression analysis indicated
that snakes were actively selecting microhabitat features. This pattern likely means that

33
many macrohabitat categories contain suitable microhabitats (Harvey and Weatherhead,
2006). If so, parallel studies of habitat selection would be of great interest to determine if
the high diversity of habitats used by S. miliarius throughout its range can be explained
by snake selection for structural habitat components common to apparently dissimilar
environments (Reinert, 1993).
Sistrurus miliarius appear to select microhabitats based on a small number of
structural variables. Telemetered snakes were typically located beneath a closed canopy
of shrubs in close proximity to a retreat site. These sites had more small logs and
branches and less leaf litter cover than available at random sites. Interestingly, rocks
were not used more or less frequently than expected by their availability at DMCA,
despite suggestions that S. miliarius is associated with rocky structure (Johnson, 2000). It
is likely that visual detection bias distorts the understanding of habitat selection patterns
for cryptic snake species (Wasko and Sasa, 2010), emphasizing the benefit of radio
telemetry in informing habitat selection studies (Burger and Zappalorti, 1988).
In contrast to spatial pattern comparisons, there are striking similarities in habitat
selection patterns between S. miliarius and S. catenatus. Both species use a variety of
habitat types at the landscape level but exhibit strong selection for microhabitats
involving dense ground-level vegetation. My results, and with those from two S.
catenatus habitat studies all revealed that snakes chose microhabitats with high canopy
cover and dense surface vegetation (Harvey and Weatherhead, 2006; Moore and
Gillingham, 2006). The importance of shrubs as microhabitat cover is particularly
interesting because of its prominence as a preferred microhabitat feature in three very
different environments: southern Missouri (this study), Ontario, Canada (Harvey and

34
Weatherhead, 2006) and Colorado (Wastell and Mackessey, 2011). While selection of
shrub cover may facilitate thermoregulation, it likely also provides cover from predators;
at least three of my snakes were likely lost to predators and high depredation losses have
been reported for S. catenatus in other studies (Harvey and Weatherhead, 2006; Moore
and Gillingham, 2006; Durbian et al., 2008).
Evidence of r-selected reproduction
Sistrurus miliarius have been suggested to follow a more r-selected life history
strategy than other crotalid species as exemplified by their small body size, rapid growth,
and early maturity (Seigel and Ford, 1987; Farrell et al., 1995; Messenger, 2010; May
and Farrell, 2012). If the high mortality rates observed in my study are typical for S.
miliarius, selection pressure for compensatory reproductive effort should result in
evidence of higher offspring production than expected for rattlesnakes in general.
Specific observations from my study are consistent with this pattern and compatible with
data from other populations. For example, four of the tracked gravid females were
observed mating and/or consorting with male conspecifics within a few weeks after
giving birth, suggesting the potential for an annual reproductive pattern, as has been
reported in Florida (Farrell et al., 1995). Moreover, the absence of significant male-
biased sexual size dimorphism in S. miliarius (this study; Bishop et al., 1996), is
consistent with the presence of balanced selection pressures for increased body size in
both sexes, conveying a mating advantage to large males (Shine, 1978) and a fecundity
advantage to larger females (Seigel and Ford, 1987).

35
Further questions
As is typical in research, many more questions are generated than answered.
More data are needed to determine if patterns reported here are typical of this population.
Specifically, are the small home range sizes, short movements, and apparent annual
reproduction events representative of the DMCA S. miliarius population or are these
observations artifacts of the high prey density of 2016? In addition, in order to achieve
this study’s original objectives, more snakes must be monitored to make comparisons of
the spatial ecology and microhabitat selection of S. miliarius of groups differing in
reproductive status and sex. In addition to improving documentation of the spatial
patterns and habitat selection of S. miliarius at DMCA, parallel studies on populations
from different landscapes and climates would be of great interest.

36
LITERATURE CITED
BARTON, K. 2016. MuMIn: Multi-model inference. R package version 1.15.6.
https://CRAN.R-project.org/package=MuMIn
BASKIN, J. M., AND C. C. BASKIN. 2000. Vegetation of limestone and dolomite glades in
the Ozarks and Midwest regions of the United States. Annals of the Missouri
Botanical Garden 87:286–294.
BEAMAN, K. R., AND W. K. HAYES. 2008. Rattlesnakes: research trends and annotated
checklist, p. 5–16. In: Biology of the Rattlesnakes. W. K. Hayes, K. R. Beaman,
M. D. Cardwell, and S. P. Bush (eds.). Loma Linda University Press, Loma
Linda, California.
BEAUPRE, S. J., AND D. J. DUVALL. 1998. Integrative biology of rattlesnakes.
BioScience 48:531–538.
BERTRAM, N., AND K. W. LARSEN. 2004. Putting the squeeze on venomous snakes:
accuracy and precision of length measurements taken with the “Squeeze box”.
Herpetological Review 35:235–238.
BISHOP, L. A., T. M. FARRELL, AND P. G. MAY. 1996. Sexual dimorphism in a Florida
population of the rattlesnake Sistrurus miliarius. Herpetologica 52:360–364.
BLOUIN-DEMERS, G., and P.J. WEATHERHEAD. 2001. Habitat use by black rat snakes
(Elaphe obsoleta obsoleta) in fragmented forests. Ecology 82:2882–2896.
BORGER, L., N. FRANCONI, G. DE MICHELE, A. L. GANTZ, F. MESCHI, A. MANICA, S.
LOVARI, AND T. COULSON. 2006. Effects of sampling regime on the mean and
variance of home range size estimates. Journal of Animal Ecology 75:1393–
1405.
BURGER, J., AND R. T. ZAPPALORLI. 1988. Habitat use in free-ranging pine snakes,
Pituophis melanoleucus, in New Jersey Pine Barrens. Herpetologica 44:48–55.
BURNHAM, K. P., AND D. R. ANDERSON. 1998. Model Selection and Multimodel
Inference: A Practical Information—Theoretic Approach. Springer-Verlag, New
York, New York.
CALENGE, C. 2006. The package adehabitat for the R software: a tool for the analysis of
space and habitat use by animals. Ecological Modelling 197:516–519.

37
CLARK, R. W. 2005. Pursuit-deterrent communication between prey animals and timber
rattlesnakes (Crotalus horridus): the response of snakes to harassment displays.
Behavioral Ecology and Sociobiology 59:258–261.
CLARK, R. W. 2006a. Strike-induced chemosensory searching by timber rattlesnakes
during natural predation events. Ethology 112:1089–1094.
CLARK, R. W. 2006b. Fixed videography to study predation behavior of an ambush
foraging snake, Crotalus horridus. Copeia 2006:181–187.
COBB, V. A., J. J. GREEN, T. WORRALL, J. PRUETT, AND B. GLORIOSO. 2005. Initial den
location behavior in a litter of Crotalus horridus (Timber Rattlesnakes).
Southeastern Naturalist 4:723–730.
COMPTON, B. W., J. M. RHYMER, AND M. MCCOLLOUGH. 2002. Habitat selection by
wood turtles (Clemmys insculpta): an application of paired logistic regression.
Ecology 83:833–843.
CRANE, A. L., AND B. D. GREENE. 2008. The effect of reproductive condition on
thermoregulation in female Agkistrodon piscivorus near the Northwestern range
limit. Herpetologica 64:156–167.
CROSS, C. L., AND C. E. PETERSEN. 2001. Modeling snake microhabitat from
radiotelemetry studies using polytomous logistic regression. Journal of
Herpetology 35:590–597.
DEGREGORIO, B. A., J. V. MANNING, N. BIESER, AND B. A. KINGSBURY. 2011. The
spatial ecology of the eastern massasauga (Sistrurus c. catenatus) in Northern
Michigan. Herpetologica 67:71–79.
DURBIAN, F. E., R. S. KING, T. CRABILL, H. LAMBERT-DOHERTY, AND R. A. SEIGEI.
2008. Massasauga home range patterns in the Midwest. The Journal of Wildlife
Management 72:754–759.
DUVALL D., M. J. GOODE, W. K. HAYES, J. K. LEONHARDT, AND D. G. BROWN. 1990.
Prairie rattlesnake vernal migration: Field experimental analyses and survival
value. National Geographic Research 6:457–469.
DUVALL D., AND G.W. SCHUETT. 1997. Straight-line movement and competitive mate
searching in prairie rattlesnakes (Crotalus viridis viridis). Animal Behavior
54:329–334.
FARRELL, T. M., P. G. MAY, AND M. A. PILGRIM. 1995. Reproduction in the rattlesnake,
Sistrurus miliarius barbouri, in central Florida. Journal of Herpetology 29:21–27.

38
FARRELL, T. M., P. G. MAY, AND M. A. PILGRIM. 2009. Repeatability of female
reproductive traits in pigmy rattlesnakes (Sistrurus miliarius). Journal of
Herpetology 43:332–335.
FLEET, R. R., AND J. C. KROLL. 1978. Litter size and parturition behavior in Sistrurus
miliarius streckeri. Herpetological Review 9:11.
GAULIN, S. J. C., AND R. W. FITZGERALD. 1988. Home range size as a predictor of
mating systems in Microtus. Journal of Mammalogy 69:311–319.
GIBBONS, W., AND M. DORCAS. 2005. Snakes of the Southeast. University of Georgia
Press, Athens, GA.
GOODE, M., J. J. SMITH, AND M. AMARELLO. 2008. Seasonal and annual variation in
home range and movements of tiger rattlesnakes (Crotalus tigris) in the Sonoran
Desert of Arizona, p. 327–334. In: Biology of the Rattlesnakes. W. K. Hayes, K.
R. Beaman, M. D. Cardwell, and S. P. Bush (eds.). Loma Linda University Press,
Loma Linda, California.
GRAVES, B. M., AND D. DUVALL. 1993. Reproduction, rookery use, and
thermoregulation in free-ranging, pregnant Crotalus v. viridis. Journal of
Herpetology 27: 33–41.
GREENE, H. W., P. G. MAY, D. L. HARDY SR., J. M. SCITURRO, AND T. M. FARRELL.
2002. Parental behavior by vipers, pp. 179–205. In: Biology of the Vipers. G. W.
Schuett, M. Hoggren, M. E. Douglas, and H. W. Greene (eds.). Eagle Mountain
Publishing, Eagle Mountain, UT.
GREGORY, P. T., J. M. MACARTNEY, AND K. W. LARSEN. 1987. Spatial patterns and
movements pp. 336–395. In: Snakes: Ecology and Evolutionary Biology. R. A.
Seigel, J. T. Collins, and S. S. Novak (Eds.). Macmillan Publ., New York.
GREGORY, P. T., AND K. W. STEWART. 1975. Long-distance dispersal and feeding
strategy of the red-sided garter snake (Thamnophis sirtalis parietalis) in the
Interlake of Manitoba. Canadian Journal of Zoology 53:238–245.
HANSTEEN, T. L., H. P. ANREASSEN, AND R. M. IMS. 1997. Effects of spatiotemporal
scale on autocorrelation and home range estimators. Journal of Wildlife
Management 61:280–290.
HARDY, D. L., AND H. W. GREENE. 1999. Surgery on rattlesnakes in the field for
implantation of transmitters. Sonoran Herpetologist 12:25–27.
HARDY, D. L., AND H. W. GREENE. 2000. Inhalation anesthesia of rattlesnakes in the
field for processing and transmitter implantation. Sonoran Herpetologist 13:110–
114.

39
HARVEY, D. S., AND P. J. WEATHERHEAD. 2006. A test of the hierarchical model of
habitat selection using eastern massasauga rattlesnakes (Sistrurus c. catenatus).
Biological Conservation 130:206–216.
HARVEY, D. S., AND P. J. WEATHERHEAD. 2011. Thermal ecology of massasauga
rattlesnakes (Sistrurus catenatus) near their northern range limit. Canadian
Journal of Zoology 89:60–68.
HOLDER, T. L. 1988. Movement and life history aspects of the pygmy rattlesnake in
southwest Missouri. Unpubl. M.Sc. thesis, Southwest Missouri State University,
Springfield, Missouri.
HUDNALL, J. A. 1979. Surface activity and horizontal movements in a marked
population of Sistrurus miliarius barbouri. Bulletin of the Maryland
Herpetological Society 15:134–138.
JETZ, W., C. CARBONE, J. FULFORD, AND J. H. BROWN. 2004. The scaling of animal
space use. Science 306:266–268.
JOHNSON, G. 2000. Spatial ecology of the eastern massasauga (Sistrurus c. catenatus) in
a New York peatland. Journal of Herpetology 34:186–192.
KERNOHAN, B. J., R. A. GITZEN, AND J. J. MILLSPAUGH. 2001. Analysis of animal space
use and movements, pp. 126–166. In: Radio-Tracking and Animal Populations. J.
J. Millspaugh and J. M. Marzluff, (eds.). Academic Press, San Diego, California,
U.S.A.
KING, S. H., J. MOODY, P. L, REDFEARN, JR., J. L. KEENE, AND L. M. BOWE. 2012.
Plants of the Bull Shoals Field Station, Taney County, Missouri. Missouriensis
31:19–43.
LAWTON, J. H. 1993. Range, population abundance and conservation. Trends in
Ecology and Evolution 8:409–413.
LUTTERSCHMIDT, W. I., A. J. SMITH, E. J. TIVADOR III, AND H. K. REINERT. 2012.
Diagnostic classification of connective tissue encapsulating transmitters and data
acquisition units: evidence for not modifying a classic surgical implantation
method. Herpetological Review 43:381–385.
MACARTNEY, J. M, P. T., GREGORY, AND K. W. LARSEN. 1988. A tabular survey of data
on movements and home ranges of snakes. Journal of Herpetology 22:61–73.
MADSEN, T. W., AND R. SHINE. 1996. Seasonal migration of predators and prey: pythons
and rats in tropical Australia. Ecology 77:149–156.

40
MARTINO, J. A., R. G. POULIN, D. L. PARKER, AND C. M. SOMERS. 2012. Habitat
selection by grassland snakes at Northern range limits: implication for
conservation. Journal of Wildlife Management 76:759–767.
MAY, P. G., AND T. M. FARRELL. 2012. Growth patterns of dusky pygmy rattlesnakes
(Sistrurus miliarius barbouit) from Central Florida. Herpetological Monographs
26:58–79.
MAY, P. G., T. M. FARRELL, S. T. HEULETT, M. A. PILGRIM, L. A. BISHOP, D. J. SPENCE,
A. M. RABATSKY, M. G. CAMPBELL, A. D. AYCRIGG, AND W. E. RICHARDSON II.
1996. Seasonal abundance and activity of a rattlesnake (Sistrurus miliarius
barbauri) in Central Florida. Copeia 1996:389–401.
MESSENGER, K. R. 2010. Growth and age at reproductive maturity of the Carolina
pigmy rattlesnake, Sistrurus m. miliarius (Reptilia: Serpentes). Unpubl. M.Sc.
thesis, Marshall University, Huntington, West Virginia.
MONTGOMERY, W. B., AND G. W. SCHUETT. 1989. Autumnal mating with subsequent
production of offspring in the rattlesnake Sistrurus miliarius streckeri. Bulletin of
the Chicago Herpetological Society 24:205–207.
MOORE, J. A., AND J. C. GILLINGHAM. 2006. Spatial ecology and multi-scale habitat
selection by a threatened rattlesnake: the eastern massasauga (Sistrurus catenatus
catenatus). Copeia 2006:742–751.
MOUNT, R.H. 1975. The Reptiles and Amphibians of Alabama. Auburn University,
Auburn, AL.
MYERSTRUD, A., F. J. PEREZ-BARBERIA, AND I. J. GORDON. 2001. The effect of season,
sex and feeding style on home range area versus body mass scaling in temperate
ruminants. Oecologia 127:30–39.
PALMER, W. M., AND A. L. BRASWELL. 1995. Reptiles of North Carolina. Chapel Hill.
University of North Carolina Press.
PERRY, G., AND T. GARLAND. 2002. Lizard home ranges revisited: effects of sex, body
size, diet, habitat, and phylogeny. Ecology 83:1870–1885.
POWELL, R.A. 2000. Animal home ranges and territories and home range estimators, pp.
65–110. In: Research Techniques in Animal Ecology: Controversies and
Consequences. L. B and T. Fuller (eds.). Columbia University Press, New York,
New York.
PRESS, S. J., AND S. WILSON. 1978. Choosing between logistic regression and
discriminant analysis. Journal of the American Statistical Association 73:699–
705.

41
PRIVITAL, D. B., M. J. GOODE, D. E. SWANN, C. R. SCHWALBE, and M. J. SCHROFF.
2002. Natural history of a northern population of twin-spotted rattlesnakes,
Crotalus pricei. Journal of Herpetology 36:598–607.
REINERT, H. K. 1984. Habitat variation within sympatric snake populations. Ecology
65:1673–1682.
REINERT, H. K. 1993. Habitat selection in Snakes, pp. 201–240. In: Snakes: Ecology
and Behavior. R. A. Siegel and J. T. Collins (eds.). McGraw-Hill, New York.
REINERT, H. K., AND D. CUNDALL. 1982. An improved surgical implantation method for
radio-tracking snakes. Copeia 1982:702–705.
REINERT, H. K., D. CUNDALL, and L. M. BUSHAR. 1984. Foraging behavior of the
timber rattlesnake, Crotalus horridus. Copeia 1984:976–981.
ROTH, E. D. 2005. Spatial ecology of a cottonmouth (Agkistrodon piscivorus)
population in East Texas. Journal of Herpetology 39:312–315.
ROW, J. R., AND G. BLOUIN-DEMERS. 2006a. Thermal quality influences habitat
selection at multiple spatial scales in milksnakes. Ecoscience 13:443–450.
ROW, J. R., AND G. BLOUIN-DEMERS. 2006b. Kernels are not accurate estimators of
home range size for herpetofuana. Copeia 2006 797–802.
SEAMAN, D. E., J. J. MILLSPAUGH, B. J. KERNOHAN, G. C. BRUNDIGE, K. J. RAEDEKE,
AND R. A. GITZEN. 1999. Effects of sample size on kernel home range estimates.
Journal of Wildlife Management 63:739–747.
SCHOENER, T. W. 1968. Sizes of feeding territories among birds. Ecology 49:123–141.
SECOR, S. M. 1995. Ecological aspects of foraging mode for the snakes Crotalus
cerastes and Masticophis flagellum. Herpetological Monographs 9:169–186.
SEIGEL, R. A., AND N. B. FORD. 1987. Reproductive ecology, pp. 210–252. In: Snakes:
Ecology and Evolutionary Biology. R. A. Seigel, J. T. Collins, and S. S. Novak
(eds.). Macmillan Publ., New York.
SHINE, R. 1978. Sexual size dimorphism and male combat in snakes. Oecologia
33:269–277.
SLAVENKO, A., Y. ITESCU, F. IHLOW, AND S. MEIRI. 2016. Home is where the shell is:
predicting turtle home range sizes. Journal of Animal Ecology 85:106–114.

42
SMITH, C. F., G. W. SCHUETT, R. L. EARLEY, AND K. SCHWENK. 2009. The spatial and
reproductive ecology of the copperhead (Agkistrodon contortrix) at the
Northeastern extreme of its range. Herpetological Monographs 23:45–73.
STEEN, D. A., J. M. LINEHAN, AND L. L. SMITH. 2010. Multiscale habitat selection and
refuge use of common kingsnakes, Lampropeltis getula, in Southwestern Georgia.
Copeia 2010:227–231.
STONE, P. A., AND T. A. BAIRD. 2002. Estimating lizard home range: the Rose Model
revisited. Journal of Herpetology 36:427–436.
SWIHART, R. K., AND N. A. SLADE. 1985. Influence of sampling interval on estimates of
home-range size. The Journal of Wildlife Management 49:1019–1025.
TRAUTH, S. E., H. W. ROBISON, and M. V. PLUMMER. 2004. The Amphibians and
Reptiles of Arkansas. University of Arkansas Press, Fayetteville.
TUCKER, M. A., T. J. ORD, AND T. L. ROGERS. 2014. Evolutionary predictors of
mammalian home range size: body mass, diet, and the environment. Global
Ecology and Biogeography 23:1105–1114.
VAN MOORTER, B., C. M. ROLANDSEN, M. BASILLE, AND J. M. GAILLARD. 2016.
Movement is the glue connecting home ranges and habitat selection. Journal of
Animal Ecology 85:21–31.
WASKO, D. K., AND M. SASA. 2010. Habitat selection of the terciopelo (Serpentes:
Viperidae: Bothrops asper) in a lowland rainforest in Costa Rica. Herpetologica
66:148–158.
WASTELL, A. R., AND S. P. MACKESSY. 2011. Spatial ecology and factors influencing
movement patterns of desert massasauga rattlesnakes (Sistrurus catenatus
eswardsii) in Southwestern Colorado. Copeia 2011:29–37.
WEATHERHEAD, P. J., AND K. A. PRIOR. 1992. Preliminary observations of habitat use
and movements of the eastern massasauga rattlesnake (Sistrurus c. catenatus).
Journal of Herpetology 26:447–452.
WHITE, G. C., AND R. A. GARROTT. 1990. Analysis of wildlife radio-tracking data.
Academic Press, Inc., San Diego, California.
WITTENBERG, R. D. 2012. Foraging ecology of the timber rattlesnake (Crotalus
horridus) in a fragmented agricultural landscape. Herpetological Conservation
and Biology 7:449–461.
WORTON, B. J. 1987. A review of models of home range for animal movement.
Ecological Modelling 38:277–298.

43
APPENDIX—HOME RANGES

44

45

46

47

48

49