Embed Size (px)
Citation preview

Public Research Institute San Francisco State University
Public Research Institute Phone 415 338 2978 1600 Holloway Avenue Fax 415 338 6099 San Francisco, CA 94132
The Spatial Distribution of Family Income and Poverty in San Francisco, 2000
Report
November 1, 2002
The Spatial Distribution of Family Income and Poverty in San Francisco, 2000
Prepared for the San Francisco Urban Institute at San Francisco State University
by the Public Research Institute at San Francisco State University
November 1, 2002
Prepared by
Ayse Pamuk Assistant Professor of Urban Studies and Public Administration
Principal Investigator
This study was conducted with the assistance of:
PRI Director James A. Wiley PRI Associate Director John D. Rogers Senior Research Assistant Monique Nakagawa
PUBLIC RESEARCH INSTITUTE The Spatial Distribution of Family Income and Poverty in San Francisco, 2000 – San Francisco Urban
Institute at San Francisco State University i
Table of Contents
Summary of Findings 1
List of Tables
Table 1. Median Family Income by Zip Code, 2000 4
Table 2. Families in Poverty by Zip Code, 2000 5
List of Maps
Map 1. Median Family Income by Block Group, 2000 6
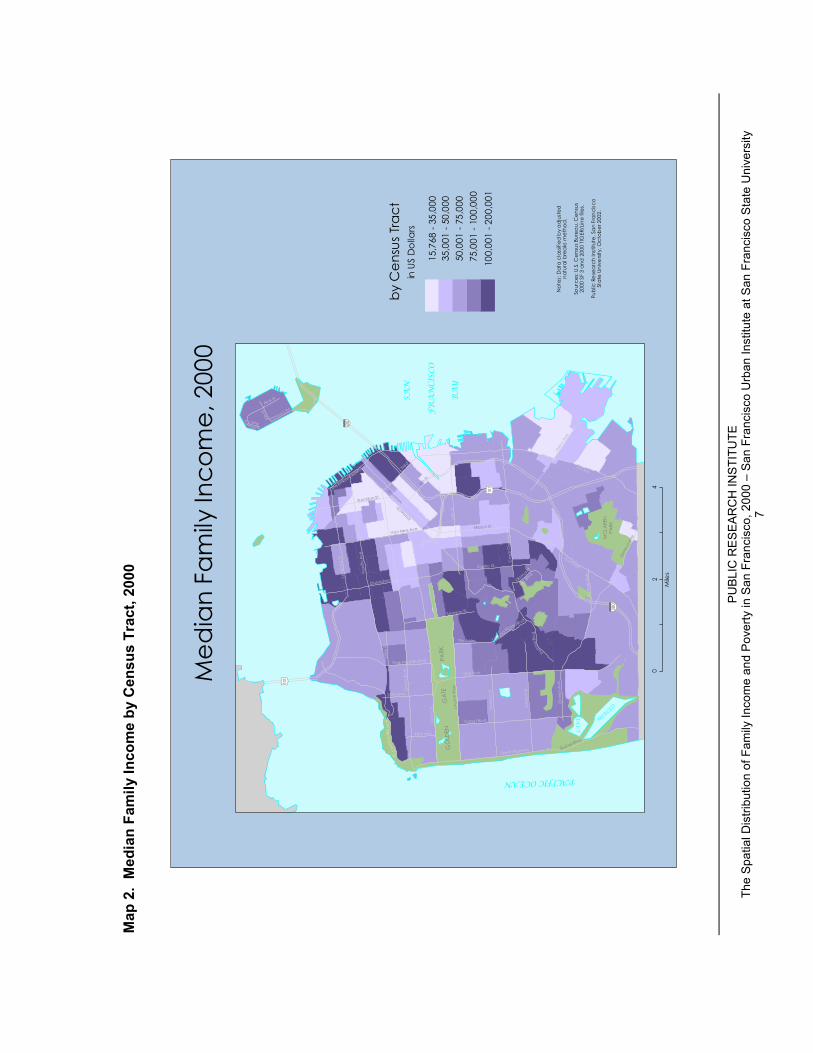
Map 2. Median Family Income by Census Tract, 2000 7
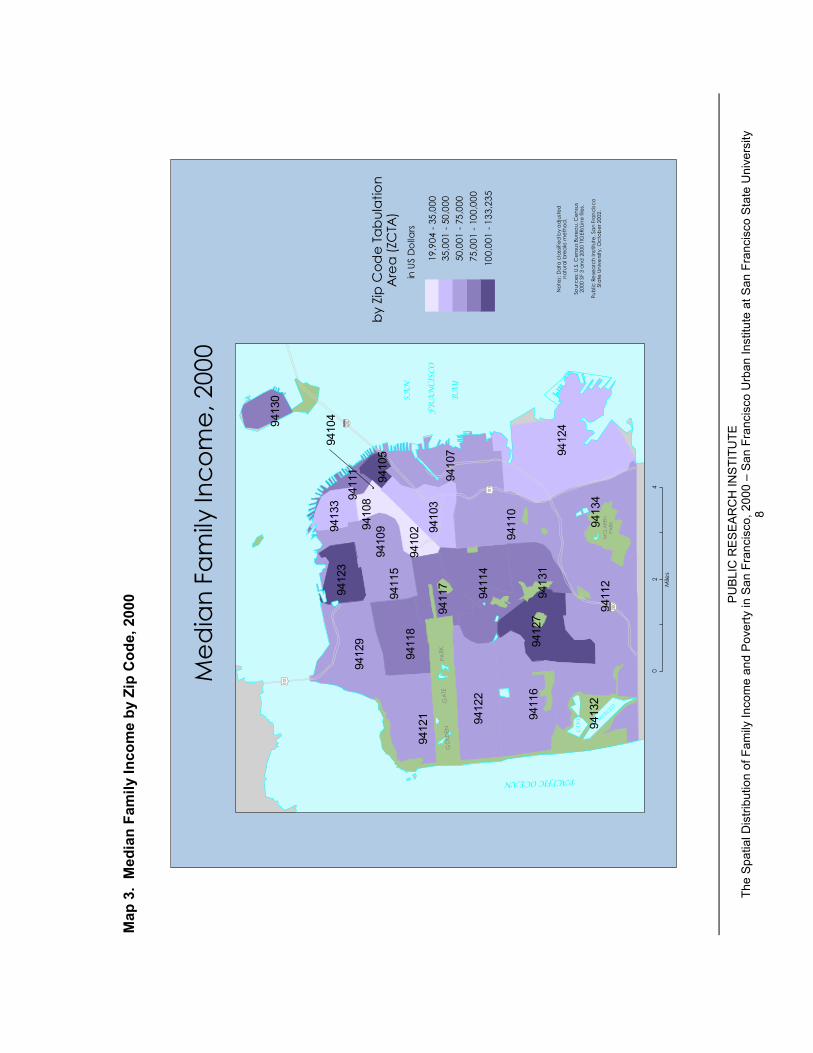
Map 3. Median Family Income by Zip Code, 2000 8
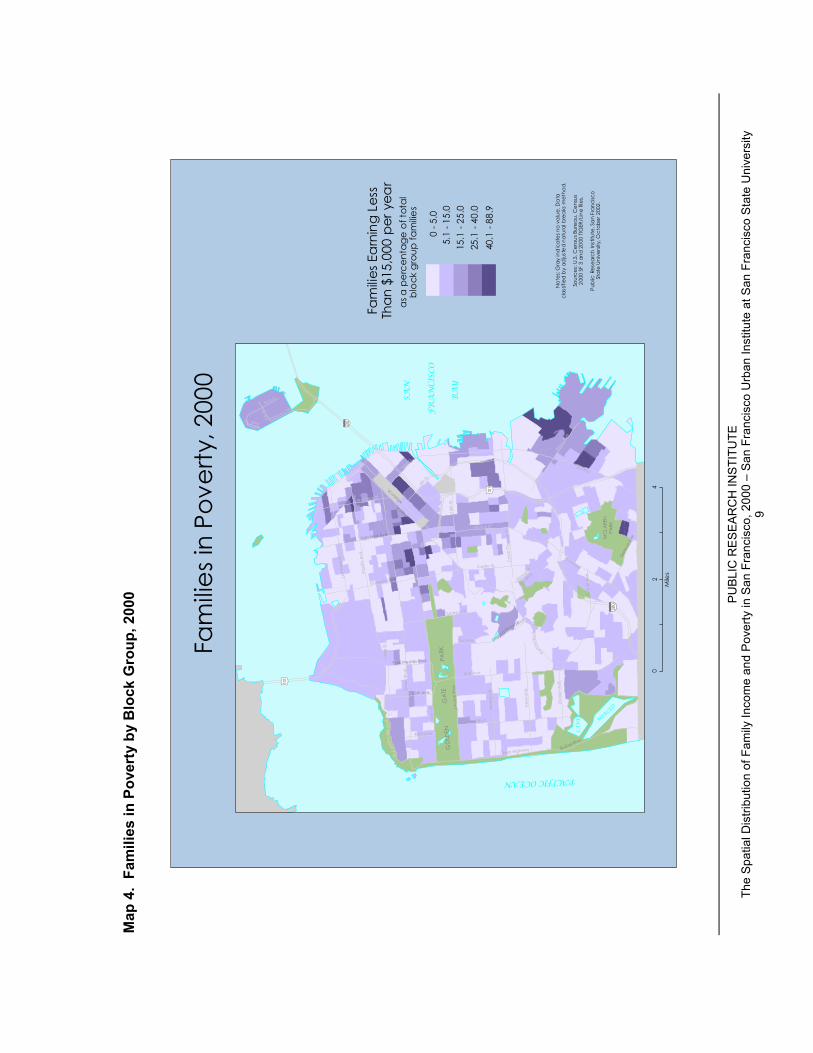
Map 4. Families in Poverty by Block Group, 2000 9
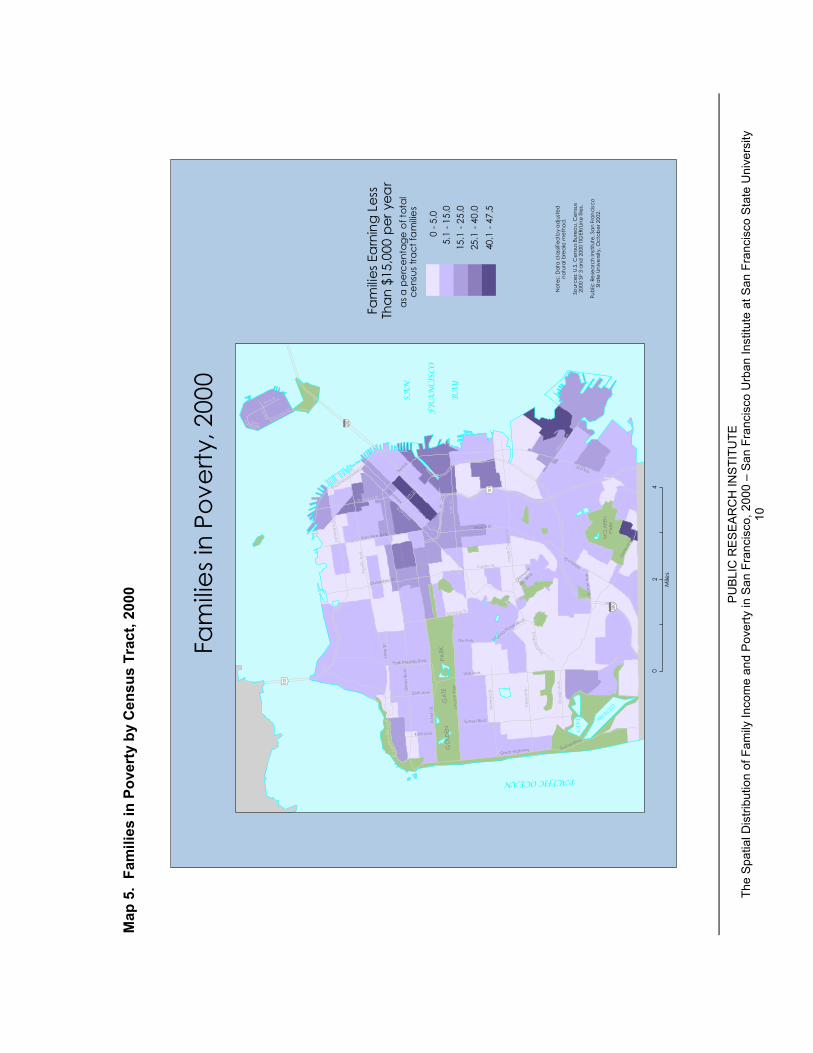
Map 5. Families in Poverty by Census Tract, 2000 10
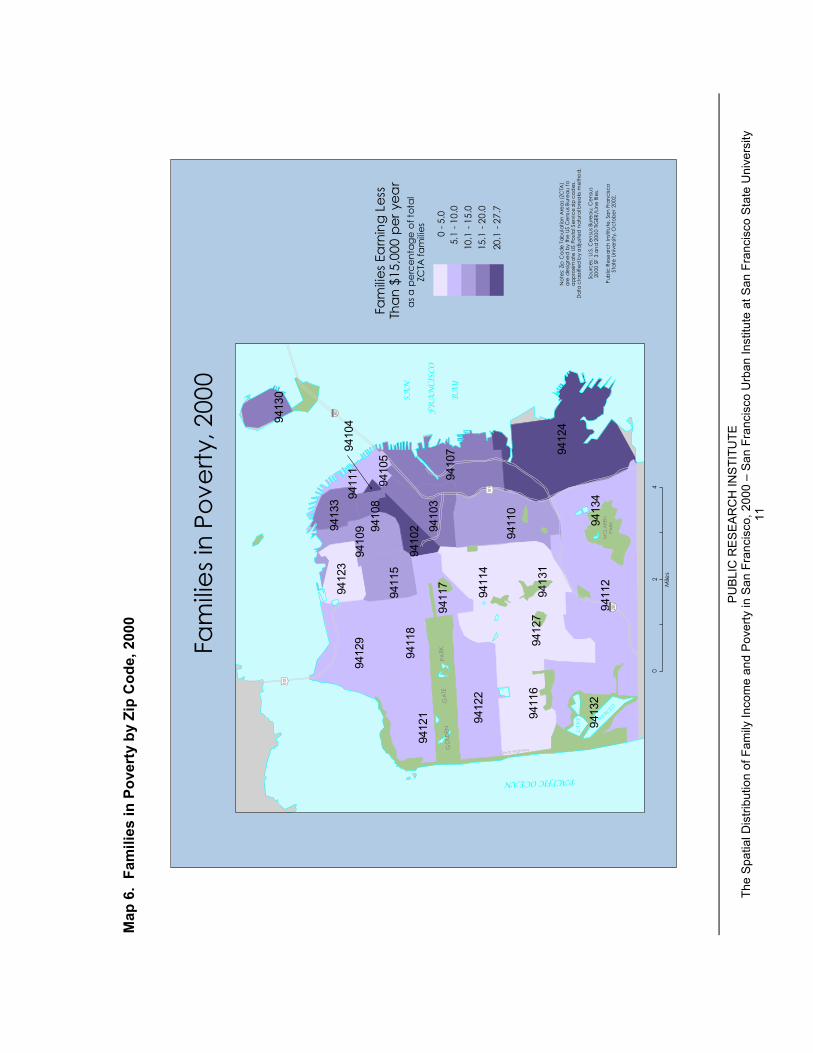
Map 6. Families in Poverty by Zip Code, 2000 11
PUBLIC RESEARCH INSTITUTE The Spatial Distribution of Family Income and Poverty in San Francisco, 2000 – San Francisco Urban
Institute at San Francisco State University 1
Summary of Findings
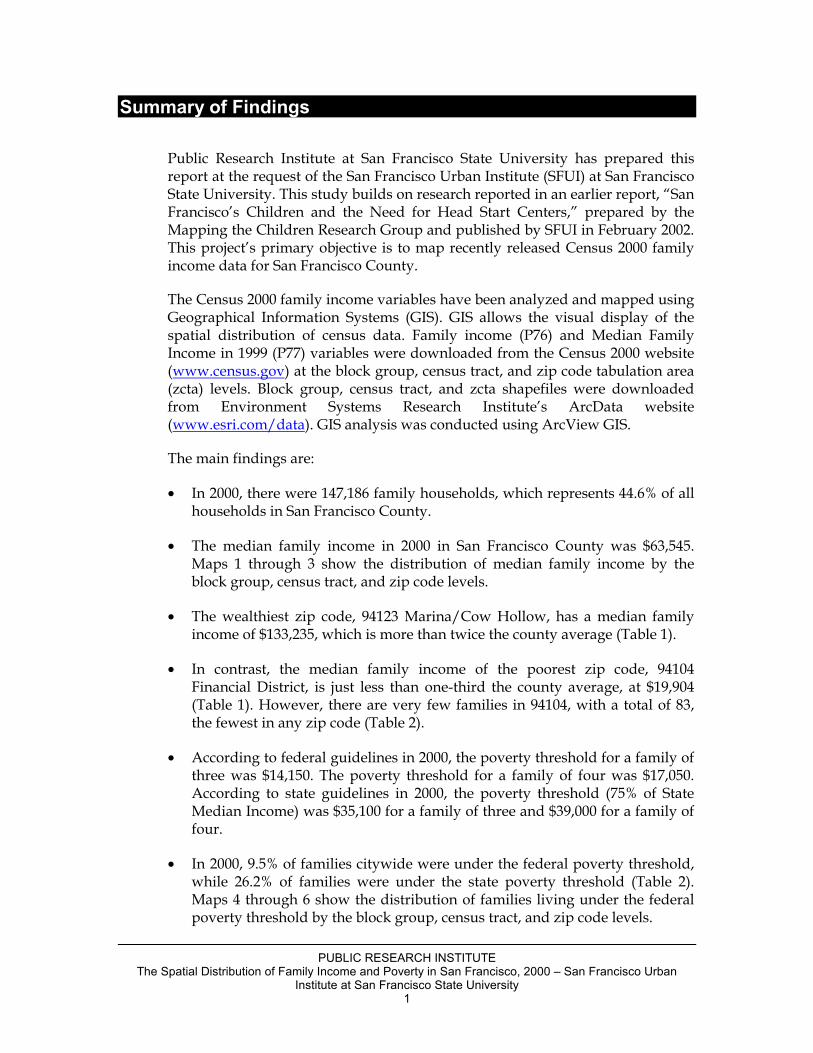
Public Research Institute at San Francisco State University has prepared this report at the request of the San Francisco Urban Institute (SFUI) at San Francisco State University. This study builds on research reported in an earlier report, “San Francisco’s Children and the Need for Head Start Centers,” prepared by the Mapping the Children Research Group and published by SFUI in February 2002. This project’s primary objective is to map recently released Census 2000 family income data for San Francisco County.
The Census 2000 family income variables have been analyzed and mapped using Geographical Information Systems (GIS). GIS allows the visual display of the spatial distribution of census data. Family income (P76) and Median Family Income in 1999 (P77) variables were downloaded from the Census 2000 website (www.census.gov) at the block group, census tract, and zip code tabulation area (zcta) levels. Block group, census tract, and zcta shapefiles were downloaded from Environment Systems Research Institute’s ArcData website (www.esri.com/data). GIS analysis was conducted using ArcView GIS.
The main findings are:
• In 2000, there were 147,186 family households, which represents 44.6% of all households in San Francisco County.
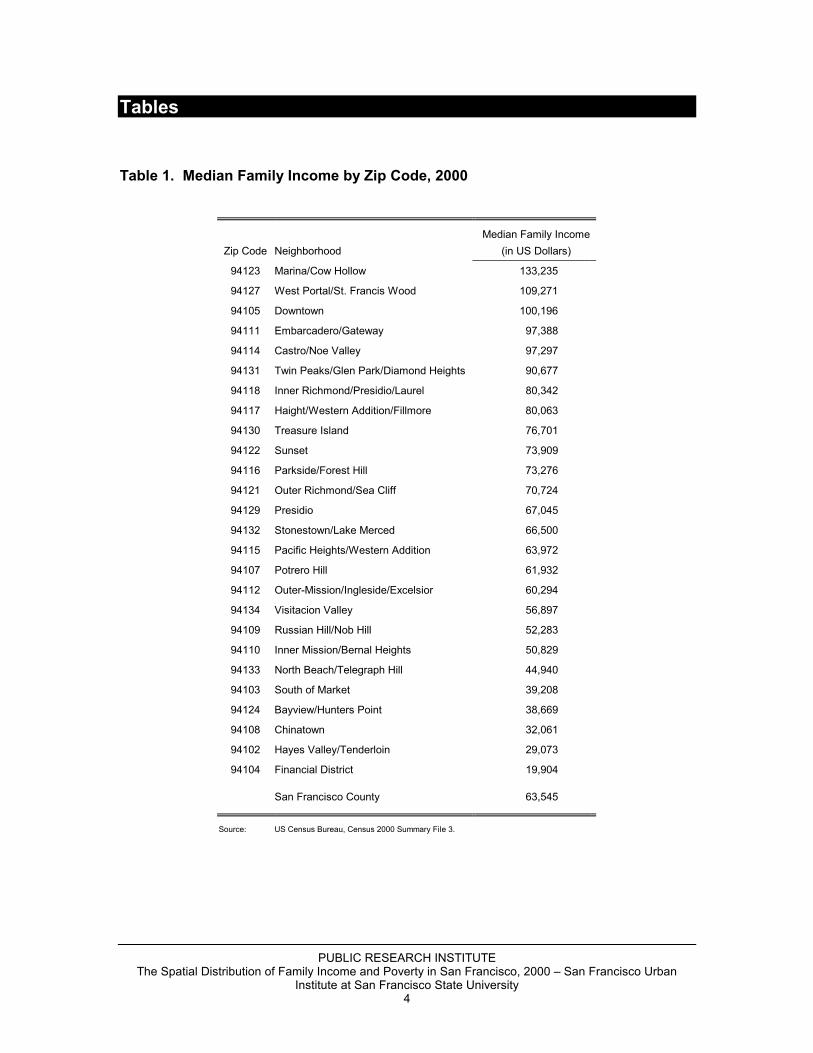
• The median family income in 2000 in San Francisco County was $63,545. Maps 1 through 3 show the distribution of median family income by the block group, census tract, and zip code levels.
• The wealthiest zip code, 94123 Marina/Cow Hollow, has a median family income of $133,235, which is more than twice the county average (Table 1).
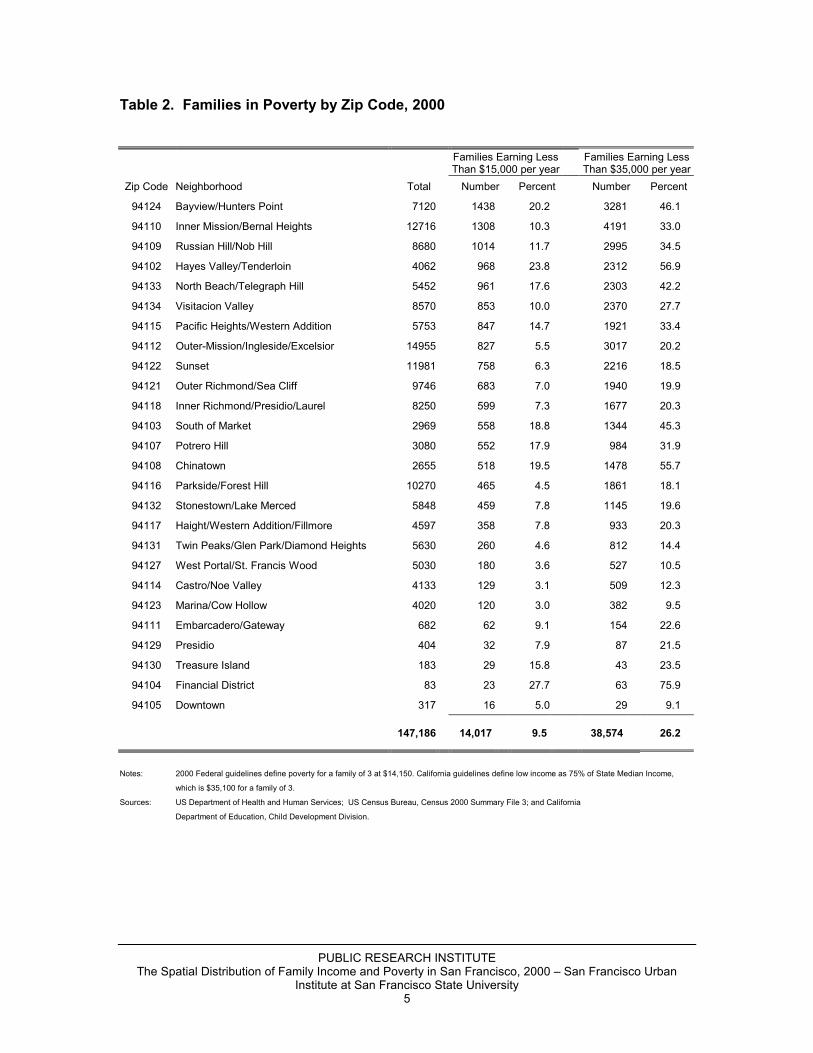
• In contrast, the median family income of the poorest zip code, 94104 Financial District, is just less than one-third the county average, at $19,904 (Table 1). However, there are very few families in 94104, with a total of 83, the fewest in any zip code (Table 2).
• According to federal guidelines in 2000, the poverty threshold for a family of three was $14,150. The poverty threshold for a family of four was $17,050. According to state guidelines in 2000, the poverty threshold (75% of State Median Income) was $35,100 for a family of three and $39,000 for a family of four.
• In 2000, 9.5% of families citywide were under the federal poverty threshold, while 26.2% of families were under the state poverty threshold (Table 2). Maps 4 through 6 show the distribution of families living under the federal poverty threshold by the block group, census tract, and zip code levels.
PUBLIC RESEARCH INSTITUTE The Spatial Distribution of Family Income and Poverty in San Francisco, 2000 – San Francisco Urban
Institute at San Francisco State University 2
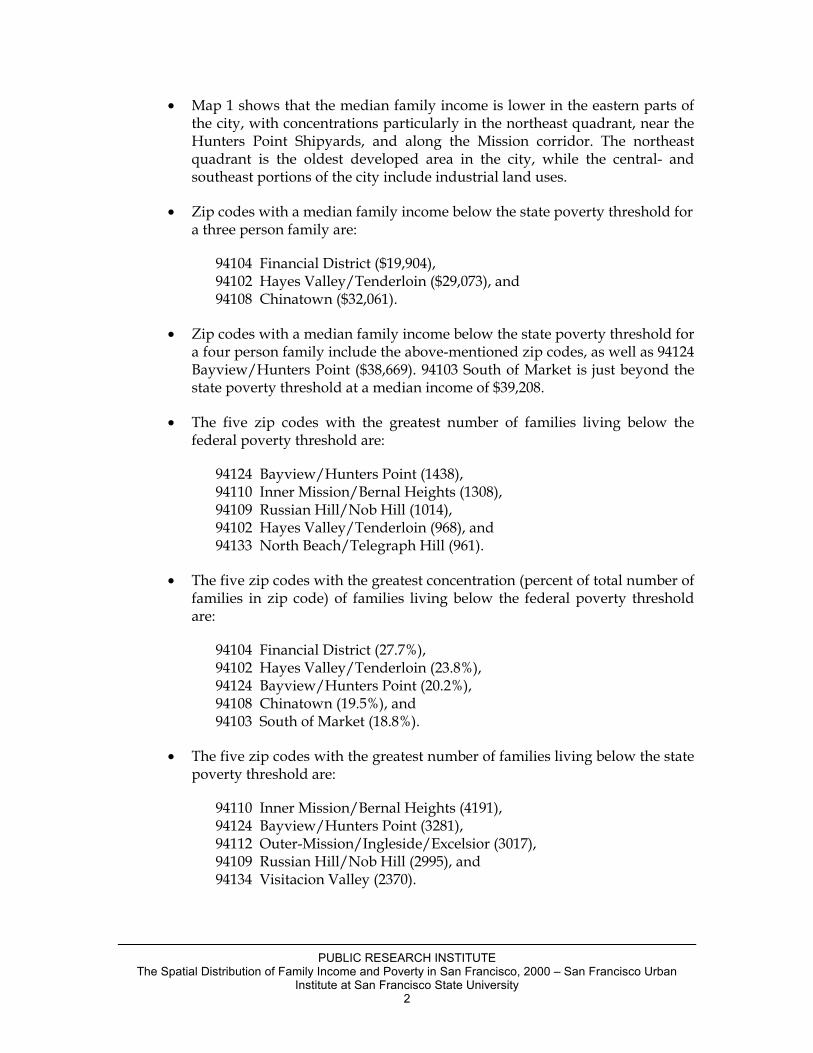
• Map 1 shows that the median family income is lower in the eastern parts of the city, with concentrations particularly in the northeast quadrant, near the Hunters Point Shipyards, and along the Mission corridor. The northeast quadrant is the oldest developed area in the city, while the central- and southeast portions of the city include industrial land uses.
• Zip codes with a median family income below the state poverty threshold for a three person family are:
94104 Financial District ($19,904), 94102 Hayes Valley/Tenderloin ($29,073), and 94108 Chinatown ($32,061).
• Zip codes with a median family income below the state poverty threshold for a four person family include the above-mentioned zip codes, as well as 94124 Bayview/Hunters Point ($38,669). 94103 South of Market is just beyond the state poverty threshold at a median income of $39,208.
• The five zip codes with the greatest number of families living below the federal poverty threshold are:
94124 Bayview/Hunters Point (1438), 94110 Inner Mission/Bernal Heights (1308), 94109 Russian Hill/Nob Hill (1014), 94102 Hayes Valley/Tenderloin (968), and 94133 North Beach/Telegraph Hill (961).
• The five zip codes with the greatest concentration (percent of total number of families in zip code) of families living below the federal poverty threshold are:
94104 Financial District (27.7%), 94102 Hayes Valley/Tenderloin (23.8%), 94124 Bayview/Hunters Point (20.2%), 94108 Chinatown (19.5%), and 94103 South of Market (18.8%).
• The five zip codes with the greatest number of families living below the state poverty threshold are:
94110 Inner Mission/Bernal Heights (4191), 94124 Bayview/Hunters Point (3281), 94112 Outer-Mission/Ingleside/Excelsior (3017), 94109 Russian Hill/Nob Hill (2995), and 94134 Visitacion Valley (2370).
PUBLIC RESEARCH INSTITUTE The Spatial Distribution of Family Income and Poverty in San Francisco, 2000 – San Francisco Urban
Institute at San Francisco State University 3
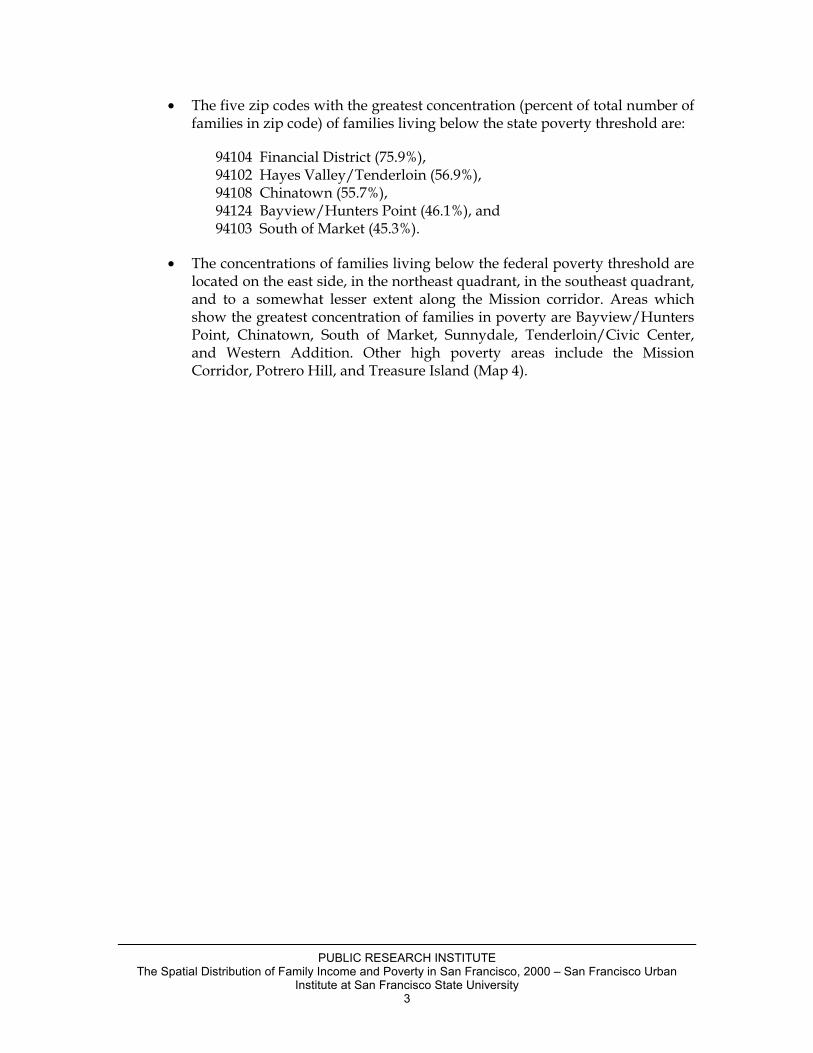
• The five zip codes with the greatest concentration (percent of total number of families in zip code) of families living below the state poverty threshold are:
94104 Financial District (75.9%), 94102 Hayes Valley/Tenderloin (56.9%), 94108 Chinatown (55.7%), 94124 Bayview/Hunters Point (46.1%), and 94103 South of Market (45.3%).
• The concentrations of families living below the federal poverty threshold are located on the east side, in the northeast quadrant, in the southeast quadrant, and to a somewhat lesser extent along the Mission corridor. Areas which show the greatest concentration of families in poverty are Bayview/Hunters Point, Chinatown, South of Market, Sunnydale, Tenderloin/Civic Center, and Western Addition. Other high poverty areas include the Mission Corridor, Potrero Hill, and Treasure Island (Map 4).
PUBLIC RESEARCH INSTITUTE The Spatial Distribution of Family Income and Poverty in San Francisco, 2000 – San Francisco Urban
Institute at San Francisco State University 4
Tables
Table 1. Median Family Income by Zip Code, 2000
Median Family Income Zip Code Neighborhood (in US Dollars)
94123 Marina/Cow Hollow 133,235
94127 West Portal/St. Francis Wood 109,271
94105 Downtown 100,196
94111 Embarcadero/Gateway 97,388
94114 Castro/Noe Valley 97,297
94131 Twin Peaks/Glen Park/Diamond Heights 90,677
94118 Inner Richmond/Presidio/Laurel 80,342
94117 Haight/Western Addition/Fillmore 80,063
94130 Treasure Island 76,701
94122 Sunset 73,909
94116 Parkside/Forest Hill 73,276
94121 Outer Richmond/Sea Cliff 70,724
94129 Presidio 67,045
94132 Stonestown/Lake Merced 66,500
94115 Pacific Heights/Western Addition 63,972
94107 Potrero Hill 61,932
94112 Outer-Mission/Ingleside/Excelsior 60,294
94134 Visitacion Valley 56,897
94109 Russian Hill/Nob Hill 52,283
94110 Inner Mission/Bernal Heights 50,829
94133 North Beach/Telegraph Hill 44,940
94103 South of Market 39,208
94124 Bayview/Hunters Point 38,669
94108 Chinatown 32,061
94102 Hayes Valley/Tenderloin 29,073
94104 Financial District 19,904
San Francisco County 63,545
Source: US Census Bureau, Census 2000 Summary File 3.
PUBLIC RESEARCH INSTITUTE The Spatial Distribution of Family Income and Poverty in San Francisco, 2000 – San Francisco Urban
Institute at San Francisco State University 5
Table 2. Families in Poverty by Zip Code, 2000
Families Earning Less Than $15,000 per year Families Earning Less
Than $35,000 per yearZip Code Neighborhood Total Number Percent Number Percent
94124 Bayview/Hunters Point 7120 1438 20.2 3281 46.1 94110 Inner Mission/Bernal Heights 12716 1308 10.3 4191 33.0 94109 Russian Hill/Nob Hill 8680 1014 11.7 2995 34.5 94102 Hayes Valley/Tenderloin 4062 968 23.8 2312 56.9 94133 North Beach/Telegraph Hill 5452 961 17.6 2303 42.2 94134 Visitacion Valley 8570 853 10.0 2370 27.7 94115 Pacific Heights/Western Addition 5753 847 14.7 1921 33.4 94112 Outer-Mission/Ingleside/Excelsior 14955 827 5.5 3017 20.2 94122 Sunset 11981 758 6.3 2216 18.5 94121 Outer Richmond/Sea Cliff 9746 683 7.0 1940 19.9 94118 Inner Richmond/Presidio/Laurel 8250 599 7.3 1677 20.3 94103 South of Market 2969 558 18.8 1344 45.3 94107 Potrero Hill 3080 552 17.9 984 31.9 94108 Chinatown 2655 518 19.5 1478 55.7 94116 Parkside/Forest Hill 10270 465 4.5 1861 18.1 94132 Stonestown/Lake Merced 5848 459 7.8 1145 19.6 94117 Haight/Western Addition/Fillmore 4597 358 7.8 933 20.3 94131 Twin Peaks/Glen Park/Diamond Heights 5630 260 4.6 812 14.4 94127 West Portal/St. Francis Wood 5030 180 3.6 527 10.5 94114 Castro/Noe Valley 4133 129 3.1 509 12.3 94123 Marina/Cow Hollow 4020 120 3.0 382 9.5 94111 Embarcadero/Gateway 682 62 9.1 154 22.6 94129 Presidio 404 32 7.9 87 21.5 94130 Treasure Island 183 29 15.8 43 23.5 94104 Financial District 83 23 27.7 63 75.9 94105 Downtown 317 16 5.0 29 9.1
147,186 14,017 9.5 38,574
26.2
Notes: 2000 Federal guidelines define poverty for a family of 3 at $14,150. California guidelines define low income as 75% of State Median Income, which is $35,100 for a family of 3.
Sources: US Department of Health and Human Services; US Census Bureau, Census 2000 Summary File 3; and California Department of Education, Child Development Division.

PUBL
IC R
ESEA
RC
H IN
STIT
UTE
Th
e Sp
atia
l Dis
tribu
tion
of F
amily
Inco
me
and
Pove
rty in
San
Fra
ncis
co, 2
000
– Sa
n Fr
anci
sco
Urb
an In
stitu
te a
t San
Fra
ncis
co S
tate
Uni
vers
ity
6
Map
s
Map
1.
Med
ian
Fam
ily In
com
e by
Blo
ck G
roup
, 200
0
Med
ian
Fam
ily In
com
e, 2
000
Not
es: D
ata
clas
sifie
d b
y a
djus
ted
natu
ral b
rea
ks m
etho
d.
Sour
ces:
U.S.
Cen
sus B
urea
u, C
ensu
s20
00 S
F 3
and
200
0 TIG
ER/L
ine
files
.
Publ
ic R
ese
arch
Inst
itute
, Sa
n Fr
anci
sco
Stat
e Un
ive
rsity
, Oct
ober
200
2.
0 - 3
5,00
035
,001
- 50
,000
50,0
01 -
75,0
0075
,001
- 10
0,00
010
0,00
1 - 2
00,0
01
in U
S D
olla
rsby
Cen
sus B
lock
Gro
up
Mile
s
02
4
%j
IÄ
!c
IÄ
No
rieg
a St
.
Tara
val S
t.
Oc
ean
Ave
.
19th Ave.
Sunset Blvd.
Great Highway
Linc
oln
Wa
y
Skyline Blvd.
Oce
an A
ve.
Gen
eva
Ave.
Portola
Blv
d.
Third St.
Mission St.
Ce
sar C
have
z St
.
Palo
u Ave
.
16th
St.
Mission St.
Castro St.
Third
St.
Market S
t.Miss
ion St.
6 th St.
Diamond
Hts. Bl
vd.
LagunaHondaBlvd.
7th Ave.
Stanyan St.
Ge
ary
Blvd
.
Fulto
n St
.
Lake
St.
25th Ave.
Park Presidio Blvd.
40th Ave.
El C
amin
o de
l Mar
Divisadero St.
Paci
fic A
ve.
Lom
bar
d S
t.
Van Ness Ave.
Stockton St.
The Embarcadero
GO
LDEN
GA
TEPA
RK
LAK
E MERCE
D
PACIFIC OCEAN
SAN
FR
AN
CIS
CO
BA
Y
MC
LARE
NPA
RK
Ave. H
9th
St.
Treasure Is. Rd.
Gateview Ave.
PUBL
IC R
ESEA
RC
H IN
STIT
UTE
Th
e Sp
atia
l Dis
tribu
tion
of F
amily
Inco
me
and
Pove
rty in
San
Fra
ncis
co, 2
000
– Sa
n Fr
anci
sco
Urb
an In
stitu
te a
t San
Fra
ncis
co S
tate
Uni
vers
ity
7
Map
2.
Med
ian
Fam
ily In
com
e by
Cen
sus
Trac
t, 20
00
Med
ian
Fam
ily In
com
e, 2
000
Not
es: D
ata
clas
sifie
d b
y a
djus
ted
natu
ral b
rea
ks m
etho
d.
Sour
ces:
U.S.
Cen
sus B
urea
u, C
ensu
s20
00 S
F 3
and
200
0 TIG
ER/L
ine
files
.
Publ
ic R
ese
arch
Inst
itute
, Sa
n Fr
anci
sco
Stat
e Un
ive
rsity
, Oct
ober
200
2.
15,7
68 -
35,0
0035
,001
- 50
,000
50,0
01 -
75,0
0075
,001
- 10
0,00
010
0,00
1 - 2
00,0
01
in U
S D
olla
rsby
Cen
sus T
ract
Mile
s
02
4
%j
IÄ
!c
IÄ
No
rieg
a S
t.
Tara
val S
t.
Oc
ean
Ave
.
19th Ave.
Sunset Blvd.
Great Highway
Linc
oln
Wa
y
Skyline Blvd.
Oce
an A
ve.
Gen
eva
Ave
.
Portola
Blv
d.
Third St.
Mission St.
Ce
sar C
have
z St
.
Palo
u Ave
.
16th
St.
Miss ion St.
Castro St.
Third
St.
Market S
t.Miss
ion St.
6th St.
Diamond
Hts. Bl
vd.
LagunaHondaBlvd.
7th Ave.
Stanyan St.
Ge
ary
Blvd
.
Fulto
n S
t.
Lake
St.
25th Ave.
Park Presidio Blvd.
40th Ave.
El C
amin
o de
l Mar
Divisadero St.
Paci
fic A
ve.
Lom
bar
d S
t.
Van Ness Ave.
Stockton St.
The Embarcadero
GO
LDEN
GAT
EPA
RK
LAK
E MERCE
D
PACIFIC OCEAN
SAN
FR
AN
CIS
CO
BA
Y
MC
LARE
NPA
RK
Ave. H
9th
St.
Treasure I s. Rd.
Gateview Ave.
PUBL
IC R
ESEA
RC
H IN
STIT
UTE
Th
e Sp
atia
l Dis
tribu
tion
of F
amily
Inco
me
and
Pove
rty in
San
Fra
ncis
co, 2
000
– Sa
n Fr
anci
sco
Urb
an In
stitu
te a
t San
Fra
ncis
co S
tate
Uni
vers
ity
8
Map
3.
Med
ian
Fam
ily In
com
e by
Zip
Cod
e, 2
000
9412
4
9413
294
112
9412
2
9412
1
9410
7
9411
6
9412
9
9413
4
9411
0
9413
194
127
9411
8
9410
9
9411
4
9411
794
103
9411
5
9413
0
9412
394
111
9413
3
9410
2
9410
594
108
#
9410
4
Med
ian
Fam
ily In
com
e, 2
000
Not
es: D
ata
clas
sifie
d b
y a
djus
ted
natu
ral b
rea
ks m
etho
d.
Sour
ces:
U.S.
Cen
sus B
urea
u, C
ensu
s20
00 S
F 3
and
200
0 TIG
ER/L
ine
files
.
Publ
ic R
ese
arch
Inst
itute
, Sa
n Fr
anci
sco
Stat
e Un
ive
rsity
, Oct
ober
200
2.
19,9
04 -
35,0
0035
,001
- 50
,000
50,0
01 -
75,0
0075
,001
- 10
0,00
010
0,00
1 - 1
33,2
35
in U
S D
olla
rs
by Z
ip C
ode
Tab
ulat
ion
Are
a (Z
CTA
)
Mile
s
02
4
%j
IÄ
!c
IÄ
Palo
u Ave
.
GO
LDEN
GAT
EPA
RK
LAK
E MERCE
D
PACIFIC OCEAN
SAN
FR
AN
CIS
CO
BA
Y
MC
LARE
NPA
RK
PUBL
IC R
ESEA
RC
H IN
STIT
UTE
Th
e Sp
atia
l Dis
tribu
tion
of F
amily
Inco
me
and
Pove
rty in
San
Fra
ncis
co, 2
000
– Sa
n Fr
anci
sco
Urb
an In
stitu
te a
t San
Fra
ncis
co S
tate
Uni
vers
ity
9
Map
4.
Fam
ilies
in P
over
ty b
y B
lock
Gro
up, 2
000
Fam
ilies i
n Po
verty
, 200
0
Not
es: G
ray
ind
icat
es n
o va
lue.
Da
tacl
assif
ied
by
adju
ste
d na
tura
l bre
aks
met
hod.
Sour
ces:
U.S
. Cen
sus B
urea
u, C
ensu
s20
00 S
F 3
and
2000
TIG
ER/L
ine
files
.
Pub
lic R
esea
rch
Inst
itute
, Sa
n Fr
anci
sco
Stat
e Un
iver
sity,
Oct
ober
200
2.
0 - 5
.05.
1 - 1
5.0
15.1
- 25
.025
.1 -
40.0
40.1
- 88
.9
as a
per
cent
age
of t
otal
blo
ck g
roup
fam
ilies
Fam
ilies E
arn
ing
Less
Than
$15
,000
per
yea
r
Mile
s
02
4
%j
IÄ
!c
IÄ
No
rieg
a S
t.
Tara
val S
t.
Oc
ean
Ave
.
19th Ave.
Sunset Blvd.
Great Highway
Linc
oln
Wa
y
Skyline Blvd.
Oce
an A
ve.
Gen
eva
Ave
.
Portola
Blv
d.
Third St.
Mission St.
Ce
sar C
have
z St
.
Palo
u Ave
.
16th
St.
Miss ion St.
Castro St.
Third
St.
Market S
t.Miss
ion St.
6th St.
Diamond
Hts. Bl
vd.
LagunaHondaBlvd.
7th Ave.
Stanyan St.
Ge
ary
Blvd
.
Fulto
n S
t.
Lake
St.
25th Ave.
Park Presidio Blvd.
40th Ave.
El C
amin
o de
l Mar
Divisadero St.
Paci
fic A
ve.
Lom
bar
d S
t.
Van Ness Ave.
Stockton St.
The Embarcadero
GO
LDEN
GAT
EPA
RK
LAK
E MERCE
D
PACIFIC OCEAN
SAN
FR
AN
CIS
CO
BA
Y
MC
LARE
NPA
RK
Ave. H
9th
St.
Treasure I s. Rd.
Gateview Ave.
PUBL
IC R
ESEA
RC
H IN
STIT
UTE
Th
e Sp
atia
l Dis
tribu
tion
of F
amily
Inco
me
and
Pove
rty in
San
Fra
ncis
co, 2
000
– Sa
n Fr
anci
sco
Urb
an In
stitu
te a
t San
Fra
ncis
co S
tate
Uni
vers
ity
10
Map
5.
Fam
ilies
in P
over
ty b
y C
ensu
s Tr
act,
2000
Fam
ilies i
n Po
verty
, 200
0
Not
es: D
ata
clas
sifie
d b
y a
djus
ted
natu
ral b
rea
ks m
etho
d.
Sour
ces:
U.S.
Cen
sus B
urea
u, C
ensu
s20
00 S
F 3
and
200
0 TIG
ER/L
ine
files
.
Publ
ic R
ese
arch
Inst
itute
, Sa
n Fr
anci
sco
Stat
e Un
ive
rsity
, Oct
ober
200
2.
0 - 5
.05.
1 - 1
5.0
15.1
- 25
.025
.1 -
40.0
40.1
- 47
.5
as a
per
cent
age
of t
otal
cens
us tr
act f
am
ilies
Fam
ilies E
arn
ing
Less
Than
$15
,000
per
yea
r
Mile
s
02
4
%j
IÄ
!c
IÄ
No
rieg
a S
t.
Tara
val S
t.
Oc
ean
Ave
.
19th Ave.
Sunset Blvd.
Great Highway
Linc
oln
Wa
y
Skyline Blvd.
Oce
an A
ve.
Gen
eva
Ave
.
Portola
Blv
d.
Third St.
Mission St.
Ce
sar C
have
z St
.
Palo
u Ave
.
16th
St.
Miss ion St.
Castro St.
Third
St.
Market S
t.Miss
ion St.
6th St.
Diamond
Hts. Bl
vd.
LagunaHondaBlvd.
7th Ave.
Stanyan St.
Ge
ary
Blvd
.
Fulto
n S
t.
Lake
St.
25th Ave.
Park Presidio Blvd.
40th Ave.
El C
amin
o de
l Mar
Divisadero St.
Paci
fic A
ve.
Lom
bar
d S
t.
Van Ness Ave.
Stockton St.
The Embarcadero
GO
LDEN
GAT
EPA
RK
LAK
E MERCE
D
PACIFIC OCEAN
SAN
FR
AN
CIS
CO
BA
Y
MC
LARE
NPA
RK
Ave. H
9th
St.
Treasure I s. Rd.
Gateview Ave.
PUBL
IC R
ESEA
RC
H IN
STIT
UTE
Th
e Sp
atia
l Dis
tribu
tion
of F
amily
Inco
me
and
Pove
rty in
San
Fra
ncis
co, 2
000
– Sa
n Fr
anci
sco
Urb
an In
stitu
te a
t San
Fra
ncis
co S
tate
Uni
vers
ity
11
Map
6.
Fam
ilies
in P
over
ty b
y Zi
p C
ode,
200
0
9412
4
9413
294
112
9412
2
9412
1
9410
7
9411
6
9412
9
9413
4
9411
0
9413
194
127
9411
8
9410
9
9411
4
9411
794
103
9411
5
9413
0
9412
394
111
9413
3
9410
2
9410
594
108
#
9410
4
Fam
ilies i
n Po
verty
, 200
0
Not
es: Z
ip C
ode
Tab
ulat
ion
Are
as (
ZCTA
) ar
e d
esig
ned
by
the
US C
ensu
s Bur
eau
toa
ppro
ximat
e US
Pos
tal S
ervi
ce zi
p co
des
.D
ata
clas
sifie
d b
y a
djus
ted
nat
ural
bre
aks
met
hod.
Sour
ces:
U.S
. Cen
sus B
urea
u, C
ensu
s20
00 S
F 3
and
2000
TIG
ER/L
ine
files
.
Pub
lic R
ese
arch
Inst
itute
, San
Fra
ncisc
oSt
ate
Univ
ersit
y, O
ctob
er 2
002.
0 - 5
.05.
1 - 1
0.0
10.1
- 15
.015
.1 -
20.0
20.1
- 27
.7
as a
per
cent
age
of t
otal
ZCTA
fam
ilies
Fam
ilies E
arn
ing
Less
Than
$15
,000
per
yea
r
Mile
s
02
4
%j
IÄ
!c
IÄ
Great HighwayGO
LDEN
GAT
EPA
RK
LAK
E MERCE
D
PACIFIC OCEAN
SAN
FR
AN
CIS
CO
BA
Y
MC
LARE
NPA
RK