Embed Size (px)
Citation preview
The Spatial Clustering of Science and Capital:
Accounting for Biotech Firm-Venture Capital Relationships*
Walter W. Powell Kenneth W. Koput
509 CERAS Bldg. 405 McClelland Hall
Stanford University Department of Management & Policy
Stanford, CA 94305 University of Arizona
[email protected] Tucson, AZ 85721
fax: 650-725-7395 [email protected]
fax: 520-621-4171
James I. Bowie Laurel Smith-Doerr
Department of Sociology Department of Sociology
University of Arizona Boston University
Tucson AZ 85721 96 Cummington Street
Boston, MA 02215
SEPTEMBER, 2001
Forthcoming, Regional Studies
* Research support provided by National Science Foundation (#9710729, W.W.
Powell and K.W. Koput, Co-PIs). We appreciate the helpful comments of Gernot
Grabher and Joerg Sydow.
2
Abstract
This paper focuses on the spatial concentration of two essential factors of
production in the commercial field of biotechnology: ideas and money. The location of
both research- intensive biotech firms and the venture capital firms that fund biotech is
highly clustered in a handful of key U.S. regions. The commercialization of a new
medicine and the financing of a high-risk startup firm are both activities that have an
identifiable timeline, and often involve collaboration with multiple participants. The
importance of tacit knowledge, face-to-face contact, and the ability to learn and manage
across multiple projects are critical reasons for the continuing importance of geographic
propinquity in biotech. Over the period 1988-99, more than half of the U.S. biotech firms
received locally-based venture funding. Those firms receiving non- local support were
older, larger, and had moved research projects further along the commercialization
process. Similarly, as VC firms grow older and bigger, they invest in more non- local
firms. But these patterns have a strong regional basis, with notable differences between
Boston, New York, and West Coast money. Biotechnology is unusual in its dual
dependence on basic science and venture financing; other fields in which product
development is not as dependent on the underlying science may have different spatial
patterns.
KEYWORDS: BIOTECHNOLOGY, VENTURE CAPITAL, NETWORKS, SPATIAL
AGGLOMERATION.
3
Introduction
Our focus is on the relationships between dedicated biotechnology companies and
the venture capital firms that finance them. These are, in a sense, unusual relationships in
that they are designed with a termination point in mind, at which time the venture
capitalist exits and moves on. Nor are they exclusive relationships. A venture capitalist
is likely to invest in many different biotech firms, including some who are likely to be
competitors in a particular therapeutic area, such as cardiology, or with a particular
technology, such as genomics. Biotech firms may well have backing from multiple
venture capitalists, either as part of a collective, such as a group or syndicate, or
separately as a means to finance discrete projects, such as a specialized use of a more
general purpose technology. Biotech firms also garner financial support from multiple
sources, through government research grants, R&D alliances with major corporations,
and selling minority equity stakes. For a biotech firm to become financially successful, it
needs to develop a promising pipeline with numerous new medicines. Each potential
product is, in some respects, a separate project that involves different internal staff and
disparate external collaborators. At a venture firm, a portfolio of investments is
developed with divergent levels of risk, different timelines, and varied expected payoffs.
For both biotechs and venture firms, learning across partners and projects, and
developing experience working with diverse parties, is critical to success (POWELL,
KOPUT, and SMITH-DOERR, 1996).
We analyze the spatial aspects of these relationships, examining how the role of
location shifts over time as projects, firms and regions mature. Our data are drawn from
the commercial field of human biotechnology, specifically the wave of founding of new
biotech firms in the U.S. over the period 1988-1999. This field is remarkably clustered
spatially, with over 48% of all U.S. firms located in either Northern California, the
Boston Metropolitan area, or San Diego County. We map the industry’s growth, showing
a pattern of cluster-based proliferation. We match our biotech data to a data set on firms
that provide venture capital to our sample of biotech companies. Venture capital is also
spatially concentrated, in the Bay Area, Boston, and New York. We use descriptive

4
statistics to analyze whether the linkages between biotech and venture capital are
exclusively local, have a local component, or are non- local.
The Co-location of Science and Capital
We take as our starting point the spatial concentration of two key factors of
production in the commercial field of biotechnology: ideas and money. Casual observers
might wonder why these two endowments, which are highly fungible, easily
transportable, in short, weightless (LEADBEATER, 2000), are so strongly concentrated
regionally. Abundant evidence points to the clustering of both knowledge and capital.
Ideas, especially knowledge from the frontiers of cutting-edge science, have a
strong tacit dimension (NELSON and WINTER, 1982). When knowledge is more tacit in
character, face-to-face communication and interaction are important (VON HIPPLE,
1994). Consequently, to understand the science, one has to participate in its
development. Hence new scientific advances have a form of natural excludability
(ZUCKER, DARBY, and BREWER, 1998). In the early years of the biotechnology
industry, firms were founded in close proximity to research institutes and universities
where the advances in basic science were being made (KENNEY, 1986; AUDRETSCH
and STEPHAN, 1996; PREVEZER, 1996; ZUCKER et al, 1998). There are two key
elements to this clustering process. One aspect is captured by research on knowledge
spillovers, where geographic proximity facilitates the spread of innovative ideas (JAFFE,
TRAJTENBERG, and HENDERSON, 1993; AUDRETSCH and FELDMAN, 1996).
But while intellectual capital is necessary, it may not be not sufficient. A supportive
institutional infrastructure that fosters knowledge transfer and the formation of
technology-based companies is also critical (POWELL, 1996).
Consider the case of Atlanta, Georgia, where there is a major research center, the
Center for Disease Control, a technology-based university, Georgia Tech, and one of the
top medical schools in the country at Emory University. The metropolitan area is
reasonably well- to-do and well-educated, and a number of Fortune 500 firms are

5
headquartered there. But there is little in the way of commercial biotechnology, despite
abundant intellectual resources. One biomedical entrepreneur at Georgia Tech told us
that he has had numerous overtures from financiers and angel investors for his
technologies, but they have all made leaving Atlanta and moving to California a
requirement of obtaining the financing.
Or consider the often-cited list of founders of some of the key firms created in the
late 1970s and 1980s: Genentech (Herbert Boyer, University of California – San
Francisco), Biogen (Walter Gilbert, Harvard), Hybritech (Ivar Royston, University of
California – San Diego), Genetics Institute (Mark Ptashne, Harvard), Systemix (David
Baltimore, MIT and Whitehead Institute), and Immulogic (Malcolm Gefter, MIT).1 All
of these eminent scientists retained their university affiliations, often full- time. They
were able, so to speak, to have their cake and eat it too, precisely because their
universities had created rules and routines that enabled technology transfer and faculty
entrepreneurship. There are many regions where there is scientific excellence but not the
requisite infrastructure to capture the rents from knowledge spillovers.
Our emphasis on this infrastructure of university techno logy transfer, venture
capital, law firms, consultants, and the like is somewhat different from treatments of
industrial districts, in the tradition of MARSHALL (1920). Economists and geographers
have long recognized the tendency for production to cohere geographically, whether it is
cars in Detroit, steel in the Ruhr, silk in Lyon, or filmmaking in Hollywood. Spatial
concentration confers advantages in terms of transportation costs, access to skilled labor
markets, communication networks, sophisticated customers, and access to technology
(SCOTT and STORPER, 1987; FLORIDA and KENNEY, 1988; ANGEL, 1991;
SAXENIAN, 1994; STORPER and SALAIS, 1997). Once these agglomeration
economies are established, a dynamic process of increasing returns attracts new entrant s,
further fueling the pace of innovation (ARTHUR, 1991; KRUGMAN, 1991).
Consequently, the geographic clustering of production is a global phenomenon.
(PORTER, 1998, provides numerous examples.)

6
Our emphasis is less on the process of economizing on the transaction costs of
founding a new firm, or the many attractions that draw entrepreneurs to a region. We are
interested in understanding why firms -- based on a fast-moving science that is
continually creating new opportunities -- are formed in particular locales. AUDRETSCH
and FELDMAN (1996:634) put the question aptly: “even after accounting for the
geographic concentration of the production location, why does the propensity for
innovative activity to cluster vary across industries?” The relevant scientific expertise in
biotech is, by now, broadly distributed throughout the industrial world, with major
centers of scientific excellence in the U.S., the U.K., Sweden, France, Germany, and
Switzerland. But the science is commercialized by firms in a significant manner (by
which we mean the ability to bring novel medicines to a global marketplace) in only a
handful of locations worldwide. To understand this phenomenon, we have to explain
why some regions are hubs for organizational creation, that is, populated, by
organizations, that are in the business of creating other organizations (STINCHCOMBE,
1965). Put differently, some regions are incubators and constitute an ecology for
organizational formation (BROWN, 2000). These regions have a rich mix of diverse
kinds of organizations (e.g., universities, law firms specializing in intellectual property,
public research institutes, consultants, and venture capitalists) that contribute in varying
ways to founding technology-based companies. The advantages of location, then, are
very much based on access and information. Increasing returns are present in the form of
overlapping networks, recombinant projects, personal and professional relationships, and
interpersonal trust and reputation, all of which are thickened over time. In such a milieu,
access to reliable information about new opportunities occurs through personal and
professional networks, and these ties are critical in reducing uncertainty about projects
that are not well understood by non-experts, exceedingly risky in terms of their payoff,
and unclear in terms of their eventual market impact.
Venture capital (VC), defined as “independent, professionally managed, dedicated
pools of capital that focus on equity or equity- linked investments in privately he ld, high
growth companies” (GOMPERS and LERNER, 2001: 146), is one of the key elements of
the infrastructure of innovation. The private equity market has become a major source of
7
financing for start-up firms, and has grown at an explosive rate: in 1979 venture firms
dispersed $500 million in funds, that amount climbed to well over $67 billion by 2000
(WRIGHT and ROBBIE, 1998; GOMPERS and LERNER, 2001). Both venture capital
firms and venture capital investing are highly concentrated regionally. For example, in
the third quarter of 2000, as the global slowdown in technology companies became more
pronounced, VCs still poured $8.7 billion into new companies located in Northern
California. This sum represented 33.7% of the total U.S. venture capital pie for tha t
period for all industries, according to Venture Economics, a firm that tracks VC investing
(SINTON, 2000). In 1999, a little more than one third of all venture capital
disbursements went to California (GOMPERS and LERNER, 2001).
A venture capital firm raises money from wealthy individuals, pension funds,
financial institutions, insurance companies, and other sources that are interested in
investing in technology-based startups, but lack the ability to do so. These investors
become limited partners in the VC fund, while the partners in the VC firm manage the
money by investing in and advising entrepreneurial startups. Venture capitalists finance
new firms with the potential for high growth in return for partial ownership. When the
young company is sufficiently developed, the firm goes public through an initial public
offering (IPO) or is acquired by another company. At this point the VC cashes in its
ownership stake, and reaps its rewards. Venture capital obviates the need to grow slowly
via self- financing, and fuels more rapid growth. As FREEMAN (1999) puts it, venture
capitalists buy time. The success of a VC firm in attracting money is contingent on its
past track record of spotting winners and generating rewards for its limited partners. The
business of identifying opportunities is highly uncertain and difficult. Of course, VCs
receive innumerable proposals for new businesses. But the rejection rate for these
proposals is extremely high (estimated by SAHLMAN, 1990, to be at 99%). As in many
other walks of life, many call but few are answered. More opportunities are identified
through active search by VCs. In part, this is because the expected payoff demanded from
VC backing is very high and the ratio of success to failures about 2 in 10 (BYGRAVE
and TIMMONS, 1992; GOMPERS and LERNER, 1999).
8
In the life sciences and other technology-based fields, venture firms provide more
than money. Because many of the founders of biotech firms are research scientists,
venture capitalists often do much more than monitor or advise; they may even play a
hands-on role in the running of the young company. Keeping scientists focused on key
commercial milestones is no small feat. A powerful tool for focusing their attention is
the “staging” of VC financing, thus the commitment of capital is contingent upon
“progress” (GOMPERS, 1995). VCs also routinely help in recruiting key staff and
important collaborators, and provide referrals to law and accounting firms, and eventually
to investment banks (FLORIDA and KENNEY, 1988). Many VCs serve on the boards of
directors of young firms they fund. As GILSON and BLACK (1998) put it, “by
providing both money and advice, the venture capitalist puts its money where its mouth
is.” Obviously, the roles of monitoring, advising, and managing are much more easily
accomplished when the young firm is located nearby. Experienced VCs have abundant
contacts and deep knowledge of particular industries; thus, referrals to relevant sources of
expertise are another important resource they provide. This social network is also more
readily tapped when firms are geographically proximate. Finally, there are real
advantages that accrue to firms and venture capitalists to being “on the scene” –
unplanned encounters at restaurants or coffee shops, opportunities to confer in the
grandstands during Little League baseball games or at soccer matches or news about a
seminar or presentation all happen routinely in such settings. The combined impact of
access to “news” and more effective monitoring help explain the pattern of VC
clustering.
With all these advantages of geographic propinquity, it might seem unlikely that
more distant relations occur at all. There are, to be sure, several ways that VCs overcome
some of the liabilities of distance. Both the creation of branch offices and involvement in
VC syndicates are means to counter the challenges of more distant relations
(SORENSEN and STUART, 2001). Increased size and greater experience could also
provide VC firms with the capability to support more distant firms. VC firms may follow
different approaches when they are investing their own money versus that of limited
partners, or when they join another VC’s fund as a member of a syndicate. In addition,
9
the pace of advancement of new industries and the mix of firms within them may offer
new opportunities for investment. For example, VCs may perform a different role with
an early-stage company than in a firm that has already undergone its first round of
financing and shown evidence that its technology can be brought to market. We turn now
to a discussion of the factors that shape the proclivity of biotech-VC relations to occur on
a local or more distant basis.
Explaining Center and Periphery
The literature on knowledge spillovers provides useful leads on both how and
when geographic localization matters.2 One insight is that the importance of propinquity
can decline over time. JAFFE et al (1993) report that patent citations to other patents
(excluding within-organization citations) are five to ten times more likely to occur within
the same city. This pattern of localization is most pronounced in the first year following
a patent’s issue, and subsequently declines. In a parallel vein, they also found that
patents in such fast-developing fields as optics and nuclear technology have high initial
citation rates that fade rapidly. ALMEIDA and KOGUT (1997) report similar results for
patenting activity in the semiconductor industry, with high rates of local citations that
subside over time.
The joint effects of technological evolution and the stages in a firm’s life cycle are
not easily disentangled, however. Two excellent studies of biotechnology point out this
difficulty. ZUCKER et al (1998) show that the founding of new biotechnology firms in
the 1970s and 1980s occurred in those regions rich in the relevant intellectual capital, and
that “star” scientists had a direct role in this process as founders and advisors.
AUDRETSCH and STEPHAN (1996) examine a sample of biotech firms at the time of
their initial public offerings in the early 1990s and analyze the geographic location of
founders and members of scientific advisory boards. They find considerable geographic
reach in the composition of advisory boards, but somewhat closer linkages when
scientists are involved as founders. This comparison raises two questions: 1.) Is the
contrast between the studies a consequence of differences in roles, i.e., an advisory role
10
involves less direct engagement and can be accomplished from a distance, while a
founder’s role entails more hands-on involvement, requiring the proximity of a scientist’s
firm and laboratory? 2.) Do the different findings reflect distinct stages in the
development of a company, with founding a time when new ideas are being explored
among a select few, and the IPO stage a point when patent rights for these ideas have
been secured and the firm is ready to reveal to the public a good deal of information
about itself in order to obtain funds? An additional complication is that not only are the
firms under study at different stages in their life cycle, the industry and the nature of
technological progress were at different points in their development.
To pursue the latter issue, regarding distinctive stages in organizational, industry,
and technological life cycles, we explore whether biotech firms and venture capital
funders are more likely to be co-located when the biotechs are younger and/or smaller. If
biotech firms are able to wait until they are older and/or larger before securing venture
support, they may well be able to choose from a broader set of financial backers. We
also explore the other side of this coin, recognizing that just as biotech firms search for
private equity, venture capitalists look for new technologies to bankroll. Thus, we ask,
under what circumstances do venture firms look outside their local environments?
There is an unexplored finding in the Audretsch and Stephan study that intrigues
us, suggesting that the relevant actors in different locales have different “propensities” to
either search locally or at a distance. University scientists in Boston, the Bay Area, and
San Diego that served on biotech advisory boards were very likely to do so locally, while
scientists in New York, Los Angeles, Maryland, and Houston served on the boards of
more distant companies. Such variation in search behavior may reflect differences in
access to contacts or different resource endowments. These are issues at the heart of
research on interorganizational exchange. One strand of analysis emphasizes that
interorganizational ties are strongly influenced by social structure, with previous
exchanges shaping subsequent ties (GRANOVETTER, 1985; GULATI, 1995).
Organizations privileged by prior access obtain better rates of financing (UZZI, 1999)
and overcome liabilities of newness more easily (BAUM and OLIVER, 1991). When
11
organizations share a common prior partner, they find it easier to engage in exchange
(GULATI and GARGIULO, 1999). And, when there is uncertainty about the merits of
an activity, as is often the case with new and unproven technologies, previous affiliations
can serve as a proxy for quality (PODOLNY, 1994). Not surprisingly, startup companies
go to considerable lengths to advertise the backing of elite venture firms to attract
employees and collaborators. In short, social relationships are essential to the process of
garnering resources to found new organizations.
But can affiliations compensate for less expertise or capability? Alternatively,
can organizations that are pursuing excellent science, but located away from key centers
of activity and lacking access to well-connected parties, find much-needed support?
Clearly, centrality in networks and expertise are self-reinforcing (STUART, 1998). But
at what point are there diminishing returns to network centrality or local connectivity?
We examine these issues about the dynamics of center and periphery by addressing the
following empirical questions: 1.) To what extent are biotech firms and VC firms co-
located? 2.) How extensive is the phenomenon of regional co- location, such that biotechs
receive support from local VCs and VCs finance local biotechs? 3.) What is the
relationship between location of funding and characteristics of both biotechs and VCs in
terms of age, size, and centrality in the network? 4.) How do the above patterns and
relationships change over time?
Data Sources
Our starting point in gathering data on biotech companies is BioScan, an
independent industry directory founded in 1988 and published six times a year, that
covers a wide range of organizations in the life sciences field.3 We sample companies
that are independently operated, profit-seeking entities involved in human therapeutic and
diagnostic applications of biotechnology. Our focus is on dedicated human biotech firms.
Both privately-held and publicly-traded firms are included in the sample. Companies
involved in veterinary and agricultural biotech, both of which draw on different scientific
capabilities and operate in a much different regulatory climate, are omitted. We do not

12
include large pharmaceutical corporations, health care companies, hospitals, universities,
or research institutes in our primary database; these participants enter the database as
partners that collaborate with dedicated biotech firms. Companies that are wholly-owned
subsidiaries of other firms are excluded. We do, however, include publicly-held biotech
firms that have minority or majority investments in them by other firms, as long as the
company’s stock continues to be independently traded on the market. Our rationale for
excluding both small subsidiaries and large, diversified chemical, medical, or
pharmaceutical corporations in the primary data base is that the former do not make
decisions autonomously, while biotechnology may represent only a minority of the
activities of the latter. Both circumstances generate serious data ambiguities.
The sample covers 482 firms over the 12-year period, 1988-99. In 1988, there
were 253 firms meeting our sample criteria. During the next twelve years, 229 firms
were founded and entered the database; 91 (of the 482) exited due to failure, departure
from the industry, or merger. The database, like the industry, is heavily centered in the
U.S., although in recent years there has been expansion in Europe. In 1999, eighty
percent of the companies in our sample were located in the U.S. and ten percent in
Europe. For the purposes of this paper, we limit the sample to U.S.- based companies
because of the ease of using U.S. zip codes as a means to determine geographic location.
During the period 1988-99, 213 U.S. biotech firms received funds from venture capital
companies.
The reference source BioScan reports information on a firm’s ownership, formal
contractual linkages to collaborators, products and current research. In addition, detailed
information is provided on a company’s financial history, and we drew from this source
data on venture capital investments in specific biotech companies. We also utilize data
on the founding date and employment levels of biotech companies. Our database draws
on BioScan’s April issue, in which new information is added for each calendar year.
For information on venture capital forms, we consulted Pratt’s Guide to Venture
Capital Sources, a reference guide to U.S. and non-U.S. VC firms. The guide was first
13
published in 1970, followed by new editions in 1972, 1974, and 1977. Since the fifth
edition, it has been updated annually, based on information provided by the VC firms. In
addition to information on the location of home and branch offices, key staff, and
founding dates, the guide covers VC firms’ preferences in terms of their preferred role in
financing, the type of financing they provide, and whether they have geographic or
industry preferences. The guide also reports the amount of capital the VC firm manages,
and whether the firm primarily invests money raised from limited partners or its own
money. The 1999 edition reports that “the VC firms included have been selected because
they are devoted primarily to venture financing,” and it goes on to remark on the
expansion of VC-type activity by a wide range of different organizations: “today, venture
investment activity covers a spectrum of interests that encompasses all phases of business
growth.” Pratt’s Guide adopts a more restrictive definition of venture capital investors
than does BioScan, which groups angel investors, pension funds, and university
technology offices under the category of investors. We utilized the Pratt’s definition
because we want to focus on those companies that are most oriented towards high-risk,
high- involvement, early-stage investment in entrepreneurial startup firms.
There are 208 venture firms that finance the biotechs in our sample. They vary in
size from small firms such as Allergan Capital of Irvine, California, with one office and
$1 million under management, to much larger firms like Boston’s Advent International,
with 16 worldwide offices managing $4 billion. The sample of VCs includes the Silicon
Valley household name Kleiner, Perkins, Caufield, and Byers, as well as smaller, less-
known firms such as Hook Partners of Dallas, Texas. In addition, we include the venture
capital arms of more traditional financial institutions, such as NationsBank and J.P.
Morgan. The oldest firm in the sample is Scotland’s Standard Life Investments, founded
in 1825; in 1999, nine new firms entered the database.
Methods
Our objectives are to establish the co- location of biotech firms and VCs, to
explore how geographical agglomeration influences whether VC financing of biotech
14
firms is done locally or nonlocally, and to demonstrate the relationship between the
locality of capital and characteristics of both the biotech firms and VCs. We use
descriptive statistics to accomplish these objectives, comparing both VCs and the
biotechs they fund based on their location, stage of development, and the nature of the
funding relationships.
To identify location, we use postal zip codes for U.S. firms and telephone country
prefixes for those VCs located outside the U.S. Using these codes, we examined
frequencies of firms and VCs by location, identifying nine areas with significant
agglomeration of either VC or biotech firms. These nine agglomeration clusters include:
1)Boston, 2)the NYC tri-state region, including parts of New Jersey and Connecticut,
3)Philadelphia, 4)the District of Columbia region, including part of Maryland proximate
to the NIH, 5)Chicago, 6)Houston, 7)San Diego, 8)the San Francisco bay area, including
Berkeley, Oakland and Silicon Valley, and 9)Seattle. Each biotech firm and VC was
then assigned a cluster code equal to the agglomeration region it was in, if any, or “0” if
the firm or VC was located elsewhere. For each biotech-VC dyad, we define the
funding as local if the firm and VC are within a one-hour drive of one another (by
automobile, using Yahoo’s estimated driving time between zip codes).
Each biotech firm is then placed into one of three mutually exclusive categories
based on whether it is only involved in dyads with local VCs, only involved in dyads
with nonlocal VCs, or involved in dyads with both local and nonlocal VCs. We do this
separately for when the biotech firm is at two distinct stages of development, before and
after its initial public offering (IPO). For each biotech firm, we also measure a number
of firm attributes, including its age, experience in the industry’s inter-organizational
network (connecting biotech with universities, government agencies, financiers, nonprofit
labs, and large pharmaceutical and chemical corporations), number of employees, time
from founding to IPO, time from its first network tie to IPO, number of VC partners,
number of other partners (besides VC), and centrality in four inter-organizational
networks: R&D, finance, licensing, and commercialization.
15
Each VC firm is also placed into one of the three exclusive categories based on
whether it only funds local biotech firms, only funds nonlocal biotech firms, or funds
both local and nonlocal biotech firms. We do this assignment separately for funded
biotech firms that are pre and post-IPO. For each VC, we also have measures of age,
number of offices, capitalization, and whether it is primarily investing its founders’ own
money or other investors’ money.
Results
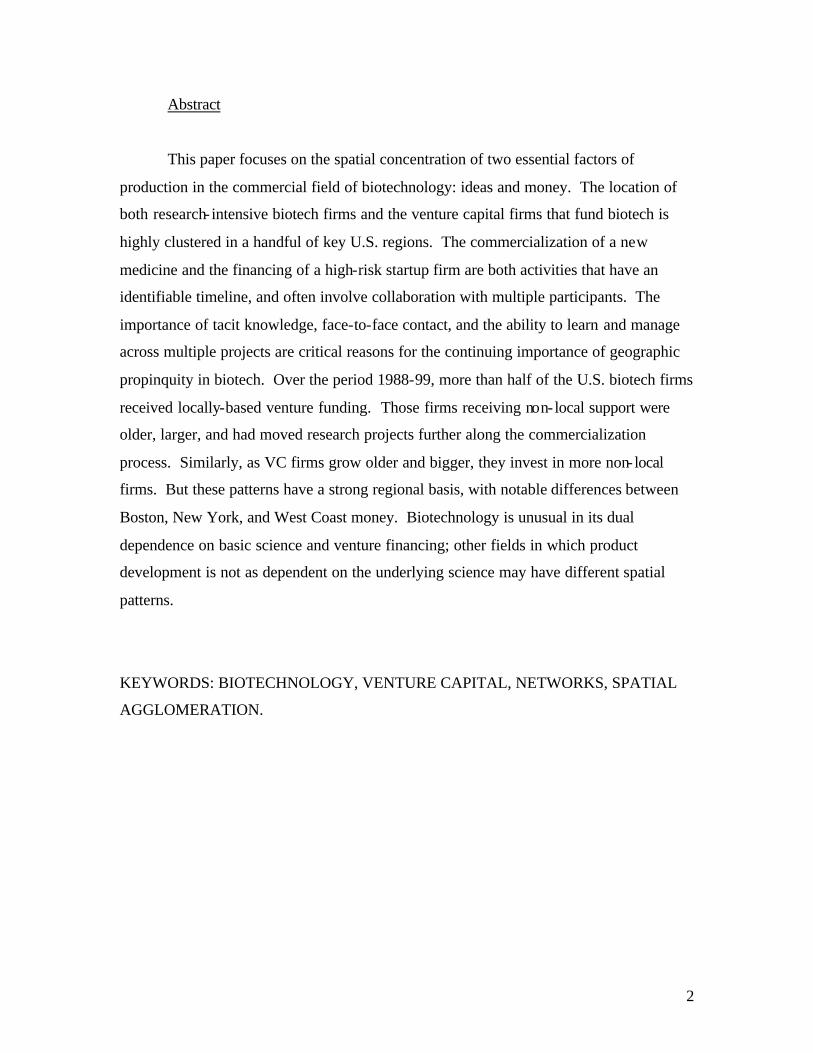
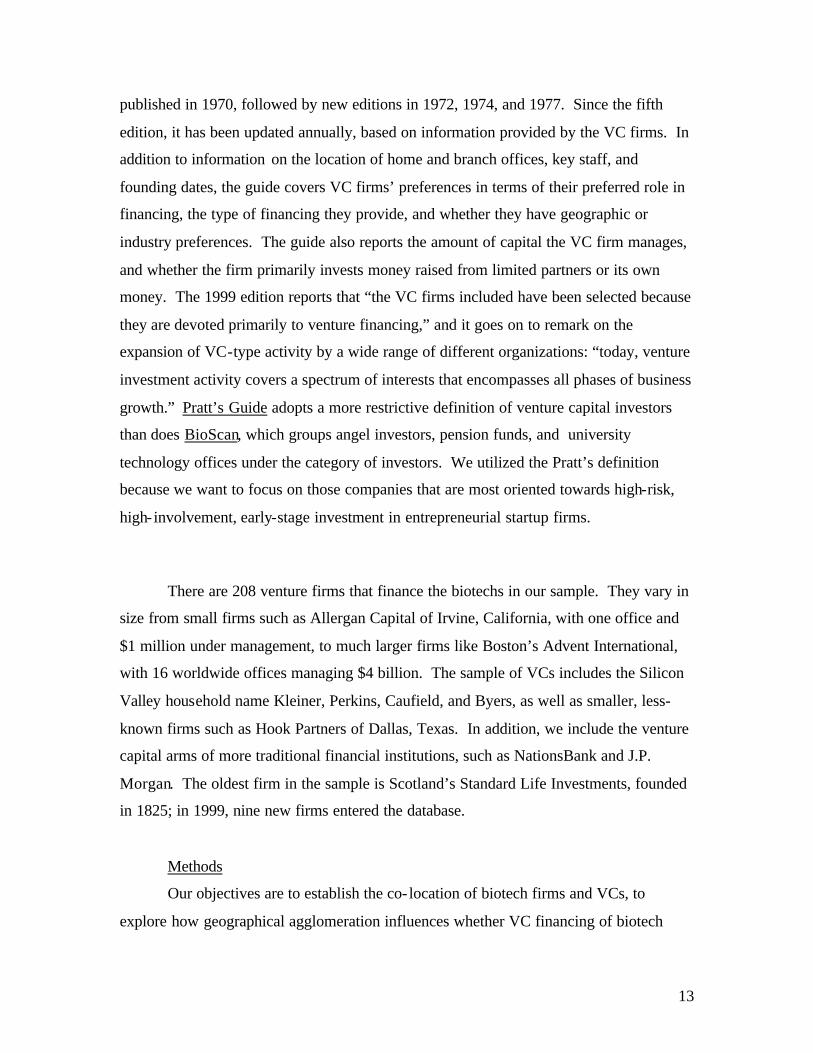
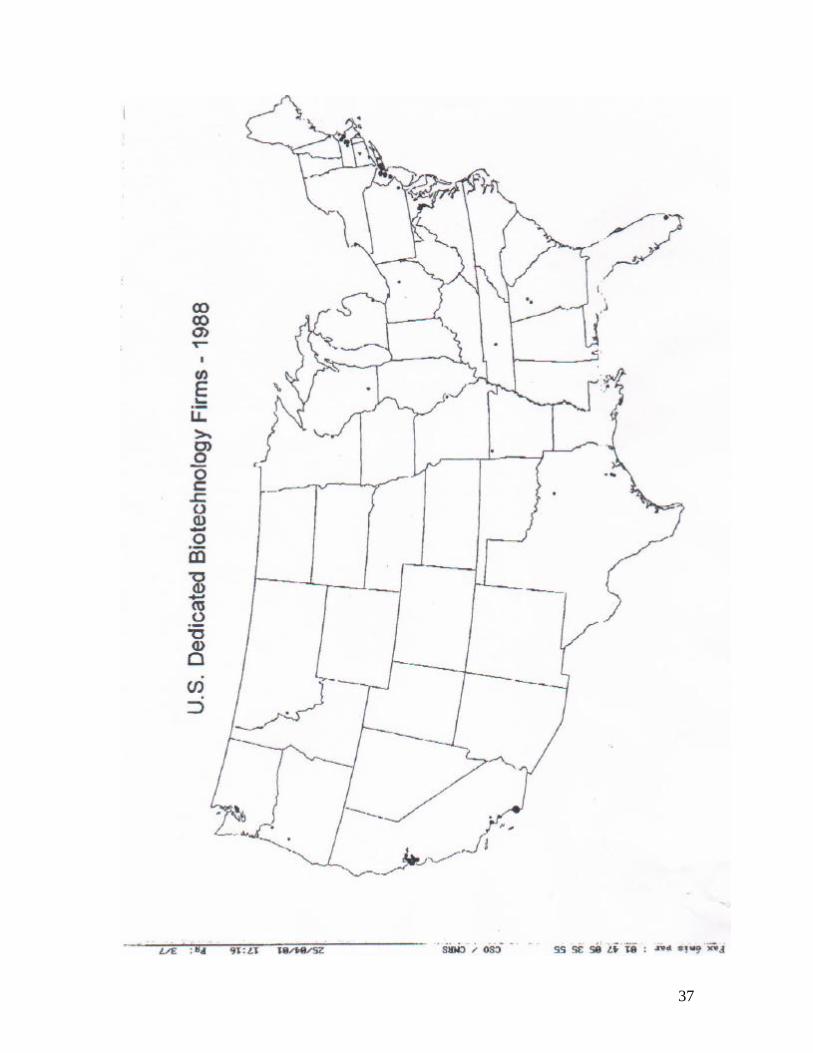
We begin with a graphic presentation of the location of our samples of biotech
and VC firms. Our biotech database starts with the year 1988. The oldest firm in our
sample at that point is a Northern California company, Alza, founded in 1968. The first
biotechnology firm to go public was Genentech in 1980. So figure 1, which shows the
location of firms by zip code, is a map of the industry in its adolescent stage. The larger
the dots, the more firms located in that zip code. These maps are simple counts of the
number of firms in an area, and not selected for firm size or market value. There is a
strong pattern of spatial clustering, with the Bay Area, the greater Boston area, and San
Diego County as the three largest hubs, and smaller centers in the New York
metropolitan area (including the tri-state area of Northern New Jersey, western
Connecticut, and the suburbs of New York City) and the area around the National
Institutes of Health in Rockville, Maryland.
(Figure 1 goes here)
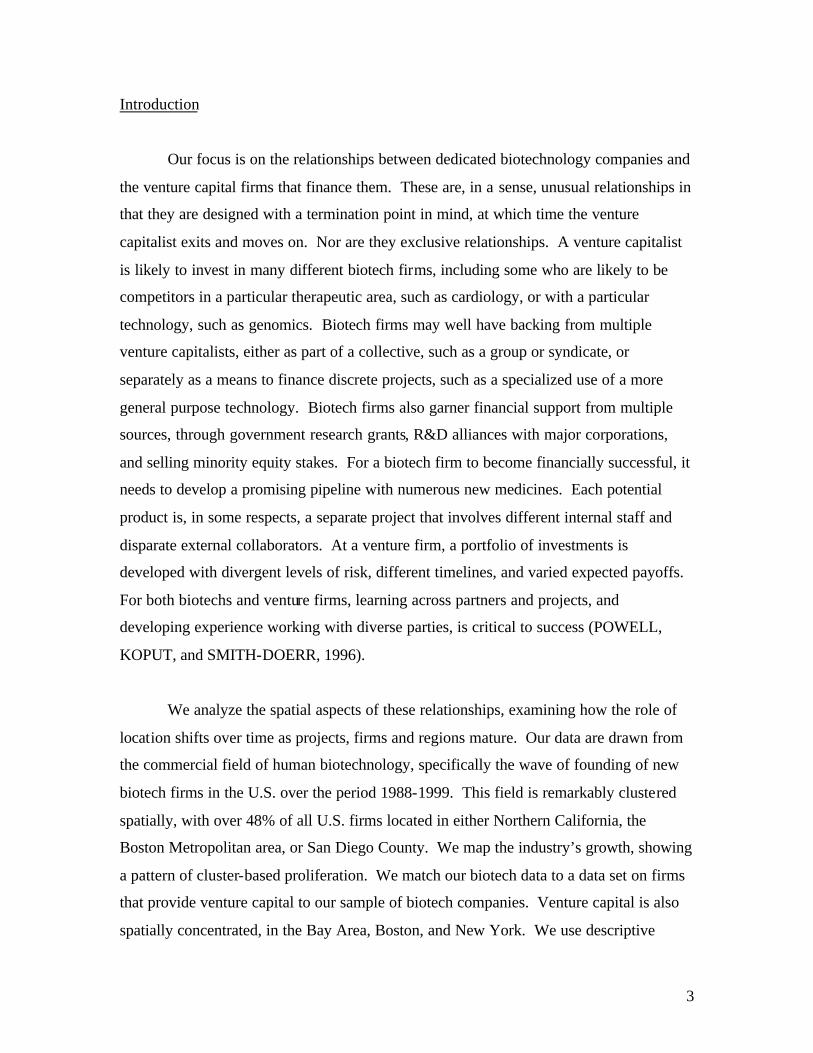
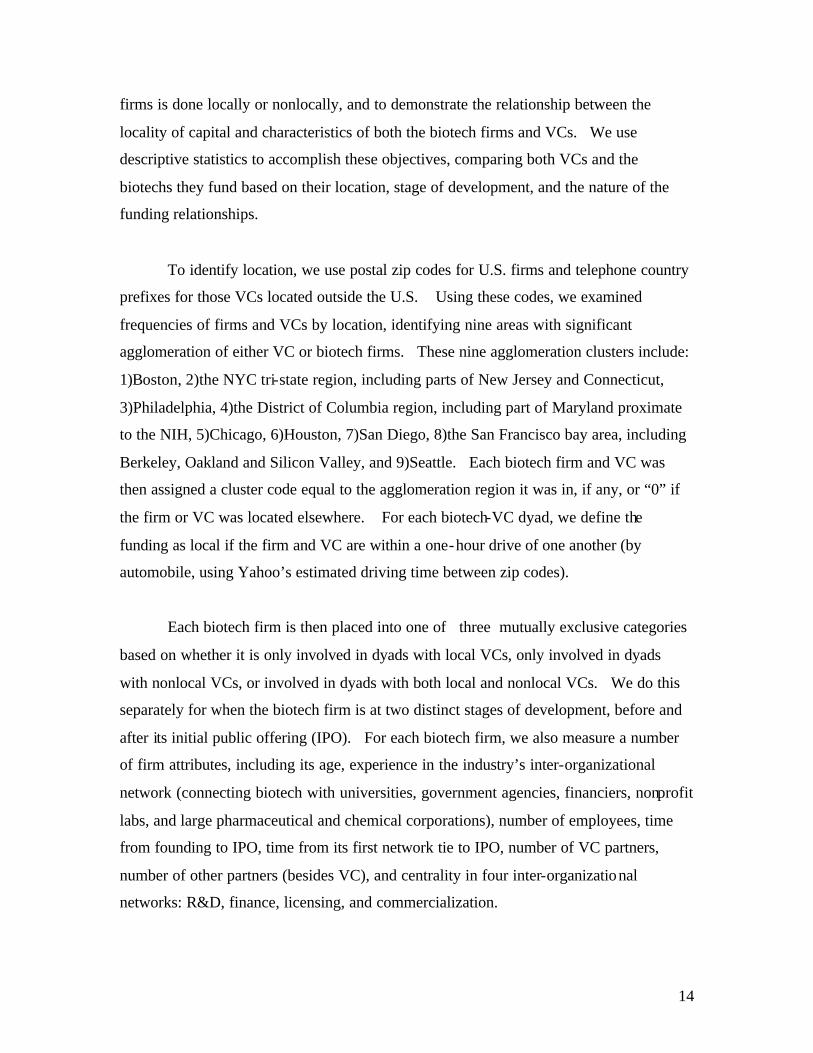
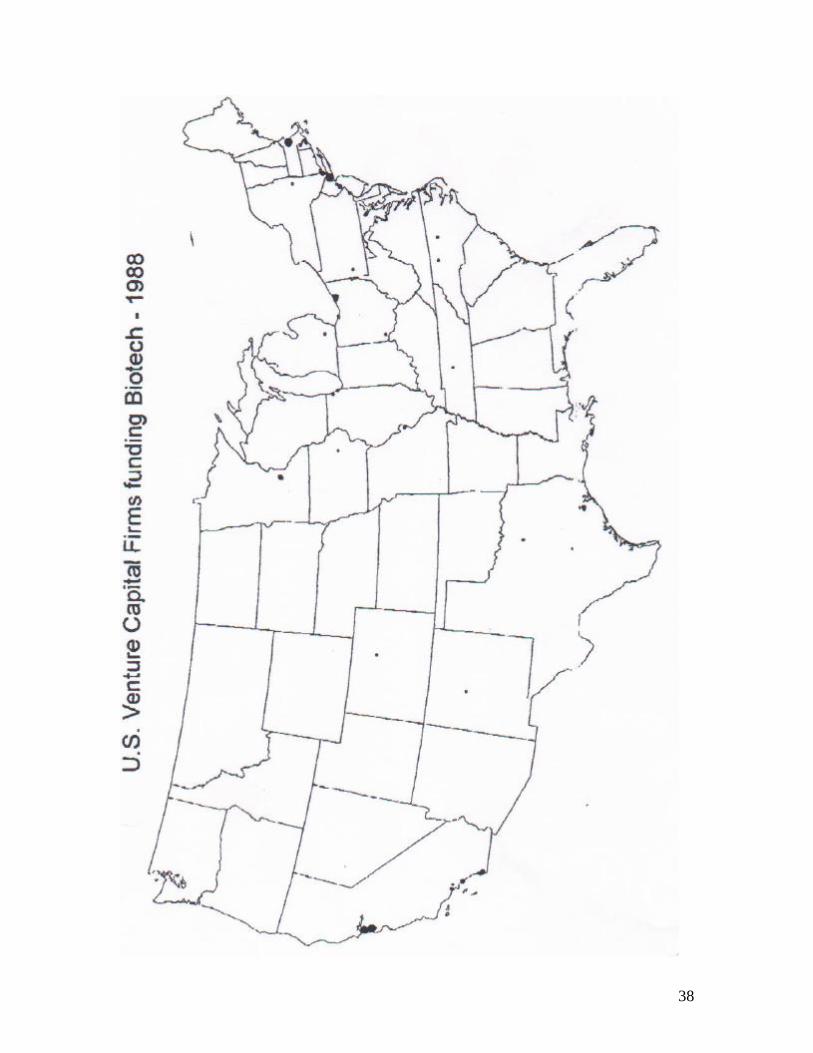
The map of venture capital firms that invest in biotech, presented in figure 2, also
shows regional concentration, but with some notable geographic differences. Again the
Bay Area and Boston are the two dominant areas, with Menlo Park, CA far and away the
most active location of all. But New York is third and San Diego’s position much
smaller, a reversal of their roles in the biotech world, reflecting New York’s preeminence
as a financial center. Several other areas are significant with respect to venture capital –
16
Cleveland, Los Angeles, Minneapolis, and Chicago, but these are areas with scant biotech
activity. And in 1988, there are areas with some biotech firms -- such as Seattle,
Philadelphia, Madison, WI, Atlanta, Miami, FL - - with no local venture capital presence.
(Figure 2 goes here.)
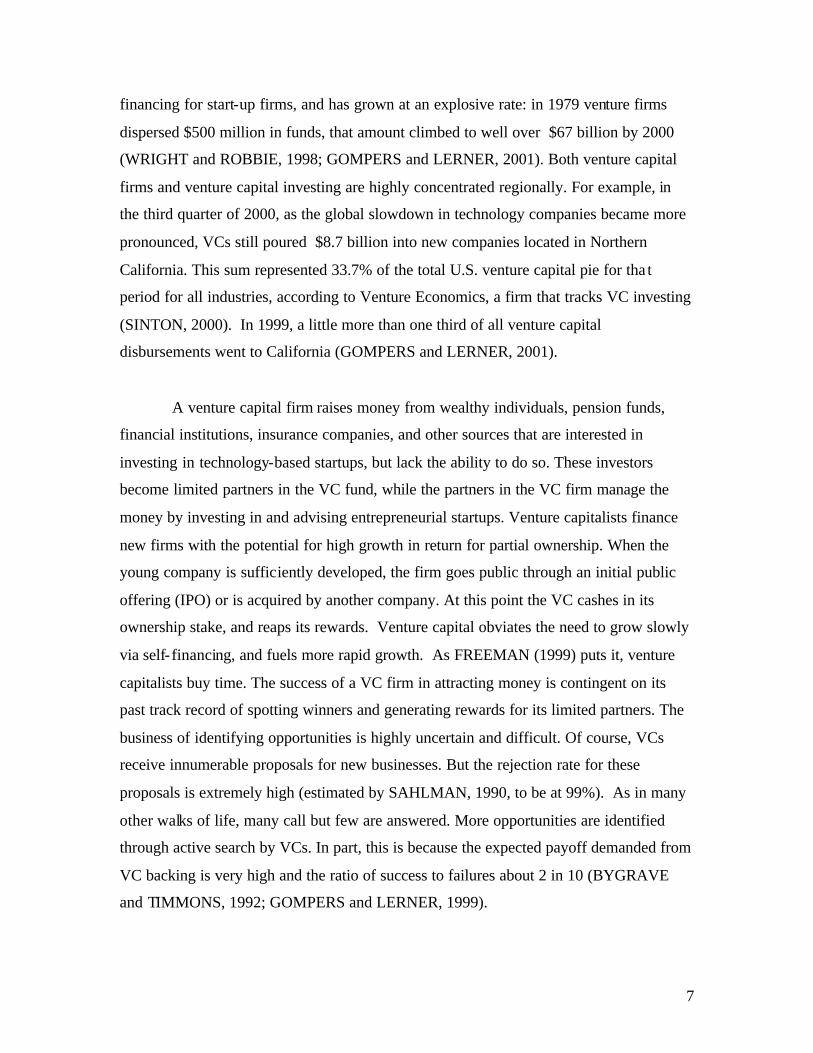
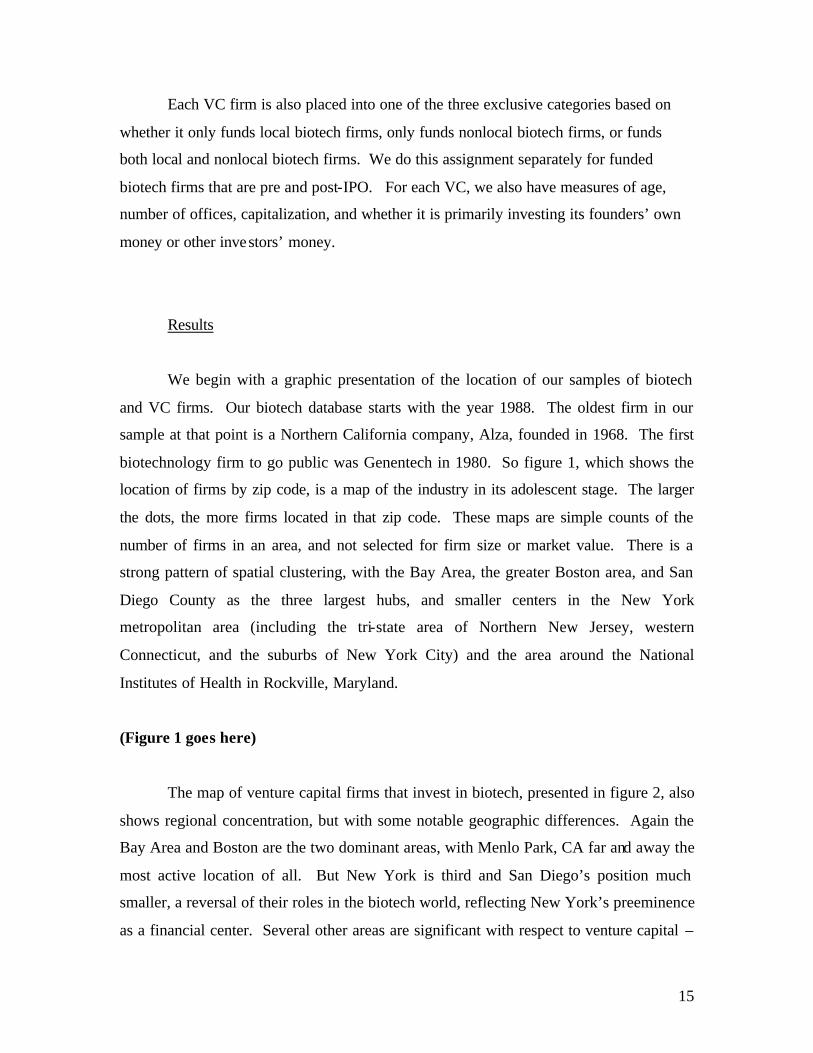
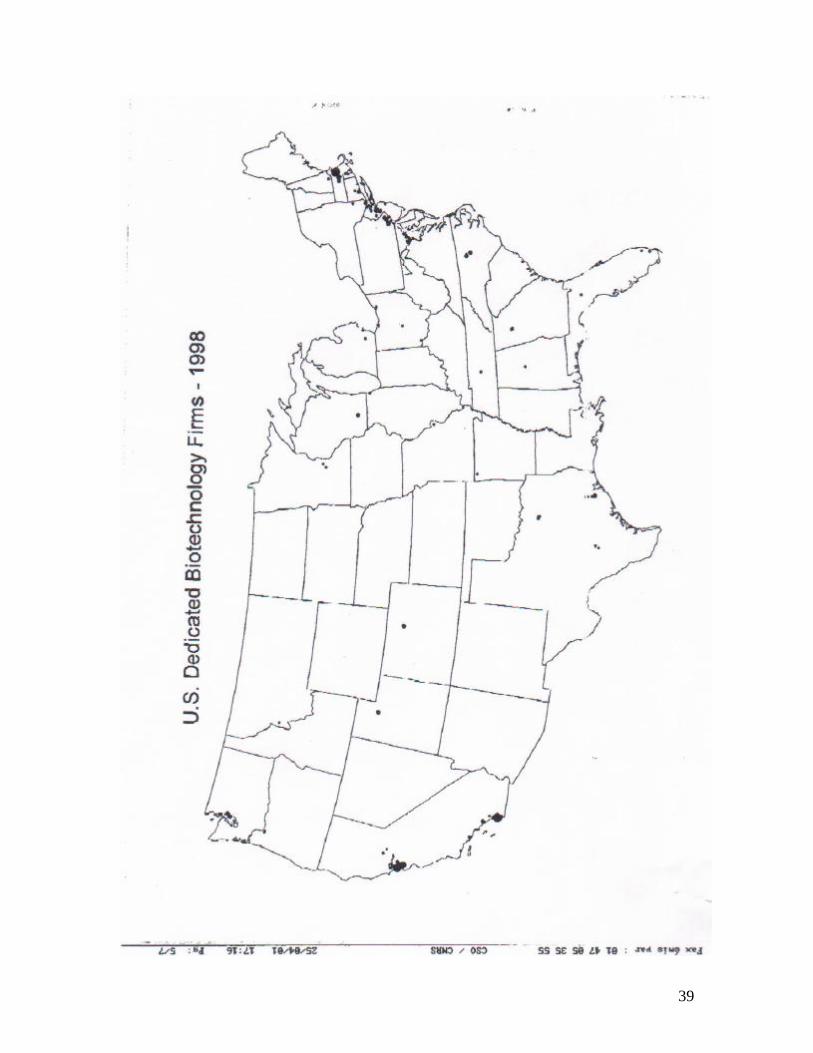
Fast forward to 1998 and you can see the growth of the biotech industry,
accompanied by only modest geographic expansion. The growth is pronounced in
Boston, where newspaper accounts now routinely cheer its advance on the Bay Area as
the most active locale for biotech. 4 The Bay Area and San Diego grow rapidly as well,
but so does the Philadelphia area, the Washington-Baltimore corridor, Northern New
Jersey, and the Research Triangle of North Carolina on the east coast, and the Houston
area in Texas. Further west, Boulder, CO, Salt Lake City, Utah, and especially Seattle
emerge as smaller hubs. But the overall pattern is one of cluster-based growth. As the
number of biotech firms in our sample climbs by 146, the percentage of U.S. companies
located outside the main regional clusters remains steady at approximately 28%.
(Figure 3 goes here.)
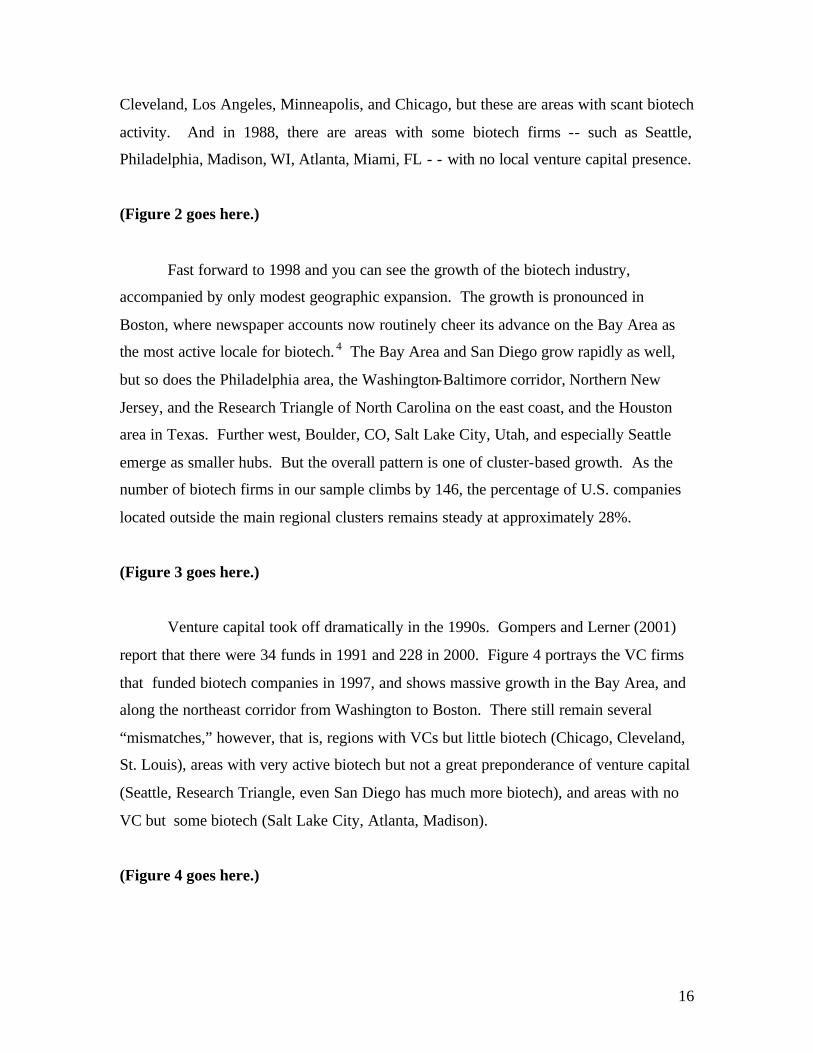
Venture capital took off dramatically in the 1990s. Gompers and Lerner (2001)
report that there were 34 funds in 1991 and 228 in 2000. Figure 4 portrays the VC firms
that funded biotech companies in 1997, and shows massive growth in the Bay Area, and
along the northeast corridor from Washington to Boston. There still remain several
“mismatches,” however, that is, regions with VCs but little biotech (Chicago, Cleveland,
St. Louis), areas with very active biotech but not a great preponderance of venture capital
(Seattle, Research Triangle, even San Diego has much more biotech), and areas with no
VC but some biotech (Salt Lake City, Atlanta, Madison).
(Figure 4 goes here.)
17
The maps presented above help frame our presentation of the findings. There are a
handful of locales abundant in firms and venture capital, and three of these regions have
flourished with this propitious situation for much longer than a decade. Other regional
centers do not enjoy a comparably rich co- location of capital and science. Many parts of
the United States have only one endowment – money or firms – but not both. Clearly
both VCs and biofirms in such circumstances need to hunt externally for partners. At the
same time, the most active areas are likely to be magnets for outside investors, while
firms seek support wherever capital is available. We turn now to an examination of the
biotech-venture capital relationships that result from the simultaneous searching of
biotechs for funds and VCs for opportunities.
For the entire time period, 213 biotech firms have relationships with VCs that
meet Pratt’s criteria. The number of biotech firms financed by VCs grows, almost
monotonically, from 27 in 1988 to 118 in 1999, with a dip in 1997. Of these firms, 54%
of the biotech firms received local VC support at some point. This figure varies by
location and over time. Among biotech firms located in a cluster, 58% have funding
from a local VC at some point, compared to only 48% for firms outside of any single
cluster. The percentage of VC-backed biotechs with local funding ranges over time from
33% in 1988 to over 62% in the mid 1990s, before settling back to 48% in 1999.
On the VC side, 208 VCs provide funds to our subsample of U.S.-based biotech
firms, with 50% of those VCs funding biotechs that are local. This percentage is slightly
higher when VCs are funding post-IPO (52%), is higher for VCs located in one of the
clusters (54%), and rises significantly over our period of observation, starting at just 30%
in 1988.
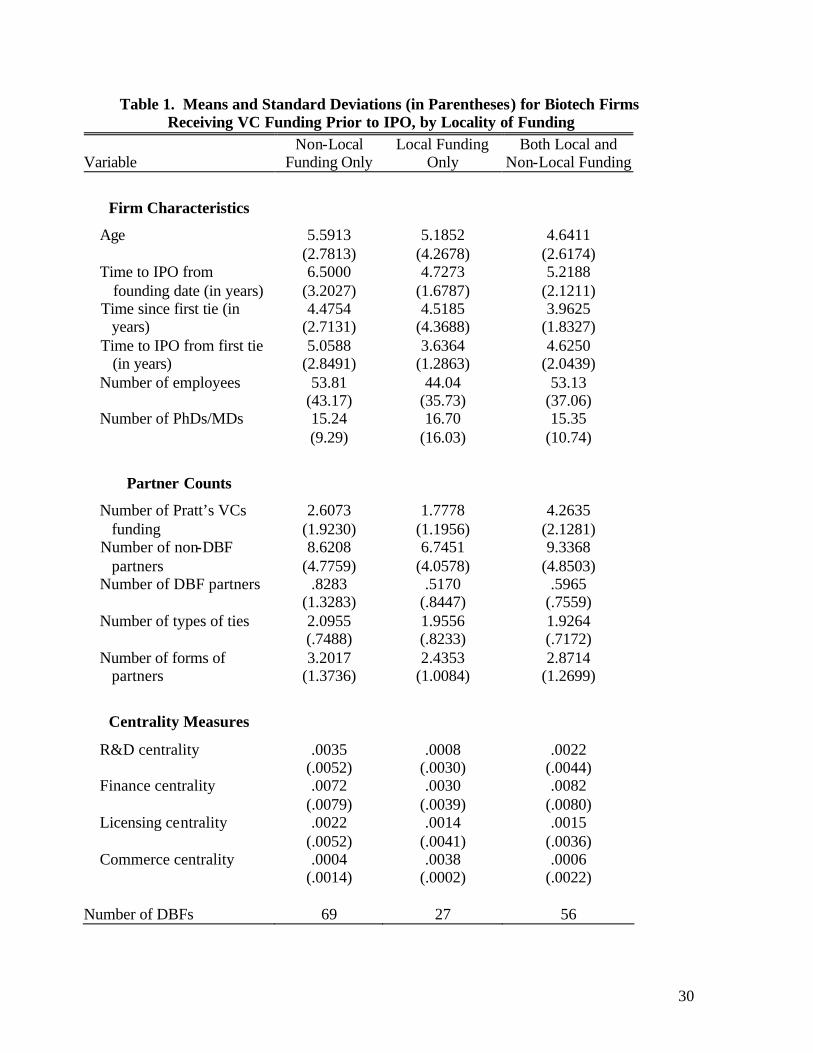
We now examine features of biotech firms that receive funding from VCs,
treating firms that are pre- and post- IPO separately. Table 1 presents data on biotech
firms with support from venture capital in advance of going public. We group the results
into three categories: companies with non- local VC support only (of which there are 69),
companies with just local support (27 in total), and companies with both local and non-
local backing (56). We compare firms with these three kinds of funding arrangements in
terms of their size, age, number of scientific staff, and a host of measures that capture
varying forms of connectivity within the industry. Those companies that secure only
18
non- local finance are, on average, larger, older, and have a larger number of
collaborations with diverse types of organizations, suggesting that these collaborations
may be both a signal to attract VC support and/or a vehicle for obtaining other kinds of
resources in advance of securing VC backing. Most notably, firms with “outside” VC
financing take the longest time to go public – 6.5 years.
Those firms at the pre-IPO stage with only local VC backing have a different
profile. These are the smallest of the three types in terms of number of employees, but
have the largest percentage of staff with Ph.D.s and/or MDs. These biotech firms go
public rapidly, on average in 4.7 years. They also have much more exclusive relations
with venture firms, having 1.78 funders, compared to 2.6 for the non-local biotechs and
4.3 for those with both local and outside financing. The latter group apparently are high-
profile companies. Not only do they attract both sources of funds, they are the youngest
as well, only 4.6 years on average. The locally-backed firms have a strong scientific
profile, suggesting a research orientation and a need for management assistance and
oversight that is best provided by local VCs. The more exclusive ties to one or two VCs
also suggests the VCs are more involved in the managing of the firm.
(Table 1 goes here.)
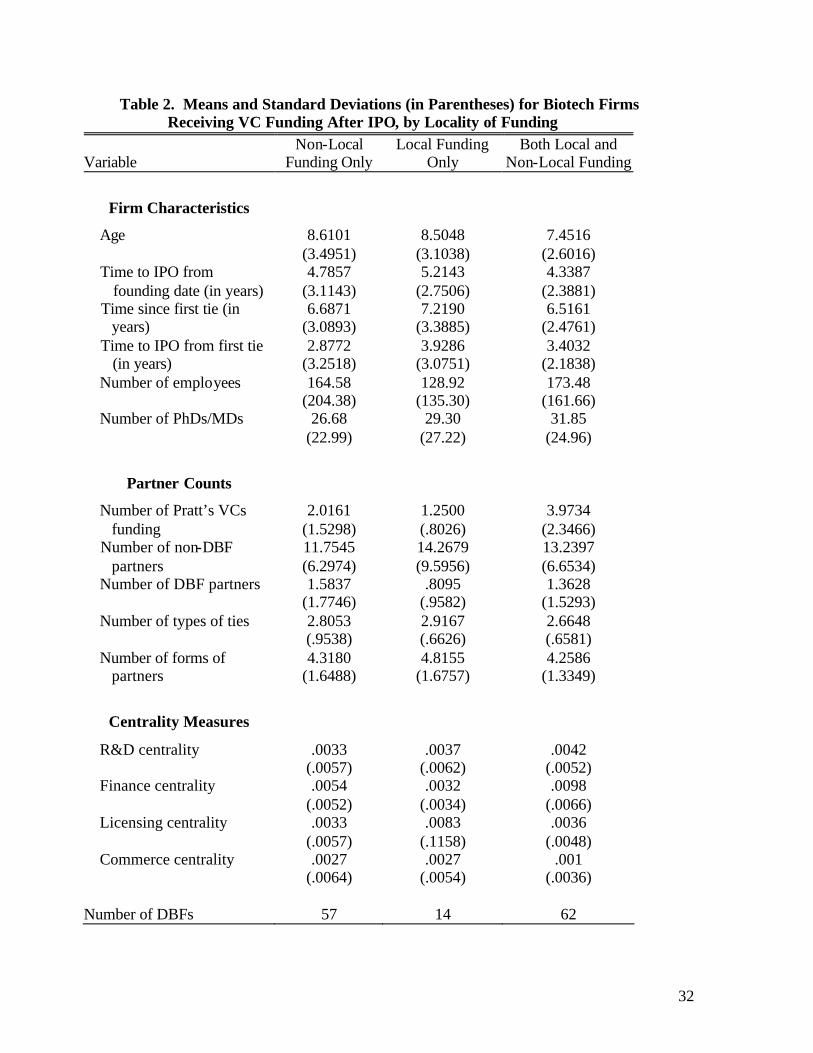
Turning to companies at the post-IPO stage, there are 57 with external VC links,
14 with only local support, and 62 with both sources. Not surprisingly, these post-IPO
firms are considerably larger, as one would expect from companies that are older with
more financial security. But again those with only local funding are notably smaller, and
with a higher percentage of staff with advanced science degrees. The local-only firms
had much more exclusive relations ties to VCs, with 1.2, while those with both sources
had nearly 4 VC funders.
(Table 2 goes here.)
19
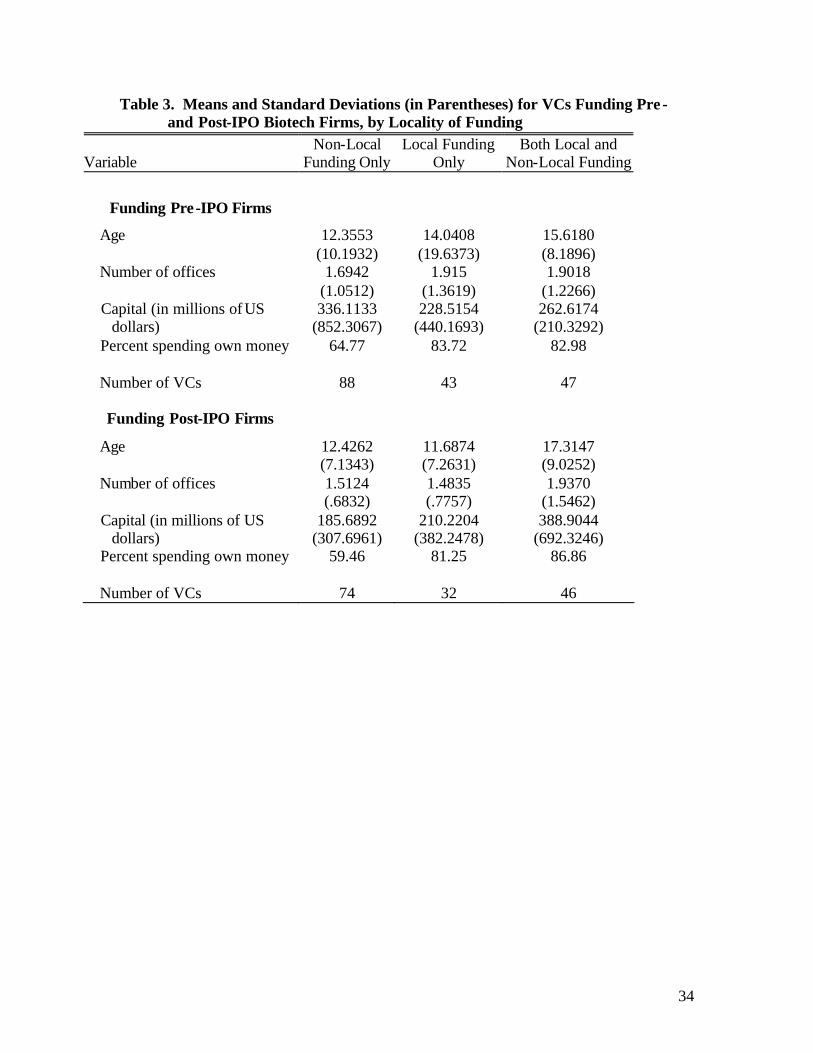
Of the 208 VCs that fund biotech firms, 178 of them finance biotech firms before
their IPO, while 152 provide funding for subsequent rounds of financing to publicly held
firms. Obviously, most VCs do both kinds of disbursements. The features of the VCs
vary with both locality and the pre vs post IPO distinction. When backing is provided
prior to the biotech firm’s IPO, the VCs funding locally are about 2 years older (14 vs 12)
and larger in terms of offices (1.9 vs. 1.7), but have less capital (229M vs 336M), and are
more likely to spend their own money (84% vs 65%) when compared to VCs that fund
nonlocal biotechs. When the support comes after the biotech firm’s IPO, the story is
more complicated. Those firms that provide backing exclusively locally or exclusively
nonlocally are about the same size (1.5 offices), age (roughly 12 years), and
capitalization, but those going local only are more likely to be spending their own money
(81% vs 60%). Those VCs that support publicly held firms both locally and nonlocally
are much older (17.3 years), larger (2 offices), more capitalized (388M) and are even
more likely to be spending their own money (87%). Thus, older, more experienced
venture capital firms, that have the benefits of being located in technology-rich locations,
are able to be more flexible as to where they invest. In addition, a strong persistent
finding is that when the VCs invest their own money, their disbursements are very likely
to be made locally.
(Table 3 goes here.)
We also checked to see what the relationship was between the age of VCs and the
age of biotechs at the time of their IPOs. One speculation is that younger VCs bring
companies public earlier than older firms in order to build a reputation and raise needed
funds (GOMPERS, 1996). In our sample, in contrast, there was a negative relation
between VC age and the age of the biotech firm at IPO. This relationship was driven by
experienced, older VCs in the Bay Area and San Diego that funded local younger firms
and East Coast VCs that manage funds with both local and non- local younger biotechs.
In sum, the gains from experience for older VCs include both the capacity to oversee
younger firms as well as more geographically distant firms. For the venture capital firms,
then, there is a recursive relationship: as the biotech industry matures, the significance of
20
geographic proximity declines somewhat as extra- local ties are developed. On the other
hand, as VC firms mature and become more experienced, their willingness and ability to
work with high-risk local startups increases.
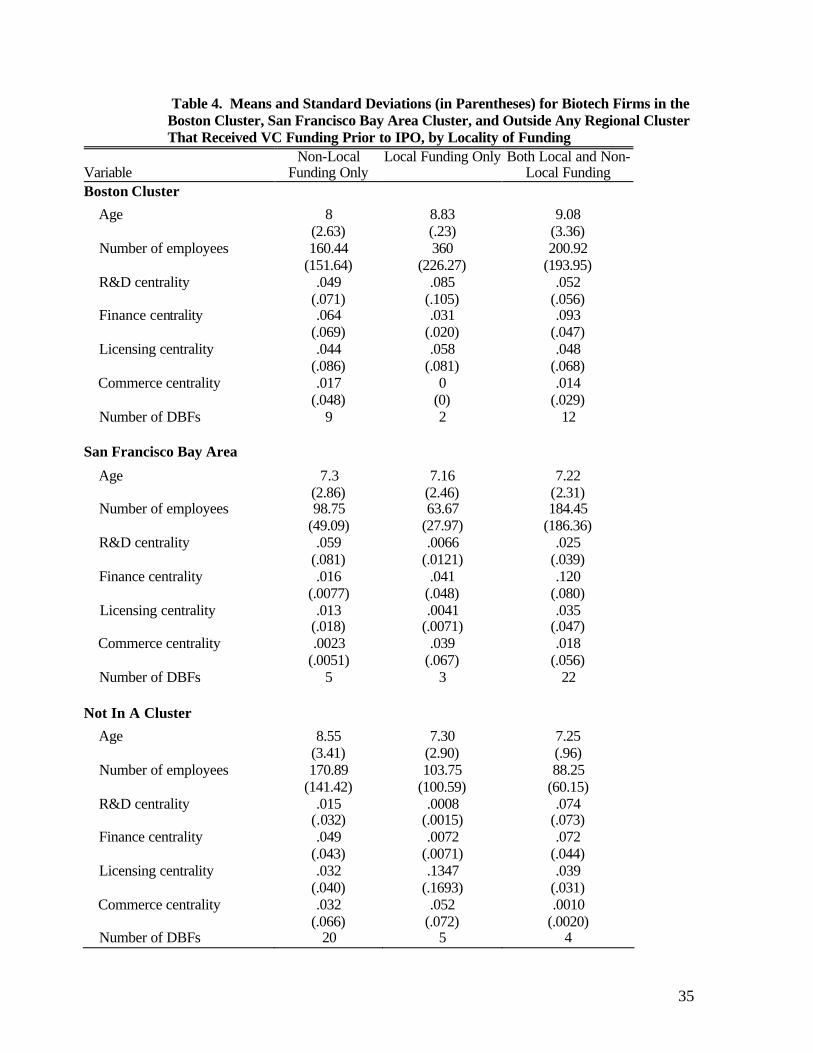
One of the particularities of venture capital is that it arose and grew in different
places at different times. Consequently, there may be distinct patterns of financing based
on location. To examine this, we collapse the regions into three areas--the Bay Area,
Boston, and the rest of the country. Between the Bay Area and Boston, over half of the
"action" occurs, so this tripartite division is sensible. Looking first across the twelve year
period, there are some discernable patterns. With respect to companies that only receive
local support, venture firms in the Bay Area tend to fund smaller, younger companies,
that have collaborations underway to commercialize new products. In Boston, local only
funding goes to larger and older biotechs, who are more involved in R&D collaborations
and licensing agreements. Outside these two main centers, local VC funding goes more
to medium-sized companies. With regards to funding that originates outside the "home"
region, the biotech recipients within Boston cluster are the younger and smaller biotechs,
while in the Bay Area cluster these firms tend to be older. In the rest of the country,
outside support flows to older and larger companies. Finally, the firms that receive
financing both locally and from the outside are older in both Boston and the Bay Area.
But, firms receiving both types of financing that are located elsewhere in the U.S. are
among the youngest, smallest, and best connected into the world of R&D. Clearly, the
threshold for receiving both types of financing is higher for companies located outside
the Bay Area or Boston.
(Table 4 goes here.)
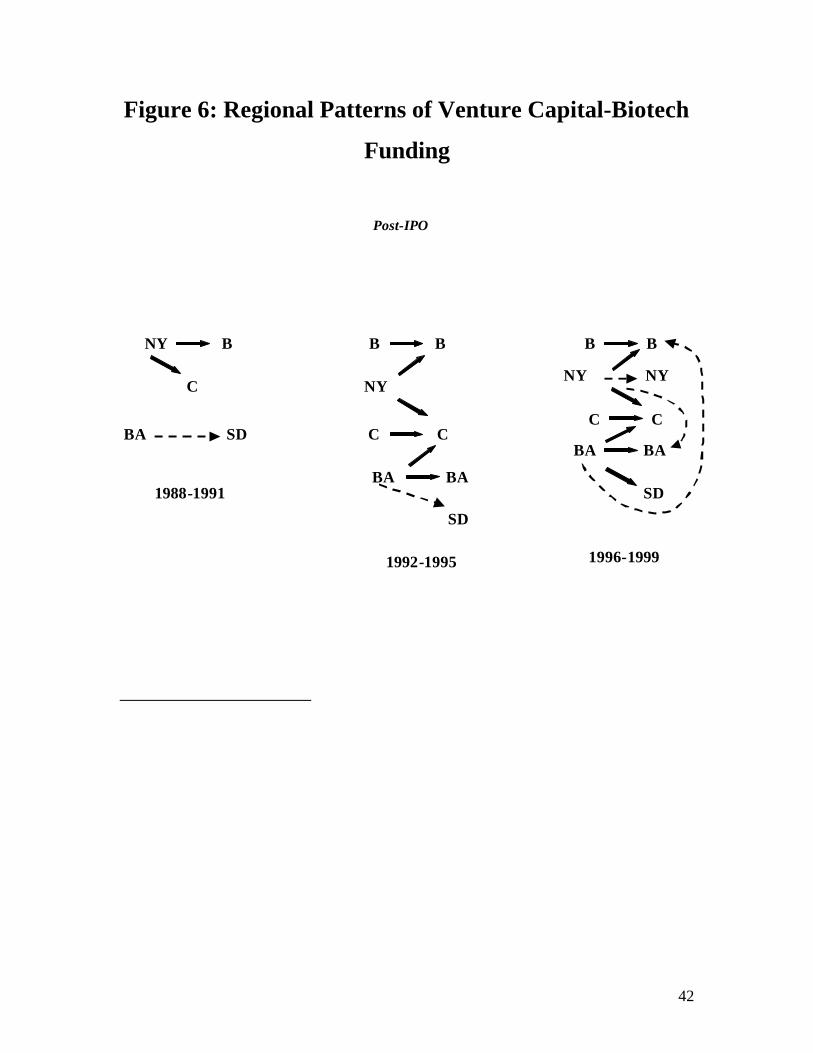
Turning from the cross-sectional portrait to a more dynamic account, Figures 5 and
6 present the sequence of funding patterns during key periods in the industry's evolution.
These patterns were generated by examining cross tabulations of the locations of each
partner for all funder-fundee dyads separately for each year. We highlight the
predominant flow of VC funds in each time period with a thick line. A dashed line

21
indicates a less active pattern. Figure 5 captures relationships before IPO, while figure 6
covers post-IPO. Essentially, there are 5 clusters--the Bay Area, San Diego, Boston, the
New York metro area, and the rest of the country. Beginning in 1988 with relationships at
the pre-IPO stage, there are only two main regions for venture capital-- the Bay Area and
New York City. Funds from the Bay Area flowed principally to San Diego and other
parts of the country at this stage (no doubt, due to left censoring of the data, we miss
earlier links between Bay Area VCs and biotechs), while N.Y. money went to Boston and
the rest of the nation. In 1989, Boston-based VCs enter the picture and fund local
companies, a pattern that holds for all subsequent time periods. New York money
continues to head north to Boston and throughout the country, and Bay Area funding
picks up locally and continues in San Diego and elsewhere. Over the years 1990-95 the
only change is New York money heads west to San Diego. But in the most recent period,
1996-99, the picture changes and Bay Area money moves to Boston and other parts of the
country, while New York money enters the Bay Area and begins seeding firms in the
N.Y. metro region. Over all the years, money from outside NY or the Bay Area goes to
other parts of the country and never "invades" the home turf of the most active biotech
clusters.
(Figures 5 & 6 go here.)
Turning to post-IPO financing, again New York and the Bay Area are the primary
locales for venture funds for the years 1988-91. In 1992, both Boston money and funds
located elsewhere become active. Once again, Boston money generally "stays home."
New York and Bay Area money moves more, especially in this last period, 1996-99. In
this later stage, Bay Area money flows locally, to San Diego, and to the rest of the
country, and less significantly, to Boston. New York money begins to go to N.Y. firms,
and continues to Boston and the rest of the country. In sum, VCs located in the Bay Area
hunt in their own backyards, in San Diego, and all over the nation, poaching in Boston as
well. New York money moves widely, and in later stages, as a biotech presence develops
in the N.Y. area, local firms are supported too. The rest of the nation stays out of the
established clusters, and Boston money remains local.
22
Summary and Discussion
Venture capital firms have become a key component of the innovation process,
and play an important role in high technology regions in the United States. VC-backed
R&D is three times as likely to generate patents as corporate-sponsored R&D (Kortum
and Lerner, 2000). In large part, this effect is due to the direct stake entrepreneurs have
in start-up firms and the fact that entrepreneurs in large organizations receive only a small
share of the rewards from corporate innovation. But venture capital support also has a
catalytic effect. Many companies report that VC funding is a key milestone, and
symbolically more important than other kinds of financing (Hellman and Puri, 2000).
Our results show that VC backing is a strong signal, attracting other VCs from outside the
local area and sustaining a process where subsequent rounds of support are garnered at
the post-IPO stage.
We find a strong pattern of spatial concentration in biotech and venture capital.
Given that VCs and biotech are both found in considerable number in the Bay Area and
Boston, it is not surprising that much VC support is locally-based. A little more than half
the biotech firms in our sample received local VC disbursements, and that percentage
rose to 58% within our key geographic clusters. But the tendency of VCs to finance local
companies increased over the decade of the 1990s, indicating the continuing strong role
of VC in sponsoring R&D within a region. We see this pattern most clearly when
comparing the profiles of firms that received local support with those that attracted non-
local financing. The locally-funded firms were smaller, younger, more science focused
(measured by the percentage of PhDs and MDs on their payroll and their number of R&D
collaborations), and likely to have more exclusive relations with only one or two VCs.
The biotechs that garnered external support were larger in size, older, and had advanced
to a stage where their work had moved further down the product life cycle (measured by
their ties to other organizations to assist in commercializing products). Thus, local VC
support is directed to much earlier stage companies, while external support flows to
companies that have to “show” more in order to attract financing.

23
For venture capital firms, there is evidence that as the VCs grow older and larger,
they invest more in both younger and more distant biotech companies. These gains from
experience are tempered somewhat by location. Boston VC money evinces a strong
tendency to stay home. New York money is restless, moving around to Boston, San
Diego, and the rest of the country. Bay Area VCs start out in California, where biotech
activity is very expansive, but by the latter part of the 1990s, California money goes to
Boston and other parts of the country. The reciprocal move never happens, as outside
money rarely encroaches on their home turf in the Bay Area. We report a rather similar
pattern in an examination of the portfolio of collaborations that U.S. biotech firms are
involved in over the period 1988-99 (OWEN-SMITH, RICCABONI, PAMMOLLI, and
POWELL, 2001). Initially, nearly half of all inter-firm alliances were locally based and
clustered in a few dense regions. By the end of the 1990s, most alliances were extra-
local. But this process was driven by a “reaching out” from established clusters to other
new areas.
These patterns suggest the difficulty of trying to intentionally create high tech
regions. Despite abundant attempts by policy makers and entrepreneurs in many parts of
the world, the relationships between finance and R&D are, in many respects, based on
personal ties, fostered in regions with extensive two-way communication among the
relevant parties. Such relations are not easily created by formal policies. Moreover, in
the case of biotech, there has been a strong co-evolution of the worlds of science and
finance. The presence in the most active regions of key public research organizations,
such as research universities and nonprofit institutes, that are buffered from market forces
means that the science plays a critical and autonomous role in industry evolution. This
dual contribution of money and ideas makes biotech rather different from other high tech
fields that are less steeped in basic research. Other fields in which product development
is more rapid and more in the hands of commercial inventors may not have the same co-
location patterns of biotech.
The recurrent collaboration and mutual interdependence of money and ideas raise
a number of interesting questions for further research. What do the performance profiles
of biotech firms and VCs look like in the dense regions compared to areas that are less
active? Clearly, a certain level of activity is necessary for mobilization, but is there a

24
point where a “crowding out” effect sets in? Understanding the point at which density
might become a deterrent would provide leverage in explaining when and where new
concentrations might emerge. In other developed countries, such a s Germany and
Sweden, the state has played a very active role in trying to stimulate venture capital
disbursements. Significant sums of money have been made available in the form of
matching grants. We do not as yet know whether this public policy-driven process of
financing innovation operates in a similar manner as the private equity market. One
might speculate that policy makers would be less content with strong patterns of regional
concentration on distributional grounds. In contrast, however, if the criteria for
evaluation are rates of founding of new organizations, then the U.S. “model” of spatial
co-location of capital and science has been an expansive and robust one. In the case of
biotechnology, it is safe to say that without venture capital and regional agglomeration,
the industry would not exist in the form that it does today.
25
ENDNOTES
1 For accounts of these foundings, see HALL (1987), TEITELMAN (1989), WERTH
(1994), ROBBINS-ROTH (2000). 2 See FELDMAN (1999) for an excellent survey of empirical studies of spillovers. 3 To supplement information about biotech companies or their various partners, we
consulted other courses, including various editions of Genetic Engineering and
Biotechnology Rela ted Forms Worldwide, Dun and Bradstreet’s Who Owns Whom? and
Standard and Poor’s. In addition, we utilized annual reports, Securities and Exchange
Commission filings and, when necessary, made phone calls. 4 See, for example, the story in the Boston Globe about “biotech bragging rights,”
contending that by including small private firms, Boston has a greater number of firms
than the Bay Area, but recognizing that the market value of the public companies in the
Bay Area was nearly double that of Boston (AOKI, 2000).
26
References
Almeida, P. and B. Kogut. 1997. “The exploration of technological diversity and the geographic localization of innovation.” Small Business Economics 9: 21-31.
Angel, D. P. 1991. “High- technology agglomeration and the labor market: The case of
Silicon Valley.” Environment and Planning A 23: 1501-1516. Aoki, N. 2000. “N.E. see gaining as top U.S. biotech area.” Boston Globe Oct. 31: E1,
E6. Arthur, B. 1990. “Positive feedback in the economy.” Scientific American February:
92-99. Audretsch, D. and M. Feldman. 1996. “R&D spillovers and the geography of innovation
and production.” American Economic Review 86, 3: 630-640. Audretsch, D. B. and P. E. Stephan. 1996. “Company-Scientist locational links: the case of biotechnology.” American Economic Review 86(2): 641-652. Baum, J. and C. Oliver. 1991. “Institutional linkages and organizational mortality,”
Administrative Science Quarterly 42:304-333. Brown, J. S. 2000. “Foreword” pp. ix to xvi in Understanding Silicon Valley, M.
Kenney, ed. Stanford, CA. Stanford University Press. Bygrave, W. D., and J. A. Timmons. 1992. Venture Capital at the Crossroads. Boston:
Harvard Business School Press. Feldman, M. P. 1999. “The new economics of innovation, spillovers, and
Agglomeration.” Economics of Innovation and New Technology. 8: 5-25. Florida, R. L. and M. Kenney. 1988. “Venture capital, high technology and regional
development.” Regional Studies 22: 33-48. Freeman, J. H. 1999. “Venture capital as an economy of time.” Pp. 460-479 in
Corporate Social Capital, R. Lenders and S. Galbay, editors. Norwell, MA: Kluwer.
Gilson, R. J. and B. S. Black. 1998. “Venture capital and the structure of capital markets: Banks versus stock markets.” Journal of Financial Economics 47: 243-277.
Gompers, P. A. 1995. “Optimal investment, monitoring, and the staging of venture capital.” Journal of Finance 50: 1461-1489.
27
Gompers, P. A. 1996. “Grandstanding in Venture Capital Industry.” Journal of Financial Economics 42: 133-156.
Gompers, P., and J. Lerner. 1999. The Venture Capital Cycle. Cambridge, MA: MIT
Press. Gompers, P., and J. Lerner. 2001. “The Venture Capital Revolution.” Journal of
Economic Perspectives 15, 2: 145-168. Granovetter, M. 1985. “Economic Action and Social Structure: A Theory of
Embeddedness.” American Journal of Sociology 91: 481-510. Gulati, R. 1995. “Does Familiarity Breed Trust – the Implications of Repeated Ties for
Contractual Choice in Alliances.” Academy of Management Journal 38: 85-112. Gulati, R. and M. Gargiulo. 1999. “Where do interorganizational networks come from?”
American Journal of Sociology 104: 1439-1493. Hall, S. 1987. Invisible Frontiers: The Race to Synthesize a Human Gene. New York:
Atlantic Monthly Press. Hellman, T. and M. Puri. 2000. “The Interaction between Product Market and Financing
Strategy: The Role of Venture Capital.” Review of Financial Studies 13: 959-84. Jaffe, A., M. Trajtenberg, and R. Henderson. 1993. “Geographic localization of
knowledge spillovers, as evidence by patent citations.” Quarterly Journal of Economics 108: 863-911.
Kenney M., 1986, Biotechnology: The University-Industry Complex. New Haven, CT:
Yale University Press. _____________, editor. 2000. Understanding Silicon Valley: The Anatomy of an
Entrepreneurial Region. Stanford, CA: Stanford University Press. Kortum, S. and J. Lerner. 2000. “Does Venture Capital Spur Innovation?” Rand
Journal of Economics 31: 674-692. Krugman, P. 1991. “Increasing returns and economic geography.” Journal of Political
Economy 99, 3: 483-499.
Leadbeater, C. 2000. The Weightless Society.
Lerner, J. 1998. “Venture capitalists and the decision to go public.” Journal of Financial Economics 35: 293-316.
28
Marshall, A. 1920. Principles of Economics (7th Edition). London: Macmillan. Nelson, R. and S. Winter. 1982. An Evolutionary Theory of Economic Change.
Cambridge, MA: Harvard University Press. Owen-Smith, J., M. Riccaboni, F. Pammolli, and W.W. Powell. 2001. “A comparison of
U.S. and Europe university- industry relations in the life sciences.” Management Science, forthcoming.
Podolny, J. M. 1994. “Market uncertainty and the social character of economic
exchange.” Administrative Science Quarterly 39: 458-483. Porter, M. 1998. “Clusters and the new economics of competition.” Harvard Business
Review Nov/Dec: 77-90. Powell, W. W. 1996. “Interorganizational collaboration in the biotechnology industry.”
Journal of Institutional and Theoretical Economics, 120:197-215. Powell, W. W., K.W. Koput, and L. Smith-Doerr. 1996. “Interorganizational
collaboration and the locus of innovation: Networks of learning in biotechnology.” Administrative Science Quarterly 41:116-145.
Prevezer, M. 1996. “The dynamics of industrial clustering in biotechnology.” Small
Business Economics, 8: 1-17. Robbins-Roth, C. 2000. From Alchemy to IPO. Cambridge, MA: Persens. Sahlman, W.A. 1990. “The structure and governance of venture capital organizations.”
Journal of Financial Economics 27: 473-521. Saxenian, A. 1994. Regional Advantage. Cambridge, MA: Harvard University Press. Scott, A. J., and M. Storper. 1987. “High technology industry and regional
development: A theoretical critique and reconstruction.” International Social Science Journal 34: 215-232.
Sinton, P. 2000. “Venture capital epicenter.”” San Francisco Chronicle. November 3:
B1, B4. Sorensen, O., and T. E. Stuart . 2001. “Syndication networks and spatial distribution of
venture capital investments.” Forthcoming in American Journal of Sociology. Stinchcombe, A. 1965. “Social structure and organizations.” Pp. 142-193 in J.G. March
(Ed.), Handbook of Organizations. Chicago, IL: Rand McNally.

29
Storper, M. and R. Salais. 1997. Worlds of Production. Cambridge, MA: Harvard University Press.
Stuart, T. E. 1998. “Network positions and propensities to collaborate: An investigation
of strategic alliance formation in a high-technology industry.” Administrative Science Quarterly 43: 668-698.
Teitelman, R. 1989. Gene Dreams: Wall Street, Academics, and the Rise of
Biotechnology. New York: Basic Books. Uzzi, B. 1999. “Embeddedness in the making of financial capital.” American
Sociological Review 64: 481-505. Von Hipple, E. 1994. “Sticky information and the locus of problem solving.”
Management Science 40, 4: 429-439. Werth, B. 1994. The Billion-Dollar Molecule. New York: Touchstone. Wright, M. and K. Robbie. 1998. “Venture capital and private equity: A review and
synthesis.” Journal of Business Finance and Accounting 24: 521-570. Zucker, L.G., M.R. Darby, and M.B. Brewer. 1998. “Intellectual human capital and the
birth of U.S. biotechnology enterprises.” American Economic Review 88(1): 290-306.
30
Table 1. Means and Standard Deviations (in Parentheses) for Biotech Firms Receiving VC Funding Prior to IPO, by Locality of Funding
Variable Non-Local
Funding Only Local Funding
Only Both Local and
Non-Local Funding
Firm Characteristics
Age 5.5913 (2.7813)
5.1852 (4.2678)
4.6411 (2.6174)
Time to IPO from founding date (in years)
6.5000 (3.2027)
4.7273 (1.6787)
5.2188 (2.1211)
Time since first tie (in years)
4.4754 (2.7131)
4.5185 (4.3688)
3.9625 (1.8327)
Time to IPO from first tie (in years)
5.0588 (2.8491)
3.6364 (1.2863)
4.6250 (2.0439)
Number of employees 53.81 (43.17)
44.04 (35.73)
53.13 (37.06)
Number of PhDs/MDs 15.24 (9.29)
16.70 (16.03)
15.35 (10.74)
Partner Counts
Number of Pratt’s VCs funding
2.6073 (1.9230)
1.7778 (1.1956)
4.2635 (2.1281)
Number of non-DBF partners
8.6208 (4.7759)
6.7451 (4.0578)
9.3368 (4.8503)
Number of DBF partners .8283 (1.3283)
.5170 (.8447)
.5965 (.7559)
Number of types of ties 2.0955 (.7488)
1.9556 (.8233)
1.9264 (.7172)
Number of forms of partners
3.2017 (1.3736)
2.4353 (1.0084)
2.8714 (1.2699)
Centrality Measures
R&D centrality .0035 (.0052)
.0008 (.0030)
.0022 (.0044)
Finance centrality .0072 (.0079)
.0030 (.0039)
.0082 (.0080)
Licensing centrality .0022 (.0052)
.0014 (.0041)
.0015 (.0036)
Commerce centrality .0004 (.0014)
.0038 (.0002)
.0006 (.0022)
Number of DBFs
69
27
56

31
32
Table 2. Means and Standard Deviations (in Parentheses) for Biotech Firms Receiving VC Funding After IPO, by Locality of Funding
Variable Non-Local
Funding Only Local Funding
Only Both Local and
Non-Local Funding
Firm Characteristics
Age 8.6101 (3.4951)
8.5048 (3.1038)
7.4516 (2.6016)
Time to IPO from founding date (in years)
4.7857 (3.1143)
5.2143 (2.7506)
4.3387 (2.3881)
Time since first tie (in years)
6.6871 (3.0893)
7.2190 (3.3885)
6.5161 (2.4761)
Time to IPO from first tie (in years)
2.8772 (3.2518)
3.9286 (3.0751)
3.4032 (2.1838)
Number of employees 164.58 (204.38)
128.92 (135.30)
173.48 (161.66)
Number of PhDs/MDs 26.68 (22.99)
29.30 (27.22)
31.85 (24.96)
Partner Counts
Number of Pratt’s VCs funding
2.0161 (1.5298)
1.2500 (.8026)
3.9734 (2.3466)
Number of non-DBF partners
11.7545 (6.2974)
14.2679 (9.5956)
13.2397 (6.6534)
Number of DBF partners 1.5837 (1.7746)
.8095 (.9582)
1.3628 (1.5293)
Number of types of ties 2.8053 (.9538)
2.9167 (.6626)
2.6648 (.6581)
Number of forms of partners
4.3180 (1.6488)
4.8155 (1.6757)
4.2586 (1.3349)
Centrality Measures
R&D centrality .0033 (.0057)
.0037 (.0062)
.0042 (.0052)
Finance centrality .0054 (.0052)
.0032 (.0034)
.0098 (.0066)
Licensing centrality .0033 (.0057)
.0083 (.1158)
.0036 (.0048)
Commerce centrality .0027 (.0064)
.0027 (.0054)
.001 (.0036)
Number of DBFs
57
14
62

33
34
Table 3. Means and Standard Deviations (in Parentheses) for VCs Funding Pre - and Post-IPO Biotech Firms, by Locality of Funding
Variable Non-Local
Funding Only Local Funding
Only Both Local and
Non-Local Funding
Funding Pre-IPO Firms
Age 12.3553 (10.1932)
14.0408 (19.6373)
15.6180 (8.1896)
Number of offices 1.6942 (1.0512)
1.915 (1.3619)
1.9018 (1.2266)
Capital (in millions of US dollars)
336.1133 (852.3067)
228.5154 (440.1693)
262.6174 (210.3292)
Percent spending own money 64.77 83.72 82.98
Number of VCs 88
43 47
Funding Post-IPO Firms
Age 12.4262 (7.1343)
11.6874 (7.2631)
17.3147 (9.0252)
Number of offices 1.5124 (.6832)
1.4835 (.7757)
1.9370 (1.5462)
Capital (in millions of US dollars)
185.6892 (307.6961)
210.2204 (382.2478)
388.9044 (692.3246)
Percent spending own money 59.46
81.25
86.86
Number of VCs 74 32 46
35
Table 4. Means and Standard Deviations (in Parentheses) for Biotech Firms in the Boston Cluster, San Francisco Bay Area Cluster, and Outside Any Regional Cluster That Received VC Funding Prior to IPO, by Locality of Funding
Variable Non-Local
Funding Only Local Funding Only Both Local and Non-
Local Funding Boston Cluster
Age 8 (2.63)
8.83 (.23)
9.08 (3.36)
Number of employees 160.44 (151.64)
360 (226.27)
200.92 (193.95)
R&D centrality .049 (.071)
.085 (.105)
.052 (.056)
Finance centrality .064 (.069)
.031 (.020)
.093 (.047)
Licensing centrality .044 (.086)
.058 (.081)
.048 (.068)
Commerce centrality .017 (.048)
0 (0)
.014 (.029)
Number of DBFs 9 2 12
San Francisco Bay Area
Age 7.3 (2.86)
7.16 (2.46)
7.22 (2.31)
Number of employees 98.75 (49.09)
63.67 (27.97)
184.45 (186.36)
R&D centrality .059 (.081)
.0066 (.0121)
.025 (.039)
Finance centrality .016 (.0077)
.041 (.048)
.120 (.080)
Licensing centrality .013 (.018)
.0041 (.0071)
.035 (.047)
Commerce centrality .0023 (.0051)
.039 (.067)
.018 (.056)
Number of DBFs 5 3 22
Not In A Cluster
Age 8.55 (3.41)
7.30 (2.90)
7.25 (.96)
Number of employees 170.89 (141.42)
103.75 (100.59)
88.25 (60.15)
R&D centrality .015 (.032)
.0008 (.0015)
.074 (.073)
Finance centrality .049 (.043)
.0072 (.0071)
.072 (.044)
Licensing centrality .032 (.040)
.1347 (.1693)
.039 (.031)
Commerce centrality .032 (.066)
.052 (.072)
.0010 (.0020)
Number of DBFs 20 5 4

36
37
38
39

40

41
Figure 5: Regional Patterns of Venture Capital
Pre-IPO
New York (NY) Boston (B)
Rest of Country (C)
Bay Area (BA) San Diego (SD)
1988
1989
B B
NY
C
BA BA
SD
1990-1995 1996-1999
B B
NY
C C
BA BA
SD
B B
NY NY
C C
BA BA
SD
C
42
Figure 6: Regional Patterns of Venture Capital-Biotech
Funding
Post-IPO
1988-1991
1992-1995 1996-1999
NY B
C
BA
B B
NY
C C
BA BA
SD
B B
NY NY
SDC C
BA BA
SD