Embed Size (px)
Citation preview

MEMORANDUMNo 29/2001
The Spanish Influenza among Norwegian ethnic minorities1918-1919
BySvenn-Erik Mamelund
ISSN: 0801-1117
Department of EconomicsUniversity of Oslo
This series is published by theUniversity of OsloDepartment of Economics
In co-operation withThe Frisch Centre for EconomicResearch
P. O.Box 1095 BlindernN-0317 OSLO NorwayTelephone: + 47 22855127Fax: + 47 22855035Internet: http://www.oekonomi.uio.no/e-mail: [email protected]
Gaustadalleén 21N-0371 OSLO NorwayTelephone: +47 22 95 88 20Fax: +47 22 95 88 25Internet: http://www.frisch.uio.no/e-mail: [email protected]
List of the latest 10 Memoranda:No 28 Erik Biørn: The Efficiency of Panel Data Estimators:
GLS Versus Estimators Which Do Not Depend on VarianceComponents. 15 pp.
No 27 Qaisar Farooq Akram and Ragnar Nymoen: Employment behaviour inslack and tight labour markets. 34 pp.
No 26 Snorre Kverndokk, Knut Einar Rosendahl and Thomas F. Rutherford:Climate policies and induced technological change:Which to choose the carrot or the stick? 25 pp.
No 25 Olav Bjerkholt: Tracing Haavelmo’s steps from Confluence Analysis tothe Probability Approach. 33 pp.
No 24 Sverre A.C. Kittelsen, Guri Galtung Kjæserudand Odd Jarle Kvamme: Errors in Survey Based Quality EvaluationVariables in Efficiency Models of Primary Care Physicians. 23 pp.
No 23 Ove Wolfgang: Eco-Correlation in Acidification Scenarios. 52 pp.No 22 Øystein Kravdal: The High Fertility of College EducatWomen in
Norway: An Artefact of the ’Piecemeal Approach’. 14 pp.No 21 Yngve Willassen: On the Economics of the Optimal Fallow-Cultivation
Cycle. 19 pp.No 20 Michael Hoel: Allocating greenhouse gas emissions among
countries with mobile populations. 14 pp.No 19 Tore Nilssen and Lars Sørgard: Who Are the Advertisers? 17 pp.
A complete list of this memo-series is available in a PDF® format at:http://www.oekonomi.uio.no/memo/
Svenn-Erik Mamelund 1
Correspondence: Svenn-Erik Mamelund. Department of Economics, University of Oslo
P.O. Box 1095 Blindern, 0317 Oslo, Norway. E-mail: [email protected]
Title: The Spanish Influenza among Norwegian ethnic minorities 1918-1919
Author: Svenn-Erik Mamelund
Address: Department of Economics, University of Oslo
P.O. Box 1095 Blindern, 0317 Oslo, Norway
E-mail: [email protected]
Svenn-Erik Mamelund 2
Abstract
There are few previous studies that have applied multivariate methods to analyse Spanish
Influenza mortality, and for the very first time, Spanish Flu morbidity and case fatality rates
are analysed. Previous studies have reported that indigenous populations were the prime
victims of Spanish Influenza. The explanations put forward in those studies were not
convincing, however, as no controls were made for possibly confounding factors. This paper
documents for the first time that areas with high shares of an indigenous population, the
Norwegian Sami, have high Spanish Influenza mortality and lethality, net of such
confounding factors as wealth, crowding, height, occupational structure, settlement patterns
and diffusion. The cause is probably a lack of inherited and acquired immunity against
influenza among the Sami. Another ethnic Norwegian minority, Kven (Finnish immigrants
and their descendants), however, did not differ significantly from the Spanish Influenza
mortality and lethality of the Norwegian majority population.
Svenn-Erik Mamelund 3
1. Introduction1
Spanish Influenza swept the entire globe in four waves in the years 1918-1920, leaving a
billion people sick, more than half of the world’s population at that time. It killed between 50
and 100 million, five to ten times the death toll of soldiers during World War I (Johnson
2000). The first pandemic wave was relatively mild and started during the spring and summer
of 1918, either in China or in USA (Shortridge 1999). The second wave was highly virulent,
took a great mortality toll, and occurred during the fall of 1918. The third wave broke out
during the first months of 1919, and claimed fewer deaths as the first waves left some
immunity and the most susceptible individuals were eliminated by death. A fourth wave
occurred in the winter of 1920, basically in small rural or isolated settlements that missed the
pandemic in 1918-1919. The flu probably infected 1.2 million Norwegians, and 15,000 deaths
were recorded in a population of 2.6 million. The case fatality rate was only 1.2 per cent,
however, and less than one per cent of the population died (Mamelund 1998). The socio-
economic impact of the flu was considerable, mainly because it took its greatest toll in the age
group 20-40 years, i.e., that part of life when people tend to marry, have children and are most
economically productive (Mamelund 1999). There were also clear socio-economic, racial and
ethnic differences in mortality. The indigenous populations seemed to be particularly hard hit by
high mortality. Nevertheless, the pandemic has been largely forgotten and until recently
bypassed by demographers.
2. Objective
The objective of this paper is to analyse whether ethnic minorities were harder struck by
Spanish Influenza morbidity and mortality than the Norwegians. I use aggregate data for 376
1 Acknowledgements: I am most grateful to Nico Keilman, Øystein Kravdal, Kåre Bævre, Jørgen
Carling, Einar Lie and Gunnar Thorvaldsen for fruitful discussions and useful comments. Thanks are
also due to Norwegian Social Science Data Services (NSD) for providing data. The paper is part of the
research project Spanish Influenza and beyond: the case of Norway, and is financially supported by the
Norwegian Research Council.
Svenn-Erik Mamelund 4
medical districts in Norway in the years 1918-1919, and apply least square regression to
estimate a number of cross sectional regression models. Several authors have documented
extremely high mortality among indigenous compared to non-indigenous populations (Pool
1973; Åman 1990; Tomkins 1992; Kelm 1998; Linanmäki 2000). However, these studies
were all univariate and could not demonstrate a “minority effect,” net of the effect of other
variables. For instance, did minority group members have high mortality because they were
relatively poor, or can independent effects be demonstrated? The purpose of this paper is to
answer such questions. I shall look at two Norwegian minority groups, Finnish immigrants
and their descendants (Kven) and the indigenous Sami population (Lapp), and control for
possible confounding factors such as poverty, wealth, height (as a proxy of nutrition and
disease history), crowding, occupational structure and geography. The paper is structured as
follows. First, in sections 3 and 4 I will give an introduction to the geography and economy of
the Sami and Kven around 1920 and a review of previous studies on overall mortality patterns
of Sami and Kven respectively. Section 5 gives a short story on how the First World War
affected ethnic minorities. Next, section 6 presents previous research on Spanish Influenza
mortality among indigenous as well as non-indigenous populations. Then, sections 7 and 8
discuss data and methods respectively. Estimation results are presented in section 9.
3. The geography and economy of Sami and Kven around 1920
About two thirds (20,000) of all Sami lived in Norway in 1920. The last third lived in
Sweden, Finland and in Russia.2 The Norwegian Sami generally lived and had the highest
shares of the population in the northernmost counties of Finnmark, Troms, and Nordland, but
there were also scattered settlings of Sami as far south as Røros-Femund in Hedemark
(“South Sami”) (Map 1, Table 2). The Sami were originally hunters and fishermen, and the
forefathers of the present Sami were probably the first to settle in Scandinavia when the
2 7 100 Sami lived in Sweden, 1 600 in Finland and ca. 1 800 in Russia (Statistisk sentralbyrå (SSB)
1923c).
Svenn-Erik Mamelund 5
inland glaciers started to melt in the coastal areas 12-15,000 years ago. The Sami people are a
minority in Norway. In 1920 less than one per cent of the population was Sami (Table 2).
[Map 1 approximately here]
The main economic base of the Sami in 1920 was fishing (55%), agriculture (27%) and
reindeer keeping (7%) (Statistisk sentralbyrå (SSB) 1923c). About two thirds lived by or near
the coast, and close to 100 per cent lived in rural areas (Vorren and Manker 1976; Nesheim
1979; SSB 1923c). The Sami can be divided into three groups: The pastoral mountain Sami
(10%), the pastoral forest Sami and the resident Sami. The pastoral mountain Sami primarily
had their outcome from reindeer, and moved long distances between inland-mountain-winter
and summer-forest-coastal grazing land. The mountain nomads had their winter inland
grazing land in Kautokeino and Karasjok (Map 1).3 The forest Sami are known to have small
herds of reindeer, and moved shorter distances than the mountain nomads. The resident Sami
(“sea and river-Sami”) were mostly poor fishermen or crofters with small farms. Their way of
life did not differ very much from that of Norwegian or Kven fishermen or crofters in
northern Norway.
The second ethnic minority in Norway, Kven (Finnish immigrants and their
descendants), generally lived in Finnmark as the Sami, but there were also a substantial
number of Kven in three south-eastern communes in the county of Hedmark (Grue, Åsnes and
Våler) (Map 2, Table 2). Most of the Kven in Finnmark migrated to Norway during the latter
half of the eighteenth century with a peak during the famine in Finland in the 1860s, whereas
the Kven in Hedmark migrated as early as in the seventeenth century (Iversen 1959; Eriksen
3 There were a total of 1,258 pastoral mountain Sami in Norway 1910. 1,070 of the nomads lived in
Finnmark (10.2% of all Sami in Finnmark), ca. 600 in Kautokeino and ca. 500 in Karasjok (SSB
1923c). There are no estimates for the number of nomads in 1920, but if the figures from 1910 were valid
for 1920, two thirds of the Sami were nomads in Kautokeino (94% of a population of 940 was Sami) and
more than half of the Sami were nomads in Karasjok (94% of a population of 960 was Sami).
Svenn-Erik Mamelund 6
and Niemi 1981). There were also a substantial number of Kven in northern Sweden and in
Russia (SSB 1923c). In 1920 Norway, three out of four Kven made their living in the
vulnerable sectors of fishing (51%) and agriculture (25%) (SSB 1923c). As the Sami, most of
the Kven (84 per cent) lived in rural areas along the coast and in fjord areas. Of the urban
Kven population, most lived in Vadsø, located near the Finnish and Russian borders, where
they made up half of the population (see Map 2).
[Map 2 approximately here]
The conditions for agriculture are poor in Finnmark, with long cold winters and short
summers. The Sami and the Kven often had land with the poorest suitability for agriculture.
The agricultural and fishing population in Finnmark was extremely dependent on, and
vulnerable to, climatic conditions and fluctuations in the economy. One crop failure or
unsuccessful fishing could be enough to bring distress and famine-like situations. Twice in
the 20th century, the last time in 1921, the population in the municipality of Sør-Varanger,
Finnmark, for instance, was struck by famines. Areas dominated by Kven were hardest hit by
the 1921-famine (Forsdahl and Salmi 1974).
4. Previous studies of mortality among the Sami and Kven
Ever since 1875, the year in which Norwegian mortality statistics for the first time were
compiled on a county-level, the northern-most county of Finnmark, the home of the largest
shares of Sami and Kven, has topped the list with high total mortality, and especially infant
mortality and still births, compared to other Norwegian counties, towns and cities (Wessel
1914; Steen 1956; 1961; Torgersen 1956; Jonassen 1959; 1964; Forsdahl 1967; 1973; 1978;
Gjestland 1968; 1970; Thorvaldsen 2001). Mortality due to accidents (esp. drowning),
tuberculosis, lung cancer and coronary heart disease has been particularly high in Finnmark
compared to the national average. The high mortality of the two latter causes is primarily
Svenn-Erik Mamelund 7
explained by widespread cigarette smoking. The highest mortality in Finnmark has been
found in coastal areas, rural areas, among fishermen, the Sami and among Kven.
In the period 1900-1910, mortality of tuberculosis in Finnmark was twice as high as
that for the country as a whole (Wessel 1914).4 In the municipality of Sør-Varanger,
Finnmark, the incidence and mortality of tuberculosis 1886-1899 was highest among
Norwegians followed by Sami and Kven (Wessel 1914). This was probably due to the fact
that it was Norwegians moving into Finnmark from southern parts of the country who brought
tuberculosis with them.5 After tuberculosis gained a foothold in Sør-Varanger, incidence and
mortality of tuberculosis 1900-1910 was highest among Sami, followed by Kven and
Norwegians. Wessel (1914) doubts whether the ethnic differences in morbidity and mortality
in Finnmark can be explained by genetics. Instead, he emphasises the relatively poor standard
of living and low educational level among the Sami and Kven.
Historically high levels of infant mortality among the Sami, both pastoral and
resident, have also been linked to poor education (due to shorter school-year than for
Norwegian children), poor Norwegian language skills among pre-school Sami children, and
poor Sami-language skills among Norwegian teachers (Rein 1956; Eriksen and Niemi 1981).6
4 In the period 1875-1899, however, mortality from tuberculosis was significantly lower in Finnmark
compared to the country as a whole. The mortality in other parts of the country, in the capital of
Kristiania, as well as in other European cities, was at least as high in the period 1875-1899 as in Finnmark
1900-1910, if not higher (Wessel 1914). The few cases of tuberculosis in Finnmark in the 1880s were
probably imported by families from southern parts of Norway, or broke out in years of unsuccsessfull
fishing and poor economic situation of the fishermen.
5 The immigration of Norwegians to Finnmark in this period was partly due to a “settling-programme” to
Norwegianize Finnmark (Eriksen and Niemi 1981).
6 Of the Sami in Finnmark and Troms 1920, only 14 and 26 per cent respectively spoke the Norwegian
language on a daily basis (SSB 1923c).
Svenn-Erik Mamelund 8
In addition, there were few schools and a shortage of teachers in Finnmark.7 For the nomads,
the school probably represented an unwanted break in their annual lifecycle, as it did nothing
to increase profits in reindeer keeping (Aubert 1967). Poor education and poor knowledge of
the Norwegian language among Kven may also be an important factor explaining higher
mortality among Kven than among the Norwegians.8 In general, mistrust between the
Norwegians (authorities) and ethnic groups (Sami and Kven) lead to discrimination against
the latter, not only when it came to education and the right to use and to be educated in the
mother language, but also in health, culture and religion. The Sami were seen as primitive and
inferior compared to the Norwegians as well as the Kven. The goal of the authorities was to
make the Sami live as, and to behave as Norwegians. In the beginning of the 20th century, as a
part of the “Norwegianization” policy, if you were to keep the right to land, you had to speak
the Norwegian language and you had to have a Norwegian last name. The new law, however,
was as much directed towards Kven as the Sami. Ethnic discrimination also took place in the
labour market. Non-Norwegians, for instance, were not allowed positions at schools, in
churches, the police, or in the forest- and border patrol (Niemi and Eriksen 1981). It became a
source of shame to admit you were either Sami or Kven.
Moving could represent a risk factor for the nomadic mountain Sami. Did this result in
higher mortality among the nomads compared to the resident Sami? Or was it rather the other
way around? Did higher degree of crowding and poorer housing conditions of the resident
Sami result in higher mortality of the residents than among the nomads? Among the Sami, the
nomads in Karasjok and Kautokeino had the lowest mortality of tuberculosis in Finnmark in
the last two decades of the 19th century (Wessel 1914). This was probably due to their isolated
7 In Finnmark, there were only four boarding schools 1905-1907 and two secondary schools 1912-1936.
In the early 1920s, there were only 150 teachers, only a few were Sami, and most did not know the Sami
language (Eriksen and Niemi 1981). According to the 1920 census, only 0.3 per cent of the Norwegians in
Finnmark spoke the Sami language on a daily basis (SSB 1923c).
8 Of the Kven population in Finnmark and Troms, 61 and 32 per cent respectively spoke the Norwegian
language on a daily basis (SSB 1923c).
Svenn-Erik Mamelund 9
winter settlements, little mixing with resident Sami, Kven and Norwegians, and the nomadic
life on the move in the open spaces and in well-ventilated tents. Unhygienic conditions did
not occur as nature took care of renovation when the nomads and their reindeers went on
(Berset 1967). Since the 1890s, however, many gave up the nomadic lifestyle and settled
down permanently, generally as fishermen or small farmers (Wessel 1914). The old housing
tradition of the movable tent was not easily transferred to permanent residences. Around
1920, the ex-nomads lived in overcrowded and unsanitary turf-huts and most slept on the
floor (Sundt 1913; Jonassen 1959; Det civile medisinalvesen (DCM) 1924). 9 As a result, the
risk of being infected by tuberculosis as well as the level of mortality increased, as mixing
with other people escalated and as housing conditions worsened. Housing, and social and
hygienic conditions among Sami who were resident all their life were also generally held to
be poor, and some authors link these conditions to the high registered infant mortality in
Finnmark 1946-1961 (Rein 1956; Jonassen 1964). The relatively high mortality among Kven
in Vadsø, Finnmark, in the 19th century, has also been linked to low standards of housing
(Sundt 1913; Niemi 1977).
In the municipality of Sør-Varanger, Finnmark, infant mortality from 1900 until the end
of the Second World War was significantly higher among Kven compared to the rest of the
population (Forsdahl 1973). Infant mortality in areas of out-migration from 19th century
Finland to Norway is also known to be relatively high (Lithell 1981; 1988). Brändström
(1984) has found high infant mortality among Kven in 19th century Haparanda, Sweden.
Significant excess total mortality has been found among male Kven 1949-1968 in Sør-
Varanger compared to the rest of the population in Sør-Varanger, the whole county of
Finnmark and the nation as a whole (Forsdahl 1973). Most of the excess total mortality is
9 According to the 1920 census, approximately 2,000 Sami lived in 409 registered turf-huts or tents, i.e.,
4.9 persons per turf-hut/tent (SSB 1923a; SSB 1924). The number of persons per turf-hut/tent is at the
same level as the average number of persons in private national occupied dwellings (see Table 4).
However, compared to the national average persons per room in private occupied dwellings, the crowding
is five times higher in the turf-huts/tents (if one assumes that the turf-huts/tents have only one room).
Svenn-Erik Mamelund 10
explained by high arteriosclerotic mortality, a cause of death that has also been found to be
particularly high among males living in Finland (Forsdahl 1973).
Are there other possible explanations of high mortality among the Kven? A possible
explanation is that the Finnish immigrants brought with them ways of living, habits and
traditions that cause high mortality. Four extensive health-studies of the population in the
fishing village of Bugøynes, Sør-Varanger, 1968, 1974, 1977 and 1984, however, do not
confirm this hypothesis (Forsdahl and Salmi 1974; Forsdahl et al. 1974; Forsdahl and Salmi
1980; Forsdahl and Salmi 1990). The smoking habits of men for example were not “Finnish,”
but more or less identical to the average (high) male cigarette consumption in Finnmark. The
percentage of fat in the diet proved unfavourably high, however, and the average cholesterol
level of male Kven was higher than that of the rest of the population. These two factors were
not found to be of crucial importance, however. Instead, Forsdahl (1973; 1978) suggests that
excess male mortality of arteriosclerotic heart disease in Sør-Varanger in the 1960s and 1970s
could be attributed to the economic hardship of the period 1896-1924, which also includes
two famines and Spanish Influenza. As a consequence, the oldest in Bugøynes and Sør-
Varanger have grown up under conditions that give earlier ageing and lower than optimal
body height (Forsdahl et al. 1974).10 The Finnish population (data from 1977) in the
municipalities of Grue, Åsnes and Våler are also generally shorter than the Norwegians in the
county of Hedmark are (Prytz and Forsdahl 1977). The health studies in Sør-Varanger,
Finnmark, and Grue, Våler and Åsnes, Hedmark, cannot give a satisfactory answer to the
question of whether genetic factors explain the high mortality among Kven. However, there
are reasons to believe that the high mortality is mainly due to cultural factors as Wessel
suggests in the case of explaining mortality due to tuberculosis.
10 Men with arteriosclerotic heart disease in Bugøynes had the lowest body hight compared to men
without heart disease in Bugøynes, men in Sør-Varanger generally, and the male national average height
(disregarding age) (Forsdahl et al. 1974). See also footnote 11.
Svenn-Erik Mamelund 11
Poor disease environment, hygiene and malnutrition during childhood may explain
why the population in Finnmark in general, and the Sami in particular, but also Kven, on
average are shorter, and have higher total mortality than people in the rest of the country
(Jonassen 1959; Waaler 1984).11 This could, however, also be due to genes (Nesheim 1979).
Most likely, however, average height is largely a product of environmental factors (Malcolm
1974).
5. Wartime conditions and ethnicity
Did relatively poor living conditions during the First World War with galloping inflation,
rationing of food, severe housing and firewood shortage affect the minorities more than the
majority population? If this was the case, were Sami and Kven as a consequence more
susceptible to epidemic diseases around 1918 than the Norwegians? And, did poor living
conditions 1914-1918 result in higher levels of morbidity and mortality of Spanish Influenza
among the minorities than among the Norwegians? There is little evidence that wartime
conditions affected minorities more negatively than Norwegians. The pastoral mountain
Sami, for instance, earned good money from the sale of reindeer meat in a period with short
supply of meat. The average reindeer herd was worth 40,000 Nok and the average annual
11 Around 1920, the average height of Sami men in Kautokeino, Karasjok (Finnmark county) and
Tysfjord (Nordland county) was 159 cm, 164 cm and 162 cm respectively, 168 cm in Finnmark as a
whole (Norwegians 171 cm), and the national average was 172 cm (Gjessing 1934; Schreiner 1930;
Schreiner 1932). Sami females in Kautokeino and Tysfjord were on average 150 cm and 152 cm tall
respectively, the national female average height was 162 cm. Sami boys in Kautokeino 8-12 years were
on average 13 cm shorter than the average boy in the county of Oppland, South-East-Norway. Kven in
Kautokeino (disregarding sex) was 163-166 cm tall (Gjessing 1934; Schreiner 1932). The height of 20-21
year old (recruits) Sami, Kven and Norwegians in Troms county was 164, 166 and 171 cm respectively
(Bryn 1921). The lowest height (167 cm) in Troms is found in municipalities with the highest percentage
of Sami (Sørfjord 51% and Lyngen 36%) (Bryn 1921). The Sami recruits from Lyngen had an average
height of 162 cm (Schreiner 1930).
Svenn-Erik Mamelund 12
income was 5-6,000 Nok. Average income and wealth of the pastoral Sami were well above
that of the population in the nation as a whole (DCM 1922, see Table 4). The primary sector
generally gained from high prices on food and raw materials (SSB 1917; SSB 1918a; SSB
1918b). As most of the Sami and Kven were still in the subsistence economy, the high
inflation did not harm the minorities as much as it did Norwegians who were more integrated
in the money economy.12 The shortage and rationing of food may have caused nutritional
problems among low-income groups and labourers on low fixed wages who had to buy food
at high prices in shops. Not surprisingly, there were few reports of malnutrition among
farmers and fishermen. Among the poorest crofters, the poorest fishermen, and the landless,
on the other hand, there were several reports of malnutrition. As a large part of the resident
Sami and Kven were in these groups, problems of malnutrition may have existed here as well.
6. Previous research: explanations of high Spanish Influenza morbidity and mortality among
indigenous populations
In this section I report previous research on Spanish Influenza among indigenous populations
and discuss their explanations of high morbidity and mortality compared to non-indigenous
populations. Secondly, findings from studies of Spanish Influenza mortality with other
perspectives than ethnicity will be discussed, as the studies help to better understand Spanish
Influenza mortality among minority groups in Norway. First, however, I discuss the more or
less universal age pattern of morbidity and mortality.
6.1. The peculiar age-sex pattern
12 In 1920, 17.5%, 13.2% and 3.3% of the Norwegian, Kven and Sami male labour force in Finnmark
were occupied in industry respectively. In trade and transport the percentages were 16.6, 4.4 and 3.3
respectively (SSB 1923c).
Svenn-Erik Mamelund 13
The influenza-censuses carried out in USA and Norway 1918-1919 give a reliable picture of
the age-sex pattern of morbidity (see Vaughan 1921; Hanssen 1923; Collins 1931;
Sydenstricker 1931; Britten 1932). These studies clearly show an unusually high incidence
under 30 years and a rather rapidly falling incidence above age 30 (Figure 2), a definitive
contrast to the w-curve of mortality (Figure 1). In both countries, the female incidence tended
to be higher than that for males, except for those below 20 years. This may be explained by
the fact that information was obtained from the wife, who probably remembered her own
disease better than that of family members.
[Figure 1 approximately here]
[Figure 2 approximately here]
The W-shaped age pattern of influenza-pneumonia death rates 1918-1919 stands in
great contrast to the normal U or J shaped age distribution of influenza-pneumonia death
rates, here represented by 1917+1921 (Figure 1). In Norway 1918-1919, as well as in several
other countries (e.g., New Zealand, Australia, USA, South Africa), men in the age group 20-
60, especially those in the ages 25-29, had significantly higher mortality compared to women
(Rice 1988; Crosby 1989; Phillips 1990). In 1917 and 1921 combined, however, there was
almost no sex difference in these age groups (Figure 1). The male excess mortality in 1918-
1919 may be explained by the fact that the male breadwinners in their prime ages felt
indispensable regarding family economy, pushing themselves too hard, catching
complications of influenza (Åman 1990). There exist no data on age-sex specific Spanish
Influenza incidence and mortality for different ethnic groups in Norway. There is no reason,
however, to believe that the age-sex specific incidence and mortality rates of minorities depart
significantly from that of the total population.
6.2. The Spanish Influenza mortality of indigenous populations
Svenn-Erik Mamelund 14
The indigenous minority populations in USA, Canada, New Zealand and Scandinavia
experienced three to eight times higher Spanish Influenza mortality than the white majority
populations in 1918-1919 (Table 1). During the fourth influenza wave in Scandinavia 1920,
however, the difference in mortality between areas with high and low infusion of the
indigenous Sami-population was much higher.
[Table 1 approximately here]
Were there any differences in mortality between the nomads and the resident Sami?
According to the medical officer in Kautokeino, this was not the case (DCM 1922). The two
neighbouring nomadic Sami districts, Karasjok and Alta-Kautokeino, however, took up the
second and first place at the list of excess influenza-pneumonia mortality in 1918 and 1919
respectively (Table 1). From this there are reasons to believe that the nomads had higher
mortality than the resident sea, river and farming Sami in general. This could, however, also
be due to the fact that the nomad districts had the chiefly highest percentages of Sami
population in Norway (more than 90% was Sami).
In the international literature, the high indigenous minority Spanish Flu mortality has
been explained by poverty (Linanmäki 2000), a failure of nursing, care and food-production
when morbidity and mortality peaked (Pool 1973; Åman 1990; Tomkins 1992; Kelm 1998),
low inherited immunity against influenza due to little contact with European diseases
(Tomkins 1992) and a failure to acquire immunity in the spring wave of 1918 (Åman 1990;
Linanmäki 2000), as well as poor understanding of hygiene (Crosby 1989).
6.3. Other findings and their ability to explain Spanish influenza mortality of minority groups
in Norway
Svenn-Erik Mamelund 15
In this section, results from studies on the effect of occupation, geography, immunity,
nutritional status and poverty on Spanish Influenza mortality in non-minority populations are
presented as they shed light on the understanding of mortality among minorities in Norway.
As stated earlier, Sami and Kven were mainly poor crofters and fishermen. In a
previous study, Mamelund (1998) has found that fishermen experienced higher influenza-
pneumonia mortality than farmers and crofters. The high mortality among fishermen and their
families is probably due to poor hygiene and nutrition as well as crowding in fishing boats
and ashore in the fishing villages. Low mortality in farming districts was explained by proper
hygiene, nutrition and less crowding. Several authors have shown that Urban populations
experienced higher mortality than rural ones (Phillips 1990; Rice 1988; Åman 1990;
Mamelund 1998; Johnson 2000). As most of the Sami and Kven lived in rural areas, it is
important to control for the urban/rural effect.
Several authors have also found that the population living in areas heavily affected by
the first influenza wave, suffered less in the succeeding waves, as relative immunity was
acquired (Rice 1988; Phillips 1990; Åman 1990; Mamelund 1998; Echeverri 2001). The first
influenza wave in Norway started in the capital of Kristiania in southern Norway 15 June
1918 and diffused rapidly along the coast towards northern Norway with people travelling
with the coastal steamers. Inland areas were affected later than coastal areas, and some areas
of Finnmark, such as relatively isolated and Sami dominated Karasjok, did not experience the
flu before the second virulent wave appeared in September-October 1918 (Mamelund 1998).
Lack of immunity from the first mild influenza wave may explain the high mortality in
Karasjok.
Under-nourishment does not increase the risk of viral infections, such as influenza
(Scrimshaw et al. 1959). Malnutrition associated with low intake of nitrogen on the other
hand, results in definite impairment of immune response and a corresponding increase in
susceptibility to bacterial diseases (Fox et al. 1970). Consequently, the Spanish Influenza did
not pay attention to whether its victims were hungry or not. Bacterial complications like
pneumonia, however, took a greater toll among the poorly fed. There are reasons to believe
Svenn-Erik Mamelund 16
that a large part of the poorest Sami and Kven experienced malnutrition, partly due to the
shortage and rationing during the war and that the risk of dying of complications due to the
flu was high as a result of this. Thus, in order to demonstrate any independent effect of
belonging to a minority group, one should control for nutrition status.
Did Spanish Influenza hit rich and poor alike? The dominant view in 1918 (partly
also later) was that influenza morbidity and mortality were class neutral. There is no doubt
that Spanish Influenza took a great toll among both rich and poor classes, but nevertheless
there were clear differences. In a number of cities in the United States, Christchurch in New
Zealand, and in Bergen, Norway, a relatively strong negative relationship between living
conditions (crowding), socio-economic status (measured by income) and mortality (death rate
and case fatality rate) was observed. A negative relationship was also observed between
morbidity (incidence) and socio-economic status, but this was not as strong as that between
mortality and socio-economic status (Vaughan 1921; Hanssen 1923; Sydenstricker 1931; Rice
1979; 1988). In an “influenza census” in four cities in England, on the other hand, no clear
relationship between influenza morbidity/mortality and occupation/overcrowding were found
(Great Britain Ministry of Health 1920). In a multivariate study of the city of Sydney,
Australia, McCracken and Curson (2001) found that status of occupation and indoor space or
standard of housing was negatively associated with mortality. In another multivariate study,
of England and Wales, Johnson (2000) found no clear relationship between Spanish influenza
mortality and social class. Given these mixed findings, it is important to control for poverty
status.
7. Data
7.1. Study populations
In the 1920 census, as was also the case in censuses since 1845, Kven (Finnish immigrants
and their descendants) and Sami were the only ethnic groups that were systematically
enumerated (Table 2). An important reason for enumerating Kven was the fear of a Finnish
Svenn-Erik Mamelund 17
(or Russian) invasion of Norway, or that the Finnish population would claim an independent
state in Finnmark (Eriksen and Niemi 1981).
[Table 2 approximately here]
The registration of ethnicity in the censuses was based on self-reporting. In 1920, questions
about nationality (ethnicity) of each parent were asked allowing each parent to come from
mixed heritage (Lie 2001). Local reindeer inspectors had good knowledge of the family
background of the minorities, and they checked the consistency of the answers on ethnicity
(Hansen and Meyer 1991). There were also asked questions regarding language in the 1920
census. The definition of a Sami or Kven used in this paper is individuals of “pure” origin,
regardless of language, and individuals of “mixed” populations of first generation (Sami-Kven
or Sami-Norwegian who speak Sami on a daily basis and Kven-Sami or Kven-Norwegian who
speaks Kvenish on a daily basis respectively) and second generation (Sami/Norwegian-Sami or
Sami/Kven-Sami regardless of language and Kven/Norwegian-Kven or Kven/Sami-Kven
regardless of language). The total Sami and Kven population according to this definition is 19
300 and 7,300 in 1920 respectively (Table 2, Table 4). Individuals of other ethnic groups than
Sami and Kven were registered as Norwegians. This rule also counted even if he or she
married a person from one of the minority groups (Lie 2001).
Comparing the census of 1920 with that of 1930, persons regarding themselves as
Kven from some municipalities of Troms in 1930 reported themselves as Norwegians or Sami
in 1920. Kven in the county of Troms were consequently underestimated, probably by close
to 500 persons (SSB 1933). The underreporting is probably due to the goal of the Norwegian
minority policy to keep the non-Norwegian population at a minimum level in the censuses
(Saressalo 1996). The regional distribution of Kven in Troms 1920, however, was probably
not disturbed by the underreporting. Kven were registered in 53 out of 376 medical districts.
Two thirds of the Kven lived in Finnmark, where they constituted 12 per cent of the total
population (Table 2). In 1920, the Sami population was registered in 91 out of 376 medical
Svenn-Erik Mamelund 18
districts. Near 100 per cent of the population lived in the three northernmost counties (Table
2). The Sami population is probably also undercounted in the 1920-census. First, Sami
moving to the southern parts of Norway were often considered Norwegians. Secondly, due to
the “Norwegianization” policy, many Sami (as well as Kven and the genealogically mixed
population) living in Northern Norway were considered Norwegians if they spoke the
Norwegian language (Steen 1956; Lie 2001). Thirdly, many Sami did not want to admit they
were Sami as they were seen as inferior to Norwegians as well as the Kven. The registration
of ethnicity in the late 19th century censuses is generally, however, known to be good (Hansen
and Meyer 1991). This is probably also the case for the 1920 census.
7.2. Data for dependent variables and their reliability
Reported cases (482,400)13 and deaths (16,000) of influenza and pneumonia, in addition to all
cause mortality (80,000 deaths) in medical districts 1918-1919 are the raw data input for the
dependent variables in this paper (DCM 1922; DCM 1923). Influenza was a reportable
disease in Norway long before 1918, as opposed to most other countries. After some time,
however, it was realised that reported cases of influenza fell short of actual morbidity (DCM
1922). The disease probably struck 1.2 million Norwegians whereas only a third of the cases
were reported (Mamelund 1998). The underreporting is explained by short supply of doctors
(especially in Finnmark), overworked health staff, and physicians hesitating to report the new
disease as influenza in the early phase of the pandemic (Ramberg 1969). In addition, in many
families, doctors were only called to the breadwinner or to the person that had to claim
sickness benefits when reporting unfit for work to a sickness insurance fund (Kristiania
Sundhetskommision 1919). The underreporting was probably lowest in urban and small rural
districts as well as during the highly virulent fall wave of 1918 generally (Skajaa 1921;
13 Cases are new cases reported monthly in the years 1918-1919. According to the influenza-census in
Bergen, 6.5 per cent of those infected during the summer 1918 were-infected in the fall of 1918 (Hanssen
1923). One person could thus be reported with influenza more than once.
Svenn-Erik Mamelund 19
Hanssen 1923; Ramberg 1969).14 In the analysis I assume no spatial or temporal difference in
underreporting.
Although doctors and local health departments were overworked and failed to report
complete morbidity figures, every death was probably reported (Ramberg 1969). In 1918,
cause of death was registered by secondary cause of death, i.e., the last cause that ultimately
ended a person’s life (Backer 1961). Fatal cases usually occurred when Spanish influenza was
followed by pneumonia. As a consequence, pneumonia, not influenza was sometimes
reported as the cause of death (Ramberg 1969). The question of diagnosis is easily solved if
the two causes are analysed together in 1918-1919, and if one assumes no secondary effects
other than pneumonia, as is done in this paper.15 Another motivation for analysing these two
causes of disease and death jointly is that there are few observations (especially influenza-
pneumonia deaths) in the smallest medical districts. All deaths are registered at place of
permanent residence irrespective place of death.
7.3 Definitions of dependent variables
14 If the “Influenza-census” of Bergen is compared to official statistics, only 27.3 per cent of influenza
cases were reported during the mild summer wave of 1918. During the highly virulent fall-wave of 1918,
however, 98 per cent of the cases were reported. An estimated 35.5 per cent of the cases were reported
during the first quarter of 1919 (Hanssen 1923).
15 Another problem, not very different from the question of diagnosis, is how to separate between cases
and deaths caused by Spanish Influenza and cases and deaths that would have come independently of
Spanish Influenza. A way of overcoming the two problems is to calculate “excess” mortality or “net
mortality,” i.e., “gross mortality” subtracting a chosen “normal year” or “normal period,” applying data
for mortality of all causes or influenza-pneumonia. Applying this method, I found that there was little
difference in regional mortality (SMR) in a “normal period” (1915-1917) and the corresponding SMR in
the crisis years 1918-1919. As this method left little variance to be explained (“normal” mortality
explained most of the variance in SMR 1918-1919), the models presented are those considering “gross”
morbidity and mortality.
Svenn-Erik Mamelund 20
The dependent variables in this paper are SMR (standardised mortality ratio), SIR
(standardised incidence ratio) and case fatality rate (lethality) (Table 3). To control for the
peculiar age and sex patterns of morbidity and mortality 1918-1919 and differences in age
and sex composition across medical districts, reported cases and deaths are calculated relative
to expected cases and deaths by age and sex according to a set of standard rates.
[Table 3 approximately here]
The age and sex distributions of the populations in medical districts are taken from the census
of 1920. The age-sex specific incidence rates from the “influenza-census” of Bergen June
1918-March 1919 are used as the standard rates for age-sex morbidity (Hanssen 1923, see
Figure 2). For mortality, the standard consists of the national age-sex specific influenza-
pneumonia death rates and national age-sex specific all cause mortality rates 1918-1919
(DCM 1922-1923 (Table 3, see also Mamelund and Borgan 1996). An SIR or SMR above
100 indicates that the medical district in question has higher (worse than expected) morbidity
or mortality than the standard rates, while ratios below 100 represent lower than average
(better than expected) morbidity or mortality. A lethality ratio is defined as the share of cases
of influenza/pneumonia in a certain district, which resulted in a death due to these causes.
Standardisation is not necessary, since cases and deaths arise from the same population.
7.4. Independent variables
I have utilised three main categories of variables from the census of 1920: ethnicity,
occupation and housing. Table 4 gives definitions and descriptive statistics on these and other
independent variables (Socio-economic status and geography).
[Table 4 approximately here]
8. Methods
Svenn-Erik Mamelund 21
Least squares estimation was applied to estimate an assumed linear relationship between the
independent and the dependent variables. Models for four independent variables are analysed:
1) SMR (total mortality), 2) SMR (Influenza/pneumonia), 3) SIR (Influenza and pneumonia),
and 4) Lethality (influenza/pneumonia). All four variables apply to the period 1918-1919.
They are in logarithmic form, since they cannot attain negative values. Because the SMRs and
the SIRs are not observed, but estimated, weighted least squares (WLS) estimation was
applied, using the inverse of the estimated variance for each SIR or SMR as weights.16
9. Results
The percentage Sami and Kven out of total population are both positively and significantly
associated with total mortality 1918-1919 (Table 5, models 1a and 1b). When possible
confounding factors are not included in the models, an increase by one percentage point in the
share of Sami and Kven populations leads to an increase in SMR of 0.4 and 0.5 per cent
respectively (coefficients not shown in Table 5). When likely and known confounding factors
are controlled for, both minorities still seem to have a positive, significant and independent
effect on total mortality. An increase by one percentage point in the share of Sami and Kven
populations leads to an increase in SMR of around 0.25-0.35 per cent, all other factors the
same (models 1a and 1b).17 The effects of the other socio-economic and regional variables are
basically in the expected direction (to the extent that they were significant).
16 The estimated variance of SMR is D/E2, where D is the observed number of deaths and E the
expected number (Namboodiri 1991:59). The estimated variance of log(SMR) is approximately equal
to (using the Delta method) 1/(SMR)2 * (D/E2) = 1/D. Thus the weight of log(SMR) is equal to D.
Similarly, the weight of log(SIR) equals the observed number of cases.
17 I also tried a model excluding the medical districts of southern Norway without Sami and Kven
population, leaving only medical districts in the counties of Trøndelag, Nordland Troms and Finnmark
(N=124), but found no significant difference in the parameter estimates (for Sami and Kven) compared to
the model for the whole country (N=376).
Svenn-Erik Mamelund 22
The Sami population and the Kven did not affect Spanish influenza morbidity in a
significant way (Table 5, models 2a and 2b). Any assumed effect may be due to confounding
factors such as wealth, crowding, occupational structure, or geography in the districts
concerned. It seems as if those working in the primary sector, i.e., those living in rural areas,
had lower morbidity than those working in the secondary and tertiary sectors living in the
cities (reference groups). This result, however, may be biased because there was less
underreporting in the cities and towns than in rural medical districts. Similarly, the
surprisingly negative but insignificant parameter estimates for Sami and Kven may be due to
underreporting in Finnmark with shortage of doctors and long distances to the nearest doctor.
In addition, only 11 per cent of the population in Finnmark could afford private or public
sickness insurance. As a result, few called a doctor to report unfit for work and to claim
sickness benefits from a sickness insurance fund (Riksforsikringsanstalten 1920). Moreover,
it is reasonable to believe that the Sami practising traditional medicine did not seek
Norwegian district physicians.
Of the two ethnic minorities, only the Sami population is positively, significantly and
independently associated with Spanish influenza mortality (SMR) and lethality (Table 5,
models 3a-b and 4a-b). An increase by one percentage point in the share of Sami population
leads to an increase in SMR and lethality of 0.7-0.8 per cent, all other factors the same. The
effect of the share of Sami is thus stronger on influenza mortality and lethality than for total
mortality. If the likely confounding factors are not included in models 3-4, an increase by one
percentage point in the share of Sami population leads to an increase in SMR and lethality of
0.8 per cent and 1.0 per cent respectively.18 The parameter estimate of Sami lethality must be
18 I also tried a model (for SMR) excluding the medical districts of southern Norway without Sami and
Kven population, leaving only medical districts in the counties of Trøndelag, Nordland Troms and
Finnmark (N=116), but found no significant difference in the parameter estimates (for Sami and Kven)
compared to the model (for SMR) for the whole country (N=351).
Svenn-Erik Mamelund 23
considered with caution. If cases of influenza-pneumonia are underestimated in Sami areas,
lethality is overestimated.
[Table 5 approximately here]
10. Discussion and conclusion
There are few previous studies that have applied multivariate methods to analyse Spanish
Influenza mortality. Previous studies have reported that indigenous populations were the
prime victims of Spanish Influenza. The explanations put forward in those studies were not
convincing, however, as no controls were made for possibly confounding factors. In the
present study I document for the first time that areas with high shares of an indigenous
population, the Norwegian Sami, have high Spanish Influenza mortality and lethality, net of
such confounding factors as wealth, crowding, height (as a proxy of disease and nutritional
history), occupational structure, settlement patterns and diffusion. The cause is probably a
lack of inherited and acquired immunity against influenza among the Sami. Another ethnic
Norwegian minority, Kven, did not differ significantly from the Spanish Influenza mortality
and lethality of the Norwegian majority population. This is probably explained by higher
degree of both inherited and acquired immunity against influenza in the Kven than in the
Sami.
The results of multivariate ecological regressions must be interpreted with caution.
This is especially due to the problem of the ecological fallacy (Thorndike 1939; Robinson
1950; Selvin 1958). The ecological fallacy is linked to the methodological problem of
inferring characteristics of individuals from aggregate data referring to a population. The
finding that results from aggregate studies often do not correspond to the results at the
individual level has created the view that ecological studies only can be used to generate new
hypotheses. Moreover, critics of ecological analysis claim that true causal mechanisms can be
demonstrated at the individual level only (Piantadosi 1994; Poole 1994). Such a view is,
however, somewhat defensive, and only valid if potentially confounding factors are unknown
Svenn-Erik Mamelund 24
or unmeasured (Morgenstern 1982; Cohen 1994; Schwartz 1994). I will discuss the question
of confounding factors and the interpretations of the results of this paper below.
When well-developed theory provides precise hypotheses as to the expected form of
the relationship, ecological regressions can offer strong clues as to individual relationships.
Moreover, if the same relationship is found in different populations from a wide variety of
geographical regions with various socio-economic conditions, a causal interpretation in
ecological analyses is enhanced. The results of this paper confirm the results of previous
papers on the Spanish Influenza among indigenous populations from three corners of the
world, North America, the Pacific and Scandinavia. Well-grounded theory documented in this
paper provided the hypothesis that areas with a high share of Sami-population have high
Spanish Influenza mortality. The results are, as we have seen, in accordance with the
hypothesis.
I have controlled for a range of possible confounding factors in the models. There
may, however, be relevant factors that are not controlled for. Education might be one. As we
know from above, a low level of education among both Sami and Kven may explain high
mortality due to tuberculosis as well as infant mortality (Wessel 1914; Rein 1956). Possibly
the single most important precautionary message from the health authorities during Spanish
Influenza, “go to bed as early as possible when infected, and stay until you feel well” (as was
printed in the papers and elsewhere), probably reached fewer of the lower than the well
educated. Moreover, the poorest in society and the poorest educated classes had probably
fewer chances of being away from work when ill, as they could not live on saved capital and
benefit from sickness insurance. The poor (Sami) were therefore forced to go late to bed, and
probably they did not stay long enough to avoid pneumonia and other bacterial complications
with higher risk of death than influenza.
If one accepts that the models in this paper control for the most important
confounding factors, it can be concluded that a high percentage of Sami make an independent
contribution explaining (high) Spanish Influenza mortality, and that the results also offer
strong clues as to individual causal relationships. The explanation of why Sami had higher
Svenn-Erik Mamelund 25
risks may be genetic and/or epidemiological, i.e., lack of inherited and/or acquired immunity.
Due to lack of roads and poor communications, Spanish Influenza did not reach the inland
grazing land of the nomads in Karasjok and Kautokeino before October 1918 and January 1919
respectively. During the summer (May-September) the nomads are either on the move or at
their summer grazing land closer to the coast. It is possible that the nomads experienced the
mild summer wave of 1918 and that they brought with them the virulent fall virus on their way
to the winter grazing land at the end of 1918.19 Most likely, however, the nomads escaped the
mild summer epidemic, and when they brought with them the fall virus, both nomads and
resident Sami experienced high excess mortality in Karasjok 1918 and Kautokeino 1919. A
large part of the nomads had built themselves winter turf-huts in Karasjok, but a substantial
number also rented rooms of the resident Sami (DCM 1925). As a result of this high degree of
mixing, the virus was easily transmitted from the nomads to the resident Sami. As close to 100
percent of the resident Sami live in rural and often isolated areas that might have missed relative
protection from the mild spring wave, excess influenza-pneumonia mortality in areas with high
shares of Sami was from 350 to 550 per cent (Table 1). This theory is consistent with studies of
Åman (1990) and Linanmäki (2000), which suggest that the high mortality among Sami in
isolated Arjeplog and Enare during the fourth wave in 1920 may largely be due to lack of
immunity from the previous waves.
The Sami may also have escaped the first influenza wave for another reason than relative
isolated settlement patterns per se. The Sami have traditionally tried to prevent and cure
diseases. One way to escape infectious diseases was flight. Sköld (1997) describes how
Swedish Sami in the eighteenth and nineteenth century fled to the mountains to escape
smallpox. The fear, haste and resolution were so great that old people were left at home and
19 I have controlled for the variation in the diffusion of the epidemic, but the variable for diffusion
(experienced summer wave or not) has several major weaknesses. Not everybody is infected although the
virus is registered in a medical district during the summer. In addition, at least 7 per cent of those
previously infected were reinfected (Hanssen 1923).
Svenn-Erik Mamelund 26
relatives infected on the way were left behind. Nothing could induce the Sami to visit infected
people. The result was much lower smallpox mortality rates than those experienced by the
rest of the Swedish population. In the health reports from Finnmark, there are no indications
of Sami leaving for the mountains to escape the summer influenza wave. In Kautokeino,
however, when the nomad winter school opened in the beginning of January 1919, several
Sami were infected by influenza. To reduce further contagion, the Sami escaped into the
mountains to their respective villages (DCM 1922). The destiny of the 60-70 Sami school
children and their parents are not known. The flight came probably too late, however. The
medical district of Alta and Kautokeino had the highest registered excess influenza-
pneumonia mortality of 545 per cent in 1919 (Table 1).
It is also possible that the Sami had little experience with annual influenza epidemics, and
thus low inherited immunity to fight Spanish Influenza. The “virgin soil” hypothesis is
especially relevant for the nomads as they lived at their inland grazing land during the high
season for influenza epidemics (October-April), strongly isolated and far away from other
people and navigable roads. The resident Sami in the nomad areas also lived in relative
isolation, but they lived in more congested households and had more contacts with other
populated regions, and thus higher risk of gaining immunity. Pool (1973) and Tomkins (1992)
have also suggested that low inherited immunity against “European” diseases like influenza
may be the main reason for high Spanish Influenza mortality among natives in New Zealand
and in the Pacific generally. Tuberculosis was almost non-existent among the Sami in
Finnmark until the two last decades of the 19th century (Wessel 1914). The first cases and the
highest incidence and mortality was registered among South-Norwegians moving into
Finnmark. Some years later, however, when tuberculosis gained a foothold, the highest
incidence and mortality was registered among the resident Sami with low inherited immunity
against tuberculosis. In Norbotten county, Sweden, tuberculosis was also more frequent
among resident Sami (3.6%) than among the nomads (2.3%) (Wessel 1914).
Why did not Kven have an independent (or dependent) effect on Spanish Influenza
mortality and lethality? One reason may be that they had some inherited immunity against
Svenn-Erik Mamelund 27
influenza. The question of inherited immunity is debatable, however. The influenza viruses in
annual epidemics change their genetic characteristics by antigenic drifts, and leave only
partial immunity from previous epidemics. The Spanish Influenza pandemic broke out as a
result of antigenic shift. The new virus spread quickly as it found little or no inherited
immunity in the population at risk. There is little or no reason to believe that the last
pandemic before Spanish Influenza, the “Russian Flu” of 1889-1891, left any immunity in
those infected. Several contemporary writers, among them Hanssen (1923), however, have
used this theory to explain why people above 40 years of age were less affected by high
mortality than those in the age bracket 15-40. Anyway, it is more likely that the Kven had
some inherited immunity as they to a larger degree (than the Sami) were assimilated in the
Norwegian society and the money economy (see footnote 12). This was partly due to a
particularly tough “Norwegianization” of the Finnish immigrants and their descendants
(Niemi and Eriksen 1981). Moreover, most of the immigrants did not have a strong national
consciousness, and accepted early assimilation and loyalty to their new homeland. There was
also little difference in the occupational structure of the Kven and the Norwegian population.
The Kven did not show any significant difference in mortality compared to the Norwegians
(reference group). This does not mean that the Kven experienced low mortality. On a national
level, the influenza-pneumonia death rate July 1918-June 1919 was 5.7 per 1,000, and in a
period of less than a year, 15,000 lost their lives (Mamelund 1998).
12. References
Aubert, V. 1967. “Fattigdommen i Norge,” Kontrast 3(1): 10-20.
Backer, J. 1961. Dødeligheten og dens årsaker i Norge 1856-1955 (Trends of mortality and
causes of death in Norway 1856-1955). Samfunnsøkonomiske studier nr. 10. Oslo:
Statistisk sentralbyrå.
Berset, O. 1967. “Samer på et eksistensminimum,” Sosialt Arbeid 41(4): 98-104
Britten, R.H. 1932. “The incidence of epidemic influenza, 1918-19,” Public Health Reports 47(6):
304-339.
Svenn-Erik Mamelund 28
Bryn, H. 1921. Troms Fylkes Antropologi. Videnskapsselskapets Skrifter. 1. Mat-Naturv. Klasse,
No. 20. Kristiania: Jacob Dybwad.
Bryn, H. 1925. Anthropologia Norwegica. I. Det Østenfjeldske Norges Antropologi. Skrifter utgitt av
Det Norske Videnskaps-Akademi i Oslo. 1. Mat-Naturv. Klasse, No. 6. Oslo: Jacob Dybwad.
Bryn, H. and K.E. Schreiner 1929. Die Somatologie der Norweger. Nach Untersuchungen an
Rekruten. Skrifter utgitt av Det Norske Videnskaps-Akademi i Oslo. 1. Mat-Naturv. Klasse,
No. 1. Oslo: Jacob Dybwad.
Brändström, A. 1984. De kärlekslösa mödrarna: spädbarnsdödligheten i Sverige under 1800-
talet med särskilt hänsyn till Nedertorneå. Umeå studies in the humanities; 62. Umeå:
Almqvist & Wiksell International.
Cohen, BL. 1994. “In Defense of Ecological Studies for Testing a Linear-No Threshold
Theory,” American Journal of Epidemiology 139(8): 765-768.
Collins, S.D. 1931. “Age and sex incidence of influenza and pneumonia morbidity and mortality in
the epidemic of 1928-29 with comparative data for the epidemic of 1918-19,” Public Health
Reports 46(33): 1909-1937.
Crosby, A. 1989. America’s Forgotten Pandemic. The Influenza of 1918. Cambridge:
Cambridge University Press.
Det civile medisinalvesen 1921. Sundhetstilstanden og medisinalforholdene 1917, NOS VII.3.
Det civile medisinalvesen 1922. Sundhetstilstanden og medisinalforholdene 1918, NOS
VII.58.
Det civile medisinalvesen 1923. Sundhetstilstanden og medisinalforholdene 1919, NOS
VII.108.
Det civile medisinalvesen 1924. Sundhetstilstanden og medisinalforholdene 1920, NOS
VII.138.
Det civile medisinalvesen 1925. Sundhetstilstanden og medisinalforholdene 1921, NOS
VII.152.
Svenn-Erik Mamelund 29
Echeverri, B. 2001 (forthcoming). “Spanish Influenza seen from Spain,” in Phillips, H. and D.
Killingray (eds.), The 'Spanish' Flu pandemic of 1918: new perspectives. London:
Routledge Social History of Medicine series.
Eriksen, K.E. and E. Niemi 1981. Den finske fare: sikkerhetsproblemer og minoritetspolitikk i
nord 1860-1940. Oslo: Universitetsforlaget.
Forsdahl, A. 1967. “Skoltesamene i Norge,” Tidsskrift for den norske lægeforening 87(14-
15): 1257-1259.
Forsdahl, A. 1973. “Momenter til belysning av den høye dødelighet i Finnmark fylke. Kan
den høye dødelighet i dag være en senfølge av meget dårlige levevilkår i barne- og
ungdomsalderen?,” Tidsskrift for den norske lægeforening 93(10): 661-667.
Forsdahl, A. 1978. “Living conditions in childhood and subsequent development of risk
factors for arteriosclerotic heart disease,” Journal of Epidemiology and Community
health 32: 34-37.
Forsdahl, A. and H. Salmi 1974. “Finnsk-ættede i sør-Varanger kommune – I. En
undersøkelse av levevilkår, kostvaner, røykevaner m.v. i en Finnskættet
befolkningsgruppe,” Tidsskrift for den norske lægeforening 94: 1561-1656.
Forsdahl, A. and H. Salmi 1980. “Finnsk-ættede i Sør-Varanger kommune – III. En
etterundersøkelse i fiskeværet Bugøynes på grunnlag av hjerte- og karundersøkelsene
i Finnmark fylke 1974 og 1977,” Tidsskrift for den norske lægeforening 100(13):
891-894.
Forsdahl, A. and H. Salmi 1990. “Bugøynes-undersøkelsene. Finnskættede i Sør-Varanger
kommune – IV. En etterundersøkelse på grunnlag av hjerte- og karundersøkelsene i
Finnmark fylke 1987,” Tidsskrift for den norske lægeforening 110(18): 891-894.
Forsdahl, A., Salmi, H., Forsdahl, F., Ose, L., and I. Grundt 1974. “Finnsk-ættede i Sør-
Varanger kommune – II. En undersøkelse av blodtrykk, høyde, vekt, triglycerdier og
lipoproteinelektroforse blant Finnskættede menn – samt effekt av en kostendring,”
Tidsskrift for den norske lægeforening 94: 1561-1656.
Svenn-Erik Mamelund 30
Fox, J.P., Hall, C.E., and L.R. Elveback 1970. Epidemiology – Man and Diseases. London:
Macmillan.
Gjessing, R.R. 1934. Die Kautokeinolappen: eine anthropologische studie. Institutt for
sammenlignende kulturforskning. Serie B, skrifter;25. Oslo:Aschehoug & co.
Gjestland, A. 1968. “Spedsbarnsdødeligheten i Finnmark og Nord-Trøndelag 1951-1960,”
Tidsskrift for den norske lægeforening 88(4): 261-267.
Gjestland, A. 1970. “Spedbarnsdødeligheten i Finnmark 1961-1965 i relasjon til 1951-1960,”
Tidsskrift for den norske lægeforening 90(9): 850-852.
Great Britain Ministry of Health 1920. Report on the 1918-19 Pandemic of Influenza. Reports
on Public Health and Medical Subjects. No. 4. London: GBMH.
Hansen, L.I. and T. Meyer 1991. “The ethnic classifications in the late 19th century censuses,”
Acta Borealia. Tidsskrift for Tromsø Museum nr. 2.
Hanssen, O. 1923. Undersøkelser over influenzaens optræden specielt i Bergen 1918-1922.
Arbeider fra Den medicinske Avdeling av Haukeland sykehus. Skrifter utgit ved Klaus
Hanssens Fond. Nr. III. Bergen: A.S. John Griegs Boktrykkeri og N. Nilssen & søn.
Iversen, R. 1959. Finsk på norsk grunn. Trondhjem: Det Kongelig Norske Videnskabers Selskabs
Skrifter 1958, bind II.
Johnson, N.P.A.S. 2000. Aspects of the historical geography of the 1918-19 influenza
pandemic in Britain. Unpublished PhD-thesis. University of Cambridge.
Jonassen, Ø. 1959. “Sosiale og hygieniske forhold i flyttsamenes basisområde,” Tidsskrift for
den norske lægeforening 79(3): 113-118.
Jonassen, Ø. 1964. “Dødfødsler og dødsfall i 1. leveår og det lys de kaster over de sosiale
forhold,” Tidsskrift for den norske lægeforening 84(26): 1396-1404.
Kelm, M.E. 1998. “With all kinds of colours going through the sky: First Nations
perspectives on the influenza pandemic of 1918-19.” Paper presented at the
conference “The Spanish Flu 1918-1998: Reflections of the Influenza Pandemic after
80 years,” Cape Town, South Africa, 12-15 September.
Svenn-Erik Mamelund 31
Kristiania sundhetskommision 1919. Beretning fra Kristiania sundhetskommision og
Kristiania kommunale sykehus for året 1918. Kristiania.
Lie, E. 2001. Nationalities within the nation. Ethnic minorities in Norwegian national
censuses 1845-1930. Unpublished manuscript.
Linanmäki 2000. “Last outbreak of the Spanish Flu in 1920. Influenza in Lapland, Finland.”
Paper presented at the Congress on the History of Medicine, Texas, Galveston, 10-16
September 2000.
Lithell, U-B. 1981. Breast-feeding and reproduction: studies in marital fertility and infant
mortality in 19th century Sweden. Uppsala.
Lithell, U-B. 1988. Kvinnoarbete och barntilsyn i 1700- och 1800-talets Österbotten.
Uppsala: Almquist & Wicksell.
Malcolm, L.A 1974. “Ecological Factors Relating to Child Growth and Nutritional Status,” in
Alexander F. Roche and F. Falkner (eds.), Nutrition and Malnutrition: Identification
and Measurement. New York: Plenum Press, pp. 329-352.
Mamelund, S-E. 1998. Spanskesyken i Norge 1918-1920: Diffusjon og demografiske
konsekvenser. Hovedoppgave (masters thesis) i Samfunnsgeografi høsten 1998.
Institutt for Sosiologi og Samfunnsgeografi, Oslo: Universitetet i Oslo.
Mamelund, S-E. 1999. “Spanskesyken i Norge: Kostnadene og konsekvensene,”
Samfunnsspeilet 13(6): 22-31. Oslo: Statistisk sentralbyrå.
Mamelund, S-E. and J. K. Borgan 1996. Kohort- og periodedødeligheten i Norge 1846-1994
(Cohort and period mortality in Norway 1846-1994). Rapporter 96/9. Oslo-
Kongsvinger: Statistisk sentralbyrå.
McCracken, K. and P. Curson 2001 (forthcoming). “Flu Downunder: A Demographic and
Geographic Analysis of the 1919 Pandemic in Sydney, Australia,” in Phillips, H. and D.
Killingray (eds.), The 'Spanish' Flu pandemic of 1918: new perspectives. London:
Routledge Social History of Medicine series.
Morgenstern, H. 1982. “Uses of Ecological Analysis in Epidemiological Research,” American
Journal of Public Health 72(12): 1336-1344.
Svenn-Erik Mamelund 32
Namboodiri, K. 1991. Demographic analysis. A stochastic approach. San Diego: Academic
Press, Inc.
Nesheim, A. 1979. Samene og deres kultur. Oslo: Tanum-Norli.
Niemi, E. 1977. Oppbrudd og tilpasning. Den Finnske flyttingen til Vadsø 1845-1885. Vadsø:
Vadsø Kommune.
Phillips, H. 1990. Black October: The impact of the Spanish influenza epidemic of 1918 on
South Africa. D.Phil. Thesis. Pretoria: University of Cape Town.
Piantadosi, S. 1994. “Invited Commentary: Ecological Biases,” American Journal of
Epidemiology 139(8): 761-764.
Pool, D.I. 1973. “The effects of the 1918 Pandemic of Influenza on The Maori Population of
New Zealand,” Bulletin of the history of medicine 47(3): 273-281.
Poole, C. 1994. “Ecological Analysis as Outlook and Method,” American Journal of Public
Health 84(5): 715-716.
Prytz, JS. and Forsdahl, A. 1977. “Finnsk- og norskættede i Grue, Åsnes og Våler
kommuner,” Tidsskift for den norske lægeforening 11: 521-253.
Ramberg R. 1969. “Spanskesyken i Norge 1918-1919,” Tidsskift for den norske lægeforening
89(22): 1709-1712.
Rein, K. 1956. “Spedbarnsdødeligheten i Kautokeino 1946-1955,” Tidsskrift for den norske
lægeforening 76(21):815-16.
Rice, G. 1979. “Christchurch in the 1918 Influenza Epidemic. A preliminary study,” New
Zealand Journal of History 13(2): 109-137.
Rice, G. 1988. Black November. The 1918 Influenza Epidemic in New Zealand. Wellington:
Allen & Unwin/Historical Branch.
Riksforsikringsanstalten 1920. Sykeforsikringen for årene 1916-1921. NOS VI. 174.
Kristiania: Riksforsikringsanstalten.
Robinson, W.S. 1950. “Ecological correlations and the behaviour of individuals,” American
Sociological Review 15: 351-357.
Svenn-Erik Mamelund 33
Saressalo, L. 1996. Kveenit. Tutkimus erään pohjoisnorjalaisen vähemmistön identiteetistä.
Helsinki: Suomolaisen Kirjallisuuden Seura.
Schreiner, A. 1930. Die Nord-Norweger. Skrifter utgitt av Det Norske Videnskaps-Akademi I
Oslo 1929. I. Mat.-Naturv. Klasse. No 2. Oslo: Jacob Dybwad.
Schreiner, A. 1932. Anthropologische lokaluntersuchungen in Norge. Hellemo
(Tysfjordlappen). Skrifter utgitt av Det Norske Videnskaps-Akademi I Oslo. I. Mat.-
Naturv. Klasse. No 1. Oslo: Jacob Dybwad.
Scrimshaw, N.S, C.E. Taylor and J.E. Gordon 1959. “Interactions of Nutrition and Infection,”
American Journal of the Medical Sciences March: 367-403.
Schwartz, S. 1994. “The Fallacy of the Ecological Fallacy: The Potential Misuses of a
Concept and the Consequences,” American Journal of Public Health 84(5): 819-824.
Selvin, HC. 1958. “Durkheim’s suicide and the problems of empirical research,” American
Journal of Sociology 63: 607-619.
Shortridge, KF. 1999. “The 1918 ‘Spanish Flu’: Pearls from swine?,” Nature Medicine 5(4):
384-385.
Skajaa, Kr. 1921. Om influenza og influenzapneumoni. En patologisk-anatomisk og bakteriologisk
undersøkelse. Skrifter utgit ved Klaus Hanssens fond. Nr. II. Fra dr. med. F.G. Bergen: Gades
patologiske institutt.
Skog, O.J. 1998. Å forklare sosiale fenomener. En regresjonsbasert tilnærming. Oslo: Ad
Notam Gyldendal.
Sköld, P. 1997. “Escape from catastrophe: The Saami’s experience with smallpox in Eighteenth- and
Nineteenth-century Sweden,” Social Science History 21(1): 1-25.
Soltow, L. 1965. Toward Income Equality in Norway. Madison-Milwaukee: The University of
Wisconsin Press.
Statistisk sentralbyrå 1917. Dyrtidens virkninger på levevilkaarene. 1ste del. NOS VI 105. Kristiania:
Aschehoug.
Statistisk sentralbyrå 1918a. Dyrtidens virkninger på levevilkaarene. 2den del. NOS VI 124. Kristiania:
Aschehoug.
Svenn-Erik Mamelund 34
Statistisk sentralbyrå 1918b. Lønninger og levevilkaar i Norge under verdenskrigen. NOS VI
141. Kristiania: Aschehoug.
Statistisk sentralbyrå 1920. “Skatteligningen for aaret 1918-19,” Meddelelser fra Det
Statistiske Centralbyrå, 37(9-10): 105-121. NOS. Kristiania.
Statistisk sentralbyrå 1922a. Fattigvesenet 1918 og 1919. NOS VII. 38. Kristiania.
Statistisk sentralbyrå 1922b. Folketellingen i Norge 1. Desember 1920: Folkemengde og areal
i Rikets Fforskjellige deler. Første hefte. NOS VII. 39. Kristiania.
Statistisk sentralbyrå 1923a. Folketellingen i Norge 1. Desember 1920. Boligstatistikk – Byer.
Syvende hefte. NOS VII. 98. Kristiania.
Statistisk sentralbyrå 1923b. Folketellingen i Norge 1. Desember 1920. Folkemengden fordelt
efter livsstilling. Fjerde hefte. NOS VII. 103. Kristiania.
Statistisk sentralbyrå 1923c. Folketellingen i Norge 1. Desember 1920: Folkemengden fordelt
efter fødested. - Finnner og Kvener. –Andre lands statsborgere. –Norsk-Amerikanere.
NOS VII. 81. Kristiania.
Statistisk sentralbyrå 1924. Folketellingen i Norge 1. Desember 1920. Boligstatistikk –
Bygder. Åttende hefte. NOS VII. 144. Kristiania.
Statistisk sentralbyrå 1926. Folketellingen i Norge 1. Desember 1920: Oversikt over
livsstillingsstatistikken og tellingenes utførelse. NOS VII. 161. Kristiania.
Statistisk sentralbyrå 1933. Folketellingen i Norge 1. Desember 1930. Samer og kvener. –
Andre lands statsborgere. Blinde, døvstumme, åndssvake, og sinnsyke. NOS IX. 17.
Kristiania.
Steele, V.W. 1998. “The 1918 Influenza Epidemic in Montana”. Paper presented at the
conference The Spanish Flu 1918-1998: Reflections of the Influenza Pandemic after
80 years, Cape Town, South Africa, 12-15 September.
Steen, A. 1956. Kautokeinostudier. Samiske samlinger, Bind III. Oslo: Norsk Folkemuseum.
Steen, A. 1961. “Alder og alderdomsproblemer hos Samene,” Norske Gerontologiske Skrifter
6: 5-20.
Svenn-Erik Mamelund 35
Sundt, H. 1913. “Nogen boligundersøkelser og litt om boligforholdene i Finnmarken,”
Tidsskrift for den norske lægeforening 33(14): 657-668.
Sydenstricker, E. 1931. “The Incidence of Influenza among Persons of Different Economic
Status During the Epidemic of 1918,” Public Health Reports 46(4): 154-170.
Thorndike, E.L. 1939. “On the fallacy of imputing the correlations found for groups to the
individuals or smaller groups composing them,” American Journal of Psychology 52:
122-124.
Thorvaldsen, G. 2001 (forthcoming). “Infant and Child Mortality in Norway - an Overview,”
in Sköld, P. and G. Tedebränd (eds.), Scandinavian Population Studies, vol. 13.
Tomkins, S.M. 1992. “The Influenza Epidemic of 1918-19 in Western-Samoa,” Journal of Pacific
History [Australia] 27(2): 181-197.
Torgersen, J. 1956. “Noen populasjonsgenetiske data fra samene,” Tidsskrift for den norske
lægeforening 76(21): 809-811.
Vaughan, W.T. 1921. Influenza. An Epidemiological Study. The American Journal of
Hygiene. Monopgraph Series. No. 1. Baltimore: The American Journal of Hygiene.
Vorren, Ø. And E. Manker 1976. Same-kulturen. Oslo: Universitetsforlaget.
Wessel, A.B. 1914. “Tuberkulosen i Finnmark, - særlig dens forhold til boligstellet,”
Tidsskrift for den norske lægeforening 34(5-7): 222-230, 273-281, 310-326.
Waaler, H. Th. 1984. “Height, Weight and Mortality. The Norwegian Experience,” Acta
Medica Scandinavica. Supplementum 679. Stockholm: Amquist & Wicksell.
Åman, M. 1990. Spanska Sjukan. Den svenska epidemin 1918-1920 och dess internationella
bakgrund (Spanish Influenza. The Swedish Epidemic, 1918-1920, and its
International Background). Historiska Institutionen, Uppsala Universitet. Stockholm:
Almqvist & Wiksell International.
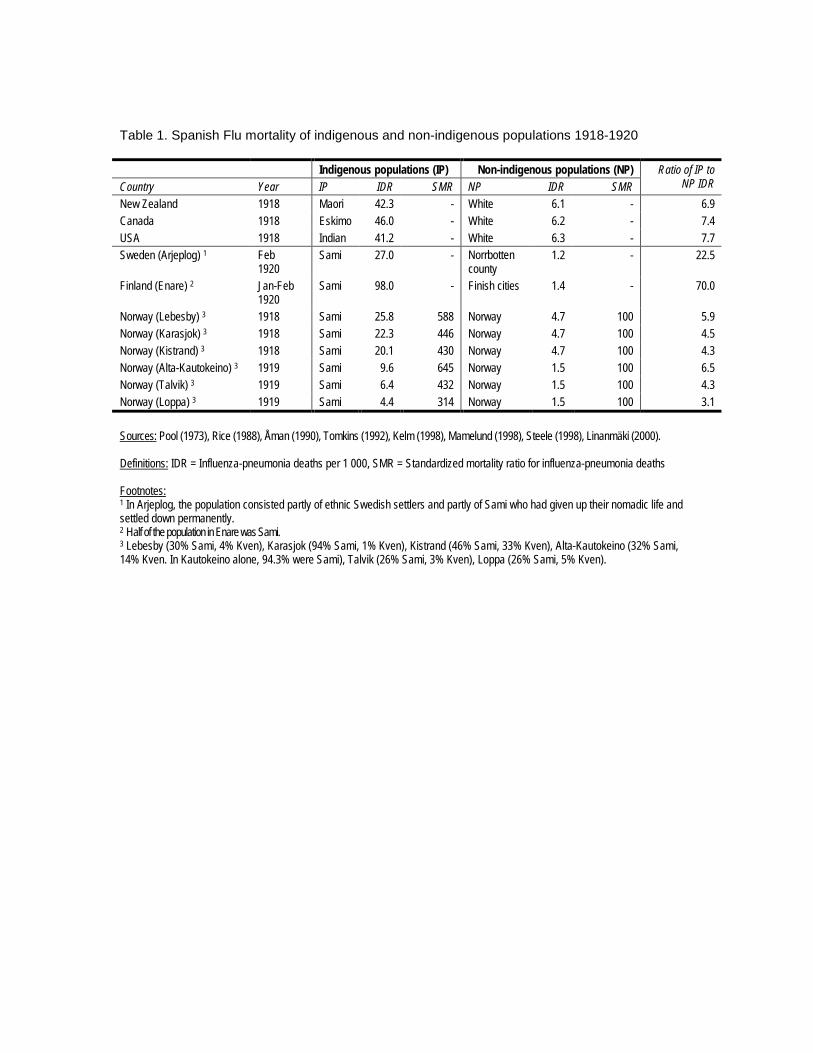
Table 1. Spanish Flu mortality of indigenous and non-indigenous populations 1918-1920
Indigenous populations (IP) Non-indigenous populations (NP)Country Year IP IDR SMR NP IDR SMR
Ratio of IP toNP IDR
New Zealand 1918 Maori 42.3 - White 6.1 - 6.9Canada 1918 Eskimo 46.0 - White 6.2 - 7.4USA 1918 Indian 41.2 - White 6.3 - 7.7Sweden (Arjeplog) 1 Feb
1920Sami 27.0 - Norrbotten
county1.2 - 22.5
Finland (Enare) 2 Jan-Feb1920
Sami 98.0 - Finish cities 1.4 - 70.0
Norway (Lebesby) 3 1918 Sami 25.8 588 Norway 4.7 100 5.9Norway (Karasjok) 3 1918 Sami 22.3 446 Norway 4.7 100 4.5Norway (Kistrand) 3 1918 Sami 20.1 430 Norway 4.7 100 4.3Norway (Alta-Kautokeino) 3 1919 Sami 9.6 645 Norway 1.5 100 6.5Norway (Talvik) 3 1919 Sami 6.4 432 Norway 1.5 100 4.3Norway (Loppa) 3 1919 Sami 4.4 314 Norway 1.5 100 3.1
Sources: Pool (1973), Rice (1988), Åman (1990), Tomkins (1992), Kelm (1998), Mamelund (1998), Steele (1998), Linanmäki (2000).
Definitions: IDR = Influenza-pneumonia deaths per 1 000, SMR = Standardized mortality ratio for influenza-pneumonia deaths
Footnotes:1 In Arjeplog, the population consisted partly of ethnic Swedish settlers and partly of Sami who had given up their nomadic life andsettled down permanently.2 Half of the population in Enare was Sami.3 Lebesby (30% Sami, 4% Kven), Karasjok (94% Sami, 1% Kven), Kistrand (46% Sami, 33% Kven), Alta-Kautokeino (32% Sami,14% Kven. In Kautokeino alone, 94.3% were Sami), Talvik (26% Sami, 3% Kven), Loppa (26% Sami, 5% Kven).
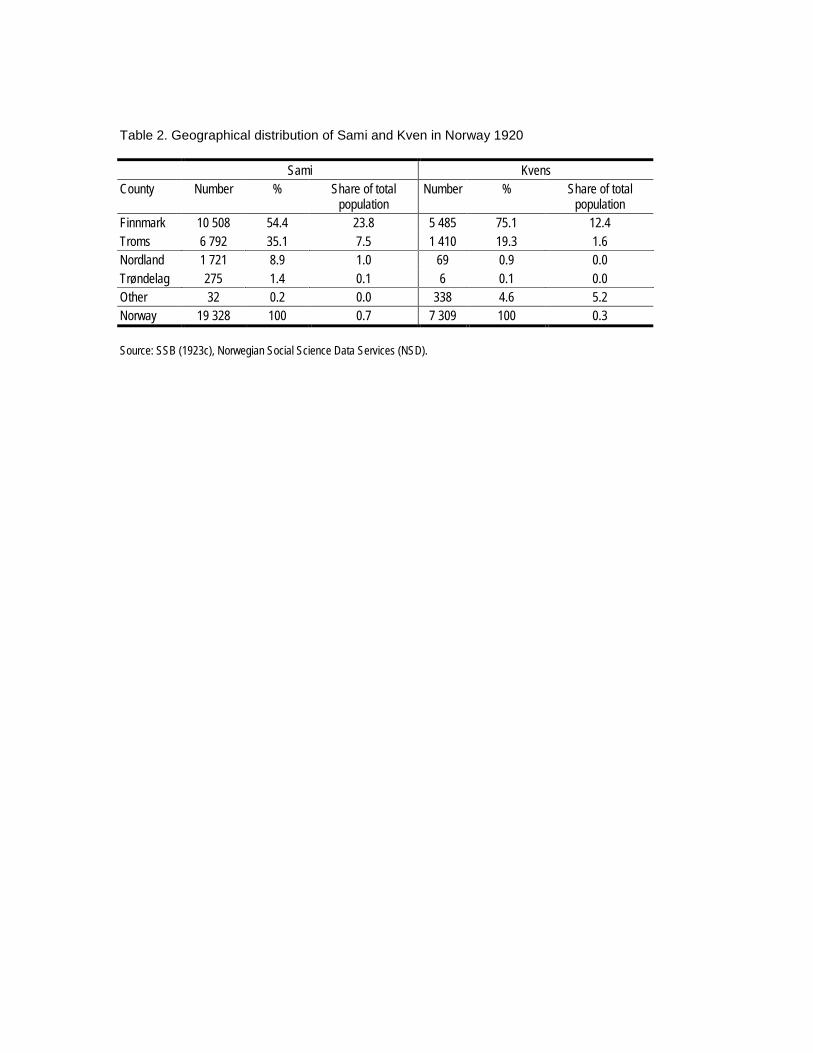
Table 2. Geographical distribution of Sami and Kven in Norway 1920
Sami KvensCounty Number % Share of total
populationNumber % Share of total
populationFinnmark 10 508 54.4 23.8 5 485 75.1 12.4Troms 6 792 35.1 7.5 1 410 19.3 1.6Nordland 1 721 8.9 1.0 69 0.9 0.0Trøndelag 275 1.4 0.1 6 0.1 0.0Other 32 0.2 0.0 338 4.6 5.2Norway 19 328 100 0.7 7 309 100 0.3
Source: SSB (1923c), Norwegian Social Science Data Services (NSD).
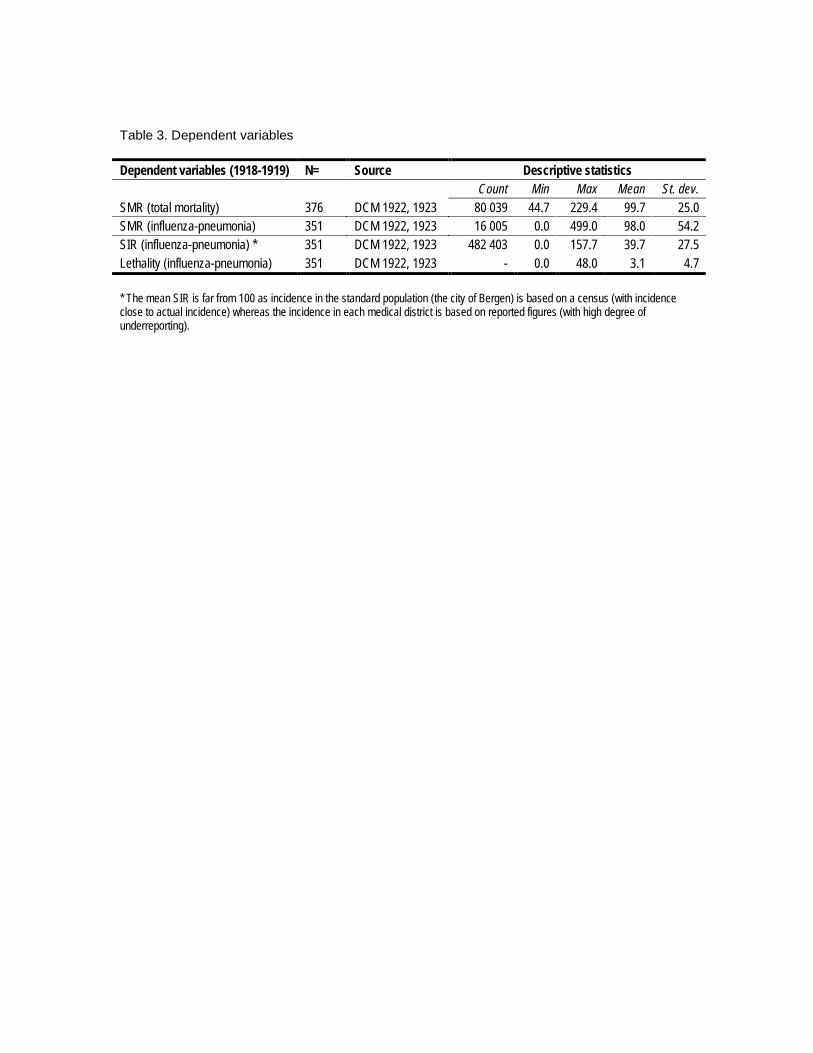
Table 3. Dependent variables
Dependent variables (1918-1919) N= Source Descriptive statisticsCount Min Max Mean St. dev.
SMR (total mortality) 376 DCM 1922, 1923 80 039 44.7 229.4 99.7 25.0SMR (influenza-pneumonia) 351 DCM 1922, 1923 16 005 0.0 499.0 98.0 54.2SIR (influenza-pneumonia) * 351 DCM 1922, 1923 482 403 0.0 157.7 39.7 27.5Lethality (influenza-pneumonia) 351 DCM 1922, 1923 - 0.0 48.0 3.1 4.7
* The mean SIR is far from 100 as incidence in the standard population (the city of Bergen) is based on a census (with incidenceclose to actual incidence) whereas the incidence in each medical district is based on reported figures (with high degree ofunderreporting).
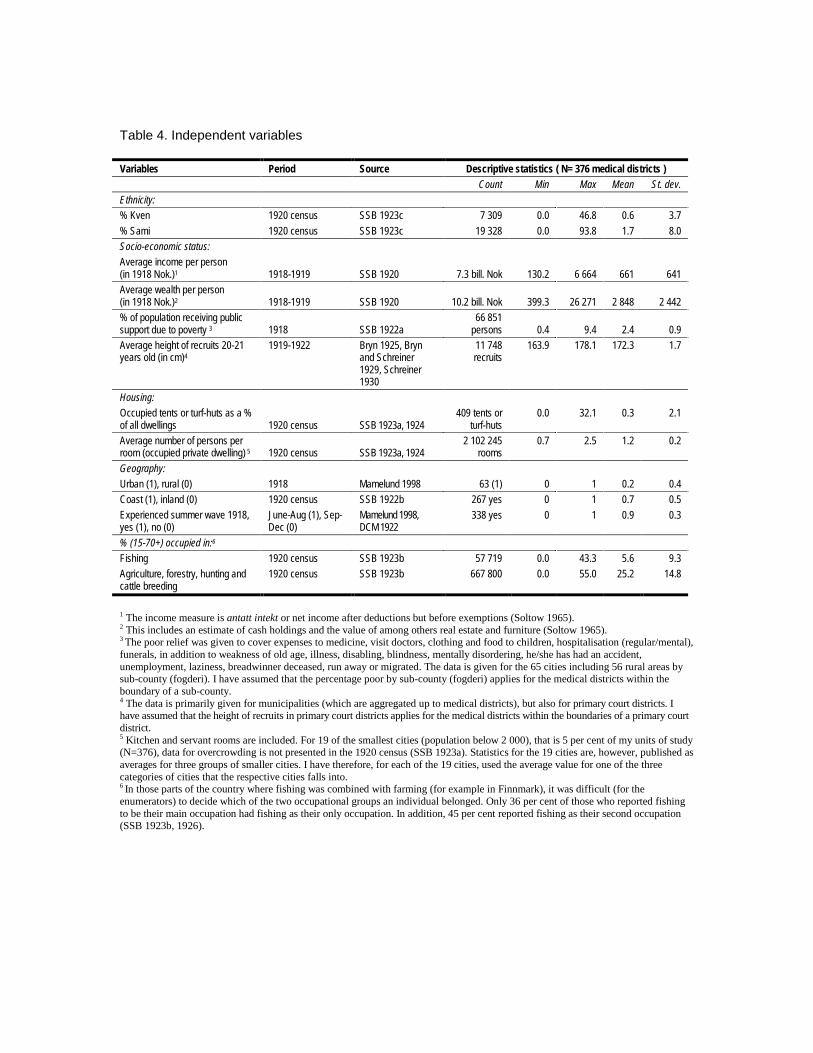
Table 4. Independent variables
Variables Period Source Descriptive statistics ( N= 376 medical districts )Count Min Max Mean St. dev.
Ethnicity:% Kven 1920 census SSB 1923c 7 309 0.0 46.8 0.6 3.7% Sami 1920 census SSB 1923c 19 328 0.0 93.8 1.7 8.0Socio-economic status:Average income per person(in 1918 Nok.)1 1918-1919 SSB 1920 7.3 bill. Nok 130.2 6 664 661 641Average wealth per person(in 1918 Nok.)2 1918-1919 SSB 1920 10.2 bill. Nok 399.3 26 271 2 848 2 442% of population receiving publicsupport due to poverty 3 1918 SSB 1922a
66 851persons 0.4 9.4 2.4 0.9
Average height of recruits 20-21years old (in cm)4
1919-1922 Bryn 1925, Brynand Schreiner1929, Schreiner1930
11 748recruits
163.9 178.1 172.3 1.7
Housing:Occupied tents or turf-huts as a %of all dwellings 1920 census SSB 1923a, 1924
409 tents orturf-huts
0.0 32.1 0.3 2.1
Average number of persons perroom (occupied private dwelling) 5 1920 census SSB 1923a, 1924
2 102 245rooms
0.7 2.5 1.2 0.2
Geography:Urban (1), rural (0) 1918 Mamelund 1998 63 (1) 0 1 0.2 0.4Coast (1), inland (0) 1920 census SSB 1922b 267 yes 0 1 0.7 0.5Experienced summer wave 1918,yes (1), no (0)
June-Aug (1), Sep-Dec (0)
Mamelund 1998,DCM 1922
338 yes 0 1 0.9 0.3
% (15-70+) occupied in:6
Fishing 1920 census SSB 1923b 57 719 0.0 43.3 5.6 9.3Agriculture, forestry, hunting andcattle breeding
1920 census SSB 1923b 667 800 0.0 55.0 25.2 14.8
1 The income measure is antatt intekt or net income after deductions but before exemptions (Soltow 1965).2 This includes an estimate of cash holdings and the value of among others real estate and furniture (Soltow 1965).3 The poor relief was given to cover expenses to medicine, visit doctors, clothing and food to children, hospitalisation (regular/mental),funerals, in addition to weakness of old age, illness, disabling, blindness, mentally disordering, he/she has had an accident,unemployment, laziness, breadwinner deceased, run away or migrated. The data is given for the 65 cities including 56 rural areas bysub-county (fogderi). I have assumed that the percentage poor by sub-county (fogderi) applies for the medical districts within theboundary of a sub-county.4 The data is primarily given for municipalities (which are aggregated up to medical districts), but also for primary court districts. Ihave assumed that the height of recruits in primary court districts applies for the medical districts within the boundaries of a primary courtdistrict.5 Kitchen and servant rooms are included. For 19 of the smallest cities (population below 2 000), that is 5 per cent of my units of study(N=376), data for overcrowding is not presented in the 1920 census (SSB 1923a). Statistics for the 19 cities are, however, published asaverages for three groups of smaller cities. I have therefore, for each of the 19 cities, used the average value for one of the threecategories of cities that the respective cities falls into.6 In those parts of the country where fishing was combined with farming (for example in Finnmark), it was difficult (for theenumerators) to decide which of the two occupational groups an individual belonged. Only 36 per cent of those who reported fishingto be their main occupation had fishing as their only occupation. In addition, 45 per cent reported fishing as their second occupation(SSB 1923b, 1926).

Table 5. Results of linear regression analyses for total mortality and Spanish Influenza incidence, mortality and lethality in Norway 1918-1919
Model 1a Model 1b5 Model 2a Model 2b5 Model 3a Model 3b5 Model 4a Model 4b5
Dependent variable LogSMR,all causes 1
LogSMR,all causes 1
LogSIR,Influenza-pneumonia
LogSIR,Influenza-pneumonia
LogSMR,Influenza-pneumonia
LogSMR,Influenza-pneumonia
Loglethality,Influenza-pneumonia
Loglethality,Influenza-pneumonia
Percentage Sami 2 0.0025*** 0.0031*** - 0.0014 - 0.0049 0.0072*** 0.0068*** 0.0080*** 0.0071***Percentage Kven 2 0.0031** 0.0035*** - 0.0042 - 0.0056 - 0.0004 - 0.0012 0.0070 0.0081Average height of recruits (in cm) 3 - 0.0034 - 0.0067*** - 0.0094 0.0011 - 0.0012 - 0.0039 0.0140 - 0.0067Percentage of population receiving public support due to poverty 0.0191*** 0.0062 0.0035 - 0.0135 - 0.0011 - 0.0001 - 0.0679*** - 0.0392*Wealth per person 4 - 0.0058*** - 0.0106*** - 0.0133** - 0.0069 - 0.0123*** - 0.0108*** - 0.0123 - 0.0080Average number of persons per room 0.0104 0.0170 - 0.0360** - 0.0355** - 0.0043 - 0.0071 0.0097 - 0.0031Percentage of population (15+) employed in fishing 5 0.0016*** - - 0.0136*** - - 0.0005 - 0.0123*** -Percentage of population (15+) employed in agriculture, forestry, hunting and cattle breeding 5 - 0.0010*** - - 0.0043*** - - 0.0017*** - 0.0030*** -Coast (1), inland (0) 6 - - 0.0032 - - 0.1449*** - 0.0287 - 0.2388***Urban (1), rural (0) 6 - 0.0836*** - 0.2507*** - 0.0540 - - 0.2912***Experienced summer wave 1918, yes (1), no (0) - - - - 0.0338 - - 0.0583 - - 0.0839Constant 2.5445*** 3.1238*** 3.5092* 1.6611 2.3150* 2.7514 -2.1095 1.5233N 376 376 351 351 351 351 351 351Adjusted R2 0.2716 0.3044 0.2007 0.2533 0.1011 0.1134 0.2163 0.2687* p < 0.10, ** p < 0.05, *** p < 0.011 19 per cent of the deaths in 1918-1919 (15 000 out of 80 000) are due to Spanish Influenza (Mamelund 1998).2 The reference category is percentage Norwegians.3 The relatively high correlation between the Sami population and height (r = - 0.66) cause multicolinearity. Therefore estimated standard errors for the effect of heightand Sami were corrected by coefficients from Skog (1998:274). (a correlation of 0.7 give 40 per cent higher standard error).4 Income per person is not included as an independent variable in the model as the correlation between income and wealth is high (r = 0.83). Similarly, the percentage ofpersons living in turf-huts/tents is not included in the model as this variable is strongly correlated with the percentage of Sami (r = 0.78).5 The reference category is percentage of population (15+) occupied in Industry and service (trade, transportation etc.)6 In model 1b, 2b, 3b and 4b, percentage occupied in agriculture etc. is not included as this variable is highly correlated with the urban-rural variable (r = - 0.73) as well aswith the cost-inland variable (r = - 0.43). The percentage occupied in fishing is also relatively strongly correlated with the cost-inland variable (r = 0.46)
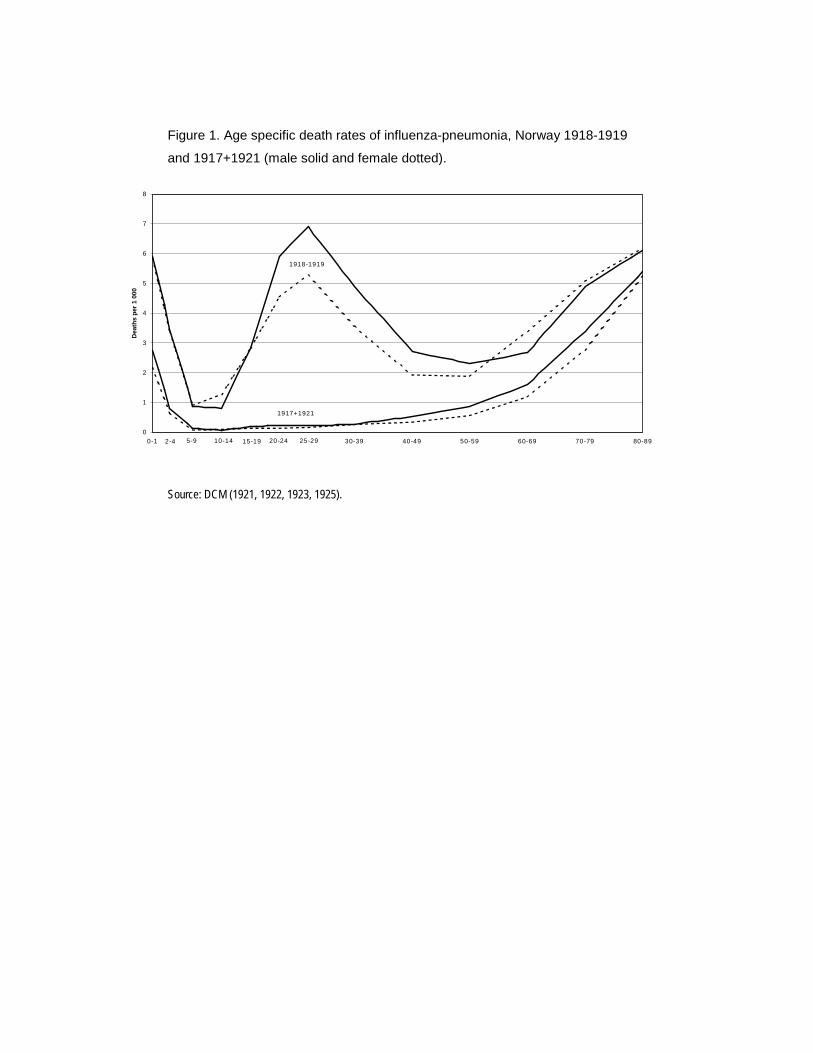
Figure 1. Age specific death rates of influenza-pneumonia, Norway 1918-1919
and 1917+1921 (male solid and female dotted).
Source: DCM (1921, 1922, 1923, 1925).
0
1
2
3
4
5
6
7
8
0-1 30-39 40-49 50-59 60-69 70-79 80-89
Dea
ths
per 1
000
5-92-4 10-14 15-19 20-24 25-29
1918-1919
1917+1921
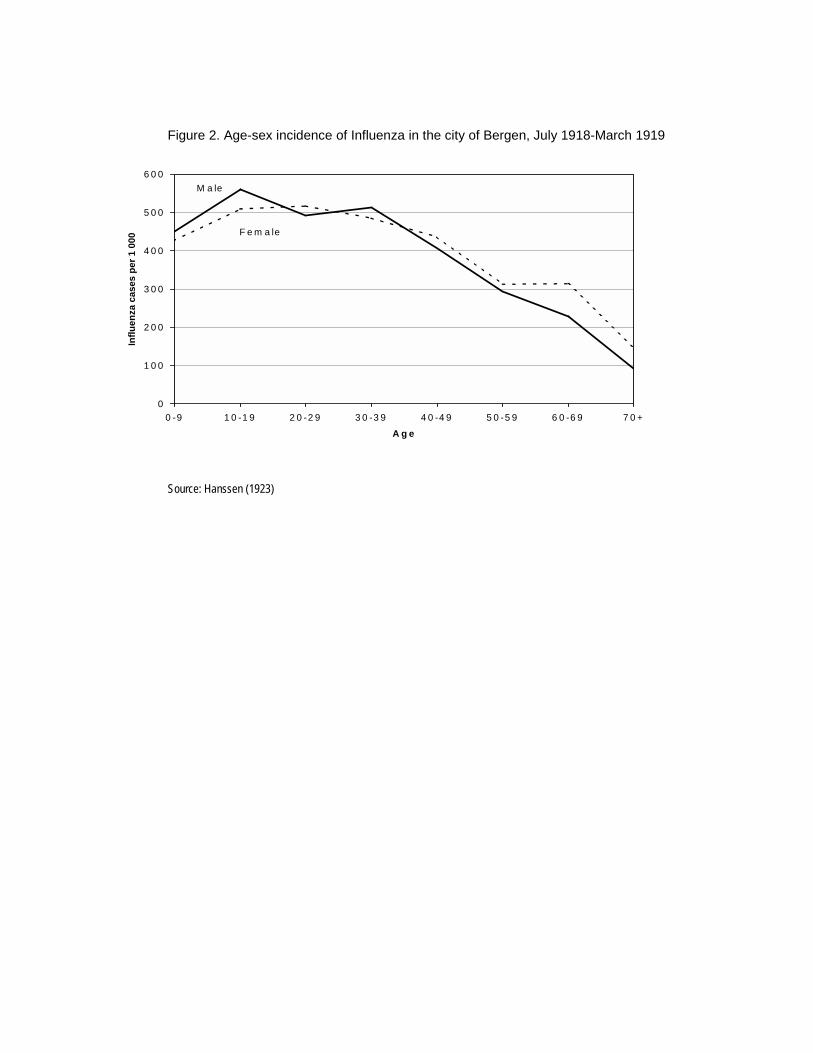
Figure 2. Age-sex incidence of Influenza in the city of Bergen, July 1918-March 1919
Source: Hanssen (1923)
0
1 0 0
2 0 0
3 0 0
4 0 0
5 0 0
6 0 0
0 -9 1 0 -1 9 2 0 -2 9 3 0 -3 9 4 0 -4 9 5 0 -5 9 6 0 -6 9 7 0 +
A g e
Influ
enza
cas
es p
er 1
000
M a le
F e m a le
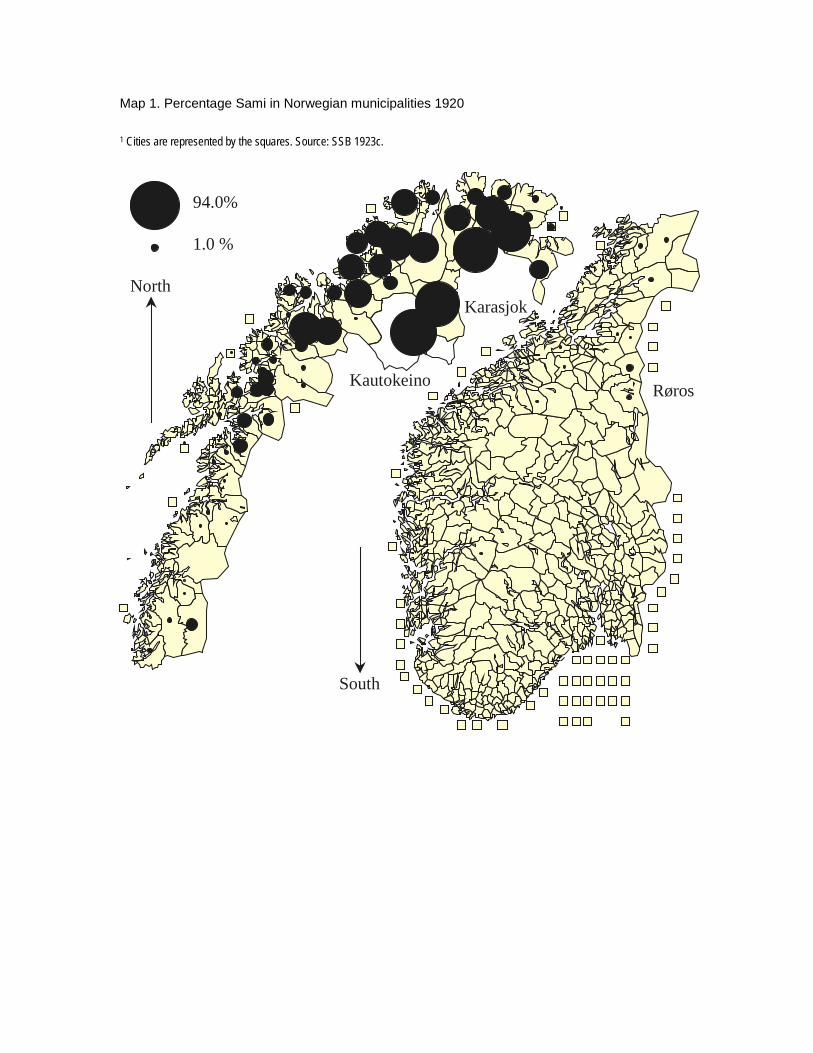
Map 1. Percentage Sami in Norwegian municipalities 1920
1 Cities are represented by the squares. Source: SSB 1923c.
94.0%
1.0 %
North
South
Kautokeino
Karasjok
Røros
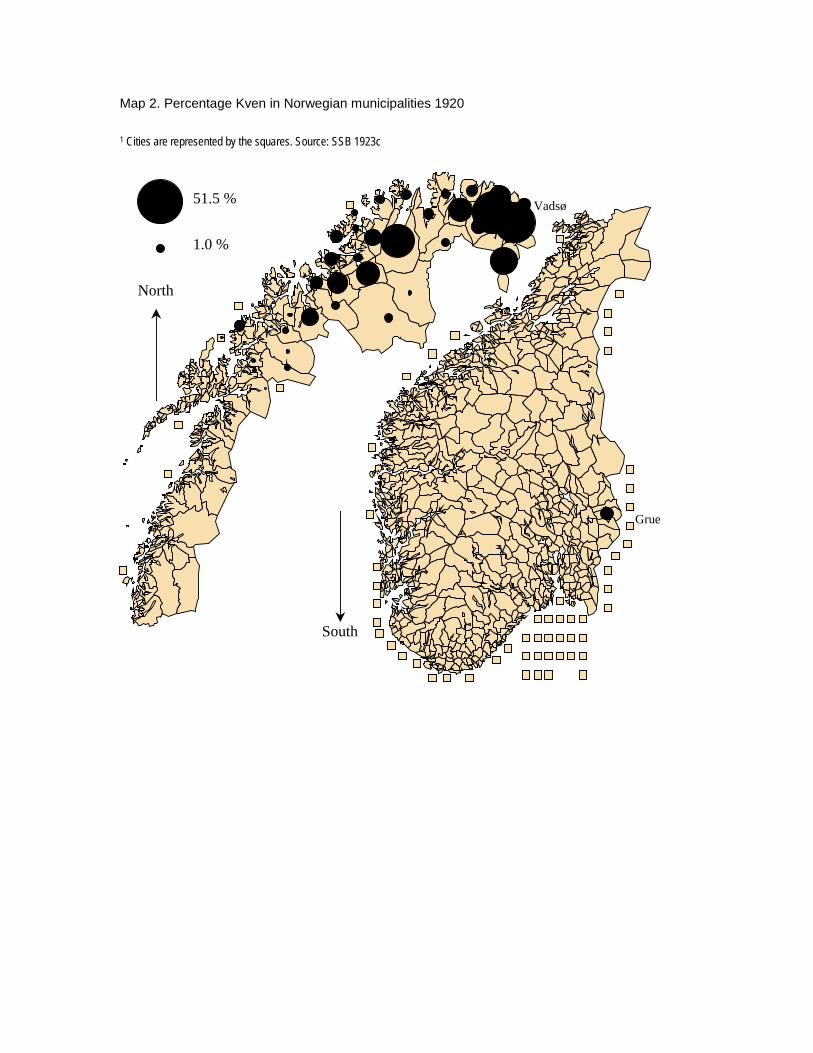
Map 2. Percentage Kven in Norwegian municipalities 1920
1 Cities are represented by the squares. Source: SSB 1923c
51.5 %
1.0 %
Grue
Vadsø
North
South