Embed Size (px)
Citation preview

THE SOUTH-NORTH WATER TRANSFER PROJECT: A COST-BENEFIT ANALYSIS
by
Margaret Louise Mallonée
Bachelor of Philosophy Candidate in International and Areas Studies, University of Pittsburgh, 2016
Submitted to the Graduate Faculty of
The University of Pittsburgh in partial fulfillment
of the requirements for the degree of
Bachelor of Philosophy
University of Pittsburgh
2016

i
UNIVERSITY OF PITTSBURGH
UNIVERSITY HONORS COLLEGE
This thesis was presented
by
Margaret Louise Mallonée
It was defended on
March 16, 2016
and approved by
Jennifer Turner, PhD., Director, China Environment Forum & Manager, Global Choke Point Initiative China Environment Forum, Woodrow Wilson International Center for Scholars
James Cook, PhD., Asian Studies Center, University of Pittsburgh
Paul Noroski, PhD., Department of Economics, University of Pittsburgh
Thesis Advisor: Thomas Rawski, PhD., Department of Economics, University of Pittsburgh

ii
Copyright © Margaret Louise Mallonée 2016

iii
THE SOUTH-NORTH WATER TRANSFER PROJECT: A COST-BENEFIT ANALYSIS
Margaret Louise Mallonée, Bachelor of Philosophy
University of Pittsburgh, 2016
China possesses the fifth largest endowment of fresh water resources in the world, but by
per capita standards, it is strained at one-third of the world average. Water scarcity is particularly
concerning for the semi-arid North China plain, which receives only a fraction of the precipitation
South China receives. However, North China contains some of China’s most important city,
including the capital city, Beijing. To help meet increasing water demands, the Chinese Central
Government authorized the expansion of the South-North Water Transfer Project (SNWTP).
Policy-makers world-wide argue that the SNWTP’s costs exceed its benefits because it is only
short-term solution for China’s long-term water scarcity problem and does not solve the difficulty
of high water demand for a limited freshwater supply. To test this theory, this project runs a cost-
benefit analysis on the SNWTP’s central route’s costs and benefits to Beijing over a 20 year test
period. The analysis shows that the benefits of the SNWTP exceed its costs. Because the
SNWTP’s central route has only been in use for one year, data is limited. For these reasons, this
project also shows that the SNWTP’s costs may exceed its benefits in the long-run, but additional
research, particularly a field study along the SNWTP’s central route and in South China, is needed
to show the impacts of water diversion on these regions and also assess the energy footprint of this
project.

iv
TABLE OF CONTENTS
PREFACE………………………………………………………………………………………VII
1.0 INTRODUCTION................................... ………………………………………………...1
2.0 WATER SCARCITY IN NORTH CHINA……………………………………………... 3
2.1 CONTINUED DEPLETION OF WATER SUPPLY...........……………………….4
2.2 INCREASING WATER DEMAND………………………………………………8
3.0 THE SOUTH-NORTH WATER TRANSFER PROJECT................................................12
3.1 CONTROVERSIES……………………………………………………...............13
4.0 IMPACTS ON POLICIES…..………………………………………...............................18
4.1 IMPACTS ON WATER TEN…………………………………………...............20
5.0 METHODOLGY……………………………………………………………...................22
5.1 PREVIOUS STUDY……………………………………………………………..22
5.2 COST-BENEFIT ANALYSIS…………………………………………………...24
5.2.1 Variables Assessed…………………………………………………………25
5.2.2 Values for Variables……………………………………………………….26
5.3 RESULTS……………………………………………………………..…………27
5.3.1 DISCUSSION ON RESULTS……………………………………..…….28
5.3.2 LIMITATIONS……………………………………………………..……28
5.3.3 ALTERNATIVES………………………………………………………..30

i
6.0 CONCLUSION…………………………………………………………………………..34
APPENDIX A. PRESENT VALUE BENEFITS AND COSTS...................................................35
BIBLIOGRAPHY ......................................................................................................................... 49

i
LIST OF TABLES
Table 1: WWF’s Estimates of Water Delivery Costs at Points Along the SNWTP…………….23
Table 2: Initial and Annual Cost and Benefit Variables Assessed………………………………25
Table 3: Numeric Values for Variables Used to Calculate Present Value Benefits and Costs….26
Table 4: Results: Present Value Benefits and Costs……………………………………………..26
Table 5: Benefits of GDP Growth Assumed……………………………………………………..38
Table 6: Households’ Assumed Annual Water Consumption…………………………………...40
Table 7: Industries’ Annual Water Consumption………………………………………………..41
Table 8: Consumers’ Assumed Annual Water Consumption……………………………………42
Table 9: Consumers’ Assumed Percentage Share of Annual Water……………………………..43
Table 10: Consumers’ Assumed Consumption of SNWTP Water………………………………44
Table 11: Consumers’ Annual Monetary Equivalent Benefit of SNWTP Water………………..45
Table 12: Total Annual Benefit to Beijing with Respect to Varying Increases to GDP………...46
Table 13: Variables Used to Calculate Present Value Benefits and Costs………………………47
Table 14: Present Value Benefits and Costs……………………………………………………..48
ii
List of Figures
Figure 1: Present Value Benefits and Costs Over 20 Years……………………………………..27

iii
PREFACE
This project is the result of support and guidance from many people. Thank you to Professor
Peili Zhang from Renmin University, Professor Shi Yaojiang from Shaanxi Normal University,
and Dr. James Cook from the University of Pittsburgh for allowing me to discuss this topic—and
practice my Chinese in the process—during my stay in Beijing in 2015. Additionally, I want
to express my gratitude to Ms. Haihui Zhang and Ms. Xiuying Zou, the University of Pittsburgh’s
East Asian Librarians. Without their help and patience, it would not have been possible to find
the data and some of the most important sources used in this thesis. I also want to thank Dr. Paul
Noroski from the University of Pittsburgh for helping me with the calculations and allowing
me to discuss roadblocks over the duration of this project. I want to express my deepest
gratitude to my thesis advisor, Dr. Thomas Rawski from the University of Pittsburgh. Thank you
for encouraging me to keep pursing this research project—when others said otherwise—;
providing the perfect balance of constructive feedback and thought provoking guidance; and
teaching me how to handle unexpected turns in research.
I extend my warmest thanks to University of Pittsburgh faculty members, Dr. Thomas
Rawski, Dr. Paul Noroski, and Dr. James Cook, as well as Dr. Jennifer Turner, Director of the
China Environment Forum and Manager of the Global Choke Point Initiative at the Woodrow
Wilson International Center for Scholars, for being on my thesis defense committee on March, 16th
2016. Their expert comments and thoughtful questions have allowed me to increase my
understanding on this expansive topic, and discuss where next I could take this research.
Finally, I want to thank my family and friends for their continued support. To one family
member in particular, John: thank you for teaching me at a young age that there is more to the
world than what is outside my doorstep and the joy in foreign culture and adventure. You are
deeply missed today.
1
1.0 INTRODUCTION
China possesses the fifth largest endowment of fresh water resources in the world, but by per capita
standards, it is strained at one-third of the world average. The semi-arid North China plain receives
only a fraction of South’s China precipitation, yet produces a large amount of China’s agricultural
output and is home to many important cities, including the capital city, Beijing. To help meet
water demands, the Chinese Central Government authorized the expansion of the South-North
Water Transfer Project to divert nearly 13 billion cubic meters of water from the south to north.
The Chinese Central Government warns that despite existing water-saving measures China’s water
demand will exceed supply by 2030 (Gleick, et all, 2009). China’s projected water demand for
2030—818 billion cubic meters—will outstrip current supply, which only amounts to 618 billion
cubic meters (Gleick, et all, 2009).
For the purpose of brevity and depth in an expansive topic, I focus on water scarcity in
Beijing and the South-North Water Transfer Project (SNWTP) central route. I dispute the use of
the SNWTP on the hypothesis that it is only a short-term solution for the long-run problem of
water scarcity while creating new strains on China’s already dwindling water supply.
The thesis begins with a literature review divided into three chapters. The first chapter
contains three parts: origins of water scarcity in North China, continued depletion of water supply,
and increasing demand for water. All three sections discuss water scarcity in North China as
whole, but primarily focus on factors that impact water scarcity in Beijing. Chapter two of the
literature review focuses on the controversies pertaining to the SNWTP. Chapter three looks into
the SNWTP’s impact on Chinese policies. Chapter four is the methodology section. It starts with
a brief overview of the World Wildlife Fund’s cost-benefit analysis on the SNWTP in 2001. This
chapter includes a brief introduction to the cost-benefit analysis, followed by an application to the
SNWTP’s central route. I also discuss alternatives to the SNWTP and limitations in my cost-

2
benefit analysis. Chapter five concludes this thesis with the rejection of my hypothesis that the
SNWTP’s costs outweigh the benefits and suggestions for further research.

3
2.0 WATER SCARCITY IN NORTH CHINA
As early as the late 18th century, residents of North China viewed water as a valuable good that
needed to be used carefully and sparingly. Rural villagers pumped water from communal wells,
while urban dwellers, particularly those in Beijing, bought water from vendors who transported
well water from outside of the city (Grove, 2015). Foreigners arriving in the late 19th introduced
new methods of water transportation to North China (Grove, 2015). These methods included water
pipe systems, canals, and irrigation. In Beijing, powered-pumps raised water from deeper wells,
which temporarily alleviated water shortages (Grove, 2015). However, a survey of water supply
in 11 cities written in the mid-1930s showed that the new system only reached 11% of urban
households in Beijing (Grove, 2015). Despite its initial slow spread, the introduction of new water
supply methods signified a turning point in how Northern Chinese transported water.
Large-scale water transport systems were first constructed in China in mid-20th century.
During the Great Leap Forward, Mao Zedong’s regime placed heavily importance on increasing
agricultural and industrial output. These goals relied on freshwater availability. Irrigation projects
and canals were constructed to help meet increased water demand. However, Mao’s aggressive
water development had mixed results: higher agriculture production; mass mobilization generated
substandard irrigation systems; damaged soil fertility through poor drainage; and over exploited
water resources (Peitz, 2015). This was the start of water overexploitation based on the idea that
water was a plentiful inexhaustible resource and could be transferred and manipulated in anyway
deemed fit. By the 1980’s, years of upstream water withdrawals for irrigation and local industry
dramatically expanded competition for water downstream (Peitz, 2015).
Overexploitation of water resources continued to be an issue under Deng Xiaoping’s
reform in the 1980’s. Most countries when undergoing industrialization follow the trend described
by the environmental Kuznets Curve: countries first undergo economic development and
industrialization at the cost of natural resources and environmental hazards, but eventually citizens
4
and policy-makers will be concerned for the environment, thus prompting the government to enact
environmental protection policies. China was no exception to this trend. While China’s GDP and
FDI levels increased, it came at great cost to the environment, most notably seen through water
and air pollution. For example, factories across China often improperly disposed of production
waste, allowing it to flow freely into rivers, causing long-term pollution. What resulted from this
time period was increased water demand spurred by high levels of economic growth,
industrialization, and modernization, at the cost of depleting and polluting water resources.
2.1 CONTINUED DEPLETION OF WATER SUPPLY
About 97% of the world’s water is salt water, while 3% is freshwater. The world’s freshwater
supply exists in a variety of sources. Freshwater sources take the following forms: Permanent ice
(e.g., continental and mountain glaciers), the largest freshwater storage on Earth, accounting for
about 2% of the total global supply (or nearly 69% of the total freshwater supply); groundwater,
(approximately 30% of the total freshwater supply); and surface water storages such as lakes,
streams, swamps and marshes (McMichael, 2014). According to the United Nations’ Food and
Agriculture Organization, in 2008 China withdrawals approximately 452.7 cubic kilometers of
surface water and 101.4 cubic kilometers of groundwater withdrawal in addition to 0.0109 cubic
kilometers of desalinated water to meet its needs (Aquastat, 2012).
Approximately 98% of China's surface water is recharged by precipitation (MWR, 2004).
Accounting for inter-year variation, the average volume of internal renewable water resources in
China is estimated to be approximately 2,812 billion cubic meter per year, which includes both
surface water and groundwater (Jiang, 2008). However, rainfall in Southern China far exceeds
rainfall in Northern China. While creating the spatially uneven distribution of water resources, the
spatio-temporal pattern of precipitation further reinforces the spatial distribution of water resources
by introducing a spatially heterogeneous temporal variation (Jiang, 2008). Affected by a strong
monsoon climate, the annual average precipitation gradually decreases in a spatial gradient from
more than 2000 mm at the southeastern coastline to usually less than 200 mm at the northwestern

5
hinterlands (MWR, 2004). The ratio of maximum to minimum annual precipitation recorded
possibly exceeds 8 in northwestern China, but only ranges between 2 and 3 or less than 2 in
southern and southwestern part (MWR, 2004). In most areas of the country, precipitation within
four consecutive months at maximum approximately accounts for 70% of annual precipitation
(MWR, 2007). This spatiotemporal pattern of precipitation leads to a serious risk of flooding as
well as drought, especially in northern China.
Decreasing water levels are particularly concerning for the government, because some of
China’s most important cities are located in the north. As the capital city, Beijing serves as the
Chinese Communist Party’s headquarters. Beijing, with millions of permanent residents, and
millions of domestic and international tourists daily, is an important contributor to China’s GDP.
Beijing is also a grand historic symbol with famous landmarks, including Forbidden City, and the
nearby Great Wall. For these reasons, Beijing remains important to the Chinese government.
The three main rivers that supply water to Northern China, in particular Beijing, are the
Yellow (Huang), Huai, and Hai. Runoffs of the Hai and Huai rivers fall to 70% of their averages
every four years and to 50% every 20 years (Berkoff, 2003). Variations in river levels further
restrict the supply of freshwater in the north.
However, like all rivers in China, the Yellow, Huai, and Hai rivers have been negatively
impacted by years of high demand and increased incidents of pollution. Over the past 20 years,
mainstream water flows decreased by 41% in the Hai River Basin and 15% in the Yellow and Huai
River Basins. Although more than 200 rivers and streams can still be found on official maps of
Beijing, the sad reality is that little or no water flows there anymore (Probe International Beijing
Group, 2008).
In 2007, the Yellow River Conservancy Commission, a government agency, surveyed
13,000 kilometers (8,000 miles) of the river and its tributaries. The survey concluded that a third
of the water was unfit for agriculture, because 4,000 petrochemical plants were built on its banks
(Economist, 2012). Song Lanhe, chief engineer for urban water-quality monitoring at the Housing
Ministry, said only half the water sources in cities were safe to drink (Economist, 2012). The
World Water Organization said at least half of China’s mainstream rivers and lakes contained
water unfit for human consumption, while the World Bank said 300 million people in rural China
drank contaminated water daily (Wong, 2013).

6
Poor access to drinking water raises many health concerns. Water borne illnesses, if not
fatal, usually require medical attention and a long recovery period. According to the World Health
Organization, 3,900 children die each day due to dirty water or poor hygiene, and 1.8 million
people die every year from diarrheal diseases (including cholera) found in unsanitary drinking
water (WHO, 2004). Water is special in that its influence is far-reaching, affecting health, and
hence workforce quality and quantity. Victims of water-borne diseases will often see a decrease
in quality and quantity of their work, thus decreasing total labor productivity and production
output. As water supplies become scarcer, people often have no choice but to drink and use dirty
water daily, further contributing to the number of people contracting waterborne illnesses.
Groundwater reserves have also been negatively impacted by pollution and growing water
demand. The Chinese Land Ministry reported that more than half the groundwater in the North
China plain cannot be used for industry, while seven-tenths are unfit for human contact
(Economist, 2012).
Beijing government officials authorized deep groundwater drilling in order to meet the
city’s growing water demand. While residents Beijing regarded groundwater as an inexhaustible
resource 30 years ago, hydrogeologists warn it is depleting rapidly (Probe International Beijing
Group, 2008). Today, more than two-thirds of Beijing municipality’s total water supply comes
from groundwater (Probe International Beijing Group, 2008). Beijing’s groundwater table is
dropping, because water is being pumped out faster than it can be replenished. The municipality
continues to pump about 3 billion cubic meters of groundwater annually to keep up with the
forecasted growth in demand – that’s 500 million cubic meters more than the annual allowable
limit for “safe” extraction of groundwater (Probe International Beijing Group, 2008). With each
new project and added water tap, demand for water increases, and at an ever greater cost to China’s
environment and economy (Probe International Beijing Group, 2008).
Beijing also relies on dwindling reservoirs meet its water needs (Probe International
Beijing Group, 2008). The municipality’s two largest reservoirs, Miyun and Guanting, now hold
less than 10% of their original storage capacity. The Guanting is so polluted it hasn’t been used
as a drinking water source since 1997 (Probe International Beijing Group, 2008). Meanwhile, 25
years of drought and pollution of the city’s reservoirs contributed to the steady decline in available
water per capita from about 1,000 cubic meters in 1949 to less than 230 cubic meters in 2007(Probe
International Beijing Group, 2008).

7
Current projections suggest that climate change will continue to trigger variations in
precipitation levels. North China will receive even less precipitation, and more severe droughts,
while South China will receive more precipitation and longer floods (NASA). Droughts and
flooding will result in overall changes to the hydrologic cycle. In the case of droughts, low water
precipitation levels will further deplete groundwater and surface water levels. Increased
occurrences of flooding will cause greater risks of pollution to ground and surface water sources
if located near saltwater bodies, agricultural sites using pesticides, and waste sites including
sewage and landfills.
Furthermore, climate change has caused the all-important Mengke Glacier in the Qilian
Mountains of Northwest China, close to the origin of the Yellow River, to retreat an average of
54 feet a year from 2005 to 2014, up from 26 feet a year from 1993 to 2005 (黄安伟, 2015). As
the glacier melts, it puts nearby rivers, including the Huang, at risk for flooding. Similarly, over
the last 50 years, rising temperatures in the Tianshan mountain range resulted in glacier receding
between 15 to 30 percent. Other mountain ranges have seen similar increased rates of glacier
recession in the last few decades as a result of rising temperatures and greenhouse gas emissions
(黄安伟, 2016).
As the ice turns to free flowing water, river and lake levels to rise; sudden summer storms
lead to more frequent floods and landslides; threats to the livelihood of plants, animals,
infrastructure, and people (黄安伟, 2015). Increased flooding and destruction of infrastructure
further harms the water supply by increasing the chance of contamination and pollution. These
damages are costly. In July of 2014, heavy rains in Northwest China led to disasters in 13 villages,
destroying more than 150 homes and causing more than $6 million of damage, an official report
said (黄安伟, 2015). Glacier melting may only temporarily create more drinking water, however
as glacier melting continues, glaciers are beginning to hit the peak water point, meaning that glacier
water runoff will plateau and decline. This will lead to dry surface water sources and lowering
groundwater levels.
The United Nations Environment Program’s Intergovernmental Panel on Climate Control
(IPCC) predicts the following impacts Asia will face in the future due climate change and its effect
on water (Hijioka, et all, 2014):

8
• Warming trends, including higher extremes, are strongest over the continentalinteriors of Asia, and warming in the period 1979 onward was strongest over Chinain winter, and northern and eastern Asian in the spring and autumn.
• Future climate change is likely to affect water scarcity with enhanced climatevariability and more rapid melting of glaciers.
• Projected sea level is very likely to result in significant losses of coastal ecosystems.• It is likely that climate change will impinge upon sustainability of most developing
countries in Asia as it compounds the pressures on natural resources and theenvironment associated with rapid urbanization, industrialization, and economicdevelopment.
The 2030 China Water Resource Group predicts the following:
• China’s projected water demand for 2030—818 billion cubic meters—will outstripcurrent supply—618 billion cubic meters.
• the central government warns that despite existing water-saving measures China’swater demand will exceed supply by 2030, with much of the added pressure comingfrom China’s energy sector (Gleick, et all, 2009).
Based on future predictions, China’s water supply will continue to decrease at an alarming
rate. In the absence of strong intervention, the water situation in Beijing and the surrounding
regions seems likely to unravel within less than 20 years. The government must look to curb water
demand through policies that roll back water-intensive activity and/or enact steep price increases.
If these measures are not taken, China will run out of freshwater by 2030 and possibly sooner if
the situation becomes graver.
2.2 INCREASING WATER DEMAND
Despite rapidly depleting water resources, China’s water demand continues to increase. The
Chinese water demand can be broken down into three consumers: agriculture, industry, and
municipalities. According to the United Nations’ Food and Agriculture Organizations’ database,
its most recent statistics in 2005 about Chinese water withdrawal: 64.6% was used by agriculture,
23.2% for industry, and 12.2 % for municipalities of water (Aquastat, 2012).
The agricultural sector accounts for the largest share of freshwater consumption in China.
However, in North China, for example, agriculture, which now produces only about 10% of
China’s GDP, accounts for nearly two-thirds of water use. Agricultural sites, unless in close
proximity to freshwater sources, use irrigation systems. However, irrigation creates two problems:

9
water waste and ecological impacts. In terms of ecological impacts, irrigating water further
depletes groundwater and surface water sources, because water no longer recharges into its the
original watershed and ecosystem. This loss of water decreases biodiversity, and leads to less
vegetation and wildlife (Bozzu, 2015). In some cases, the amount of water taken from the native
watershed can change the hydrological cycle and result in decreased precipitation. Furthermore,
improper and poorly maintained water irrigation infrastructure can leads to large incidents of water
spillage. According to the China’s Water-Energy-Food Roadmap publication, in 2013 only 45%
of irrigated water was actually consumed by target crops, the other 55% was lost during irrigation
(Turner, et all, 2015).
The energy sector, uses the most amount of freshwater among all non-agricultural
industries in the Chinese economy. Industries use the largest percentage of its freshwater
consumption for cooling in thermal electric power generation, used in thermal electric power
plants using coal, oil, gas, nuclear fuel or biomass (Fry, 2005). Coal is still one of the largest
power sources today in China. Yet, coal is one of the most-water intensive methods of generating
electricity (Greenpeace, 2014). A typical coal plant withdraw enough water to fill an Olympic-
sized swimming pool every 3.5 minutes (Greenpeace, 2014). Coal mining, especially open-cast
mining, is responsible for complete environmental destruction, and has huge impacts to local water
resources; groundwater needs to be pumped out of the ground, forests needs to be cut down, and
fertile top soil is removed in order to access the coal; and in the process destroying valuable
underground aquifers, streams and rivers (Greenpeace, 2014). Moreover, bare lands are easily
eroded, which degrade water quality, clog rivers downstream, and increase flooding risks
(Greenpeace, 2014). While coal is the cheapest way to supply energy, it is the dirtiest energy
source resulting in the pollution of large amounts of freshwater.
Multipurpose hydro projects manage water for many interests in China: flood control,
irrigation, recreation and drinking water, as well as energy (Fry, 2005). While reservoirs are a
sound idea in theory, in practice, they can harm the ground and surface water sources. During the
filling of the dam’s reservoir, the water undergoes sedimentation and degradation. The water’s
Dissolved Organic Carbon (DOC)-content also increases, leading to depletion of dissolved
oxygen, which can increase ammonium and other substance, including contaminants, remobilize
iron, and create a higher risk of water pollution (Wildi, 2010). Furthermore, filling a reservoir can
change local topography, adding to already present environmental hazards. The process creates a

10
large body of none native water in an ecosystem. Depending on the reservoir's size, it can influence
the local climate or even cause earthquakes in geologically unstable areas (Climate Institute, 2015).
In some cases, environmental hazards caused by the hydropower plants, included: soil nutrient
depletion, biodiversity loss, and water contamination.
As municipalities grow, so does demand for daily household functions and goods: toilets,
showers, washing machines, and consumptions of nondurable goods, such as meat, alcohol,
clothes, and electronics. Additionally, western-style universities with large green areas and
activities for the growing upper-class, such as golf, have grown in popularity among the Chinese.
This has created a highly controversial demand for water. Urban communities like Beijing,
continue to grow. However, pavement for roads and sidewalks do not allow water to permeate,
which depletes groundwater recharge rates. According to the documentary Blue Gold,
approximately 750 billion cubic meters of water a year is lost due to perception not permeating
back into the aquifers (Bozzu, 2015). Of additional stress to aquifers is deforestation. Tree roots
absorb water and hold the actual watershed in place. Without these roots, precipitation becomes
water runoff that does not permeate back into the aquifer. Depleting aquifers lead to a rise in
sinkholes, causing harm to people’s livelihood and the integrity of infrastructure.
Finally, as Beijing prepares to host the 2022 Winter Olympics, water will again be an
important resource. As with all Olympic Games, the host city prepares for an influx of people and
thus must appropriately prepare. Beijing will have to prepare for increased water supplies for
drinking and hygiene, but also in construction, food and energy preparation, and snow making for
the Games. According to Beijing’s 2022 Olympic Game bid, the environmental impact of the
Games would be ecofriendly and sustainable (Johnson, 2015). In their three-volume filing with
the International Olympic Committee (I.O.C.), organizers say they will use renewable energy and
sustainable building materials (Johnson, 2015). Forest cover lost to ski slopes or other facilities
would be offset by new tree plantings elsewhere, in compliance with I.O.C. requirements (Johnson,
2015). “As there are abundant water resources near the ski resorts, and the melted snow will be
recycled,” the bid says, “snow-making during the Games will not have any negative impact on the
local ecosystem” (Johnson, 2015). However, much of Beijing’s little rainfall that feeds into
streams and eventually into downstream catchments, like the Yunzhou Reservoir, is being
earmarked back to Beijing in the winter to make snow for the city’s expanding construction of
water-intensive winter sports attractions (Johnson, 2015). Two-thirds of that precipitation falls in
11
the summer. In December and January, areas like Chongli, where the reservoir is, receive about a
tenth of an inch of precipitation, meaning they are usually bare throughout the winter (Johnson,
2015). Beijing will expand already existing ski resorts to accommodate the Games. According to
Hu Kanping, a retired hydrologist who writes reports for the Chinese nongovernmental
organization Friends of Nature, in a 2011 report, he wrote that the 11 ski resorts in Beijing used
an average of about a billion gallons of water a year, or enough for 42,000 people (Johnson, 2015).
An influx of athletes and tourists for the winter games would only increases these water demands.
Current trends and predictions show that China’s decreasing water resources will be in high
demand over the coming decades. Policy-makers now face the problem of how to supply enough
water to meet China’s growing demand.

12
3.0 THE SOUTH-NORTH WATER TRANSFER PROJECT
One method China is using to increase water supply to meet growing demand is the world’s largest
water diversion project, the South North Water Transfer Project (SNWTP). Mao Zedong
developed the idea for the SNWTP in the 1950’s with the thought-process that if North China had
limited water supply, and South China had too much water, then the north should borrow water
from the south. 50 years, later, this $65 billion project has become a reality. Like the Three Gorges
Dam, the SNWTP is considered by many Chinese to be a symbol of hydraulic engineering and
celebrated as an exemplar of massive water transfer development.
The SNWTP affects 12 provinces and in total uses 1,900 pipes for canals. The SNWTP
has three diversion routes: east, central, and west. The additional water the SNWTP routes divert
primarily benefits cities and industries.
The eastern route will move nearly 14.8 billion cubic meters of water for domestic and
industrial water use for Shandong and Jiangsu provinces. The controversial western route remains
in the planning stage.
The central route, moving nearly 13 billion cubic meters of water, will provide water for
more than 20 cities, including Beijing and Tianjin (Jaffe, et all, 2011). Experts estimate the cost
of the central route to be more than 200 billion renminbi, or $32 billion (Zhao, 2014). Urban
residents will be the main beneficiaries of the central route, while farmers will be the last to benefit,
if at all (Jaffe, et all, 2011). According to the government, alleviating water shortages by use of
the SNWTP is supposed to add 0.13% to 0.3% to annual GDP growth and create up to 600,000
jobs. Scott Moore, a research fellow at the Harvard Belfer Center for Science and International
Affairs said the following on benefits of the SNWTP:
“If you look at other countries in comparable stages of development and water scarcity,
virtually all of them have employed some form or another of water transfer. At one level,
I can’t blame China’s economic planners for thinking this is an essential thing to do (Zhao,
2014).”
13
3.1 CONTROVERSIES
Experts show that the SNWTP will have long-term effects on the water supply in South China.
They say the project could decimate the Han River because about 40% of the river’s water will
eventually be diverted north, despite acute water shortages that already plague the cities along its
banks (Kaiman, 2014). The amount of water to be diverted for the central route, for instance, is
based on calculations of the Han River’s water flow between the 1950’s and the early 1990’s;
which have not been adjusted to reflect the decline in the Han (Zhao, 2014). As the water levels
of the Han decrease, so does the total availability of water to be consumed by locals or to be
diverted north. The Han River levels are predicted to be lowered as the severity of droughts
increase. This will cause groundwater levels to decrease and not be able to replenish, negatively
impacting the hydrologic cycle, local ecosystems, and local topography of wet lands as reduced
river flows will slow the deposit of sediments that are critical to wetland formation.
Of additional concern is actually transporting water from the south to the north. Qiu
Baoxing, vice-minister of the Ministry of Housing and Urban-Rural Development, called the
project unsustainable. “As the scale of the project gets bigger and the distance gets longer, it is
more and more difficult to divert water,” he wrote (Kaiman, 2014). Water is easily polluted during
the transfer. This has resulted in the creation of various treatment plants along the diversions
routes, which are costly and require and lot of energy to power, further adding to the total cost to
move water long distances.
Transporting water along the SNWTP requires action and spending by multiple
jurisdictions. This creates problems of funding and accountability among the various parts of the
government involved in diverting the water and ensuring quality protection of diverted water.
Hongqiao Liu writes the following in his 2015 publication for China Water Risk, China’s Long
March to Drinking Water:
“When we look at each of the ministries in turn, it’s clear that the Ministry of Environmental Protections’ ability to invest is considerably less, and thus this government organ mainly performs surveillance functions. Work related to water protection projects, reservoirs and water diversion project construction is mainly carried out by the Ministry of Water Resources (MWR). Take the SNWTP as an example. During the water transferal, there are issues related to transfer and also ownership”, said Mr. Xue Tao, the deputy director of the Water Industry Policy Research Centre of Tsinghua University. After water

14
is diverted from the South to Beijing, the water is allocated by the head office of the SNWTP Eastern Route Company. After the allocated water reaches the reservoir, it is then transported to the water company. “[If] there are problems with the water source, is it the responsibility of the Ministry of Environmental Protection (MEP) for its bad management or the Ministry of Water Resources’ (MWR) poor planning? It is clearly not the responsibility of one single government body. The reality is more complex”, said Mr. Xue Tao. Some scholars have pointed out that the management of water sources should build upon what could have been improved upstream. The Ministry of Agriculture (MoA) and the Ministry of Housing (MoH) should also bear the appropriate regulatory responsibility. (Liu, 2015)”
Lack of accountability for the various government agencies involved with the SNWTP is
worrisome. It creates more opportunity to shift blame rather than ensure contamination of water
does not happen, which is something vital when dealing with the transfer of water. If
communication and accountability are not clear, policies pertaining to water can easily be
undermined and issues with the water diverted can be underreported.
Furthermore, local officials argue for more compensation from the central government
because of the ecological services they must provide for the central route. Specifically, because
development in their district must meet strict environmental standards to ensure the Danjiangkou
Reservoir's water level is sufficient to supply the SNWTP, development in the surround regions of
the Danjiangkou Reservoir in Henan, including the ability to exploit the region's valuable mineral
resources, has been constrained and communities have endured economic loss (Freeman, 2011).
All the while, some central officials have complained that local leaders are not taking adequate
steps to mitigate industrial discharges that are polluting water that is needed for the diversion
(Freeman, 2011).
Water is easily lost in transfer, and requires modern piping. In many cases, the
infrastructure each city must build in order to actually use the transferred water — pipes, pumping
and processing plants — has been off-putting due to its expense (Zhao, 2014). Building new
infrastructure and piping required for the project resulted in the resettling of almost half a million
people. These people often do not receive enough compensation to cover relocation costs. The
following is an excerpt from a 2014 publication by the Guardian on the relocation of farmers
caused be the construction of the SNWTP’s central route:
“Wang Yanhe’s lived near the Danjiangkou reservoir since his birth in 1979. In 2009,
seven years after the SNWTP’s approval, officials informed him that the reservoir’s water levels

15
were rising and that his village would be submerged. About 345,000 villagers have been displaced
by the project to date, and Wang soon became one of them. The government gave him a home in
the Heba New Migrant Village by a dusty highway in rural Pingdingshan, a coal-rich municipality
in neighboring Henan province. This summer was Pingdingshan’s driest in 63 years – Wang’s
corn crop only grew to knee-height, forcing him to abandon his harvest. “Nothing is as good as
before,” he said. His roof leaks; he can’t speak the local dialect. Officials promised him 0.2 acres
of land, but only gave him 0.15. “After we arrived, we realized that the land was all dry,” he said.
“So it doesn’t even matter what they promised us. (Kaiman, 2014)”
Some of the criticism from officials at the provincial level reflects unhappiness with the
redistributive nature of the project. The SWNTP’s central route captures local resources to benefit
urban residents in major cities. Prominent environmental advocate, Ma Jun, of the Institute of
Public and Environmental Affairs and author of China's Water Crisis (2003), has repeatedly argued
that given the project's huge financial and environmental costs, its benefits accrue predominantly
to residents of Beijing (Freeman, 2011). For this reason, many local officials along the SNWTP’s
transfer lines long protested the project.
With the environmental, social, and economic costs of this project, how much is Beijing
paying to enjoy the benefits? Beijing consumed 3.6 billion cubic meters (127 billion cubic feet or
950 billion gallons) of water in 2012. This is more than the 2.1 billion cubic meters per year the
city has at its disposal in nearby rivers and in the ground (Zhao, 2014). The additional water was
diverted from other water scarce regions like Hebei. The SNWTP supplies nearly one-third of
Beijing’s annual water consumption to meet household and industrial water demand (Probe
International, 2014). Beijing authorities introduced the tiered water pricing mechanism in May of
2014. Under the new system, 90% of households fall under the lowest priced tier: 5 yuan per cubic
meter, for households using less than 180 cubic meters per year (Mengjie, 2014). Households with
annual water consumption between 180 and 260 cubic meters are charged 7 yuan per cubic meter,
while those that use more than 260 cubic meters a year must pay 9 yuan (Mengjie, 2014).
Meanwhile, industries must pay 8.15 yuan per cubic meter (Mengjie, 2014). The price for major
water consumers -- such as purified water plants, car washes and bath houses, as well as golf
courses and ski resorts -- is 160 yuan per cubic meter (Mengjie, 2014). Beijing's per capita water
volume is 150 cubic meters, a third of which is provided by the SNWTP in December of 2014
(Mengjie, 2014).

16
Yet, this may not be enough to cover the true cost of transporting the water. The cost of
the transferred water also increases according to the distance it must travel. In addition, one must
consider the fixed cost, interest rate components of the initial construction cost of the SNWTP,
and soon maintenance expenses, as water channels and pumps will require inspection, repair and
replacement. Construction material, labor and added expenses like installing dozens of wastewater
treatment plants are pushing the total bill past the previously earmarked amount of 500 billion
yuan (about $60 billion, according to exchange rates in 2002 when construction began) (Zhao,
2014). Adding to the total cost of construction is the interest on bank loans used to finance the
SNWTP. About 45% of the project is financed by loans from banks. “There could be a great
default,” says James Nickum, vice-president of the International Water Resources Association,
who visited areas slated to be the grounds for the eastern and central route in the 1980s, when
officials were still debating the project. “I’m not convinced the project is a good deal economically,
(Zhao, 2014).” In the coming chapter, we’ll explore the idea of how the SNWTP could impact
water policies causing long-run impacts to Chinese development and conduct a cost-benefit to test
the idea the SNWTP is not a good idea economically in that its costs outweigh its benefits.

17
4.0 IMPACTS ON POLICIES
One of the biggest limitations of the thesis is the final version of the China’s 13th 5th Year Plan will
not be finalized until March. The central government released general points on the Plan’s goal in
the fall of 2015. According to these points, the Plan will focus on environmental protection, with
a focus on air pollution and investments in the growing e-car sector (Moody, 2015). The general
environmental talking point made no comment on water issues. Officials in China have already
noted that there is no plan to stop using the SNWTP to divert water to Northern China, despite the
reported risks, costs, and long-term negative impacts on the environment. For example, Dong
Wenhu, former head of the water resource department in Taizhou in Jiangsu province, near the
beginning of the eastern route, tells Quartz, “Yes there are risks. But no, I’m not worried. Why?
Because we can just build more” (Zhao, 2014).
Additionally, the SNWTP’s impacts may counteract some of the 13th 5th Year Plan’s goals.
For example, the government wants to alleviate poverty. Yet, the SNWTP causes more citizens
to become impoverished. Citizens relocated due to the SNWTP’s construction, like Wang Yanhe,
received inadequate compensation and less land than promised that is not suitable for farming.
Additionally, more citizens downstream now face a decrease in water availability because of the
amount of water required for the maintain SWNTP’s reservoirs.
Finally, the 13th 5th Year Plan looks to modernize national governance systems and
strengthen efforts to improve democratic mechanisms, the rule of law, and judicial credibility, and
protect human rights and property rights (Moody, 2015). Yet, the SNWTP already challenges
internal government coordination by minimal accountability of ensuring safe diversion of water.
The SNWTP will also begin to decrease water level in the Han River, and threaten the livelihood
of Southern Chinese than rely on this water for production and consumption.
On April 16th, 2015 China unveiled the “Water Pollution Prevention and Control Action
Plan” or more commonly known as “Water Ten”. This policy package was the result of
coordination & inputs from more than 12 ministries and government departments, including
Ministry of Environment Protection, National Development & Reform Commission, Ministry of

18
Science & Technology, Ministry of Industry & Information Technology, Ministry of Finance,
Ministry of Land & Resources, Ministry of Housing & Urban-Rural Development, Ministry of
Transport, Ministry of Water Resources, Ministry of Agriculture, National Health & Family
Planning Commission and State Oceanic Administration (China Water Risk, 2015). While water
issues have been highlighted to a certain extent in the previous 5 Year Plans, “Water Ten” is the
first policy package that focuses strictly on water issues. Water Ten would impact China’s
environment and economy, as the plan aims to crack down on large water consuming and pollution
industries, including coal. Water Ten sets out 10 general measures which can be broken down to
38 sub-measures with deadlines with responsible government departments identified for each
action (China Water Risk, 2015).
To begin, a summary of Water Ten is found below (China Water Risk, 2015):
1. Full Control of Pollution Emission• This section of the document stresses the need to control pollution in the
industrial, urban, agricultural and shipping harbor sectors. Furthermore, theplan gives each sector a 2017 deadline to adhere to new standards, updatedwater treatment systems and create new online monitoring systems.
• The oversight and implementation of the new policies will be overseen byvarious government organizations, such as the Ministry of Agriculture andUrban Planning.
2. To Promote Economic Restructuring and Upgrading• This section calls for an update to production equipment, technology, and
pollution standards—that will be sent routinely to the Ministry of IndustrialTechnology and the Ministry of Environmental Protection to ensure followthrough on all new requirements.
• Urban planning and land use must determine the layout, structure and sizeof new development projects do not compromise water resources. Failureto adhere to this new requirement in project planning will result in a non-distribution of a permit.
• In coastal areas, power, chemical, petrochemical, and other industries aredirected to use seawater for as a cooling water for industry use. The policycalls for more resources allocated for water desalinization resources tosustain domestic industrial use in all areas in China.
3. Efforts to Protect Water Resources Conservation• Strictly control the exploitation of deep artesian water and groundwater, via
stringent water permits and mining licenses.• Actively promote the construction of low-impact development models that
allow water to permeate back into the ground.• Marketing water saving irrigation and crop- water technologies.
4. To Strengthen Scientific and Technological Support.

19
• Improving environmental technology evaluation system, while alsostrengthening national environmental and technological achievements tohelp achieve water stability.
• Accelerate the development of key industries: wastewater treatment,sewage treatment, desalinization, groundwater pollution remedies,hazardous chemical accidents and maritime oil spill emergency responsetechniques.
5. Give Full Play to Market Mechanism• Accelerate the reform of water prices, as early for some—like industries—
by updated by the end of 2015.• Urban sewage treatment fees should not be lower than the wastewater
treatment and disposal costs.• Groundwater collection fees should be higher.• Accelerate the work of environmental protection tax legislation and reform,
with some consideration for high energy consumption, high pollutionproducts into the scope of consumption tax.
• The central government to increase the powers of the central water andenvironmental protection projects. Local people’s governments at all levelsshould focus to support these projects along with improved wastewatertreatment procedures and projects, river regulation, livestock pollutioncontrol, water and ecological restoration and emergency clean-up projectsand work.
6. The Strict Enforcement of the Regulatory Environment• Improve laws and regulations by accelerating some of the following; the
water pollution control, marine environmental protection, pollution permits,environmental monitoring, and groundwater management.
• All standards must be implemented by firms. Firms that do not comply orfail investigations will be issued a ‘yellow card’ warning which results inrestricted or discontinued production of remediation. If these firms can stillnot meet the requirement after the ‘yellow card’ warning, they will be issueda ‘red card’ punishment, resulting in immediate closure.
7. Strengthen the Water Environment Management• Water quality protection goals will be monitored by investigations which
will base the assessment on the respective region’s developmentrequirements.
• The results will be published and made available to the public.• Prohibit undocumented sewage by improved permit distribution standard.
8. To Protect the Safety of the Water Environmental Ecology• The process of taking water from the source and distributing it through the
tap should be monitored more closely.• By 2016, there should be testing and evaluation of the above process with
the results published to the public.• Strengthen river and groundwater protection.
9. Implement Clear Responsibility of the Party
20
• Local governments must reexamine specificities of each policy each year toidentify the most needed and effective policies in each region. Thisevaluation must be published and open to the public, beginning no later than2016.
• Officials found not implementing these policies or jeopardizing its successwill be immediately dismissed from their position.
10. Strengthen Public Participation and Oversight• Social organizations that also provide training and consulting regarding
pollution prevention regulations.• Invite their full participation in important environmental enforcement
actions and major water pollution incident investigations and with newwater conservancy projects.
4.1 IMPACTS ON WATER TEN
Overall, Water Ten is a positive step in the right direction to alleviate water issues in China. It
shows the central government is acknowledging the problem, and is taking steps to implement
more well-rounded policies that will not harm the environment in the long-run. The Plan aims to
swiftly implement the new action points to protect China’s remaining water. Most notable is the
new infrastructure development requirements that use ecofriendly technologies and building
materials allowing water to easily permeate into the ground. This is vital for China, because major
cities, like Beijing, continue to expand. In cities, such as Beijing, groundwater sources have been
over pumped, because they are the main suppliers of freshwater for the city. Experts estimate that
Beijing’s groundwater sources need over 600 million cubic meters of water to be recharged to
reverse the damage of long term, over pumping. Making urbanization more eco-friendly, shows
that the government is thinking about water scarcity and protecting the environment in the long-
run. Using these types of building mechanism in the long-run can help heal some of the stress
groundwater resources have felt.
Despite the positives of Water Ten, I argue the SNWTP will compromise its goals in the
long-run. For example, the government plans to cut back on groundwater pumping by use of
permits, which further preserve groundwater levels. However, Water Ten does not specify the
requirements to attain and qualify for a permit. Furthermore, the SNWTP diverts water from

21
Southern China, which will lower groundwater levels over time. Research shows that Southern
China will not possess enough water to meet its own demand in the long-run, let alone Northern
China’s demand. This could lead to the need to drill deeper into southern groundwater reserves,
if other water sources, such as desalinization, and other methods to decrease demand and increase
are not implemented.
Water Ten aims to more closely monitor the process of taking water from the source and
distributing it more closely, while also strengthen river and groundwater protection. However,
while the SNWTP provides 350,000,000 cubic meters to Beijing (2013 MWR figure), creates
600,000 jobs nationally, add 0.12% to 0.3% to annual GDP, one must remember that the
consumers are paying varying price estimates for this water at high fiscal, environmental, and
social costs nationally. Finally, water diversions projects, like the SNWTP, have long since
heavily favoring the needs of Beijing, while other water scarce regions like Hebei, have been
looked over and had their own water resources diverted to Beijing, and have still not received due
payment.
Water Ten makes many good points on methods to increase the supply of freshwater while
decreasing demand. Accelerating the development of wastewater and sewage treatment plants,
and desalination, while also marketing water saving irrigation technology will help increase the
supply of freshwater in China. As noted previously, this is a topic I revisit in the conclusion of
this project to give alternative to using the SNWTP to alleviate limited water supplies in Beijing.
In order to decrease demand, the government plans to reform water prices. Water Ten will raise
urban sewage treatment fees to be no lower than the wastewater treatment and disposal cost and
also increase the price of tap water. Despite the increases in fees, given the total cost of the
SNWTP and its negative impacts on the environment, is this water still worth the additional
benefits and cover the total cost to deliver nearly 350,000,000 cubic meters a year to Beijing? If
prices for diverted water remain below operating costs, particularly worrisome since the SWNTP
was financed by bank loans, may result in a loss of profit. Either way, whether the cost is borne
by the producer or consumer, the SNWTP results in a loss for both parties. Exactly how much
everyone losing in using the SNWTP is an idea I evaluate in the next section by use of a cost-
benefit analysis.
22
5.0 METHODOLGY
The cost-benefit analysis (CBA) is the principal analytical framework used to evaluate public
expenditure decisions (De Steiguer, 2016). CBA originated in the 1930s with the WPA water
projects (dams) in the western U.S. There was a need to justify these projects to the taxpayers and
Congress, hence the use of CBA (De Steiguer, 2016). The general purpose of CBA is to help
government & society better allocate scarce productive resources (De Steiguer, 2016). Performing
a CBA allows policy-makers to anticipate costs and benefits in the long-run to evaluate whether
or not to pursue a large public project, and to make adjustments to project planning and funding
as needed.
5.1 PREVIOUS STUDY
In 2001, the World Wildlife Fund (now the Worldwide Fund for Nature) conducted a cost-benefit
analysis on the SNWTP after the Chinese government approved funding for the second stage of
production. The first stage will divert 9–13 km3/yr or 25–35% of Han flows at Danjiangkou,
though the heightened dam will also have important flood and water control benefits in the lower
Han and to the city of Wuhan (Berkoff, 2003). The first stage costs some US$7000M, with a
further US$3000M in accessory costs, mainly for resettlement WWF, 2001). A second stage could
increase diversions to 20 km3 but is only feasible with compensating transfers from the Yangtse
to the lower Han (Berkoff, 2003). Thus the WWF conducted a cost-benefit analysis [CBA] to test
if the cost of the SNWTP would be worth the added benefits.
The WWF benefit estimates are based wholly on what the study’s authors refer to as
‘exogenous water values’ for the entire region, including for irrigation (Berkoff, 2003). These are
compared with delivered costs at sequential points along the SNWTP at a discount rate of 8%.

23
Table 1: WWF’s Estimates of Water Delivery Costs at Points Along the SNWTP
Delivered cost (rounded): Yuan/m3 at 8%
Middle Route Hubei 1.4 Henan 5.0 Hebei 9.3 Tianjin 13.6 Beijing 15.8
Eastern Route Shandong: Huai Region 1.0
Peninsular 1.5 Hebei 2.3 Tianjin 3.8
Source: WWF (2001).
WWF water delivery cost values derived as followed: (i) industry “can exceed 20 Yuan/m3
(2.5 cents/m3)” but varies by sector; (ii) urban “of the order of 1–2 Yuan/m3 (12.5–25 cents/m3)”
and (iii) irrigation “can probably be taken at most at around 0.4 Yuan/m3 (5 cents/ m3)” for water
consumed or 0.3 Yuan/m3 (3.75 cents/m3) for water diverted at 75% irrigation efficiency. If grain
prices tripled “the value of irrigation water would be 1–1.5 Yuan/m3 (12.5–17.5 cents/m3) at 75%
efficiency” (WWF, 2000).
The WWF concluded that the real cost of water from the eastern route would be justified
(only) if it were used for urban and industrial purposes, and the middle route would justify
industrial use but not urban use north of Hebei (Berkoff, 2003). In other words, the Middle Route
cannot be justified for any uses in Beijing or Tianjin and WWF concludes that neither route can
be justified for irrigation (Berkoff, 2003). In the case of the Middle Route, this remains the case
“even if the price of grains were to triple” (Berkoff, 2003).
However, this cost-benefit analysis was conducted in 2000, when costs and benefits of the
SNWTP were only predictions, the dollar values are based on the 2001 yuan-dollar exchange rate,
income levels of both urban and rural Chinese, and the domestic price level. After the SNWTP’s
middle route opened in late 2014, and a new tiered pricing system in Beijing was implemented, I
conduct a CBA with newer variables values.

24
5.2 COST-BENEFIT ANALYSIS
Economists argue that one cannot simply add up the costs and compare them to the benefits
because money received in the future is worth less than money spent today, as a result of
uncertainty of the future, inflation, and the opportunity cost of resources—namely, the returns of
investment an alternate project might yield. Therefore, future benefits and costs need to be
discounted for an adequate comparison. One way to perform the CBA is by computing the present
value (PV) of all costs and benefits.
Present value benefits are calculated using the following formula:
𝑃𝑃𝑃𝑃𝐵𝐵 = 𝐵𝐵𝑖𝑖𝑖𝑖𝑖𝑖𝑖𝑖𝑖𝑖𝑖𝑖𝑖𝑖 + �𝐵𝐵𝑦𝑦𝑦𝑦𝑦𝑦𝑦𝑦𝑦𝑦𝑦𝑦 𝑦𝑦𝑎𝑎𝑦𝑦𝑦𝑦𝑦𝑦𝑎𝑎𝑦𝑦
(1+𝑖𝑖)0+ ⋯+ 𝐵𝐵𝑦𝑦𝑦𝑦𝑦𝑦𝑦𝑦𝑦𝑦𝑦𝑦 𝑦𝑦𝑎𝑎𝑦𝑦𝑦𝑦𝑦𝑦𝑎𝑎𝑦𝑦
(1+𝑖𝑖)𝑇𝑇�
Where 𝑃𝑃𝑃𝑃𝐵𝐵 equals the sum of the present value of all future benefits over the lifetime of
the project plus 𝐵𝐵𝑖𝑖𝑖𝑖𝑖𝑖𝑖𝑖𝑖𝑖𝑖𝑖𝑖𝑖 which is a onetime benefit payment; 𝐵𝐵𝑦𝑦𝑦𝑦𝑦𝑦𝑦𝑦𝑦𝑦𝑦𝑦 𝑦𝑦𝑎𝑎𝑦𝑦𝑦𝑦𝑦𝑦𝑎𝑎𝑦𝑦 equals the benefits in
the first year of the project’s use; i is the discount rate that discounts future benefits; and t equals
the lifetime of the project—ie, the number of times 𝐵𝐵𝑦𝑦𝑦𝑦𝑖𝑖𝑦𝑦𝑖𝑖𝑦𝑦 𝑖𝑖𝑎𝑎𝑦𝑦𝑦𝑦𝑖𝑖𝑎𝑎𝑦𝑦 is discounted.
Present value costs are calculated in a similar way using the following formula:
𝑃𝑃𝑃𝑃𝐶𝐶 = 𝐶𝐶𝑖𝑖𝑖𝑖𝑖𝑖𝑖𝑖𝑖𝑖𝑖𝑖𝑖𝑖 + �𝐶𝐶𝑦𝑦𝑦𝑦𝑖𝑖𝑦𝑦𝑖𝑖𝑦𝑦 𝑖𝑖𝑎𝑎𝑦𝑦𝑦𝑦𝑖𝑖𝑎𝑎𝑦𝑦
(1 + 𝑖𝑖)0 + ⋯+𝐶𝐶𝑦𝑦𝑦𝑦𝑖𝑖𝑦𝑦𝑖𝑖𝑦𝑦 𝑖𝑖𝑎𝑎𝑦𝑦𝑦𝑦𝑖𝑖𝑎𝑎𝑦𝑦
(1 + 𝑖𝑖)𝑇𝑇 �
Where 𝑃𝑃𝑃𝑃𝐶𝐶 now refers to the sum of the present value of all anticipated costs plus 𝐶𝐶𝑖𝑖𝑖𝑖𝑖𝑖𝑖𝑖𝑖𝑖𝑖𝑖𝑖𝑖 which
is a onetime expense; 𝐶𝐶𝑦𝑦𝑦𝑦𝑖𝑖𝑦𝑦𝑖𝑖𝑦𝑦 𝑖𝑖𝑎𝑎𝑦𝑦𝑦𝑦𝑖𝑖𝑎𝑎𝑦𝑦 which is the annual upkeep cost of the project; i is the
discount rate that discounts future benefits; and t equals the lifetime of the project—ie, the number
of times 𝐶𝐶𝑦𝑦𝑦𝑦𝑖𝑖𝑦𝑦𝑖𝑖𝑦𝑦 𝑖𝑖𝑎𝑎𝑦𝑦𝑦𝑦𝑖𝑖𝑎𝑎𝑦𝑦 is discounted.
5.2.1 VARIABLES ASSESSED
In this CBA test, I focus on the following variables to evaluate present value costs and benefits of
SNWTP’s central route:

25
Table 2: Initial and Annual Cost and Benefit Variables Assessed
Costs Benefits Initial: - Construction cost of the SNWTP’s
central routeAnnual: - SNWTP’s expenditure budget detailing
the yearly upkeep of the SNWTP
Initial: - None
Annual: - Increase in GDP- Increase in jobs- Value of water the SNWTP’ central route
provides to households, industries, andtertiary sector in Beijing
Both the annual and initial cost variables were taken from the SNWTP Ministry. We
assume no initial benefits, because there are disputes pertaining to whether the relocation payments
are adequate and because the primary focus of this analysis is the benefits the SNWTP provides to
Beijing. The annual benefit variable is the sum of the increases to GDP, increase in jobs, and the
value of water provided by the SNWTP. Water is valued differently by the three tiers of
households, industries, and the tertiary sector—which represents consumers not captured in
households and industries, such as hospitals and universities. Finally, given that the SNWTP is
projected to add between 0.13%-0.3% to annual GDP, we calculated four different values for the
annual benefit variable, and thus have four different outcomes for the present value benefit of the
SNWTP.

26
5.2.2 VALUES FOR VARIABLES ASSESSED
Table 3: Numeric Values for Variables Used to Calculate Present Value Benefits and Costs
Variable Value* Discount Rate (i) 4% Time (t) 20 Years Initial Cost (𝐶𝐶𝑖𝑖𝑖𝑖𝑖𝑖𝑖𝑖𝑖𝑖𝑖𝑖𝑖𝑖) 256,700 Million Yuan Annual Cost (𝐶𝐶𝑦𝑦𝑦𝑦𝑖𝑖𝑦𝑦𝑖𝑖𝑦𝑦 𝑖𝑖𝑎𝑎𝑦𝑦𝑦𝑦𝑖𝑖𝑎𝑎𝑦𝑦) 12,613 Million Yuan Initial Benefit (𝐵𝐵𝑖𝑖𝑖𝑖𝑖𝑖𝑖𝑖𝑖𝑖𝑖𝑖𝑖𝑖) 0 Yuan Annual Benefit if GDP Increases by 0.13% (𝐵𝐵𝑦𝑦𝑦𝑦𝑖𝑖𝑦𝑦𝑖𝑖𝑦𝑦 𝑖𝑖𝑎𝑎𝑦𝑦𝑦𝑦𝑖𝑖𝑎𝑎𝑦𝑦)
642,641 Million Yuan
Annual Benefit if GDP Increases by 0.2% (𝐵𝐵𝑦𝑦𝑦𝑦𝑖𝑖𝑦𝑦𝑖𝑖𝑦𝑦 𝑖𝑖𝑎𝑎𝑦𝑦𝑦𝑦𝑖𝑖𝑎𝑎𝑦𝑦)
957,474 Million Yuan
Annual Benefit if GDP Increases by 0.25% (𝐵𝐵𝑦𝑦𝑦𝑦𝑖𝑖𝑦𝑦𝑖𝑖𝑦𝑦 𝑖𝑖𝑎𝑎𝑦𝑦𝑦𝑦𝑖𝑖𝑎𝑎𝑦𝑦)
1,182,354 Million Yuan
Annual Benefit if GDP Increases by 0.30% (𝐵𝐵𝑦𝑦𝑦𝑦𝑖𝑖𝑦𝑦𝑖𝑖𝑦𝑦 𝑖𝑖𝑎𝑎𝑦𝑦𝑦𝑦𝑖𝑖𝑎𝑎𝑦𝑦)
1,407,234 Million Yuan
*Numbers are rounded to the nearest million when appropriate *
More details on how these variables were calculates can be found in the appendix.
5.3 RESULTS
Table 4: Results: Present Value Benefits and Costs
Expected GDP Increase Present Value Benefits (Millions of Yuan)
Present Value Costs (Millions of Yuan)
0.13% 642,641 439,979 0.2% 957,474 439,979 0.25% 1,182,354 439,979 0.3% 1,407,234 439,979
27
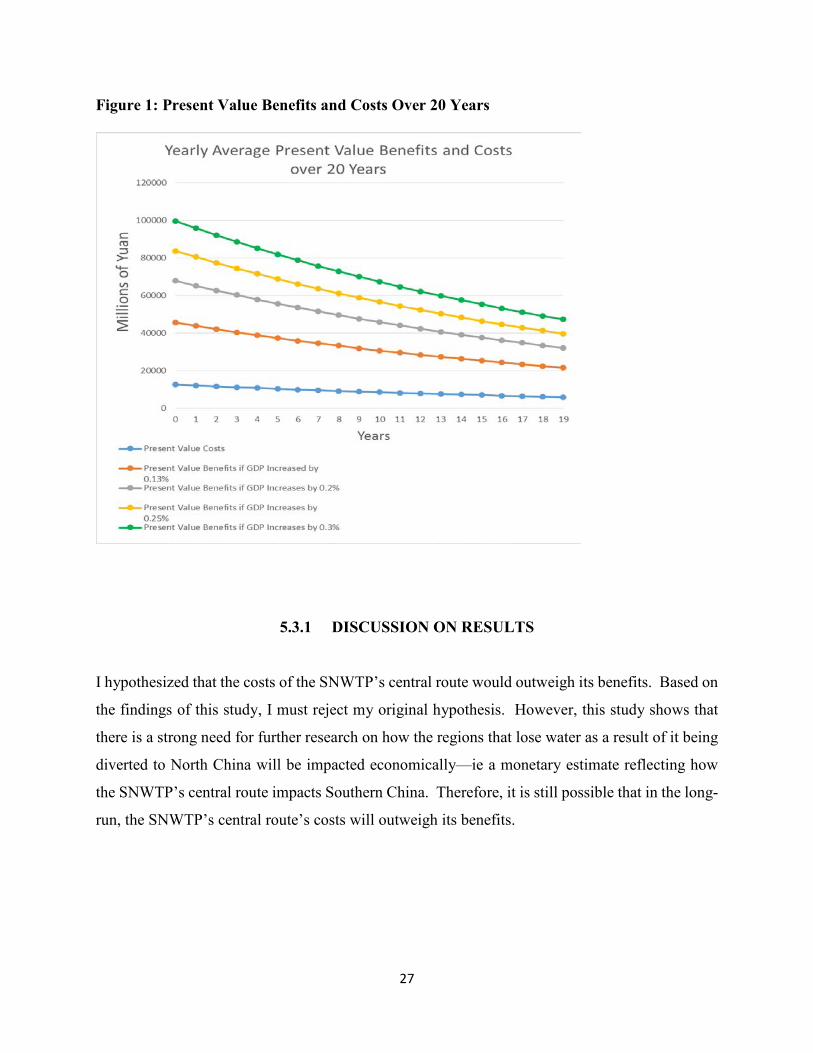
Figure 1: Present Value Benefits and Costs Over 20 Years
5.3.1 DISCUSSION ON RESULTS
I hypothesized that the costs of the SNWTP’s central route would outweigh its benefits. Based on
the findings of this study, I must reject my original hypothesis. However, this study shows that
there is a strong need for further research on how the regions that lose water as a result of it being
diverted to North China will be impacted economically—ie a monetary estimate reflecting how
the SNWTP’s central route impacts Southern China. Therefore, it is still possible that in the long-
run, the SNWTP’s central route’s costs will outweigh its benefits.

28
5.3.2 LIMITATIONS
To begin, I assumed that the annual costs and benefits would be the same each year. Because the
SNWTP’s central route has been in use since December of 2014, there were only rough estimates
of added benefits. It is very possible that annual benefits and costs will change from year to year.
For example, if a new water transport method is created that lowers the rate of water contamination
and spillage, thus increasing the amount of water diverted to Beijing, the annual benefits for the
first year this new system is used, would be higher than previous years without it. However, costs
may increase initially because of the cost to switch over to the new water transport system, and
benefits may decrease for a period as water may not be diverted when the new transport system is
replacing the old one.
Furthermore, I assumed that the SNWTP’s central route accounted for half the expected
added value of GDP on the basis that the central route is longer and provides water to more cities
than the eastern route. Because the central route has only been in use for just over a year, there is
still limited data on how the additional supply of water has increased GDP and what percentage
was a result of the central route.
Additionally, I assumed that the central route accounted for half of the personnel expenses
in the SNWTP expenditure budget. Again, this is unlikely, given the difference in length of the
two routes.
It is likely that yearly benefits will change in the next few years as Beijing prepares for the
2022 Olympics. I accounted for some of this in my benefits assumptions, by saying that high water
consuming industries, including ski resorts, account for 20% of the industrial water annual
consumption in Beijing. However, it is difficult to speculate how the 2022 Olympics will increase
the demand for water to make snow and support the influx of tourists and athletes arriving for the
Games. Additional data and time are needed to more accurately account for additional yearly
benefits and costs of the SNWTP.
Looking at the cost variables, I assumed that the central route accounted for half of the
yearly expenditure. However, given that the SNWTP’s central route is longer than the eastern
route, it is likely that the central route costs more yearly to maintain. The SNWTP’s central route
started diverting water to Beijing in December of 2014. The 2015 expenditure budget is the first
budget that does not account for construction costs. However, upkeep of the route may vary from
29
year to year, resulting in different annual costs. This adds another limitation to my calculation
because, again, I assumed that the yearly cost was the same each year over the next 20 years.
Finally, the expenditure budget stated that it accounted money to protect water quality, but gives
vague details. It is possible that the wastewater treatment costs are not entirely accounted for in
the budget, and that the cost is borne by the various water companies the buy water from the
SNWTP.
Furthermore, little information and data is available about the energy footprint of China’s
water sector. The water sector requires energy for a number of functions. For example, while the
SNWTP’s central route uses gravity to divert water, in the SNWTP’s ministry’s yearly budget
expenditure, it makes no mention of the amount of money the project requires to pump water from
the original sources to the Danjiangkou Reservoir. Furthermore, the SNWTP requires the
purification of millions of cubic meters of water. Wastewater treatment plants in the past have not
consistently been turned on due to high-energy costs to run the plants. To run a wastewater
treatment plant requires between 0.8-1.5 kWh (kilowatt hour) to produce one cubic meter of water
(Tuner,et all, 2015). The SNWTP’s central route was supposed to have 474 wastewater treatment
plants, yet as of December 2013, only 10 percent of these facilities had been completed (Turner,
et all, 2015). Today, statistics on the various costs associated with the energy required for the
SNWTP are still unknown. In the March 2015, China’s Water-Energy-Food Roadmap, Dr.
Jennifer Turner described this phenomenon as a black box. Without knowing the contents of the
black box that is the energy footprint of China’s water sector, it is difficult to know not only the
true cost of the SNWTP, but also the costs of all components of the water sector. This concept is
particularly crucial, because as the meat and food industry continue to grow in China, so does the
need for freshwater. This rise in demand may increase the need to move water to the north, or to
other regions that have lost water as result of the SNWTP. Increasing the size of water transfer
projects and constructing more, will result in a cycle of damming rivers and expensive, high-
energy consuming public projects, that could have serious negative impacts on the environment in
China, and—if rivers flowing downstream to neighboring countries— an international issue.
Finally, and most importantly, this analysis did not include possible costs to the regions
that provided water diverted by the SNWTP and to the regions through which the water was
transferred. In simple terms, what is the negative monetary loss per cubic meter of water regions
incur because of water diverted away by the SNWTP. If these costs are able to be determined, it

30
is more than likely that the costs of the SNWTP would outweigh its benefits. Information on these
costs is limited. However, a field study on the SNWTP to research these costs would be an ideal
way to add available research on this topic.
5.3.3 ALTERNATIVES
There are alternatives to water transfer projects, like the SNWTP, that can alleviate water scarcity
without harming the environment. Given the intensity of water scarcity around the world, various
water consumption adjustments exist. A few of these methods include, price adjustments, changes
to industry production, new methods of agricultural irrigation, and desalinization.
Since May 2014’s increases in water prices, Beijing has seen the following results:
“Household water consumption has declined by 0.17 cubic meters daily, an average drop of 2 liters per person, according to latest figures released by Beijing Waterworks Group. If this trend continues, Beijing residents will hopefully save 10 million cubic meters of water a year. Spurred by May's price hike, many families have taken to recycling water, such as reusing laundry water to flush the toilet or to mop the floor. Others have installed new water tanks to reduce the amount of water used per flush. Meanwhile, the authorities are promoting water-saving practices among major commercial consumers. Car washes, bath houses and golf courses are now all required to use recycled water. For example, newly installed water recycling facilities at car washes limit the amount of water used to clean a sedan car to only 10 liters from at least 70 liters in the past. "All of our waste water is pooled, and then filtered and processed to be used again," said Cao Jinghui, manager of a car wash in Xicheng District. As a result, one ton of water lasts at least 10 days, whereas previously it would have been used up in two days, he said. Even in the suburban area of Pinggu District, the recycling of water at car washes is mandatory. The local water bureau supplies every car wash with recycled water, which it delivers by water tank truck. This is expected to cut annual water consumption by at least 20,000 tons. Meanwhile, around 60 unauthorized car washes have been shut down, cutting the number of car washes in the city to 1,530.” (Jie, 2015). It costs 2.33 yuan per cubic meter to divert SNWTP water to Beijing, however residents in
Beijing pay more than double this price for water (国务院南水北调工程建设委员会办公室,
2015.). However, we assume the difference in price is because 2.33 yuan is the wholesale price
sold to the water companies. By use of the new three tier pricing system, we see that this policy
helped cut down on water use.

31
Various industries use water in production processes or chemical reactions to make
products, including food, clothing, and technology. The World Business Council for Sustainable
Development used the following two examples to show how two different industries where able
to decrease its water use in the production:
“A textile firm in India reduced its water consumption by over 80%, by replacing zinc with aluminum in its synthetic fiber production, by reducing trace metals in wastewater thereby enabling reuse and by using treated water for irrigation by local farmers (Fry, 2015).” “A plant converting sugar cane into sugar in Mexico reduced its consumption of water by over 90% by improving housekeeping and segregating sewage from process wastewater (Fry, 2015).” The above shows that while water is still a major and important component in production,
industries worldwide have begun to take note of its water footprint, and have started to take
measures to curb demand. Some methods, like the above, are simple and would lower production
costs.
Drip irrigation systems are becoming more popular among the agricultural sector as a
method to cut down on water use. With traditional overhead irrigation solutions, water is wasted
through evaporation, wind overspray, mist or surface run-on (Netafirm, 2016). However, in drip
irrigation, water is applied directly to the plant’s root zone, optimizing water usage while
enhancing the aesthetic quality and health of plants (Netafirm, 2016). Netafim’s products surpass
conventional dipper lines due to their high quality and coherency, which provides uniform
coverage while minimizing clogging and ensuring optimal functionality throughout the entire
leaching cycle (Netafirm, 2016). Netafim’s products provide diverse and comprehensive solutions
for cost-effective irrigation for a broad range of crops: open-field crops, orchards, vineyards and
more, by using complete drip irrigation systems and computerized monitoring and fertilization
control systems (Netafirm, 2016). Furthermore, systems are designed according to specific local
conditions, including crop, soil, climate and water resources (Netafirm, 2016). Netafirm systems
combine economical aspects with on-going efficient maintenance and operation, integrating vast
field-proven experience and engineering expertise (Netafirm, 2016).
However, drip irrigation does have its downfalls. The initial cost of installation can be
quite high and may not be a reasonable alternative for most farmers, unless they receive some sort
of government subsidy to afford it. Secondly, because this irrigation method directly sprays water
onto the roots, it may not help recharge depleting aquifer levels.

32
To help replenish aquifers and provide mass amounts of freshwater supply to meet high
demand, many countries have begun to use desalinization plants. Desalination is a macro-level
water scarcity solution, which uses reverse osmosis to remove salt and other particles from
seawater to create potable drinking. Just one desalination plant has the ability to supply more than
500 million liters of water that would be suitable for drinking.
Desalinization has many positive attributes. To begin, reverse osmosis is one method of
desalination that is very understood and backed up with scientific data (Lombardo, 2015). 97% of
the world’s water is seawater, and thus provides a large volume of water to be desalinized.
Additionally desalination plants tend to be located in industrial facilities away from residential
areas, which limits risks and the needs to relocate.
However, desalinization does have many people opposing it. Opponents argue that
desalination plants could produce high amounts of greenhouse gas emissions. Furthermore, when
salt is removed from seawater, it creates a salty brine that can pollute freshwater and ocean sources,
if not properly disposed. Like the SNWTP, desalinization plants are costly initially to build.
Furthermore, just one desalination plant requires lots of energy to operate at full capacity.
Paul Bai, chief executive officer of Aqualyng China, a venture between Norway’s
Aqualyng and Hong Kong-based Beijing Enterprises Water Group, says China is becoming a
crucial market for foreign desalination companies with the latest technology and equipment
(Larson, 2015). “In terms of future potential, China may be the most important place. The
desalination market is very hot right now. The only challenge is the price. Desalinated water will
cost 7 yuan per cubic meter, Bai says. “However, with fewer options” for new water sources, he
adds, “desalination becomes more competitive.” (Larson, 2015). According to state media reports,
building the Bohai Bay plant will desalinize 120,000 tons of seawater each day. This will allow
50,000 tons of potable water, to be piped 170 miles to Beijing— at a cost of 7 billion yuan
($1.1 billion); the pipeline connecting the Bohai Bay plant to Beijing, will cost an additional
10 billion yuan (Larson, 2015). That doesn’t include the high electricity costs the plant will incur
once it’s up and running (Larson, 2015). The California-based Pacific Institute, an environmental
group, estimates it takes 12,000 to 18,000 kilowatt hours to desalinate a million gallons of seawater
(Larson,2015). Pumping groundwater to the surface requires less than 4,000 kilowatt hours per
million gallons (Larson, 2015).
33
Due to high costs to run desalinization plants, scientists have begun to research alternative
lower cost power methods. These methods include powering the plants with nuclear power and
using seawater instead of freshwater to cool reactors extracting salt from seawater.
As China’s water crisis becomes more sever and water demand is expected to outstrip
supply by 2030—which does not account for an expected increase in water demand due to
preparation and hosting the 2022 Winter Olympics Games— it is important to consider
desalination as a more environmentally friendly alternative to the SNWTP, particularly if the salty
brine from desalinization and nuclear waste is disposed properly and monitored to prevent spillage.
If desalination plants follow these standard and replaced the SNWTP, not only will it eliminate
negative environmental impacts of water diversion on South China, it could also help replenish
overexploited aquifers and recharge river levels.
34
6.0 CONCLUSION
While this thesis resulted in the rejection of the hypothesis that the costs of the SNWTP outweigh
its benefits, it is still helpful in showing the need for further research on the impacts of the SNWTP.
While the data availability was limited, even no data is data. The greatest limitation of this thesis
was the ability to put a dollar amount on the cost to Southern China for water diverted north.
Specifically, how the SNWTP has affected GDP, agricultural output, and influenced peoples’
livelihoods due to lower water availability. Because the central route has only been diverting water
for just over a year, it is still difficult to measure these impacts. Due to the central route’s length,
a strong suggestion for future research would be to conduct a field study on the impacts the
SNWTP has had to cities along the central route receiving water and the areas that have lost water
due to the diversion water requirements. Additionally, with the 2022 Beijing Winter Olympics
approaching, water demand is expected to rise. This could result in a spike in the SNWTP’s yearly
benefits. However, it could possibly increase the environmental costs to the South for the
additional water needed to be diverted for Games. Additionally, statistics of the SNWTP’s energy
consumption—both moving the water and for the embedded energy in construction materials—is
unknown (Turner, et all, 2015). As the move away from the dirty, cheap coal industry for energy
continues, it is possible that the price of energy will also increase, thus causing an increase in
yearly cost of the SNWTP. Without having proper statistics on these limitations, it is hard to give
an accurate prediction on whether the benefits of the SNWTP outweigh its costs and to what
degree. However, given that the likely large monetary value on the costs of the SNWTP we were
unable to address in the CBA, it is likely the costs would outweigh the benefits on the SNWTP’s
central route.
Given the amount of money the Central Government has spent on the SNWTP, particularly
the central route, and the political pride surrounding it as the largest water diversion project in the
world, it is unlikely that use of the SNWTP will be discontinued in the near future. However, if
eco-friendlier water supply methods prove to be more cost-effective than the SNWTP, it would
limit negative environmental impacts while meeting demand.

35
APPENDIX A
A.1 INITIAL COSTS AND BENEFITS
The CBA assumes that there is likely to be a large one time initial cost and benefit payment, or
𝐵𝐵𝐼𝐼𝑖𝑖𝑖𝑖𝑖𝑖𝑖𝑖𝑖𝑖𝑖𝑖 and 𝐶𝐶𝑖𝑖𝑖𝑖𝑖𝑖𝑖𝑖𝑖𝑖𝑖𝑖𝑖𝑖, respectively. The SNWTP Ministry notes that the initial total construction
costs of the SNWTP’s central route was 256, 700 million Yuan (国务院南水北调工程建设委员
会办公室, 2015). This value includes important variables, such as; initial construction wage
payments, material costs, and relocation payments. Because it is a total initial cost value provided
by the Chinese Government’s SNWTP water ministry, I assume it to be 𝐶𝐶𝑖𝑖𝑖𝑖𝑖𝑖𝑖𝑖𝑖𝑖𝑖𝑖𝑖𝑖.
One could argue that 𝐵𝐵𝑖𝑖𝑖𝑖𝑖𝑖𝑖𝑖𝑖𝑖𝑖𝑖𝑖𝑖 could be the relocation payment to citizens. However,
because in this CBA, I only evaluate benefits to Beijing, I keep this variable as part of the 𝐶𝐶𝑖𝑖𝑖𝑖𝑖𝑖𝑖𝑖𝑖𝑖𝑖𝑖𝑖𝑖
and assume that there is a zero value for 𝐵𝐵𝑖𝑖𝑖𝑖𝑖𝑖𝑖𝑖𝑖𝑖𝑖𝑖𝑖𝑖.
Based on these assumptions, the initial benefit and cost variables that will be plugged into
the CBA formula are as followed:
𝐶𝐶𝑖𝑖𝑖𝑖𝑖𝑖𝑖𝑖𝑖𝑖𝑖𝑖𝑖𝑖= 256,700 million Yuan
𝐵𝐵𝐼𝐼𝑖𝑖𝑖𝑖𝑖𝑖𝑖𝑖𝑖𝑖𝑖𝑖 = 0 Yuan
A.2 ANNUAL COSTS AND BENEFITS
In the present value cost and benefit formula, cost and benefit variables are expressed in present
monetary equivalents. In order to find monetary equivalents, I performed a series of calculations
on each annual cost and benefit variable. The details of these calculations are shown below for all
variables that were used to calculate 𝐶𝐶𝑦𝑦𝑦𝑦𝑖𝑖𝑦𝑦𝑖𝑖𝑦𝑦 𝑖𝑖𝑎𝑎𝑦𝑦𝑦𝑦𝑖𝑖𝑎𝑎𝑦𝑦 and 𝐵𝐵𝑦𝑦𝑦𝑦𝑖𝑖𝑦𝑦𝑖𝑖𝑦𝑦 𝑖𝑖𝑎𝑎𝑦𝑦𝑦𝑦𝑖𝑖𝑎𝑎𝑦𝑦 .

36
The annual costs and benefits of the SNWTP in the present value formula above are noted
as 𝐶𝐶𝑦𝑦𝑦𝑦𝑖𝑖𝑦𝑦𝑖𝑖𝑦𝑦 𝑖𝑖𝑎𝑎𝑦𝑦𝑦𝑦𝑖𝑖𝑎𝑎𝑦𝑦 and 𝐵𝐵𝑦𝑦𝑦𝑦𝑖𝑖𝑦𝑦𝑖𝑖𝑦𝑦 𝑖𝑖𝑎𝑎𝑦𝑦𝑦𝑦𝑖𝑖𝑎𝑎𝑦𝑦 . The subscript zero denotes that these values are the annual
cost for the first year the project is in use. Because these values reoccur yearly, they are discounted
each year. In my present value calculations, t= 20 years, which means that by year 20,
𝐶𝐶𝑦𝑦𝑦𝑦𝑖𝑖𝑦𝑦𝑖𝑖𝑦𝑦 𝑖𝑖𝑎𝑎𝑦𝑦𝑦𝑦𝑖𝑖𝑎𝑎𝑦𝑦 and 𝐵𝐵𝑦𝑦𝑦𝑦𝑖𝑖𝑦𝑦𝑖𝑖𝑦𝑦 𝑖𝑖𝑎𝑎𝑦𝑦𝑦𝑦𝑖𝑖𝑎𝑎𝑦𝑦 will be discounted by 4% 20 times.
A.2.1 ANNUAL COSTS
I based my annual reoccurring cost on the SNWTP Ministry’s 2015 expenditure budget. The 2015
SWNTP budget allocated just over 25,000 million yuan was allocated for both the SNWTP’s
central and eastern route (国务院南水北调工程建设委员会办公室, 2015). This expenditure
includes cost such as water protection and purification and canal maintenance.
Given that the SNWTP’s central route is longer and cost more to construct, it is likely that
the SNWTP’s central route costs more annually to maintain than the eastern route. However, to
avoid overstating costs, I assume that only half of the 2015 expenditure budget was used for upkeep
on the SNWTP’s central route. Based on this assumption, the base year value for the present
values cost is as followed:
𝐶𝐶𝑦𝑦𝑦𝑦𝑖𝑖𝑦𝑦𝑖𝑖𝑦𝑦 𝑖𝑖𝑎𝑎𝑦𝑦𝑦𝑦𝑖𝑖𝑎𝑎𝑦𝑦 =𝑆𝑆𝑆𝑆𝑆𝑆𝑆𝑆𝑃𝑃′𝑠𝑠 2015 𝑦𝑦𝑒𝑒𝑒𝑒𝑦𝑦𝑒𝑒𝑒𝑒𝑖𝑖𝑒𝑒𝑒𝑒𝑦𝑦𝑦𝑦 𝑏𝑏𝑒𝑒𝑒𝑒𝑎𝑎𝑦𝑦𝑒𝑒
2
12,612,761,950 =25,216,837,200
2
Therefore, it costs just over 12, 613 million yuan annually to maintain the SNWTP’s central route
so that it can keep diverting water to North China.
A.2.2 ANNUAL BENEFITS
I assumed that increased GDP as a result of the SNWTP, additional jobs, and water provided to
Beijing are all annual reoccurring benefits. However, I calculated four different present value
37
benefit variables to test how the impact of different increases in GDP resulting from the SNWTP.
I provide details on how I found my four different present value benefit variables below.
A.2.2.1 INCREASE IN GDP
According to the Chinese government, the SNWTP’s central and eastern route are expected to
add between 0.12% to 0.3% GDP. Because this estimate is based on both of the SNWTP’s routes,
I assume that the SNWTP’s central route will only account for half of the increase to GDP,
therefore I assume the following:
- If the SNWTP increases GDP by 0.13%, then the SNWTP’s central route accounts for
0.065% of this increase in GDP.
- If the SNWTP increases GDP by 0.2%, then the SNWTP’s central route accounts for
0.1% of the increase in GDP.
- If the SNWTP increases GDP by 0.25%, then the SNWTP’s central route accounts for
0.125% of the increase to GDP.
- If the SNWTP increases GDP by 0.3%, then the SNWTP’s central route accounts for
0.15% of the increase to GDP.
Therefore, when referring to increase in GDP by 0.13%, 0.2%, 0.25%, and 0.3%, I use the
values 0.065%, 0.01%, 0.125%, and 0.15% to calculate the corresponding added monetary value
of GDP the SNWTP’s central route will provide.
Increase of GDP by 0.13%. In 2015, China’s GDP was 63,642,670 million yuan. Based
on the above assumption on the percentage increase to GDP the SNWTP’s central route is expected
to provide, by multiplying China’s 2015 GDP, 63,642,670 million yuan, by 0.065%, I can find the
added monetary value of GDP the SNWTP’s central route will provide, as the following:
𝐴𝐴𝑒𝑒𝑒𝑒𝑖𝑖𝑒𝑒𝑖𝑖𝑡𝑡𝑒𝑒𝑦𝑦𝑦𝑦 𝐺𝐺𝐺𝐺𝑃𝑃 𝑒𝑒𝑦𝑦𝑡𝑡𝑎𝑎𝑖𝑖𝑒𝑒𝑦𝑦𝑒𝑒 𝑒𝑒ℎ𝑦𝑦 𝑆𝑆𝑆𝑆𝑆𝑆𝑆𝑆𝑃𝑃′𝑠𝑠 𝑐𝑐𝑦𝑦𝑒𝑒𝑒𝑒𝑦𝑦𝑦𝑦𝑦𝑦 𝑦𝑦𝑡𝑡𝑒𝑒𝑒𝑒𝑦𝑦 = 𝐶𝐶ℎ𝑖𝑖𝑒𝑒𝑦𝑦′𝑠𝑠 2015 𝐺𝐺𝐺𝐺𝑃𝑃 𝑒𝑒 0.065%
41,367,735,500 = 63,642,670,000,000 𝑒𝑒 0.00065
Therefore, if China’s GDP increased by 0.13% because of the SNWTP, 41,367 million
yuan would be added to the annual benefits.

38
By using the above formula, I applied increases in GDP of 0.2%, 0.25%, or 0.3% in China’s
2015 GDP, to find the remaining three possible annual benefits that occur as a result of the
SNWTP’s central route. The following table shows these results.
Table 5: Benefits of GDP Growth Assumed
Assumed GDP Increase Due to SNWTP (%) Benefit Credited to Central Route (Million Yuan)
0.13% 41, 368 0.2% 63,643 0.25% 79,553 0.3% 95,464
*Benefits rounded to nearest million*
A.2.2.2 PERSONNEL EXPRENSES
In 2015, the SNWTP’s yearly expenditure budget allocated, 14,761,300 yuan for personnel
expenses, which included: basic salary, allowances, subsidies, bonuses, social security
contributions, other wages and benefits expenses, retiree premiums, medical expenses, incentive
payments, housing fund, to rent subsidies, housing subsidies, other individuals and families
subsidy expenditure (国务院南水北调办2015年部门预算,2015).
I assumed that the central route only accounts for half of this budget expenditure, or
7,380,650 yuan. I considered this a benefit and not a cost, because these are wages paid to workers
through jobs created by the SNWTP.
While this small amount may seem unnecessary, I include it because I hypothesized that
the SNWTP’s costs would outweigh its benefits. To be fair, I included all benefits the Chinese
government said the SNWTP would provide: increased GDP, job creation, and additional water.
A.2.2.3 CONSUMERS’ VALUES OF WATER
To find the reoccurring annual benefit to Beijing, I wanted to find the annual benefit of
consumption of SNWTP’s central route’s water relative to the new water prices. Beijing has a
three tier household water pricing system:

39
Tier 3: Households consuming less than 180 cubic meters of water annually pay 5 Yuan
per cubic meter of water.
Tier 2: Households consuming between 180 and 260 cubic meter of water annually pay 7
yuan per cubic meter.
Tier 1: Households consuming more than 260 cubic meter of water annually pay 9 yuan
per cubic meter.
Beijing has two different water price levels for industries.
Industry B: High water consumption industries, like golf courses and ski resorts, pay 160
yuan per cubic meter (Jie, 2014). No information was provided on how much water an
industry consumes annually to fall into this pricing level.
Industry A: Most industries pay 8.15 yuan per cubic meter (Jie, 2014). No information
was provided on the maximum cubic meters of water an industry can consume annually to
fall into this pricing level.
Reports show that the main beneficiaries in Beijing of the water diverted by the SNWTP
will be industries and households. However, I account for the remaining consumers of water in
Beijing as one tertiary sector (hospitals, universities, etc.). I assign the tertiary sector a price of
8.15 yuan per cubic meter of water, and thus assume that this sector is an average water consumer
relative to industries.
A.2.2.3 .1 HOUSEHOLDS’ ANNUAL CONSUMPTION
Tier 3. First, I needed to find the total number of households in Beijing. For this calculation, I
found the population of Beijing, 20,000,000, and divided it by the average household size of
Beijing, 3.21, or:
𝑆𝑆𝑡𝑡𝑒𝑒𝑦𝑦𝑦𝑦 𝑒𝑒𝑒𝑒𝑛𝑛𝑏𝑏𝑦𝑦𝑦𝑦 𝑡𝑡𝑜𝑜 ℎ𝑡𝑡𝑒𝑒𝑠𝑠𝑦𝑦ℎ𝑡𝑡𝑦𝑦𝑒𝑒𝑠𝑠 𝑖𝑖𝑒𝑒 𝐵𝐵𝑦𝑦𝑖𝑖𝐵𝐵𝑖𝑖𝑒𝑒𝑎𝑎 = 𝑃𝑃𝑡𝑡𝑒𝑒𝑒𝑒𝑦𝑦𝑦𝑦𝑒𝑒𝑖𝑖𝑡𝑡𝑒𝑒 𝑡𝑡𝑜𝑜 𝐵𝐵𝑦𝑦𝑖𝑖𝐵𝐵𝑖𝑖𝑒𝑒𝑎𝑎𝐴𝐴𝑎𝑎𝑦𝑦𝑦𝑦𝑦𝑦𝑎𝑎𝑦𝑦 ℎ𝑡𝑡𝑒𝑒𝑠𝑠𝑦𝑦ℎ𝑡𝑡𝑦𝑦𝑒𝑒 𝑠𝑠𝑖𝑖𝑠𝑠𝑦𝑦
6,230,530 = 20,000,000
3.21
90% of households in Beijing fall under Tier 3 (Jie, 2014). To find the number of
households in this tier, I multiplied the total number of households in Beijing by 90% or:
𝑆𝑆𝑡𝑡𝑒𝑒𝑦𝑦𝑦𝑦 𝑆𝑆𝑒𝑒𝑛𝑛𝑏𝑏𝑦𝑦𝑦𝑦 𝑡𝑡𝑜𝑜 ℎ𝑡𝑡𝑒𝑒𝑠𝑠𝑦𝑦ℎ𝑡𝑡𝑦𝑦𝑒𝑒𝑠𝑠 𝑖𝑖𝑒𝑒 𝑆𝑆𝑖𝑖𝑦𝑦𝑦𝑦 3 = 𝑆𝑆𝑡𝑡𝑒𝑒𝑦𝑦𝑦𝑦 𝑒𝑒𝑒𝑒𝑛𝑛𝑏𝑏𝑦𝑦𝑦𝑦 𝑡𝑡𝑜𝑜 ℎ𝑡𝑡𝑒𝑒𝑠𝑠𝑦𝑦ℎ𝑡𝑡𝑦𝑦𝑒𝑒𝑠𝑠 𝑖𝑖𝑒𝑒 𝐵𝐵𝑦𝑦𝑖𝑖𝐵𝐵𝑖𝑖𝑒𝑒𝑎𝑎 𝑒𝑒 90%

40
5,607,477 ∗ = 6,230,530 x 0.90
*Number rounded to the nearest household*
Next, I wanted to find the annual water consumption for Tier 3 households. Beijing’s water
per capita is 150 cubic meters per year (Jie, 2014). Because 90% of households fall under Tier 3,
I assume that these households consume 150 cubic meters of water annually, or:
𝑆𝑆𝑖𝑖𝑦𝑦𝑦𝑦 3 ℎ𝑡𝑡𝑒𝑒𝑠𝑠𝑦𝑦ℎ𝑡𝑡𝑦𝑦𝑒𝑒𝑠𝑠′ 𝑒𝑒𝑡𝑡𝑒𝑒𝑦𝑦𝑦𝑦 𝑦𝑦𝑒𝑒𝑒𝑒𝑒𝑒𝑦𝑦𝑦𝑦 𝑤𝑤𝑦𝑦𝑒𝑒𝑦𝑦𝑦𝑦 𝑐𝑐𝑡𝑡𝑒𝑒𝑠𝑠𝑒𝑒𝑛𝑛𝑒𝑒𝑒𝑒𝑖𝑖𝑡𝑡𝑒𝑒=
𝑆𝑆𝑡𝑡𝑒𝑒𝑦𝑦𝑦𝑦 𝑆𝑆𝑒𝑒𝑛𝑛𝑏𝑏𝑦𝑦𝑦𝑦 𝑡𝑡𝑜𝑜 𝑆𝑆𝑖𝑖𝑦𝑦𝑦𝑦 3 ℎ𝑡𝑡𝑒𝑒𝑠𝑠𝑦𝑦ℎ𝑡𝑡𝑦𝑦𝑒𝑒𝑠𝑠 𝑒𝑒 150 𝑐𝑐𝑒𝑒𝑏𝑏𝑖𝑖𝑐𝑐 𝑛𝑛𝑦𝑦𝑒𝑒𝑦𝑦𝑦𝑦 𝑡𝑡𝑜𝑜 𝑤𝑤𝑦𝑦𝑒𝑒𝑦𝑦𝑦𝑦
841,121,550 = 5,607,477 𝑒𝑒 150
Therefore, Tier 3 households consume 841 million cubic meter of water annually.
Unlike Tier 3 households, I did not know what percentage of households fell under Tier 1
and Tier 2 or exactly how many cubic meter of water per year these households consumed.
Therefore, I assumed that 7% of households in Beijing fell under Tier 2 and consumed 220 cubic
meters of water per year. I assumed that 3% of households in Beijing fell under Tier 1 and
consumed 260 cubic meters of water per year. I applied these assumptions into the methodology
used to find the annual consumption of Tier 3 households; the following table shows these results.
Table 6: Households’ Assumed Annual Water Consumption
Households Assumed Annual Water Consumption (Cubic Meters/ Millions)*
Tier 3 841 Tier 2 96 Tier 1 49
*Numbers are rounded to the nearest million*
A.2.2.3 .2 INDUSTIRIES’ ANNUAL CONSUMPTION
Through the Beijing Water Statistical Yearbook, I was able to find the total amount of water
consumed by industries. However, I do not know the total number of industries considered to be
high water consumers and average water consumers. Furthermore, I do not know water
consumption levels categorized by the government as or average.
I referred to high water consuming industries as ‘Industry B’, and average water
consumption industries as ‘Industry A’. I made the assumption that 80% of industries fall under
Industry A and 20% of industries fall under Industry B.

41
Industry B. In 2013 industries consumed 510,000,000 cubic meters of water (北京市历年
水资源情况统计(2001-2013), 2014). I assumed that majority of industries in Beijing are average
water consumers, and therefore consumed 80% of the total amount of water consumed by
industries in 2013. I calculated Industry B’s annual water consumption as the following.
𝐴𝐴𝑒𝑒𝑒𝑒𝑒𝑒𝑦𝑦𝑦𝑦 𝑆𝑆𝑦𝑦𝑒𝑒𝑦𝑦𝑦𝑦 𝐶𝐶𝑡𝑡𝑒𝑒𝑠𝑠𝑒𝑒𝑛𝑛𝑒𝑒𝑒𝑒𝑖𝑖𝑡𝑡𝑒𝑒 𝑡𝑡𝑜𝑜 𝐼𝐼𝑒𝑒𝑒𝑒𝑒𝑒𝑠𝑠𝑒𝑒𝑦𝑦𝑦𝑦 𝐵𝐵=
𝑆𝑆𝑡𝑡𝑒𝑒𝑦𝑦𝑦𝑦 𝑦𝑦𝑛𝑛𝑡𝑡𝑒𝑒𝑒𝑒𝑒𝑒 𝑡𝑡𝑜𝑜 𝑤𝑤𝑦𝑦𝑒𝑒𝑦𝑦𝑦𝑦 𝑐𝑐𝑡𝑡𝑒𝑒𝑠𝑠𝑒𝑒𝑛𝑛𝑦𝑦𝑒𝑒 𝑏𝑏𝑦𝑦 𝑖𝑖𝑒𝑒𝑒𝑒𝑒𝑒𝑠𝑠𝑒𝑒𝑦𝑦𝑖𝑖𝑦𝑦𝑠𝑠 𝑖𝑖𝑒𝑒 2013 𝑒𝑒 80%
408,000,000 = 510,000,000 x 0.80
Therefore, I assume that industry B consumes 408 million cubic meters of water annually.
Assuming that 20% of industries fall under Industry A and applying the same methodology
used to find the annual water consumption of Industry B, I found the following figure displayed in
the table below for annual water consumption in Industry A.
Table 7: Industries’ Annual Water Consumption
Industry Assumed Annual Water Consumption (Cubic Meters/ Millions)
B 408 A 102
*Numbers are rounded to the nearest million*
A.2.2.3 .3 TERTIARY SECTOR’S ANNUAL CONSUMPTION
As noted previously, I account for the remaining consumers of water in Beijing as one tertiary
sector (hospitals, universities, etc.). I assign the tertiary sector a price of 8.15 yuan per cubic meter
of water, and thus assume that this sector is an average water consumer relative to industries. To
find the tertiary sector’s annual water consumption, I assume it to be the total annual water
consumption in Beijing minus households and industries annual water consumption, calculated as
the following:

42
𝑆𝑆𝑦𝑦𝑦𝑦𝑒𝑒𝑖𝑖𝑦𝑦𝑦𝑦𝑦𝑦 𝑠𝑠𝑦𝑦𝑐𝑐𝑒𝑒𝑡𝑡𝑦𝑦′𝑠𝑠 𝑦𝑦𝑒𝑒𝑒𝑒𝑒𝑒𝑦𝑦𝑦𝑦 𝑤𝑤𝑦𝑦𝑒𝑒𝑦𝑦𝑦𝑦 𝑐𝑐𝑡𝑡𝑒𝑒𝑠𝑠𝑒𝑒𝑛𝑛𝑒𝑒𝑒𝑒𝑖𝑖𝑡𝑡𝑒𝑒 = 𝑦𝑦𝑒𝑒𝑒𝑒𝑒𝑒𝑦𝑦𝑦𝑦 𝑤𝑤𝑦𝑦𝑒𝑒𝑦𝑦𝑦𝑦 𝑐𝑐𝑡𝑡𝑒𝑒𝑠𝑠𝑒𝑒𝑛𝑛𝑒𝑒𝑒𝑒𝑖𝑖𝑡𝑡𝑒𝑒 𝑖𝑖𝑒𝑒 𝐵𝐵𝑦𝑦𝑖𝑖𝐵𝐵𝑖𝑖𝑒𝑒𝑎𝑎
− 𝑆𝑆𝑖𝑖𝑦𝑦𝑦𝑦 1 ℎ𝑡𝑡𝑒𝑒𝑠𝑠𝑦𝑦ℎ𝑡𝑡𝑦𝑦𝑒𝑒𝑠𝑠′𝑦𝑦𝑒𝑒𝑒𝑒𝑒𝑒𝑦𝑦𝑦𝑦 𝑤𝑤𝑦𝑦𝑒𝑒𝑦𝑦𝑦𝑦 𝑐𝑐𝑡𝑡𝑒𝑒𝑠𝑠𝑒𝑒𝑛𝑛𝑒𝑒𝑒𝑒𝑖𝑖𝑡𝑡𝑒𝑒
− 𝑆𝑆𝑖𝑖𝑦𝑦𝑦𝑦 2 ℎ𝑡𝑡𝑒𝑒𝑠𝑠𝑦𝑦ℎ𝑡𝑡𝑦𝑦𝑒𝑒𝑠𝑠′𝑦𝑦𝑒𝑒𝑒𝑒𝑒𝑒𝑦𝑦𝑦𝑦 𝑤𝑤𝑦𝑦𝑒𝑒𝑦𝑦𝑦𝑦 𝑐𝑐𝑡𝑡𝑒𝑒𝑠𝑠𝑒𝑒𝑛𝑛𝑒𝑒𝑒𝑒𝑖𝑖𝑡𝑡𝑒𝑒
− 𝑆𝑆𝑖𝑖𝑦𝑦𝑦𝑦 3 ℎ𝑡𝑡𝑒𝑒𝑠𝑠𝑦𝑦ℎ𝑡𝑡𝑦𝑦𝑒𝑒𝑠𝑠′𝑦𝑦𝑒𝑒𝑒𝑒𝑒𝑒𝑦𝑦𝑦𝑦 𝑤𝑤𝑦𝑦𝑒𝑒𝑦𝑦𝑦𝑦 𝑐𝑐𝑡𝑡𝑒𝑒𝑠𝑠𝑒𝑒𝑛𝑛𝑒𝑒𝑒𝑒𝑖𝑖𝑡𝑡𝑒𝑒
− 𝐼𝐼𝑒𝑒𝑒𝑒𝑒𝑒𝑠𝑠𝑒𝑒𝑦𝑦𝑦𝑦 𝐵𝐵′𝑠𝑠 𝑦𝑦𝑒𝑒𝑒𝑒𝑒𝑒𝑦𝑦𝑦𝑦 𝑤𝑤𝑦𝑦𝑒𝑒𝑦𝑦𝑦𝑦 𝑐𝑐𝑡𝑡𝑒𝑒𝑠𝑠𝑒𝑒𝑛𝑛𝑒𝑒𝑒𝑒𝑖𝑖𝑡𝑡𝑒𝑒
− 𝐼𝐼𝑒𝑒𝑒𝑒𝑒𝑒𝑠𝑠𝑒𝑒𝑦𝑦𝑦𝑦 𝐴𝐴′𝑠𝑠 𝑦𝑦𝑒𝑒𝑒𝑒𝑒𝑒𝑦𝑦𝑦𝑦 𝑤𝑤𝑦𝑦𝑒𝑒𝑦𝑦𝑦𝑦 𝑐𝑐𝑡𝑡𝑒𝑒𝑠𝑠𝑒𝑒𝑛𝑛𝑒𝑒𝑒𝑒𝑖𝑖𝑡𝑡𝑒𝑒
2,104,330,150 = 3,600,000,000 − 48,598,160 − 95,950,140 − 841,121,550 − 408,000,000
− 102,000,000
Therefore, 2,104 million cubic meters of water are consumed by the tertiary sector
annually.
For clarity, the following table displays the assumed annual water consumption for all
consumers benefiting from the water diverted by the SNWTP’s central route.
Table 8: Consumers’ Assumed Annual Water Consumption
Consumer Assumed Annual Water Consumption (Cubic Meters/ Millions)
Tier 3 Households 841 Tier 2 Households 96 Tier 1 Households 49 Industry B 408 Industry A 102 Tertiary Sector 2,104
*Numbers are rounded to the nearest million*
A.2.2.3 .4 CONSUMERS’ PERCENTAGE SHARES OF WATER CONSUMPTION
The SNWTP’s central route supplies 350,000,000 cubic meters annually to Beijing. Yet this
supply meets only a portion of total water demanded by households, industries, and the tertiary
sector. Because industries, the tertiary sector, and each tier of households pay different prices of
water per cubic meter, I needed to calculate each consumer’s —Tier 1 households’, Tier 2
households’, Tier 3 households’, Industry A’s, Industry B’s, and the Tertiary Sector’s—percentage
share of water consumption. Then, I could find what percentage of water provided by the SNWTP
each consumes before translating this consumption into a monetary equivalent. I do this by finding
each consumer’s percentage share of water consumption.
43
Tier 3 households’ percentage share of consumption. To find Tier 3 households’
percentage share of Beijing’s water consumption, relative to Tier 2 households, Tier 1 households,
Industry A, Industry B and Tertiary Sector, I divided the total amount of water consumed annually
by Tier 3 households by the Beijing’s total annual water consumption and then multiplied this
number be 100 to find a percentage value, which is calculated as the following:
𝑆𝑆𝑖𝑖𝑦𝑦𝑦𝑦 3 ℎ𝑡𝑡𝑒𝑒𝑠𝑠𝑦𝑦ℎ𝑡𝑡𝑦𝑦𝑒𝑒𝑠𝑠′ 𝑒𝑒𝑦𝑦𝑦𝑦𝑐𝑐𝑦𝑦𝑒𝑒𝑒𝑒𝑦𝑦𝑎𝑎𝑦𝑦 𝑠𝑠ℎ𝑦𝑦𝑦𝑦𝑦𝑦 𝑡𝑡𝑜𝑜 𝑐𝑐𝑡𝑡𝑒𝑒𝑠𝑠𝑒𝑒𝑛𝑛𝑒𝑒𝑒𝑒𝑖𝑖𝑡𝑡𝑒𝑒=
𝑆𝑆𝑖𝑖𝑦𝑦𝑦𝑦 3 ℎ𝑡𝑡𝑒𝑒𝑠𝑠𝑦𝑦ℎ𝑡𝑡𝑦𝑦𝑒𝑒𝑠𝑠′ 𝑦𝑦𝑒𝑒𝑒𝑒𝑒𝑒𝑦𝑦𝑦𝑦 𝑤𝑤𝑦𝑦𝑒𝑒𝑦𝑦𝑦𝑦 𝑐𝑐𝑡𝑡𝑒𝑒𝑠𝑠𝑒𝑒𝑛𝑛𝑒𝑒𝑒𝑒𝑖𝑖𝑡𝑡𝑒𝑒𝐵𝐵𝑦𝑦𝑖𝑖𝐵𝐵𝑖𝑖𝑒𝑒𝑎𝑎′𝑠𝑠 𝑦𝑦𝑒𝑒𝑒𝑒𝑒𝑒𝑦𝑦𝑦𝑦 𝑤𝑤𝑦𝑦𝑒𝑒𝑦𝑦𝑦𝑦 𝑐𝑐𝑡𝑡𝑒𝑒𝑠𝑠𝑒𝑒𝑛𝑛𝑒𝑒𝑒𝑒𝑖𝑖𝑡𝑡𝑒𝑒
𝑒𝑒 100
23.37% =841,121,550
3,600,000,000 𝑒𝑒 100
Therefore, Tier 3 households’ percentage share of water consumption is 23.37%.
Following the above methodology for Tier 2 households, Tier 1 households, Industry B,
Industry A, and the Tertiary Sector, the following table displays the results for all consumers’
assumed percentage share of water consumption in the Beijing water market.
Table 9: Consumers’ Assumed Percentage Share of Annual Water
Consumer Share of Annual Water Consumption (%) Tier 3 Households 23.37 Tier 2 Households 2.67 Tier 1 Households 1.37 Industry B 11.33 Industry A 2.83 Tertiary Sector 58.45
*Numbers are rounded to the nearest hundredth percent*
A.2.2.3 .5 AMOUNT OF WATER CONSUMED BY CONSUMERS
In 2013, the SNWTP’s central route provided 350 million cubic meters of water to Beijing (北京
市历年水资源情况统计(2001-2013), 2014). This is the most recent water statistic provided by
the Chinese government. More recent non-government estimates show the SNWTP’s central route
to be diverting more than 350 million cubic meters of water to Beijing. However, in order to keep
limitations low, I only the use official Chinese governmental data from yearly statistical yearbooks.
Furthermore, there is no official information provided by the Chinese government on what
portion of the SNWTP’s water is consumed by each beneficiary, whether it be households,
44
industries or the tertiary sector. Therefore, using the households’, industries’, and tertiary sector’s
percentage share of water consumption in Beijing, I can make an estimate of how much water
diverted by the SNWTP’s central route each consumers consumes annually.
Amount of SNWTP water consumed by Tier 3 households. If Tier 3 households accounted
for 23.37% of Beijing’s annual water consumption, assuming the market consists of Tier 1
households, Tier 2 households, Tier 3 households, Industry A, Industry B, and the Tertiary Sector.
By multiplying Tier 3 households’ percentage share of water consumption by the amount of water
the SNWTP provided in one year, I was able to find how much of the SNWTP Tier 3 households
consumed, as the following:
𝑆𝑆𝑆𝑆𝑆𝑆𝑆𝑆𝑃𝑃 𝑤𝑤𝑦𝑦𝑒𝑒𝑦𝑦𝑦𝑦 𝑐𝑐𝑡𝑡𝑒𝑒𝑠𝑠𝑒𝑒𝑛𝑛𝑦𝑦𝑒𝑒 𝑏𝑏𝑦𝑦 𝑆𝑆𝑖𝑖𝑦𝑦𝑦𝑦 3 ℎ𝑡𝑡𝑒𝑒𝑠𝑠𝑦𝑦ℎ𝑡𝑡𝑦𝑦𝑒𝑒𝑠𝑠=
𝑆𝑆𝑡𝑡𝑒𝑒𝑦𝑦𝑦𝑦 𝑦𝑦𝑛𝑛𝑡𝑡𝑒𝑒𝑒𝑒𝑒𝑒 𝑡𝑡𝑜𝑜 𝑤𝑤𝑦𝑦𝑒𝑒𝑦𝑦𝑦𝑦 𝑒𝑒𝑦𝑦𝑡𝑡𝑎𝑎𝑖𝑖𝑒𝑒𝑦𝑦𝑒𝑒 𝑏𝑏𝑦𝑦 𝑒𝑒ℎ𝑦𝑦 𝑆𝑆𝑆𝑆𝑆𝑆𝑆𝑆𝑃𝑃 𝑦𝑦𝑒𝑒𝑒𝑒𝑒𝑒𝑦𝑦𝑦𝑦𝑦𝑦𝑦𝑦 𝑒𝑒 𝑆𝑆𝑖𝑖𝑦𝑦𝑦𝑦 3 ℎ𝑡𝑡𝑒𝑒𝑠𝑠𝑦𝑦ℎ𝑡𝑡𝑦𝑦𝑒𝑒𝑠𝑠 𝑒𝑒𝑦𝑦𝑦𝑦𝑐𝑐𝑦𝑦𝑒𝑒𝑒𝑒𝑦𝑦𝑎𝑎𝑦𝑦 𝑠𝑠ℎ𝑦𝑦𝑦𝑦𝑦𝑦 𝑡𝑡𝑜𝑜 𝐵𝐵𝑦𝑦𝑖𝑖𝐵𝐵𝑖𝑖𝑒𝑒𝑎𝑎′𝑠𝑠 𝑦𝑦𝑒𝑒𝑒𝑒𝑒𝑒𝑦𝑦𝑦𝑦 𝑤𝑤𝑦𝑦𝑒𝑒𝑦𝑦𝑦𝑦 𝑐𝑐𝑡𝑡𝑒𝑒𝑠𝑠𝑒𝑒𝑛𝑛𝑒𝑒𝑒𝑒𝑖𝑖𝑡𝑡𝑒𝑒
81,795,000 = 350,000,000 x 0.2337
Therefore, Tier 3 households consume roughly 82 million cubic meters annually of the 350 million
cubic meters of water the SNWTP provided in 2013.
Using the above methodology and applying the appropriate percentage share of annual
water consumption figures for the remaining consumers in the market, I found the following
figures displayed in the chart below for how much water each consumer in the market for SNWTP
water consumes annually.
Table 10: Consumers’ Assumed Consumption of SNWTP Water
Consumer Annual Water Consumption of SNWTP Water (Cubic Meter/ Millions)*
Tier 3 Households 82 Tier 2 Households 9 Tier 1 Households 5 Industry B 40 Industry A 10 Tertiary Sector 205
*Numbers are rounded to the nearest million*
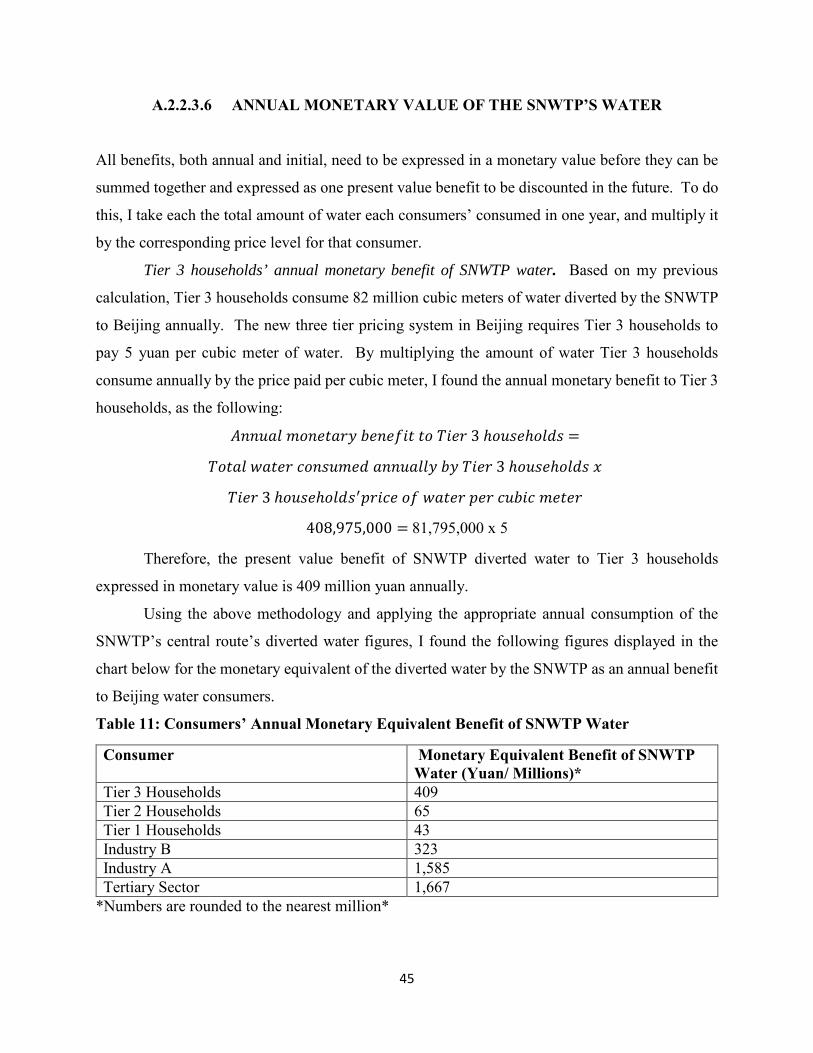
45
A.2.2.3 .6 ANNUAL MONETARY VALUE OF THE SNWTP’S WATER
All benefits, both annual and initial, need to be expressed in a monetary value before they can be
summed together and expressed as one present value benefit to be discounted in the future. To do
this, I take each the total amount of water each consumers’ consumed in one year, and multiply it
by the corresponding price level for that consumer.
Tier 3 households’ annual monetary benefit of SNWTP water. Based on my previous
calculation, Tier 3 households consume 82 million cubic meters of water diverted by the SNWTP
to Beijing annually. The new three tier pricing system in Beijing requires Tier 3 households to
pay 5 yuan per cubic meter of water. By multiplying the amount of water Tier 3 households
consume annually by the price paid per cubic meter, I found the annual monetary benefit to Tier 3
households, as the following:
𝐴𝐴𝑒𝑒𝑒𝑒𝑒𝑒𝑦𝑦𝑦𝑦 𝑛𝑛𝑡𝑡𝑒𝑒𝑦𝑦𝑒𝑒𝑦𝑦𝑦𝑦𝑦𝑦 𝑏𝑏𝑦𝑦𝑒𝑒𝑦𝑦𝑜𝑜𝑖𝑖𝑒𝑒 𝑒𝑒𝑡𝑡 𝑆𝑆𝑖𝑖𝑦𝑦𝑦𝑦 3 ℎ𝑡𝑡𝑒𝑒𝑠𝑠𝑦𝑦ℎ𝑡𝑡𝑦𝑦𝑒𝑒𝑠𝑠 =
𝑆𝑆𝑡𝑡𝑒𝑒𝑦𝑦𝑦𝑦 𝑤𝑤𝑦𝑦𝑒𝑒𝑦𝑦𝑦𝑦 𝑐𝑐𝑡𝑡𝑒𝑒𝑠𝑠𝑒𝑒𝑛𝑛𝑦𝑦𝑒𝑒 𝑦𝑦𝑒𝑒𝑒𝑒𝑒𝑒𝑦𝑦𝑦𝑦𝑦𝑦𝑦𝑦 𝑏𝑏𝑦𝑦 𝑆𝑆𝑖𝑖𝑦𝑦𝑦𝑦 3 ℎ𝑡𝑡𝑒𝑒𝑠𝑠𝑦𝑦ℎ𝑡𝑡𝑦𝑦𝑒𝑒𝑠𝑠 𝑒𝑒
𝑆𝑆𝑖𝑖𝑦𝑦𝑦𝑦 3 ℎ𝑡𝑡𝑒𝑒𝑠𝑠𝑦𝑦ℎ𝑡𝑡𝑦𝑦𝑒𝑒𝑠𝑠′𝑒𝑒𝑦𝑦𝑖𝑖𝑐𝑐𝑦𝑦 𝑡𝑡𝑜𝑜 𝑤𝑤𝑦𝑦𝑒𝑒𝑦𝑦𝑦𝑦 𝑒𝑒𝑦𝑦𝑦𝑦 𝑐𝑐𝑒𝑒𝑏𝑏𝑖𝑖𝑐𝑐 𝑛𝑛𝑦𝑦𝑒𝑒𝑦𝑦𝑦𝑦
408,975,000 = 81,795,000 x 5
Therefore, the present value benefit of SNWTP diverted water to Tier 3 households
expressed in monetary value is 409 million yuan annually.
Using the above methodology and applying the appropriate annual consumption of the
SNWTP’s central route’s diverted water figures, I found the following figures displayed in the
chart below for the monetary equivalent of the diverted water by the SNWTP as an annual benefit
to Beijing water consumers.
Table 11: Consumers’ Annual Monetary Equivalent Benefit of SNWTP Water
Consumer Monetary Equivalent Benefit of SNWTP Water (Yuan/ Millions)*
Tier 3 Households 409 Tier 2 Households 65 Tier 1 Households 43 Industry B 323 Industry A 1,585 Tertiary Sector 1,667
*Numbers are rounded to the nearest million*
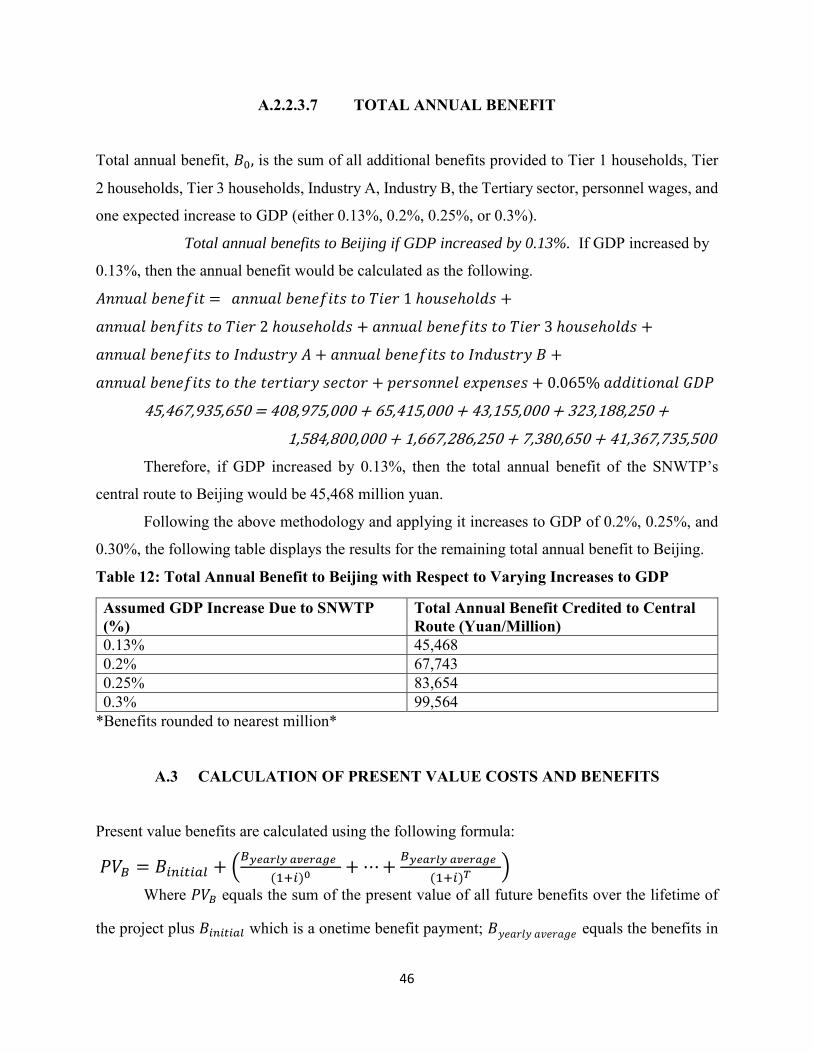
46
A.2.2.3 .7 TOTAL ANNUAL BENEFIT
Total annual benefit, 𝐵𝐵0, is the sum of all additional benefits provided to Tier 1 households, Tier
2 households, Tier 3 households, Industry A, Industry B, the Tertiary sector, personnel wages, and
one expected increase to GDP (either 0.13%, 0.2%, 0.25%, or 0.3%).
Total annual benefits to Beijing if GDP increased by 0.13%. If GDP increased by
0.13%, then the annual benefit would be calculated as the following.
𝐴𝐴𝑒𝑒𝑒𝑒𝑒𝑒𝑦𝑦𝑦𝑦 𝑏𝑏𝑦𝑦𝑒𝑒𝑦𝑦𝑜𝑜𝑖𝑖𝑒𝑒 = 𝑦𝑦𝑒𝑒𝑒𝑒𝑒𝑒𝑦𝑦𝑦𝑦 𝑏𝑏𝑦𝑦𝑒𝑒𝑦𝑦𝑜𝑜𝑖𝑖𝑒𝑒𝑠𝑠 𝑒𝑒𝑡𝑡 𝑆𝑆𝑖𝑖𝑦𝑦𝑦𝑦 1 ℎ𝑡𝑡𝑒𝑒𝑠𝑠𝑦𝑦ℎ𝑡𝑡𝑦𝑦𝑒𝑒𝑠𝑠 +
𝑦𝑦𝑒𝑒𝑒𝑒𝑒𝑒𝑦𝑦𝑦𝑦 𝑏𝑏𝑦𝑦𝑒𝑒𝑜𝑜𝑖𝑖𝑒𝑒𝑠𝑠 𝑒𝑒𝑡𝑡 𝑆𝑆𝑖𝑖𝑦𝑦𝑦𝑦 2 ℎ𝑡𝑡𝑒𝑒𝑠𝑠𝑦𝑦ℎ𝑡𝑡𝑦𝑦𝑒𝑒𝑠𝑠 + 𝑦𝑦𝑒𝑒𝑒𝑒𝑒𝑒𝑦𝑦𝑦𝑦 𝑏𝑏𝑦𝑦𝑒𝑒𝑦𝑦𝑜𝑜𝑖𝑖𝑒𝑒𝑠𝑠 𝑒𝑒𝑡𝑡 𝑆𝑆𝑖𝑖𝑦𝑦𝑦𝑦 3 ℎ𝑡𝑡𝑒𝑒𝑠𝑠𝑦𝑦ℎ𝑡𝑡𝑦𝑦𝑒𝑒𝑠𝑠 +
𝑦𝑦𝑒𝑒𝑒𝑒𝑒𝑒𝑦𝑦𝑦𝑦 𝑏𝑏𝑦𝑦𝑒𝑒𝑦𝑦𝑜𝑜𝑖𝑖𝑒𝑒𝑠𝑠 𝑒𝑒𝑡𝑡 𝐼𝐼𝑒𝑒𝑒𝑒𝑒𝑒𝑠𝑠𝑒𝑒𝑦𝑦𝑦𝑦 𝐴𝐴 + 𝑦𝑦𝑒𝑒𝑒𝑒𝑒𝑒𝑦𝑦𝑦𝑦 𝑏𝑏𝑦𝑦𝑒𝑒𝑦𝑦𝑜𝑜𝑖𝑖𝑒𝑒𝑠𝑠 𝑒𝑒𝑡𝑡 𝐼𝐼𝑒𝑒𝑒𝑒𝑒𝑒𝑠𝑠𝑒𝑒𝑦𝑦𝑦𝑦 𝐵𝐵 +
𝑦𝑦𝑒𝑒𝑒𝑒𝑒𝑒𝑦𝑦𝑦𝑦 𝑏𝑏𝑦𝑦𝑒𝑒𝑦𝑦𝑜𝑜𝑖𝑖𝑒𝑒𝑠𝑠 𝑒𝑒𝑡𝑡 𝑒𝑒ℎ𝑦𝑦 𝑒𝑒𝑦𝑦𝑦𝑦𝑒𝑒𝑖𝑖𝑦𝑦𝑦𝑦𝑦𝑦 𝑠𝑠𝑦𝑦𝑐𝑐𝑒𝑒𝑡𝑡𝑦𝑦 + 𝑒𝑒𝑦𝑦𝑦𝑦𝑠𝑠𝑡𝑡𝑒𝑒𝑒𝑒𝑦𝑦𝑦𝑦 𝑦𝑦𝑒𝑒𝑒𝑒𝑦𝑦𝑒𝑒𝑠𝑠𝑦𝑦𝑠𝑠 + 0.065% 𝑦𝑦𝑒𝑒𝑒𝑒𝑖𝑖𝑒𝑒𝑖𝑖𝑡𝑡𝑒𝑒𝑦𝑦𝑦𝑦 𝐺𝐺𝐺𝐺𝑃𝑃
45,467,935,650 = 408,975,000 + 65,415,000 + 43,155,000 + 323,188,250 +
1,584,800,000 + 1,667,286,250 + 7,380,650 + 41,367,735,500 Therefore, if GDP increased by 0.13%, then the total annual benefit of the SNWTP’s
central route to Beijing would be 45,468 million yuan.
Following the above methodology and applying it increases to GDP of 0.2%, 0.25%, and
0.30%, the following table displays the results for the remaining total annual benefit to Beijing.
Table 12: Total Annual Benefit to Beijing with Respect to Varying Increases to GDP
Assumed GDP Increase Due to SNWTP (%)
Total Annual Benefit Credited to Central Route (Yuan/Million)
0.13% 45,468 0.2% 67,743 0.25% 83,654 0.3% 99,564
*Benefits rounded to nearest million*
A.3 CALCULATION OF PRESENT VALUE COSTS AND BENEFITS
Present value benefits are calculated using the following formula:
𝑃𝑃𝑃𝑃𝐵𝐵 = 𝐵𝐵𝑖𝑖𝑖𝑖𝑖𝑖𝑖𝑖𝑖𝑖𝑖𝑖𝑖𝑖 + �𝐵𝐵𝑦𝑦𝑦𝑦𝑦𝑦𝑦𝑦𝑦𝑦𝑦𝑦 𝑦𝑦𝑎𝑎𝑦𝑦𝑦𝑦𝑦𝑦𝑎𝑎𝑦𝑦
(1+𝑖𝑖)0+ ⋯+ 𝐵𝐵𝑦𝑦𝑦𝑦𝑦𝑦𝑦𝑦𝑦𝑦𝑦𝑦 𝑦𝑦𝑎𝑎𝑦𝑦𝑦𝑦𝑦𝑦𝑎𝑎𝑦𝑦
(1+𝑖𝑖)𝑇𝑇�
Where 𝑃𝑃𝑃𝑃𝐵𝐵 equals the sum of the present value of all future benefits over the lifetime of
the project plus 𝐵𝐵𝑖𝑖𝑖𝑖𝑖𝑖𝑖𝑖𝑖𝑖𝑖𝑖𝑖𝑖 which is a onetime benefit payment; 𝐵𝐵𝑦𝑦𝑦𝑦𝑦𝑦𝑦𝑦𝑦𝑦𝑦𝑦 𝑦𝑦𝑎𝑎𝑦𝑦𝑦𝑦𝑦𝑦𝑎𝑎𝑦𝑦 equals the benefits in

47
the first year of the projects use; i is the discount rate that discounts future benefits; and t equals
the lifetime of the project—ie, the number of times 𝐵𝐵𝑦𝑦𝑦𝑦𝑖𝑖𝑦𝑦𝑖𝑖𝑦𝑦 𝑖𝑖𝑎𝑎𝑦𝑦𝑦𝑦𝑖𝑖𝑎𝑎𝑦𝑦 is discounted.
Present value costs are calculated in a similar way using the following formula:
𝑃𝑃𝑃𝑃𝐶𝐶 = 𝐶𝐶𝑖𝑖𝑖𝑖𝑖𝑖𝑖𝑖𝑖𝑖𝑖𝑖𝑖𝑖 + �𝐶𝐶𝑦𝑦𝑦𝑦𝑖𝑖𝑦𝑦𝑖𝑖𝑦𝑦 𝑖𝑖𝑎𝑎𝑦𝑦𝑦𝑦𝑖𝑖𝑎𝑎𝑦𝑦
(1 + 𝑖𝑖)0 + ⋯+𝐶𝐶𝑦𝑦𝑦𝑦𝑖𝑖𝑦𝑦𝑖𝑖𝑦𝑦 𝑖𝑖𝑎𝑎𝑦𝑦𝑦𝑦𝑖𝑖𝑎𝑎𝑦𝑦
(1 + 𝑖𝑖)𝑇𝑇 �
Where 𝑃𝑃𝑃𝑃𝐶𝐶 now refers to the sum of the present value of all anticipated costs plus 𝐶𝐶𝑖𝑖𝑖𝑖𝑖𝑖𝑖𝑖𝑖𝑖𝑖𝑖𝑖𝑖
which is a onetime expense; 𝐶𝐶𝑦𝑦𝑦𝑦𝑖𝑖𝑦𝑦𝑖𝑖𝑦𝑦 𝑖𝑖𝑎𝑎𝑦𝑦𝑦𝑦𝑖𝑖𝑎𝑎𝑦𝑦 which is the annual upkeep cost of the project.
Table 13: Variables Used to Calculate Present Value Benefits and Costs
Variable Value* Discount Rate (i) 4% Time (t) 20 Years Initial Cost (𝐶𝐶𝑖𝑖𝑖𝑖𝑖𝑖𝑖𝑖𝑖𝑖𝑖𝑖𝑖𝑖) 256,700 Million Yuan Annual Cost (𝐶𝐶𝑦𝑦𝑦𝑦𝑖𝑖𝑦𝑦𝑖𝑖𝑦𝑦 𝑖𝑖𝑎𝑎𝑦𝑦𝑦𝑦𝑖𝑖𝑎𝑎𝑦𝑦) 12,613 Million Yuan Initial Benefit (𝐵𝐵𝑖𝑖𝑖𝑖𝑖𝑖𝑖𝑖𝑖𝑖𝑖𝑖𝑖𝑖) 0 Yuan Annual Benefit if GDP Increases by 0.13% (𝐵𝐵𝑦𝑦𝑦𝑦𝑖𝑖𝑦𝑦𝑖𝑖𝑦𝑦 𝑖𝑖𝑎𝑎𝑦𝑦𝑦𝑦𝑖𝑖𝑎𝑎𝑦𝑦)
642,641 Million Yuan
Annual Benefit if GDP Increases by 0.2% (𝐵𝐵𝑦𝑦𝑦𝑦𝑖𝑖𝑦𝑦𝑖𝑖𝑦𝑦 𝑖𝑖𝑎𝑎𝑦𝑦𝑦𝑦𝑖𝑖𝑎𝑎𝑦𝑦)
957,474 Million Yuan
Annual Benefit if GDP Increases by 0.25% (𝐵𝐵𝑦𝑦𝑦𝑦𝑖𝑖𝑦𝑦𝑖𝑖𝑦𝑦 𝑖𝑖𝑎𝑎𝑦𝑦𝑦𝑦𝑖𝑖𝑎𝑎𝑦𝑦)
1,182,354 Million Yuan
Annual Benefit if GDP Increases by 0.30% (𝐵𝐵𝑦𝑦𝑦𝑦𝑖𝑖𝑦𝑦𝑖𝑖𝑦𝑦 𝑖𝑖𝑎𝑎𝑦𝑦𝑦𝑦𝑖𝑖𝑎𝑎𝑦𝑦)
1,407,234 Million Yuan
*Numbers are rounded to the nearest million when appropriate *
If GDP increased by 0.13%. Based on the calculations above and the present value benefit
formula, I can predict the following:
Present Value Benefits= 𝐵𝐵𝐼𝐼𝑖𝑖𝑖𝑖𝑖𝑖𝑖𝑖𝑖𝑖𝑖𝑖 + �𝐵𝐵𝑦𝑦𝑦𝑦𝑦𝑦𝑦𝑦𝑦𝑦𝑦𝑦 𝑦𝑦𝑎𝑎𝑦𝑦𝑦𝑦𝑦𝑦𝑎𝑎𝑦𝑦
(1+𝑖𝑖)0+ ⋯+ 𝐵𝐵𝑦𝑦𝑦𝑦𝑦𝑦𝑦𝑦𝑦𝑦𝑦𝑦 𝑦𝑦𝑎𝑎𝑦𝑦𝑦𝑦𝑦𝑦𝑎𝑎𝑦𝑦
(1+𝑖𝑖)𝑇𝑇�
642,641,047,064 Yuan= 0 + �45,467,935,650(1+0.04)0
+ ⋯+ 45,467,935,650(1+0.04)20
� Based on the above calculations, if GDP increased by 0.13% as a result of the SNWTP’s
central route, the present value benefits discounted 20 years in the future would be 642, 641 million
yuan.
Present Value Costs = 𝐶𝐶𝑖𝑖𝑖𝑖𝑖𝑖𝑖𝑖𝑖𝑖𝑖𝑖 + �𝐶𝐶𝑦𝑦𝑦𝑦𝑦𝑦𝑦𝑦𝑦𝑦𝑦𝑦 𝑦𝑦𝑎𝑎𝑦𝑦𝑦𝑦𝑦𝑦𝑎𝑎𝑦𝑦
(1+𝑖𝑖)0+ ⋯+ 𝐶𝐶𝑦𝑦𝑦𝑦𝑦𝑦𝑦𝑦𝑦𝑦𝑦𝑦 𝑦𝑦𝑎𝑎𝑦𝑦𝑦𝑦𝑦𝑦𝑎𝑎𝑦𝑦
(1+𝑖𝑖)𝑇𝑇�
439,979,000,000 Yuan = 256,711,000,000 + �12,612,761,950(1+0.04)0
+ ⋯+ 12,612,761,950(1+0.04)20
�
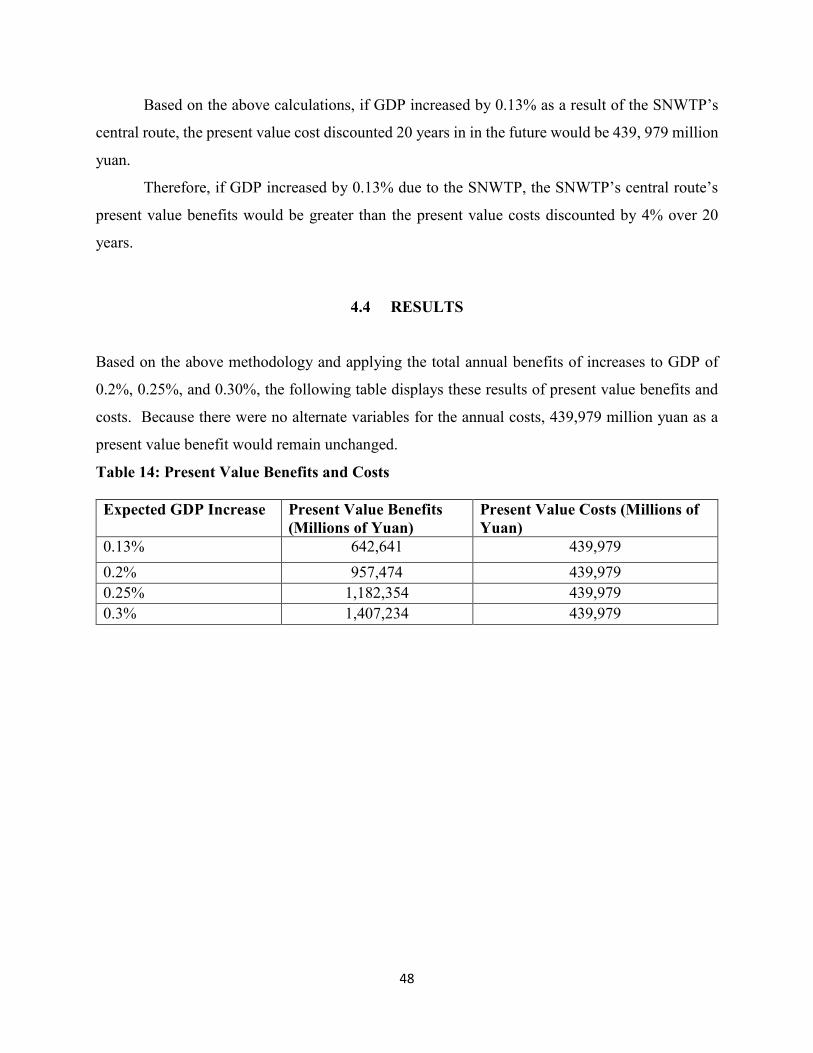
48
Based on the above calculations, if GDP increased by 0.13% as a result of the SNWTP’s
central route, the present value cost discounted 20 years in in the future would be 439, 979 million
yuan.
Therefore, if GDP increased by 0.13% due to the SNWTP, the SNWTP’s central route’s
present value benefits would be greater than the present value costs discounted by 4% over 20
years.
4.4 RESULTS
Based on the above methodology and applying the total annual benefits of increases to GDP of
0.2%, 0.25%, and 0.30%, the following table displays these results of present value benefits and
costs. Because there were no alternate variables for the annual costs, 439,979 million yuan as a
present value benefit would remain unchanged.
Table 14: Present Value Benefits and Costs
Expected GDP Increase Present Value Benefits (Millions of Yuan)
Present Value Costs (Millions of Yuan)
0.13% 642,641 439,979 0.2% 957,474 439,979 0.25% 1,182,354 439,979 0.3% 1,407,234 439,979

49
BIBLIOGRAPHY
"All Dried up." The Economist. The Economist Newspaper, 12 Oct. 2013. Web. 06 Feb. 2016.
Berkoff, 2003. J. Berkoff. China: the south-north water transfer project—is it justified?. Water Policy, 5 (2003), pp. 1–29
Bozzu, Sam. "Blue Gold : World Water Wars (Official Full Length Film)." YouTube. YouTube,
n.d. Web. 05 Mar. 2015.
Chan Shifflett, Susan, Jennifer L. Turner, Luan Dong, Ilaria Mazzocco, and Bai Yunwen. "A Global Choke Point Report: China's Water-Energy-Food Roadmap | Wilson Center." A Global Choke Point Report: China's Water-Energy-Food Roadmap | Wilson Center. Woodrow Wilson Center, Mar. 2015. Web. 02 Apr. 2015.
"China:Geography, Climate and Population." AQUASTAT - FAO's Information System on Water and Agriculture. United Nations' Food and Agriculture Organization, 2012. Web. 07 Feb. 2016.
De Steiguer, J. E. "A Student's Guide to Cost-Benefit Analysis for Natural Resources." The University of Arizona. The University of Arizona College of Agriculture, n.d. Web. 09 Feb. 2016.
Freeman, Carla. "Quenching the Dragon's Thirst: The South-North Water Transfer Project—Old Plumbing for New China?" Wilson Center. Woodrow Wilson International Center for Scholars, 07 July 2011. Web. 08 Feb. 2016.
Fry, Al. Facts and Trends: Water. Conches-Geneva: Al Fry, 2005. World Buisness Council for Sustainable Development (WBCSD), Aug. 2005. Web. 7 Feb. 2016.
Gleick, Peter, Jason Morrison, Peter Börkey, Roberto Martín-Hurtado, Pasquale Steduto, Michael Norton, Mark Rosegrant, Piet Klop, Charles Iceland, John Briscoe, James Leape, Stuart Orr, Tom LeQuesne, Dominic Waughray, Colin Chartres, Jakob Granit, Michael Jacobsen, Anders Berntell, Jamal Saghir, and Abel Mejia. "“Charting Our Water Future: Economic Frameworks to Inform Decision-Making.”." Charting Our Water Future: Economic Frameworks to Inform Decision-making. The 2030 Water Resources Group, "Global Climate Change: Effects." Climate Change: Vital Signs of the Planet. National Aeronautics and Space Administration (NASA), n.d. Web. 07 Feb. 2016. 2009. Web. 08 Feb. 2016
50
Grove, Linda. Technology Transfer, Imitation and Local Production: The Soap Industry in Tianjin in the Early 20th Century. N.p., n.d. Web. Sept. 2015.
Hijioka, Y., E. Lin, J.J. Pereira, R.T. Corlett, X. Cui, G.E. Insarov, R.D. Lasco, E. Lindgren, and A. Surjan, 2014: Asia. In: Climate Change 2014: Impacts, Adaptation, and Vulnerability.Part B: Regional Aspects. Contribution of Working Group II to the Fifth AssessmentReport of the Intergovernmental Panel on Climate Change [Barros, V.R., C.B. Field, D.J.Dokken, M.D. Mastrandrea, K.J. Mach, T.E. Bilir, M. Chatterjee, K.L. Ebi, Y.O. Estrada,R.C. Genova, B. Girma, E.S. Kissel, A.N. Levy, S. MacCracken, P.R. Mastrandrea, andL.L.White (eds.)]. Cambridge University Press, Cambridge, United Kingdom and NewYork, NY, USA, pp. 1327-1370
"Hydropower." Climate-Related Core Issues. Climate Institute, n.d. Web. 05 Mar. 2015.
Jaffe, Aaron, and Keith Schneider. "A Dry and Anxious North Awaits China's Giant, Unproven Water Transport Scheme - Circle of Blue WaterNews." Circle of Blue WaterNews. N.p., 01 Mar. 2011. Web. 07 Feb. 2016.
Jiang, Yong. "China's Water Scarcity." China's Water Scarcity. Journal of Environmental Management, 17 June 2009. Web. 09 Feb. 2016.
Kaiman, Jonathan. "China's Water Diversion Project Starts to Flow to Beijing." The Guardian. Guardian News and Media, 12 Dec. 2014. Web. 08 Feb. 2016.
Kuo, Lily "China Is so Bad at Conservation That It Had to Launch the Most Impressive Water- pipeline Project Ever." Probe International. Probe International, 17 Mar. 2014. Web. 08 Feb. 2016.
Larson, Christina. "China Embraces Desalination to Ease Water Shortages." Bloomberg.com. Bloomberg, 9 Apr. 2015. Web. 22 Feb. 2016.
Liu, Hongqiao. "China's Long March To Safe Drinking Water | China Water Risk." China Water Risk. China Water Risk, 2 Mar. 2015. Web. 08 Feb. 2016.
Lombardo, Crystal. "5 Essential Pros and Cons of Desalination | NLCATP.org." NLCATPorg. NLCAT, 7 Feb. 2015. Web. 09 Feb. 2016.
McMichael, Christine E. "Freshwater." Freshwater. The Encyclopedia of Earth, 6 Sept. 2014. Web. 07 Feb. 2016.
Mengjie "Beijing Stresses Water Conservation." Xinhua. Ed. Meng Jie. Xinhua, 12 Jan. 2015. Web. 09 Feb. 2016.
Moody, Andrew. "Dissecting China's Five-Year Plan." The Telegraph. Telegraph Media Group, 23 Nov. 2015. Web. 09 Feb. 2016.
51
MWR, 2004a. MWR (Ministry of Water Resources, P.R. China). Water Resources in China. Ministry of Water Resources, Beijing, China (2004)
MWR, 2007b. MWR (Ministry of Water Resources, P.R. China). The 11th Five-Year Plan of National Water Resources Development, Gazette of the Ministry of Water Resources of the P.R. China, 2007 (2007), pp. 34–48
National Development and Reform Commission. “China’s National Climate Change Programme.” June 2007.
"Netafim Ltd." Drip Irrigation, Micro-irrigation Technologies, Agri-Business Solutions, Greenhouse and Crop Management Technologies. Israeli Agriculture International Portal, n.d. Web. 09 Feb. 2016.
"New 'Water Ten Plan' to Safeguard China's Waters | China Water Risk." China Water Risk. China Water Risk, 2015. Web. 09 Feb. 2016.
Pietz, David. "The Yellow River: A History of China's Water Crisis." Chinadialogue.com. N.p., 19 Aug. 2015. Web. 06 Feb. 2016.
Probe International Beijing Group. "Beijing's Water Crisis 1949-2008 Olympics." Beijing’s Water Crisis (2008): 132. China Heritage Quarterly. Probe International, June 2008. Web. 21 Apr. 2015.
"Water, Sanitation and Hygiene Links to Health." World Health Organization (WHO), Nov. 2004. Web. 07 Feb. 2016.
Wildi, Walter. "Environmental Hazards of Dams and Reservoirs." NEAR Curriculum in Natural Environmental Science 88 (n.d.): 187-92. University of Geneva, 2010. Web. 5 Mar. 2015.
Wong, Gabriel. Gridlines: China's War on Water Scarcity. Rep. PricewaterhouseCoopers, Spring 2013. Web. 7 Feb. 2016.
WWF. (2001). The Proposed South North Water Transfer Scheme in China; Need, Justification and Cost. Draft Report. World Wildlife Fund, Beijing.
Zhao, Kiki. "Water From China's South-North Transfer Project Flows to Beijing." Sinosphere: Dispatches from China. The New York Times, 25 Dec. 2014. Web. 08 Feb. 2016.
"北京市历年水资源情况统计(2001-2013)." 北京统计年鉴2014. 北京统计年鉴2014, 31日2 月2013年. 网站. 21日2月. 2016年.
"国务院南水北调办2015年部门预算." 中国南水北调. 国务院南水北调工程建设委员会办 公室, 2015. 网站. 21日2月. 2016年.
黄安伟. "中国冰川持续消融,危及水源供应." 纽约时报, 纽约时报, 10 日12月 2015年. 网

52
站。 22日2月2016 年.
黄安伟. "新疆取缔冰川旅游,游客只能远观." 纽约时报. 纽约时报, 17 日12月 2016年. 网 站. 22 日2月2016 年.
"科学网—[转载]南水明确“出渠价” 北京每立方2.33元." 华夏经纬网, 9日1月 2015年. 网 站. 22日 2月. 2016年.
"南水北调工程投资进展情况." 中国南水北调. 国务院南水北调工程建设委员会办公室, 9月. 2015. 网站. 21日2月. 2016年.
"中国历年国内生产总值与财政收支统计(1978-2014)." 中国卫生和计划生育统计年鉴2015, 2015年. 网站. 22 日2月 2016年.