Embed Size (px)
Citation preview
The South Africa I know, the home I understand
The South African MPICreating a multidimensional poverty index using census data
Statistics South Africa Private Bag X44 Pretoria 0001 South Africa 170 Thabo Sehume Street Pretoria 0002 User information service: 012 310 8600 Fax: 012 310 8500 Main switchboard: 012 310 8911 Fax: 012 321 7381 Website: www.statssa.gov.za Email: [email protected]
The South African MPI Creating a multidimensional poverty index using census data
Statistics South Africa, 2014 Pali Lehohla, Statistician-General
Report No. 03-10-08
ii
The South African MPI: Creating a multidimensional poverty index using census data / Statistics South Africa Published by Statistics South Africa, Private Bag X44, Pretoria 0001 © Statistics South Africa, 2014 Users may apply or process this data, provided Statistics South Africa (Stats SA) is acknowledged as the original source of the data; that it is specified that the application and/or analysis is the result of the user's independent processing of the data; and that neither the basic data nor any reprocessed version or application thereof may be sold or offered for sale in any form whatsoever without prior permission from Stats SA. Stats SA Library Cataloguing-in-Publication (CIP) Data The South African MPI: Creating a multidimensional poverty index using Census data / Statistics South Africa. Pretoria: Statistics South Africa, 2014 Report no.: 03-10-08 58pp ISBN 978-0-621-42616-8 A complete set of Stats SA publications is available at Stats SA Library and the following libraries:
National Library of South Africa, Pretoria Division National Library of South Africa, Cape Town Division Library of Parliament, Cape Town Bloemfontein Public Library Natal Society Library, Pietermaritzburg Johannesburg Public Library Eastern Cape Library Services, King William’s Town Central Regional Library, Polokwane Central Reference Library, Nelspruit Central Reference Collection, Kimberley Central Reference Library, Mmabatho
This report is available on the Stats SA website: www.statssa.gov.za For technical enquiries please contact: Ross Jennings Tel: (012) 337 6342 Email: [email protected] Copies are obtainable from: Printing and Distribution, Statistics South Africa Tel: (012) 310 8093 (012) 310 8619 Email: [email protected]

iii
Contents List of tables .................................................................................................................................... iv
List of figures .................................................................................................................................... v
Preface ........................................................................................................................................... 1
Introduction .................................................................................................................................... 2
What is multidimensional poverty? ................................................................................................ 2
The history of multidimensional poverty measurement by Stats SA .................................................... 2
What is the MPI? ......................................................................................................................... 3
Constructing the South African MPI ................................................................................................... 4
Data sources ............................................................................................................................... 4
Exploring the data ........................................................................................................................ 5
The dimensions, the indicators and their deprivation cut-offs ............................................................ 5
The poverty cut-off ....................................................................................................................... 7
Limitations ................................................................................................................................... 8
Using the SAMPI .......................................................................................................................... 8
Profiling multidimensional poverty in South Africa ............................................................................... 9
The poverty measures ................................................................................................................... 9
What is driving the poverty situation? ........................................................................................... 10
Poverty measures at a provincial level .......................................................................................... 11
Poverty profile: Western Cape ..................................................................................................... 16
Poverty profile: Eastern Cape ...................................................................................................... 20
Poverty profile: Northern Cape .................................................................................................... 24
Poverty profile: Free State ........................................................................................................... 28
Poverty profile: KwaZulu-Natal .................................................................................................... 32
Poverty profile: North West ......................................................................................................... 36
Poverty profile: Gauteng ............................................................................................................. 40
Poverty profile: Mpumalanga ...................................................................................................... 44
Poverty profile: Limpopo ............................................................................................................. 48
Conclusion ................................................................................................................................... 52
The way forward ............................................................................................................................ 52
iv
List of tables
Table 1: The dimensions, indicators and deprivation cut-offs for SAMPI .................................................... 6
Table 2: Deprivation headcounts on each of the indicators ..................................................................... 7
Table 3: The dimensions, indicators and their weights ............................................................................. 8
Table 4: Poverty measures for Census 2001 and Census 2011 ............................................................... 9
Table 5: Intensity of deprivation amongst the poor ................................................................................. 9
Table 6: Poverty measures for Census 2001 and Census 2011 at provincial level ................................... 11
Table 7: Poverty measures for Census 2001 and Census 2011 in Western Cape .................................... 16
Table 8: Poverty measures for Census 2001 and Census 2011 at municipal level in Western Cape ......... 17
Table 9: Poverty measures for Census 2001 and Census 2011 in Eastern Cape ..................................... 20
Table 10: Poverty measures for Census 2001 and Census 2011 at municipal level in Eastern Cape ......... 21
Table 11: Poverty measures for Census 2001 and Census 2011 in Northern Cape ................................. 24
Table 12: Poverty measures for Census 2001 and Census 2011 at municipal level in Northern Cape ...... 25
Table 13: Poverty measures for Census 2001 and Census 2011 in Free State ........................................ 28
Table 14: Poverty measures for Census 2001 and Census 2011 at municipal level in Free State .............. 29
Table 15: Poverty measures for Census 2001 and Census 2011 in KwaZulu-Natal ................................. 32
Table 16: Poverty measures for Census 2001 and Census 2011 at municipal level in KwaZulu-Natal ...... 33
Table 17: Poverty measures for Census 2001 and Census 2011 in North West ...................................... 36
Table 18: Poverty measures for Census 2001 and Census 2011 at municipal level in North West ............ 37
Table 19: Poverty measures for Census 2001 and Census 2011 in Gauteng .......................................... 40
Table 20: Poverty measures for Census 2001 and Census 2011 at municipal level in Gauteng ............... 41
Table 21: Poverty measures for Census 2001 and Census 2011 in Mpumalanga ................................... 44
Table 22: Poverty measures for Census 2001 and Census 2011 at municipal level in Mpumalanga ......... 45
Table 23: Poverty measures for Census 2001 and Census 2011 in Limpopo .......................................... 48
Table 24: Poverty measures for Census 2001 and Census 2011 at municipal level in Limpopo ............... 49
v
List of figures
Figure 1: Dimensions and indicators of the MPI ..................................................................................... 3
Figure 2: Contribution of weighted indicators to SAMPI 2001 at national level ....................................... 10
Figure 3: Contribution of weighted indicators to SAMPI 2011 at national level ....................................... 10
Figure 4: Poverty headcount (H) at provincial level in 2001 ................................................................... 12
Figure 5: Poverty headcount (H) at provincial level in 2011 ................................................................... 13
Figure 6: Poverty headcount (H) at municipal level in 2001................................................................... 14
Figure 7: Poverty headcount (H) at municipal level in 2011................................................................... 15
Figure 8: Contribution of weighted indicators to SAMPI 2011 in Western Cape ...................................... 16
Figure 9: Poverty headcount (H) in Western Cape at municipal level in 2001 ......................................... 18
Figure 10: Poverty headcount (H) in Western Cape at municipal level in 2011 ....................................... 19
Figure 11: Contribution of weighted indicators to SAMPI 2011 in Eastern Cape ..................................... 20
Figure 12: Poverty headcount (H) in Eastern Cape at municipal level in 2001 ........................................ 22
Figure 13: Poverty headcount (H) in Eastern Cape at municipal level in 2011 ........................................ 23
Figure 14: Contribution of weighted indicators to SAMPI 2011 in Northern Cape ................................... 24
Figure 15: Poverty headcount (H) in Northern Cape at municipal level in 2001 ...................................... 26
Figure 16: Poverty headcount (H) in Northern Cape at municipal level in 2011 ...................................... 27
Figure 17: Contribution of weighted indicators to SAMPI 2011 in Free State .......................................... 28
Figure 18: Poverty headcount (H) in Free State at municipal level in 2001 .............................................. 30
Figure 19: Poverty headcount (H) in Free State at municipal level in 2011 .............................................. 31
Figure 20: Contribution of weighted indicators to SAMPI 2011 in KwaZulu-Natal ................................... 32
Figure 21: Poverty headcount (H) in KwaZulu-Natal at municipal level in 2001 ...................................... 34
Figure 22: Poverty headcount (H) in KwaZulu-Natal at municipal level in 2011 ...................................... 35
Figure 23: Contribution of weighted indicators to SAMPI 2011 in North West ......................................... 36
Figure 24: Poverty headcount (H) in North West at municipal level in 2001 ............................................ 38
Figure 25: Poverty headcount (H) in North West at municipal level in 2011 ............................................ 39
Figure 26: Contribution of weighted indicators to SAMPI 2011 in Gauteng ............................................ 40
Figure 27: Poverty headcount (H) in Gauteng at municipal level in 2001 ............................................... 42
Figure 28: Poverty headcount (H) in Gauteng at municipal level in 2011 ............................................... 43
Figure 29: Contribution of weighted indicators to SAMPI 2011 in Mpumalanga ..................................... 44
Figure 30: Poverty headcount (H) in Mpumalanga at municipal level in 2001 ........................................ 46
Figure 31: Poverty headcount (H) in Mpumalanga at municipal level in 2011 ........................................ 47
Figure 32: Contribution of weighted indicators to SAMPI 2011 in Limpopo ............................................ 48
Figure 33: Poverty headcount (H) in Limpopo at municipal level in 2001 ............................................... 50
Figure 34: Poverty headcount (H) in Limpopo at municipal level in 2011 ............................................... 51
please scroll down
1
Preface
The main purpose of this report is the provision of poverty maps and poverty data at provincial and municipal levels. In so doing, this report details how the South African Multidimensional Poverty Index (SAMPI) was conceptualised and constructed using data collected by Statistics South Africa (Stats SA) through the censuses of 2001 and 2011. The SAMPI, based on the Alkire-Foster method, provides another powerful tool in Stats SA's ongoing efforts to measure poverty and deprivation in the country. The strength of this index using census data rests in the ability to reliably map poverty down to whatever geographical level required and thus, will greatly assist municipalities in understanding the unique challenges facing their areas and how the situation on the ground has changed since 2001. The SAMPI was born out of the desire to develop a new product that could build onto the work started with the development of the Provincial Indices of Multiple Deprivation (PIMD) after Census 2001. Unlike the PIMD, the SAMPI has the advantage of being fully decomposable by demographic and geographic variables; this shows not only in what aspects the poor are deprived, but also reveals the interconnections among those deprivations. This will enable policymakers to better allocate resources and more effectively target policies. This report has benefitted from our on-going partnership with UNICEF. In addition to technical support on the analysis of child poverty, UNICEF has also generously supported efforts to build capacity for Stats SA staff to construct this SAMPI.
2
Introduction
What is multidimensional poverty?
Poverty is often defined by unidimensional measures, such as income or expenditure. While this provides us with a very useful way of measuring absolute poverty, it does not capture the multiple aspects that constitute poverty. Multidimensional poverty is made up of several factors that amount to a poor person’s experience of deprivation – these can include poor health, lack of education, inadequate living standards, lack of income, disempowerment, lack of decent work and threat from violence. A multidimensional measure seeks to incorporate a range of indicators to capture the complexity of poverty, and thus provides a more robust tool to better inform programmes and policies designed to fight it. The indicators used for this measure can vary from country to country; ultimately, they should be chosen to fit the society and situation. The motivations for using a multidimensional approach include:
• Poverty is a complex issue that manifests itself in economic, social and political ways
• Income denotes the means to achieving a better life, but is not actually the better life itself
• Poor people themselves describe their experience of poverty as multidimensional
• The more policy-relevant information there is available on poverty, the better equipped policy-makers will be to reduce it
• Some methods of multidimensional measurement can be used for additional purposes such as targeting or conditional transfers
The history of multidimensional poverty measurement by Stats SA
Since 2000, Stats SA has undertaken or been involved in a number of initiatives that have sought to profile poverty or deprivation from a multidimensional perspective. These include: • Measuring poverty in SA (2000)
– This saw the development of a household infrastructure index and a household circumstances index using Census 1996 data
• Provincial Indices of Multiple Deprivation (2006)
– A series of provincial indices of deprivation were constructed and ward-level analysis of deprivation within each province was undertaken across five domains: income and material; employment; education; health; and living environment using Census 2001 data
• Men, Women & Children (2013)
– Using the Bristol method for comparative purposes, a poverty index was created across eight dimensions using data from the Living Conditions Survey (LCS) 2008/2009
3
What is the MPI?
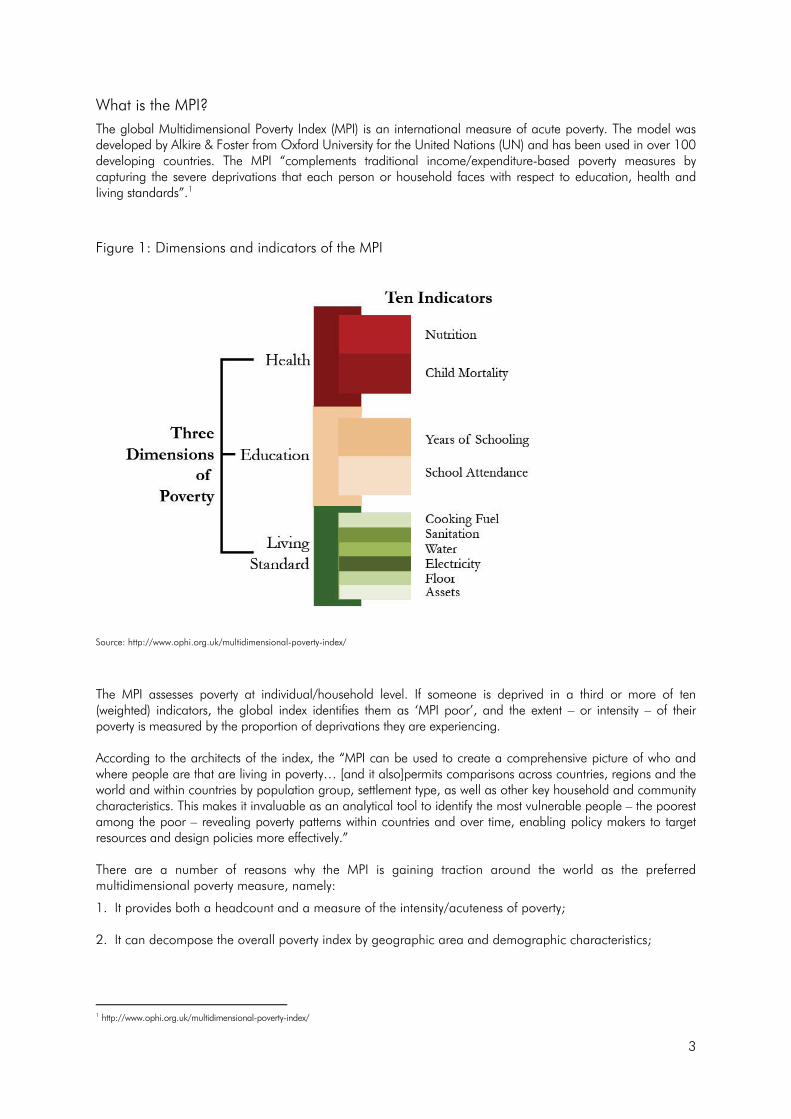
The global Multidimensional Poverty Index (MPI) is an international measure of acute poverty. The model was developed by Alkire & Foster from Oxford University for the United Nations (UN) and has been used in over 100 developing countries. The MPI “complements traditional income/expenditure-based poverty measures by capturing the severe deprivations that each person or household faces with respect to education, health and living standards”.1
Figure 1: Dimensions and indicators of the MPI
Source: http://www.ophi.org.uk/multidimensional-poverty-index/
The MPI assesses poverty at individual/household level. If someone is deprived in a third or more of ten (weighted) indicators, the global index identifies them as ‘MPI poor’, and the extent – or intensity – of their poverty is measured by the proportion of deprivations they are experiencing. According to the architects of the index, the “MPI can be used to create a comprehensive picture of who and where people are that are living in poverty… [and it also]permits comparisons across countries, regions and the world and within countries by population group, settlement type, as well as other key household and community characteristics. This makes it invaluable as an analytical tool to identify the most vulnerable people – the poorest among the poor – revealing poverty patterns within countries and over time, enabling policy makers to target resources and design policies more effectively.” There are a number of reasons why the MPI is gaining traction around the world as the preferred multidimensional poverty measure, namely:
1. It provides both a headcount and a measure of the intensity/acuteness of poverty; 2. It can decompose the overall poverty index by geographic area and demographic characteristics;
1 http://www.ophi.org.uk/multidimensional-poverty-index/
4
3. It can look at the contribution of each dimension to the overall poverty situation and decompose this contribution at whatever geographic level;
4. The methodology shows aspects in which the poor are deprived and helps to reveal the interconnections
among those deprivations. This enables policymakers to allocate resources and implement policies more effectively. This can assist with targeting the correct services to the correct areas and not assume that a blanket approach is suitable to poverty alleviation/eradication per se; and
5. It is relatively simple to change the assumptions around which the multidimensionally poor are identified
and therefore, making it an intuitive and transparent measure of multiple deprivations. Finally, in a post-2015 Millennium Development Goal (MDG) context, the meeting of the UN General Assembly in 2013 to report on progress towards the current goals saw various countries and institutions call upon the UN to adopt a new multidimensional poverty measure, the MPI2015+, to track progress alongside the traditional income/expenditure measures toward the new goals adopted after 2015. At a national level, governments were urged to embrace these new multidimensional poverty measures due to their effectiveness for policy change, with those countries that have already done so stressing the need to complement any international MPI with nationally adapted indices for poverty reduction.
Constructing the South African MPI
Data sources
Against this background, Stats SA embarked on the creation of a South African Multidimensional Poverty Index (SAMPI) to improve poverty measurement for the country and to align ourselves with the growing international trend towards measuring poverty beyond the traditional money-metric method. We have embraced the Alkire-Foster methodology and have also adjusted the indicators, and included an additional dimension – that of economic activity – in line with the call to develop national indices that reflect country-specific conditions and needs. We chose to use census data given its ability to disaggregate information to the lowest possible geographic area. Census 2011 was the third census to be conducted in South Africa since the post-democratic elections in 1994. The first census was held in 1996 and the second in 2001. These censuses were all conducted as a de facto census, which means that people were counted where they were found or stayed on Census night (the midnight of the 9th/10th October), or, if they were not at the dwelling on Census night and were not enumerated elsewhere, where they returned to the next day. Data collection took place from 9 to 31 October of the respective year, with a Post-enumeration Survey (PES) happening in November to assess the undercount. For 2001, over 83 000 enumerators and over 17 000 supervisors and fieldwork coordinators were employed to collect information from about 80 000 enumeration areas (EAs). In 2011, a fieldwork force of 120 000 enumerators and about 31 000 supervisors and fieldwork coordinators was required to do the count in over 103 000 EAs. Using common variables found in Census 2001 and Census 2011,2 the SAMPI seeks to profile poverty at household level as most of the indicators used are generated at the household level. It also allows us to measure change between the two censuses. In order to compare Census 2011 with Census 2001,we were required to align the 2001 data to 2011 municipal boundaries. This is because the country’s demarcations underwent a number of changes at provincial and municipal levels between 2001 and 2011.
2 Unfortunately using Census 1996 would have limited us to a smaller set of common variables.

5
Of the nine provinces, only two provinces (Western Cape and Free State) were unaffected by provincial boundary changes. The provincial boundary changes were mostly as a result of eight cross-boundary municipalities which were absorbed in full into respective provinces. In 2001, the geographical frame consisted of 262 local municipalities. This total has been reduced to 234 local municipalities in the 2011 geographical frame. The difference of 28 municipalities is explained as follows:
• In total, 25 District Management Areas (DMAs) were absorbed into the existing provinces.
• The City of Tshwane absorbed a further two municipalities (Nokeng tsa Taemane and Kungwini).
• A new municipality (Kagisano Molopo – NW379) was established by merging NW391 (Kagisano) and NW395 (Molopo).
For municipalities, 107 municipalities decreased in geographical area while 155 municipalities had an increase in geographical area.
Exploring the data
Once the list of common variables in the two censuses had been identified, a series of principal component analyses were conducted to identify the most suitable data items to use in the SAMPI. The statistical method of principal components analysis (PCA) is mainly a variable-reduction procedure that serves to reduce redundancy among observed variables by combining correlated variables – which by implication measure the same construct – into fewer uncorrelated derived variables (called principal components). The principal components are linear combinations of optimally weighted observed variables. Because PCA uses covariation among the variables involved in generating the weights, the resultant principal components account for a progressively decreasing amount of variance among the observed variables, with the first component accounting for most of the variance. In the context of the SAMPI, PCA was run to determine variables that best capture deprivation in predetermined dimensions (health, education, living standards and economic activity). The approach taken was to first produce a series of poverty indices using variables contained in census data and relate them to the above-mentioned dimensions.
The dimensions, the indicators and their deprivation cut-offs
Creating an index is obviously guided by a number of factors. In the case of the SAMPI, these included:
• the global MPI and its dimensions and indicators;
• the South African context and issues affecting poverty;
• the availability of data items in both censuses; and
• the suitability and robustness of these data items after data exploration, confrontation and consultation. As a result of these factors, the following dimensions, their indicators and the deprivation cut-offs were established as the most suitable:

6
Table 1: The dimensions, indicators and deprivation cut-offs for SAMPI
Dimension Indicator Deprivation cut-off Health Child mortality If any child under the age of 5 has died in the past 12 months Education Years of schooling If no household member aged 15 or older has completed 5 years of schooling
School attendance If any school-aged child (aged 7 to 15) is out of school Standard of living Fuel for lighting If household is using paraffin/candles/nothing/other
Fuel for heating If household is using paraffin/wood/coal/dung/other/none Fuel for cooking If household is using paraffin/wood/coal/dung/other/none Water access If no piped water in dwelling or on stand Sanitation type If not a flush toilet Dwelling type If an informal shack/traditional dwelling/caravan/tent/other Asset ownership If household does not own more than one of radio, television, telephone or
refrigerator and does not own a car Economic activity Unemployment If all adults (aged 15 to 64) in the household are unemployed
In comparison with the global MPI, the SAMPI is identical in the following aspects:
• The health dimension has the same mortality indicator.
• The education dimension is identical with the same two indicators.
Regarding the standard of living dimension, the SAMPI is similar to the global MPI in the following aspects: • Whereas the global MPI has general access to electricity and cooking fuel as two indicators, the SAMPI
looks at fuel for lighting, heating and cooking as three separate indicators. • The SAMPI includes the use of paraffin in the deprivation cut-off for lighting, heating and cooking
purposes due to the health and safety implications. • Like the global MPI, the SAMPI also includes a water indicator but our deprivation cut-off is narrower,
focusing on those households with no access to piped water in the dwelling or on their stand. There are those that may argue that this indicator should be in line with the minimum standards as articulated by the Reconstruction and Development Programme (RDP) – piped water within 200metres. However, given that this was the short-term aim of the RDP and its longer term vision “is to provide every South African with accessible water and sanitation” (The Reconstruction and Development Programme, paragraph 2.6.8), we believe our cut-off is appropriate and better suited for long-term measurement.
• The SAMPI also has a narrower definition of deprivation when it comes to the sanitation indicator – as in
the case of water above, we believe this is in line with the longer term goals of the RDP. • With respect to the assets indicator, the SAMPI does not include a bicycle in the deprivation cut-off as
neither census collected information on this.
7
The SAMPI differs from the global MPI as follows:
• In the health dimension, the censuses do not provide any information on nutrition, hunger or food security. As a result, the SAMPI only has one indicator in this dimension. We have explored other options, such as regarding water and sanitation as health issues or the use of disability data, but upon review opted not to use these. On the use of water and sanitation, we wanted to keep these in the standard of living dimension to be in line with the global MPI. With regard to the disability data, the questions differed significantly from the Census 2001 to the Census 2011, and so cannot be compared. Therefore, we have used just the mortality indicator.
• The global MPI includes an indicator on the type of flooring in the standard of living dimension. In the
absence of such data being collected by either of the censuses, we have included an indicator on dwelling type instead.
• The SAMPI includes an economic activity dimension, as this dimension is critical to the current priorities
of the country. The indicator identifies a deprived household where all adults in the economically active age cohort (15 to 64) are defined as unemployed using the expanded definition of unemployment (which includes those defined as unemployed as well as discouraged work-seekers). If there are any adults who are not economically active, such as still in education, retired or looking after the home, they would not be defined as unemployed and therefore, the household would not be classified as deprived on this indicator.
The poverty cut-off
Given the indicators and their respective deprivation cut-offs, the following headcounts for households were generated for each indicator at a national level:
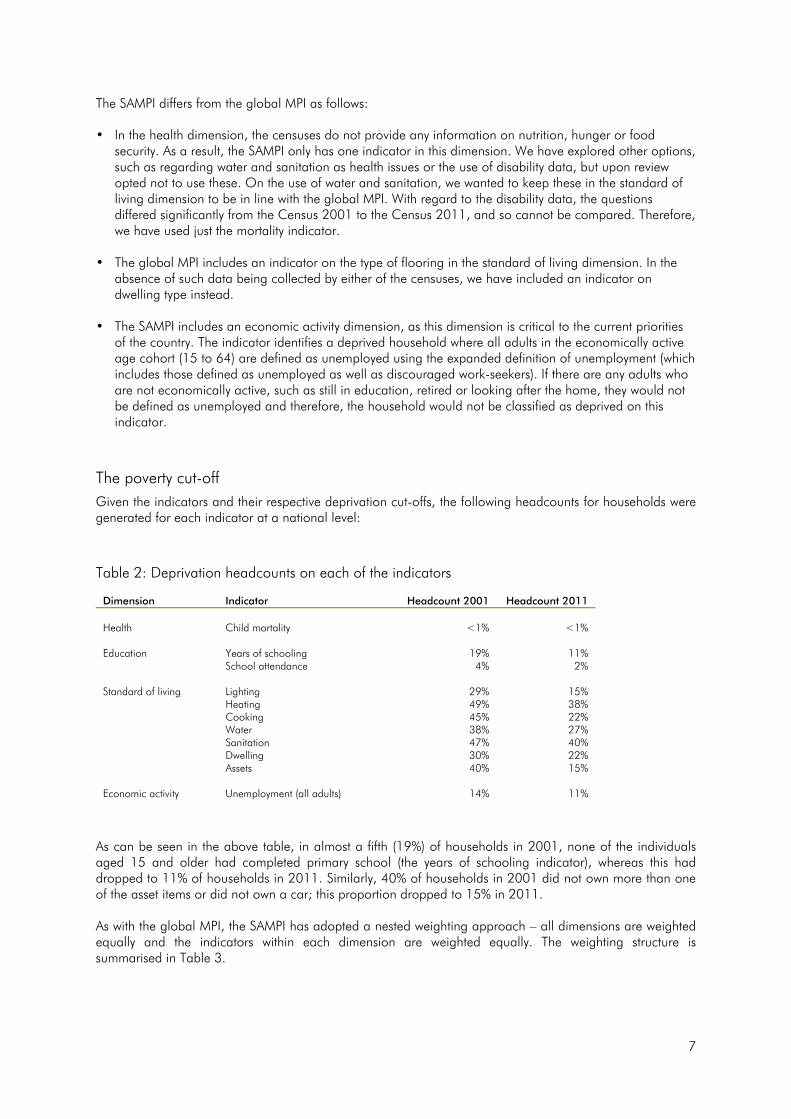
Table 2: Deprivation headcounts on each of the indicators
Dimension Indicator Headcount 2001 Headcount 2011 Health Child mortality <1% <1% Education Years of schooling 19% 11%
School attendance 4% 2% Standard of living Lighting 29% 15%
Heating 49% 38% Cooking 45% 22% Water 38% 27% Sanitation 47% 40% Dwelling 30% 22% Assets 40% 15%
Economic activity Unemployment (all adults) 14% 11%
As can be seen in the above table, in almost a fifth (19%) of households in 2001, none of the individuals aged 15 and older had completed primary school (the years of schooling indicator), whereas this had dropped to 11% of households in 2011. Similarly, 40% of households in 2001 did not own more than one of the asset items or did not own a car; this proportion dropped to 15% in 2011. As with the global MPI, the SAMPI has adopted a nested weighting approach – all dimensions are weighted equally and the indicators within each dimension are weighted equally. The weighting structure is summarised in Table 3.
8
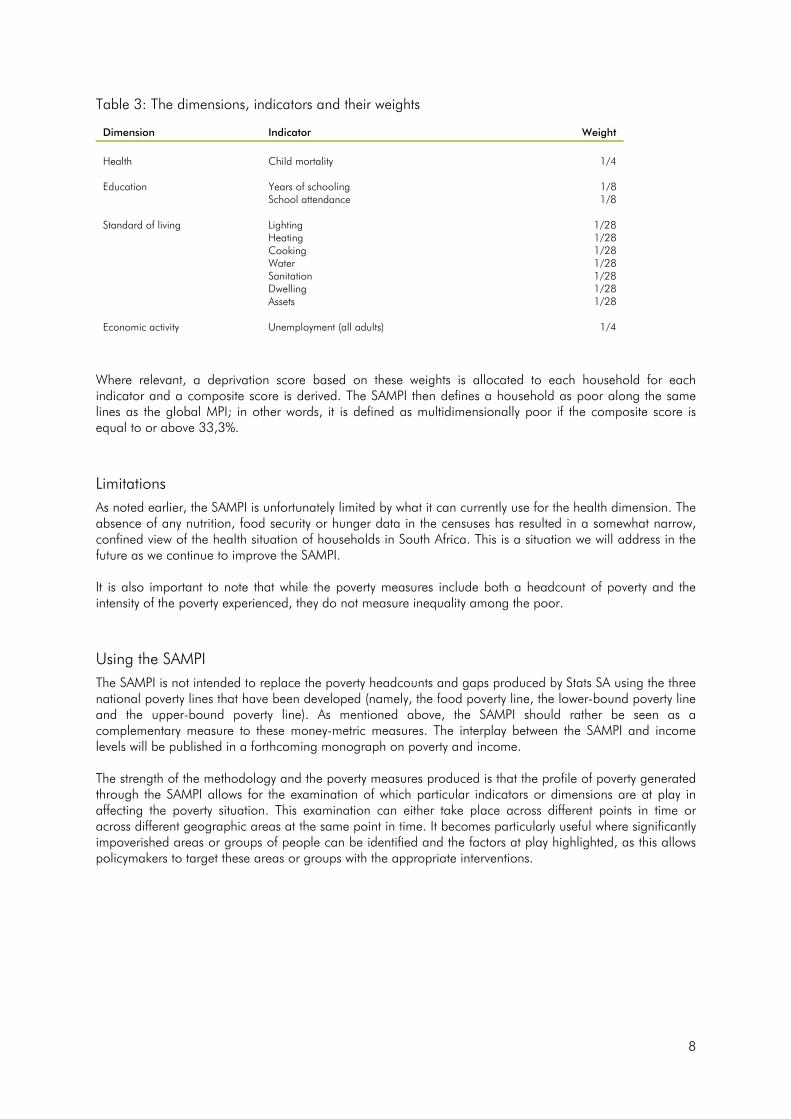
Table 3: The dimensions, indicators and their weights
Dimension Indicator Weight
Health Child mortality 1/4 Education Years of schooling 1/8
School attendance 1/8 Standard of living Lighting 1/28
Heating 1/28 Cooking 1/28 Water 1/28 Sanitation 1/28 Dwelling 1/28 Assets 1/28
Economic activity Unemployment (all adults) 1/4
Where relevant, a deprivation score based on these weights is allocated to each household for each indicator and a composite score is derived. The SAMPI then defines a household as poor along the same lines as the global MPI; in other words, it is defined as multidimensionally poor if the composite score is equal to or above 33,3%.
Limitations
As noted earlier, the SAMPI is unfortunately limited by what it can currently use for the health dimension. The absence of any nutrition, food security or hunger data in the censuses has resulted in a somewhat narrow, confined view of the health situation of households in South Africa. This is a situation we will address in the future as we continue to improve the SAMPI. It is also important to note that while the poverty measures include both a headcount of poverty and the intensity of the poverty experienced, they do not measure inequality among the poor.
Using the SAMPI
The SAMPI is not intended to replace the poverty headcounts and gaps produced by Stats SA using the three national poverty lines that have been developed (namely, the food poverty line, the lower-bound poverty line and the upper-bound poverty line). As mentioned above, the SAMPI should rather be seen as a complementary measure to these money-metric measures. The interplay between the SAMPI and income levels will be published in a forthcoming monograph on poverty and income. The strength of the methodology and the poverty measures produced is that the profile of poverty generated through the SAMPI allows for the examination of which particular indicators or dimensions are at play in affecting the poverty situation. This examination can either take place across different points in time or across different geographic areas at the same point in time. It becomes particularly useful where significantly impoverished areas or groups of people can be identified and the factors at play highlighted, as this allows policymakers to target these areas or groups with the appropriate interventions.
9
Profiling multidimensional poverty in South Africa
The poverty measures
The SAMPI score is derived from the product of the headcount, known as H (the proportion of households defined as multidimensionally poor using the poverty cut-off) and the intensity of the poverty experienced, known as A (defined as the average proportion of indicators in which poor households are deprived).3 These poverty measures are detailed in the following table for both census years.
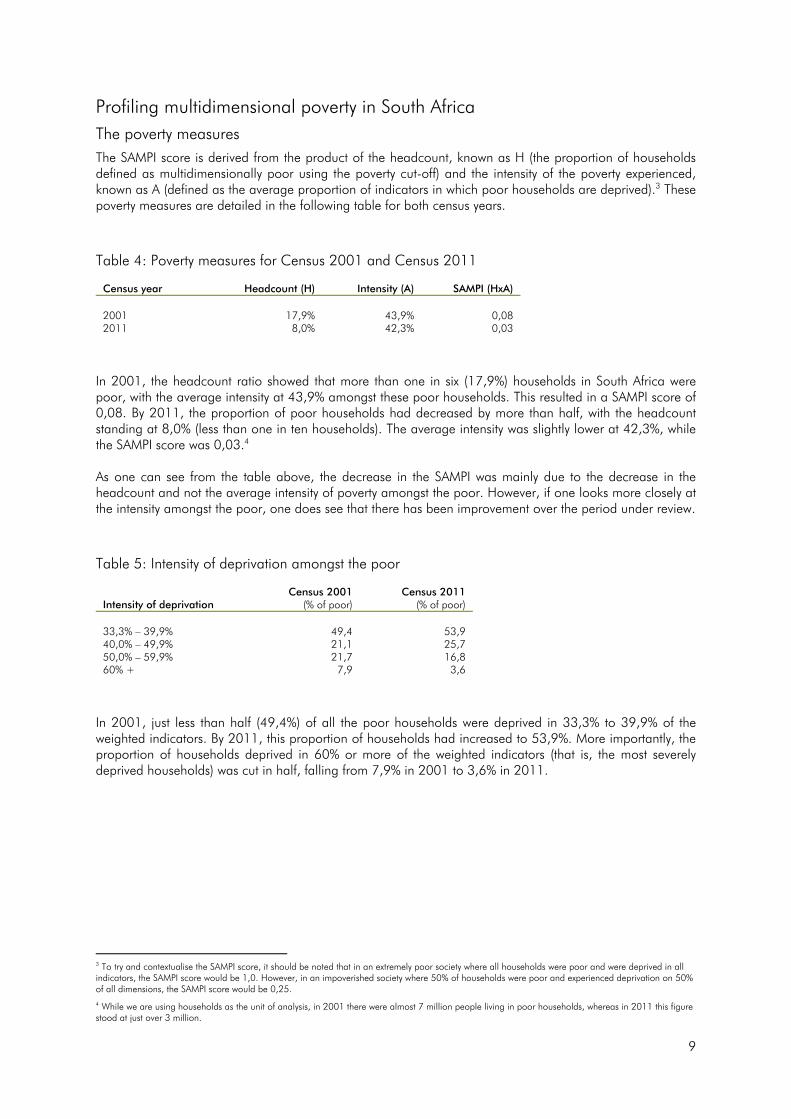
Table 4: Poverty measures for Census 2001 and Census 2011
Census year Headcount (H) Intensity (A) SAMPI (HxA) 2001 17,9% 43,9% 0,08 2011 8,0% 42,3% 0,03
In 2001, the headcount ratio showed that more than one in six (17,9%) households in South Africa were poor, with the average intensity at 43,9% amongst these poor households. This resulted in a SAMPI score of 0,08. By 2011, the proportion of poor households had decreased by more than half, with the headcount standing at 8,0% (less than one in ten households). The average intensity was slightly lower at 42,3%, while the SAMPI score was 0,03.4 As one can see from the table above, the decrease in the SAMPI was mainly due to the decrease in the headcount and not the average intensity of poverty amongst the poor. However, if one looks more closely at the intensity amongst the poor, one does see that there has been improvement over the period under review.
Table 5: Intensity of deprivation amongst the poor
Intensity of deprivation Census 2001
(% of poor) Census 2011
(% of poor) 33,3% – 39,9% 49,4 53,9 40,0% – 49,9% 21,1 25,7 50,0% – 59,9% 21,7 16,8 60% + 7,9 3,6
In 2001, just less than half (49,4%) of all the poor households were deprived in 33,3% to 39,9% of the weighted indicators. By 2011, this proportion of households had increased to 53,9%. More importantly, the proportion of households deprived in 60% or more of the weighted indicators (that is, the most severely deprived households) was cut in half, falling from 7,9% in 2001 to 3,6% in 2011.
3 To try and contextualise the SAMPI score, it should be noted that in an extremely poor society where all households were poor and were deprived in all indicators, the SAMPI score would be 1,0. However, in an impoverished society where 50% of households were poor and experienced deprivation on 50% of all dimensions, the SAMPI score would be 0,25. 4 While we are using households as the unit of analysis, in 2001 there were almost 7 million people living in poor households, whereas in 2011 this figure stood at just over 3 million.

10
What is driving the poverty situation?
As mentioned above, one of the strengths of the Alkire-Foster methodology is that the MPI can look at the contribution of each dimension/indicator to the overall poverty score and decompose this contribution to see what is contributing more or less at a particular point in time.
Figure 2: Contribution of weighted indicators to SAMPI 2001 at national level
Figure 3: Contribution of weighted indicators to SAMPI 2011 at national level
Child Mortality1%
Years of Schooling
16%
School Attendance
4%Lighting
6%
Heating7%
Cooking7%Water
6%Sanitation
7%
Dwelling5%
Assets7%
Unemployment33%
Child Mortality1%
Years of Schooling
14%School
Attendance2%
Lighting5%
Heating7%
Cooking6%
Water7%Sanitation
7%Dwelling
5%
Assets5%
Unemployment40%
11
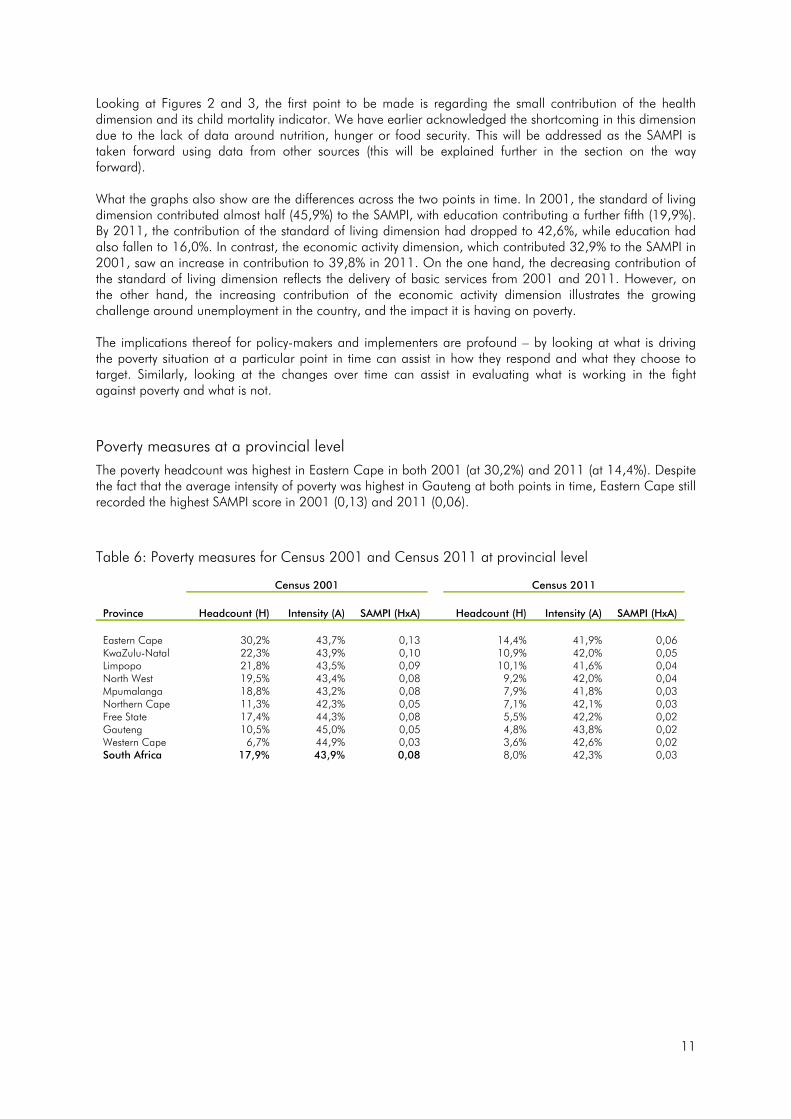
Looking at Figures 2 and 3, the first point to be made is regarding the small contribution of the health dimension and its child mortality indicator. We have earlier acknowledged the shortcoming in this dimension due to the lack of data around nutrition, hunger or food security. This will be addressed as the SAMPI is taken forward using data from other sources (this will be explained further in the section on the way forward). What the graphs also show are the differences across the two points in time. In 2001, the standard of living dimension contributed almost half (45,9%) to the SAMPI, with education contributing a further fifth (19,9%). By 2011, the contribution of the standard of living dimension had dropped to 42,6%, while education had also fallen to 16,0%. In contrast, the economic activity dimension, which contributed 32,9% to the SAMPI in 2001, saw an increase in contribution to 39,8% in 2011. On the one hand, the decreasing contribution of the standard of living dimension reflects the delivery of basic services from 2001 and 2011. However, on the other hand, the increasing contribution of the economic activity dimension illustrates the growing challenge around unemployment in the country, and the impact it is having on poverty. The implications thereof for policy-makers and implementers are profound – by looking at what is driving the poverty situation at a particular point in time can assist in how they respond and what they choose to target. Similarly, looking at the changes over time can assist in evaluating what is working in the fight against poverty and what is not.
Poverty measures at a provincial level
The poverty headcount was highest in Eastern Cape in both 2001 (at 30,2%) and 2011 (at 14,4%). Despite the fact that the average intensity of poverty was highest in Gauteng at both points in time, Eastern Cape still recorded the highest SAMPI score in 2001 (0,13) and 2011 (0,06).
Table 6: Poverty measures for Census 2001 and Census 2011 at provincial level
Province
Census 2001 Census 2011
Headcount (H) Intensity (A) SAMPI (HxA) Headcount (H) Intensity (A) SAMPI (HxA) Eastern Cape 30,2% 43,7% 0,13 14,4% 41,9% 0,06 KwaZulu-Natal 22,3% 43,9% 0,10 10,9% 42,0% 0,05 Limpopo 21,8% 43,5% 0,09 10,1% 41,6% 0,04 North West 19,5% 43,4% 0,08 9,2% 42,0% 0,04 Mpumalanga 18,8% 43,2% 0,08 7,9% 41,8% 0,03 Northern Cape 11,3% 42,3% 0,05 7,1% 42,1% 0,03 Free State 17,4% 44,3% 0,08 5,5% 42,2% 0,02 Gauteng 10,5% 45,0% 0,05 4,8% 43,8% 0,02 Western Cape 6,7% 44,9% 0,03 3,6% 42,6% 0,02 South Africa 17,9% 43,9% 0,08 8,0% 42,3% 0,03

12
Figure 4: Poverty headcount (H) at provincial level in 2001

13
Figure 5: Poverty headcount (H) at provincial level in 2011

14
Figure 6: Poverty headcount (H) at municipal level in 2001
15
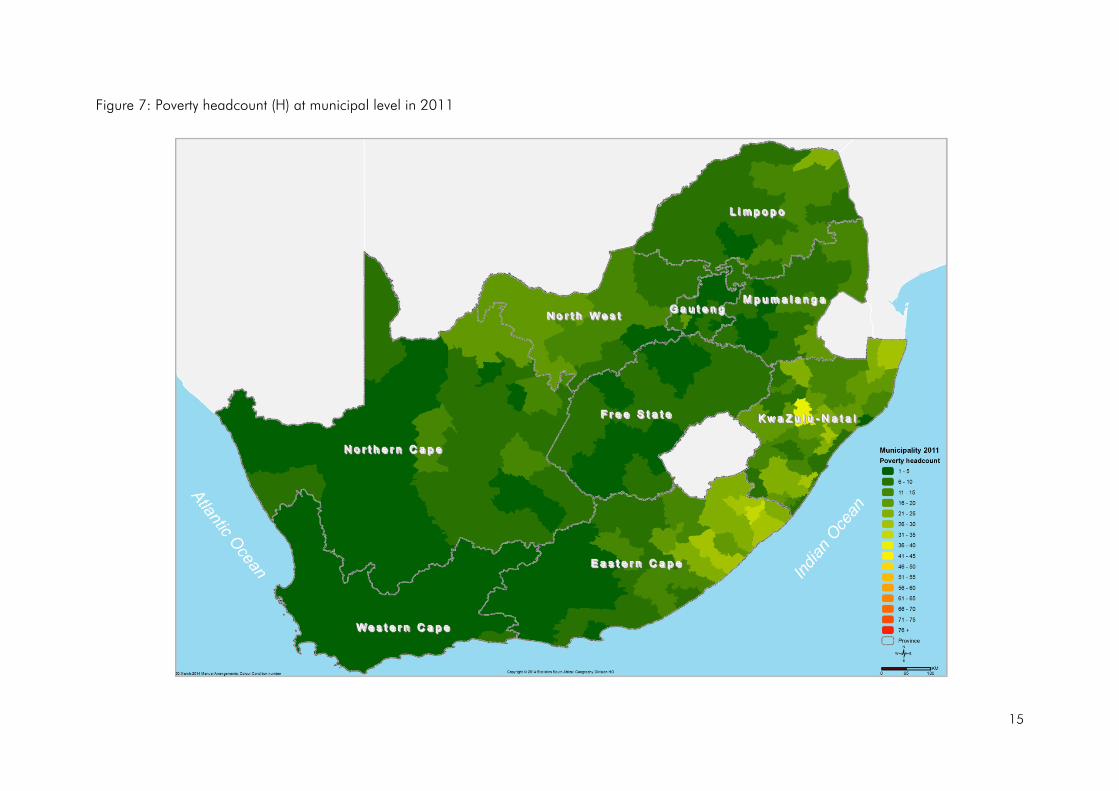
Figure 7: Poverty headcount (H) at municipal level in 2011
16
Poverty profile: Western Cape
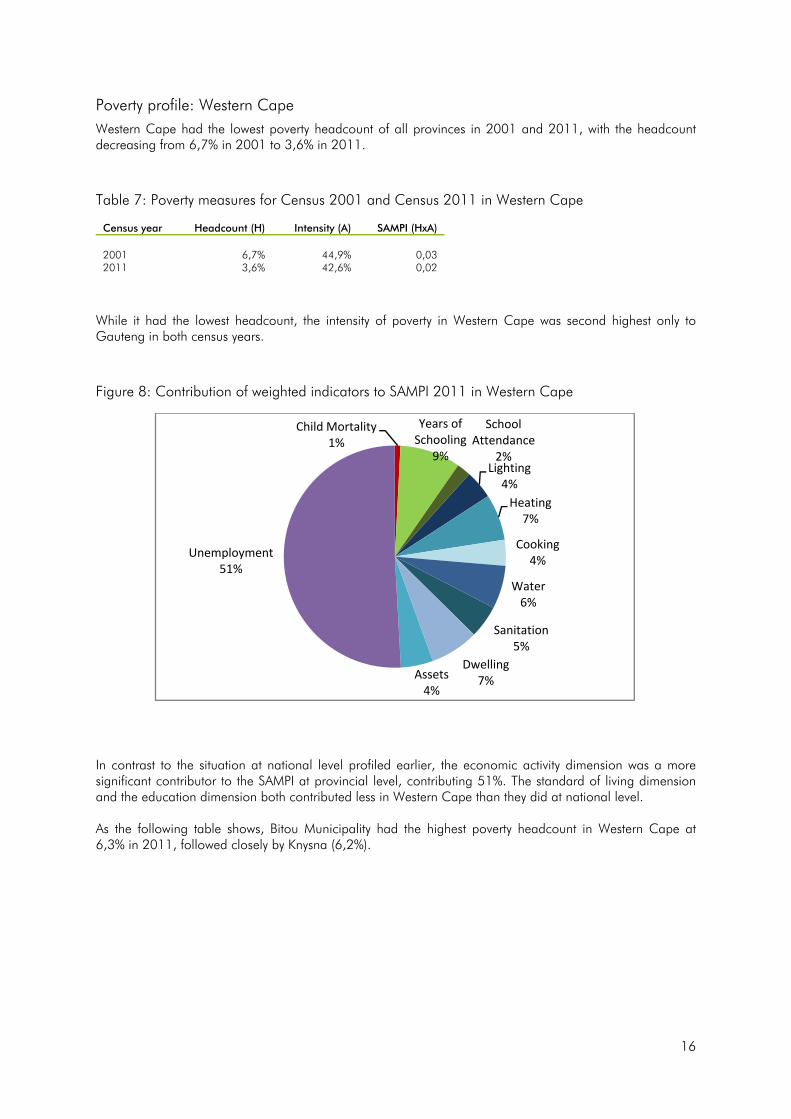
Western Cape had the lowest poverty headcount of all provinces in 2001 and 2011, with the headcount decreasing from 6,7% in 2001 to 3,6% in 2011.
Table 7: Poverty measures for Census 2001 and Census 2011 in Western Cape
Census year Headcount (H) Intensity (A) SAMPI (HxA) 2001 6,7% 44,9% 0,03 2011 3,6% 42,6% 0,02
While it had the lowest headcount, the intensity of poverty in Western Cape was second highest only to Gauteng in both census years.
Figure 8: Contribution of weighted indicators to SAMPI 2011 in Western Cape
In contrast to the situation at national level profiled earlier, the economic activity dimension was a more significant contributor to the SAMPI at provincial level, contributing 51%. The standard of living dimension and the education dimension both contributed less in Western Cape than they did at national level. As the following table shows, Bitou Municipality had the highest poverty headcount in Western Cape at 6,3% in 2011, followed closely by Knysna (6,2%).
Child Mortality1%
Years of Schooling
9%
School Attendance
2%Lighting
4%Heating
7%
Cooking4%
Water6%
Sanitation5%
Dwelling7%Assets
4%
Unemployment51%

17
Table 8: Poverty measures for Census 2001 and Census 2011 at municipal level in Western Cape
Census 2001 Census 2011
Headcount (H) Intensity (A) SAMPI (HxA) Headcount (H) Intensity (A) SAMPI (HxA) Bitou 9,0% 43,8% 0,04 6,3% 41,8% 0,03 Knysna 10,1% 44,3% 0,04 6,2% 42,9% 0,03 Overstrand 6,8% 44,6% 0,03 4,6% 42,8% 0,02 City of Cape Town 7,4% 45,6% 0,03 3,9% 42,8% 0,02 Oudtshoorn 7,0% 40,2% 0,03 3,9% 41,2% 0,02 Stellenbosch 4,0% 43,1% 0,02 3,8% 42,0% 0,02 Theewaterskloof 8,4% 46,0% 0,04 3,7% 41,9% 0,02 Matzikama 4,8% 39,6% 0,02 3,4% 42,4% 0,01 George 7,8% 44,2% 0,03 3,3% 42,6% 0,01 Mossel Bay 4,6% 42,5% 0,02 3,2% 43,6% 0,01 Cederberg 3,4% 39,3% 0,01 2,8% 42,9% 0,01 Breede Valley 4,7% 43,7% 0,02 2,8% 41,8% 0,01 Prince Albert 6,3% 41,5% 0,03 2,5% 42,4% 0,01 Swellendam 3,5% 39,9% 0,01 2,5% 41,4% 0,01 Beaufort West 6,2% 40,8% 0,03 2,5% 40,5% 0,01 Kannaland 5,0% 39,0% 0,02 2,5% 38,5% 0,01 Saldanha Bay 5,6% 43,2% 0,02 2,2% 41,0% 0,01 Drakenstein 5,3% 45,2% 0,02 2,1% 42,5% 0,01 Cape Agulhas 3,4% 41,8% 0,01 2,1% 40,7% 0,01 Langeberg 4,1% 41,6% 0,02 1,7% 42,4% 0,01 Witzenberg 5,8% 42,5% 0,02 1,7% 40,6% 0,01 Hessequa 3,4% 39,7% 0,01 1,5% 39,5% 0,01 Laingsburg 5,4% 38,0% 0,02 1,5% 37,3% 0,01 Swartland 2,6% 39,8% 0,01 1,0% 40,6% 0,00 Bergrivier 1,4% 39,4% 0,01 1,0% 43,7% 0,00 Western Cape 6,7% 44,9% 0,03 3,6% 42,6% 0,02

18
Figure 9: Poverty headcount (H) in Western Cape at municipal level in 2001
19
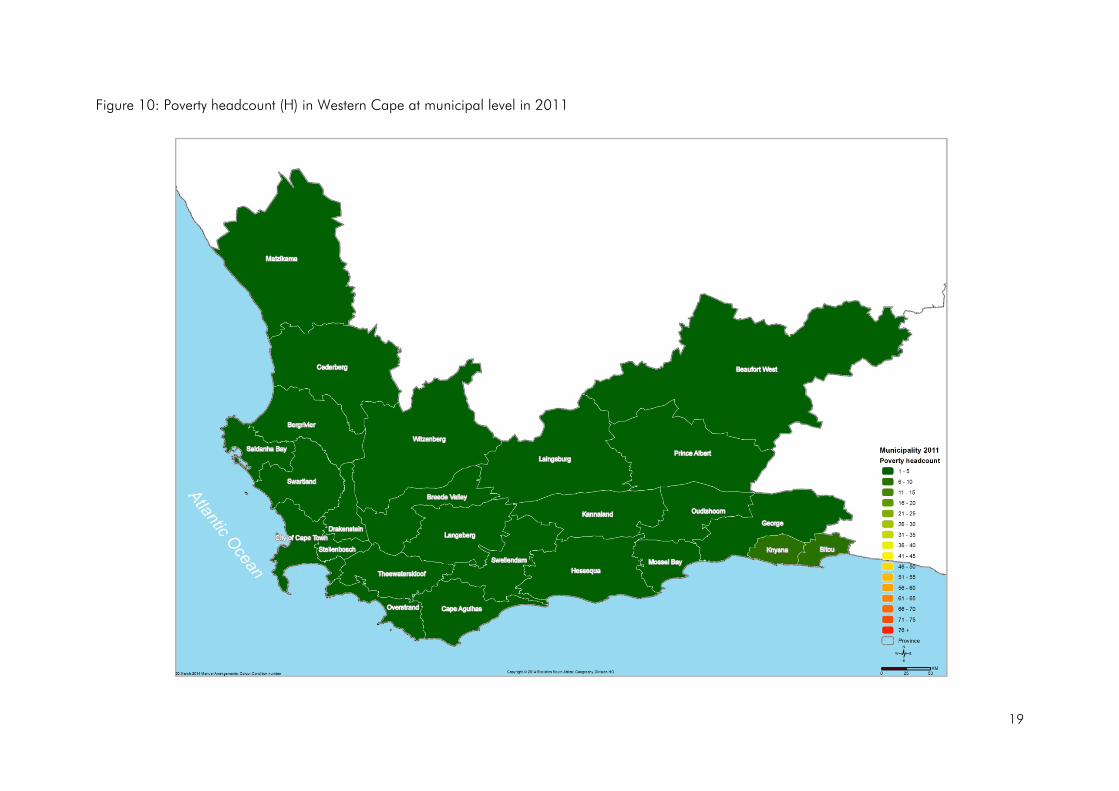
Figure 10: Poverty headcount (H) in Western Cape at municipal level in 2011
20
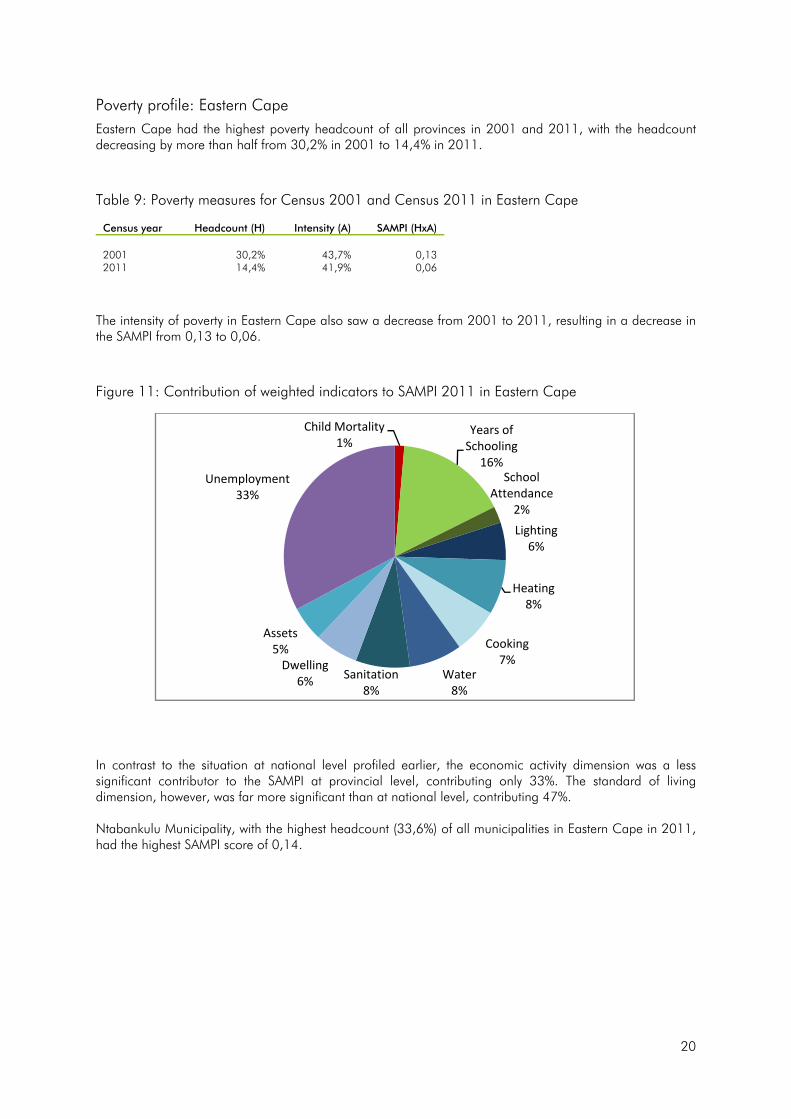
Poverty profile: Eastern Cape
Eastern Cape had the highest poverty headcount of all provinces in 2001 and 2011, with the headcount decreasing by more than half from 30,2% in 2001 to 14,4% in 2011.
Table 9: Poverty measures for Census 2001 and Census 2011 in Eastern Cape
Census year Headcount (H) Intensity (A) SAMPI (HxA) 2001 30,2% 43,7% 0,13 2011 14,4% 41,9% 0,06
The intensity of poverty in Eastern Cape also saw a decrease from 2001 to 2011, resulting in a decrease in the SAMPI from 0,13 to 0,06.
Figure 11: Contribution of weighted indicators to SAMPI 2011 in Eastern Cape
In contrast to the situation at national level profiled earlier, the economic activity dimension was a less significant contributor to the SAMPI at provincial level, contributing only 33%. The standard of living dimension, however, was far more significant than at national level, contributing 47%. Ntabankulu Municipality, with the highest headcount (33,6%) of all municipalities in Eastern Cape in 2011, had the highest SAMPI score of 0,14.
Child Mortality1%
Years of Schooling
16%School
Attendance2%Lighting
6%
Heating8%
Cooking7%
Water8%
Sanitation8%
Dwelling6%
Assets5%
Unemployment33%

21
Table 10: Poverty measures for Census 2001 and Census 2011 at municipal level in Eastern Cape
Census 2001 Census 2011
Headcount (H) Intensity (A) SAMPI (HxA) Headcount (H) Intensity (A) SAMPI (HxA) Ntabankulu 51,7% 44,6% 0,23 33,6% 41,9% 0,14 Port St Johns 55,4% 44,4% 0,25 28,2% 42,2% 0,12 Ngquza Hill 50,5% 44,5% 0,22 27,3% 42,4% 0,12 Engcobo 49,7% 43,0% 0,21 27,4% 41,4% 0,11 Umzimvubu 39,4% 43,4% 0,17 25,3% 42,2% 0,11 Mbhashe 47,5% 42,9% 0,20 25,6% 41,0% 0,11 Mbizana 49,4% 43,8% 0,22 25,0% 41,9% 0,10 Elundini 45,9% 43,4% 0,20 24,7% 41,1% 0,10 IntsikaYethu 41,0% 41,9% 0,17 22,9% 41,1% 0,09 Matatiele 40,7% 43,7% 0,18 22,4% 41,6% 0,09 Mhlontlo 40,2% 43,0% 0,17 21,4% 41,7% 0,09 Nyandeni 45,7% 43,4% 0,20 21,1% 41,1% 0,09 Mnquma 35,9% 43,4% 0,16 20,7% 41,7% 0,09 Emalahleni 35,2% 41,6% 0,15 17,1% 41,4% 0,07 King Sabata Dalindyebo 35,7% 43,7% 0,16 15,5% 41,3% 0,06 Ngqushwa 30,4% 44,3% 0,13 14,6% 41,4% 0,06 Sakhisizwe 32,0% 43,4% 0,14 14,3% 41,9% 0,06 Senqu 29,4% 43,0% 0,13 14,5% 41,4% 0,06 Amahlathi 28,8% 43,4% 0,13 14,3% 41,5% 0,06 Nkonkobe 25,7% 43,8% 0,11 13,9% 41,2% 0,06 Great Kei 26,6% 42,3% 0,11 12,2% 41,3% 0,05 Tsolwana 20,6% 43,1% 0,09 11,6% 41,4% 0,05 Buffalo City 20,9% 45,1% 0,09 9,3% 43,3% 0,04 Maletswai 21,2% 42,7% 0,09 8,9% 42,4% 0,04 Ndlambe 19,3% 43,3% 0,08 7,4% 42,4% 0,03 Lukanji 19,2% 43,7% 0,08 7,1% 41,7% 0,03 Nxuba 19,8% 43,6% 0,09 6,4% 42,6% 0,03 Kouga 9,6% 41,5% 0,04 5,9% 43,7% 0,03 Inkwanca 17,9% 43,6% 0,08 5,5% 41,9% 0,02 Sundays River Valley 18,5% 41,2% 0,08 5,6% 39,9% 0,02 Gariep 17,5% 43,0% 0,08 5,2% 42,9% 0,02 Makana 15,3% 42,4% 0,06 5,1% 42,3% 0,02 Nelson Mandela Bay 13,0% 45,7% 0,06 4,6% 44,3% 0,02 Blue Crane Route 17,6% 41,1% 0,07 4,7% 41,4% 0,02 Ikwezi 14,1% 42,1% 0,06 4,2% 40,6% 0,02 Kou-Kamma 8,8% 40,1% 0,04 3,1% 40,0% 0,01 Baviaans 9,7% 40,4% 0,04 3,1% 40,9% 0,01 Inxuba Yethemba 12,8% 41,6% 0,05 3,0% 41,2% 0,01 Camdeboo 7,9% 41,1% 0,03 2,8% 41,7% 0,01 Eastern Cape 30,2% 43,7% 0,13 14,3% 41,9% 0,06
22
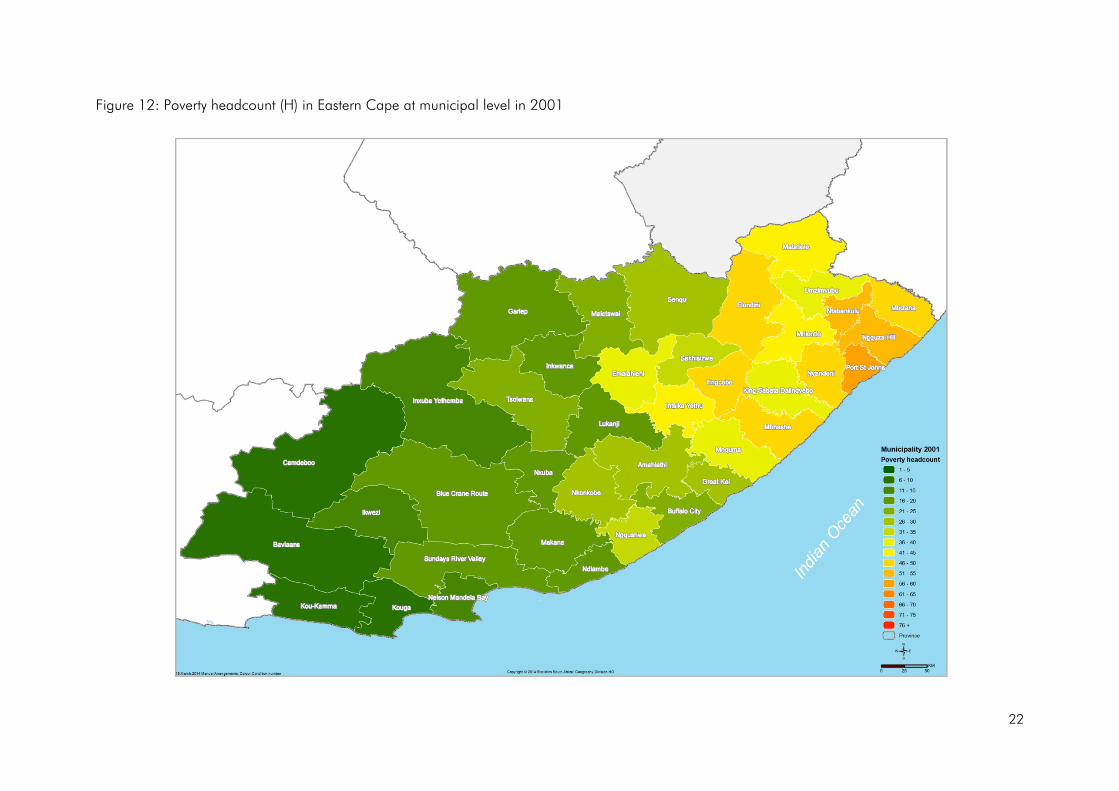
Figure 12: Poverty headcount (H) in Eastern Cape at municipal level in 2001
23
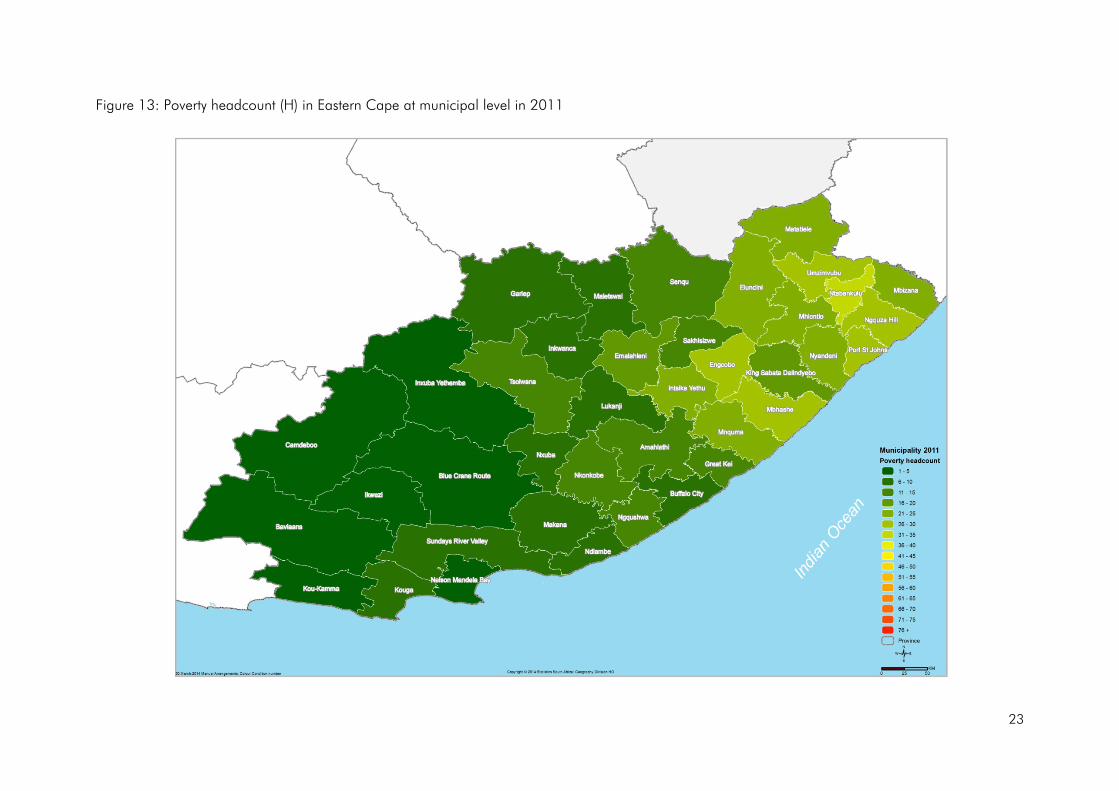
Figure 13: Poverty headcount (H) in Eastern Cape at municipal level in 2011
24
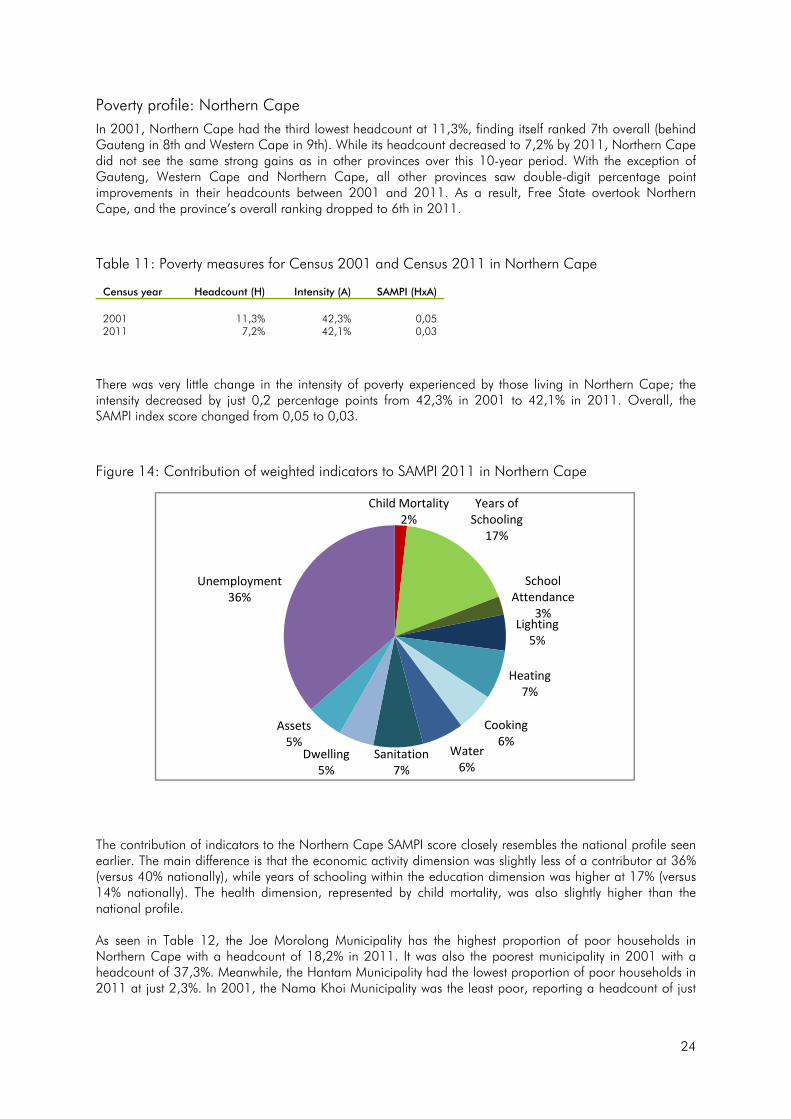
Poverty profile: Northern Cape
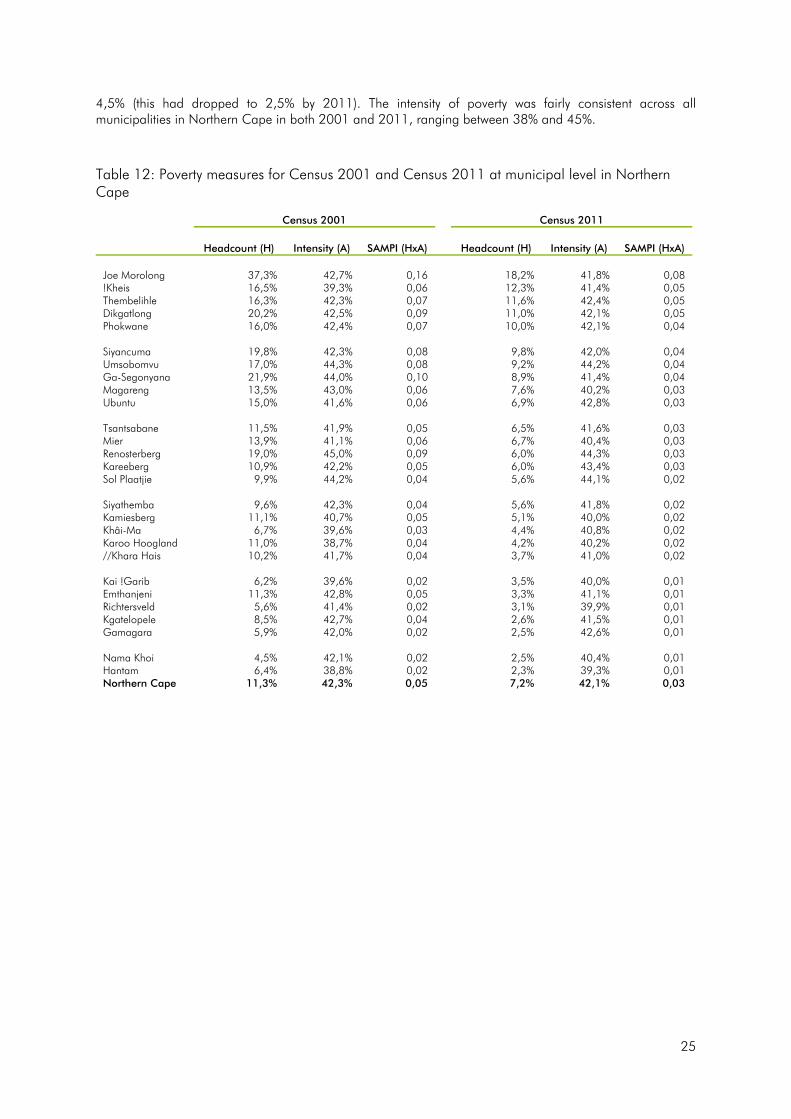
In 2001, Northern Cape had the third lowest headcount at 11,3%, finding itself ranked 7th overall (behind Gauteng in 8th and Western Cape in 9th). While its headcount decreased to 7,2% by 2011, Northern Cape did not see the same strong gains as in other provinces over this 10-year period. With the exception of Gauteng, Western Cape and Northern Cape, all other provinces saw double-digit percentage point improvements in their headcounts between 2001 and 2011. As a result, Free State overtook Northern Cape, and the province’s overall ranking dropped to 6th in 2011.
Table 11: Poverty measures for Census 2001 and Census 2011 in Northern Cape
Census year Headcount (H) Intensity (A) SAMPI (HxA) 2001 11,3% 42,3% 0,05 2011 7,2% 42,1% 0,03
There was very little change in the intensity of poverty experienced by those living in Northern Cape; the intensity decreased by just 0,2 percentage points from 42,3% in 2001 to 42,1% in 2011. Overall, the SAMPI index score changed from 0,05 to 0,03.
Figure 14: Contribution of weighted indicators to SAMPI 2011 in Northern Cape
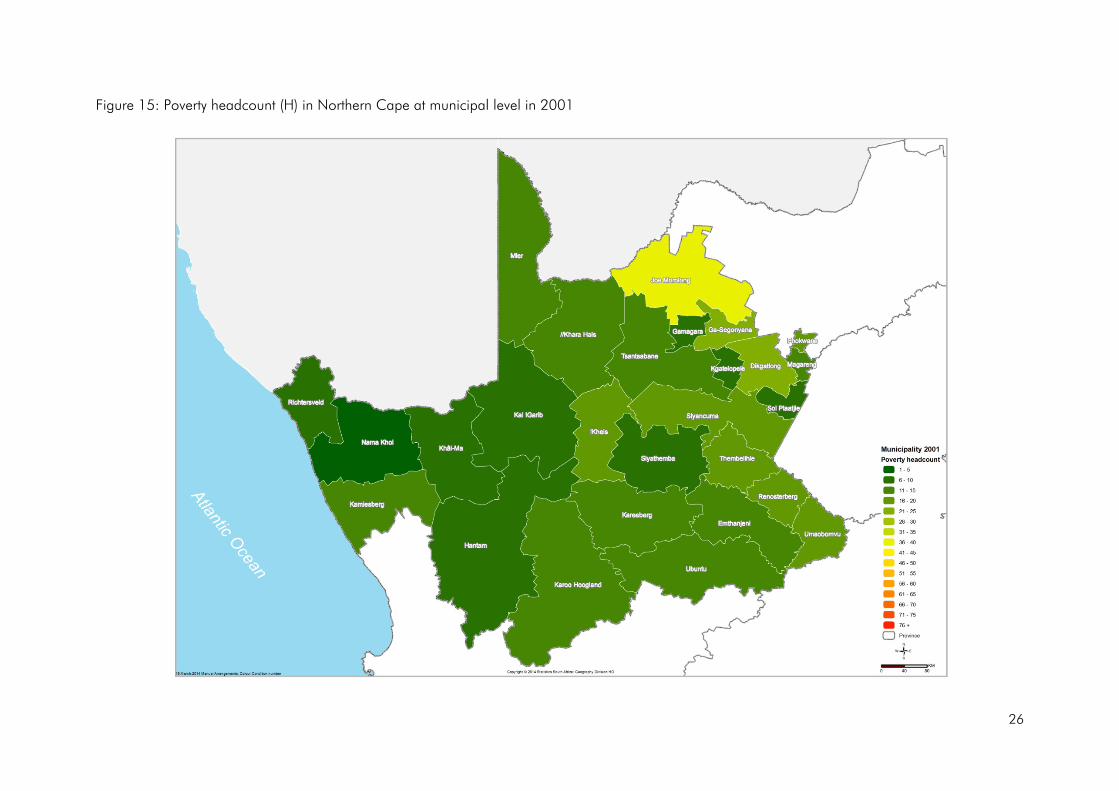
The contribution of indicators to the Northern Cape SAMPI score closely resembles the national profile seen earlier. The main difference is that the economic activity dimension was slightly less of a contributor at 36% (versus 40% nationally), while years of schooling within the education dimension was higher at 17% (versus 14% nationally). The health dimension, represented by child mortality, was also slightly higher than the national profile. As seen in Table 12, the Joe Morolong Municipality has the highest proportion of poor households in Northern Cape with a headcount of 18,2% in 2011. It was also the poorest municipality in 2001 with a headcount of 37,3%. Meanwhile, the Hantam Municipality had the lowest proportion of poor households in 2011 at just 2,3%. In 2001, the Nama Khoi Municipality was the least poor, reporting a headcount of just
Child Mortality2%
Years of Schooling
17%
School Attendance
3%Lighting
5%
Heating7%
Cooking6%
Water6%
Sanitation7%
Dwelling5%
Assets5%
Unemployment36%
25
4,5% (this had dropped to 2,5% by 2011). The intensity of poverty was fairly consistent across all municipalities in Northern Cape in both 2001 and 2011, ranging between 38% and 45%.
Table 12: Poverty measures for Census 2001 and Census 2011 at municipal level in Northern Cape
Census 2001 Census 2011
Headcount (H) Intensity (A) SAMPI (HxA) Headcount (H) Intensity (A) SAMPI (HxA) Joe Morolong 37,3% 42,7% 0,16 18,2% 41,8% 0,08 !Kheis 16,5% 39,3% 0,06 12,3% 41,4% 0,05 Thembelihle 16,3% 42,3% 0,07 11,6% 42,4% 0,05 Dikgatlong 20,2% 42,5% 0,09 11,0% 42,1% 0,05 Phokwane 16,0% 42,4% 0,07 10,0% 42,1% 0,04 Siyancuma 19,8% 42,3% 0,08 9,8% 42,0% 0,04 Umsobomvu 17,0% 44,3% 0,08 9,2% 44,2% 0,04 Ga-Segonyana 21,9% 44,0% 0,10 8,9% 41,4% 0,04 Magareng 13,5% 43,0% 0,06 7,6% 40,2% 0,03 Ubuntu 15,0% 41,6% 0,06 6,9% 42,8% 0,03 Tsantsabane 11,5% 41,9% 0,05 6,5% 41,6% 0,03 Mier 13,9% 41,1% 0,06 6,7% 40,4% 0,03 Renosterberg 19,0% 45,0% 0,09 6,0% 44,3% 0,03 Kareeberg 10,9% 42,2% 0,05 6,0% 43,4% 0,03 Sol Plaatjie 9,9% 44,2% 0,04 5,6% 44,1% 0,02 Siyathemba 9,6% 42,3% 0,04 5,6% 41,8% 0,02 Kamiesberg 11,1% 40,7% 0,05 5,1% 40,0% 0,02 Khâi-Ma 6,7% 39,6% 0,03 4,4% 40,8% 0,02 Karoo Hoogland 11,0% 38,7% 0,04 4,2% 40,2% 0,02 //Khara Hais 10,2% 41,7% 0,04 3,7% 41,0% 0,02 Kai !Garib 6,2% 39,6% 0,02 3,5% 40,0% 0,01 Emthanjeni 11,3% 42,8% 0,05 3,3% 41,1% 0,01 Richtersveld 5,6% 41,4% 0,02 3,1% 39,9% 0,01 Kgatelopele 8,5% 42,7% 0,04 2,6% 41,5% 0,01 Gamagara 5,9% 42,0% 0,02 2,5% 42,6% 0,01 Nama Khoi 4,5% 42,1% 0,02 2,5% 40,4% 0,01 Hantam 6,4% 38,8% 0,02 2,3% 39,3% 0,01 Northern Cape 11,3% 42,3% 0,05 7,2% 42,1% 0,03
26
Figure 15: Poverty headcount (H) in Northern Cape at municipal level in 2001

27
Figure 16: Poverty headcount (H) in Northern Cape at municipal level in 2011

28
Poverty profile: Free State
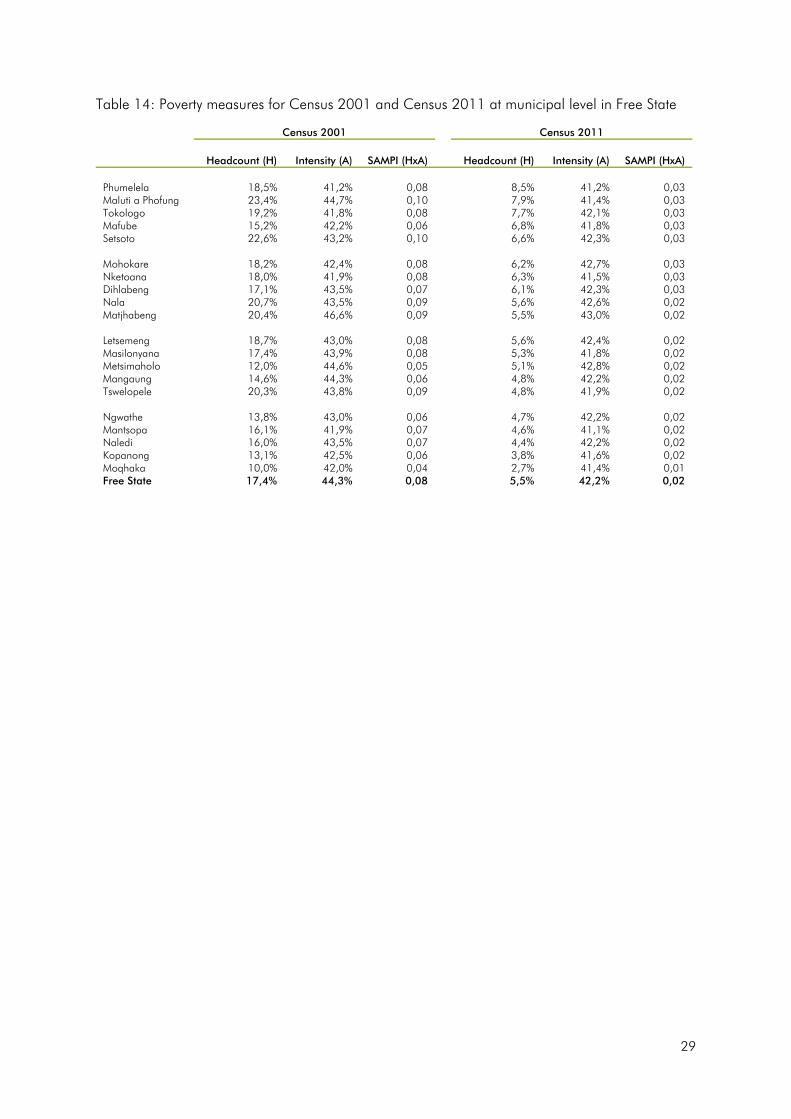
Free State saw the second largest percentage point change (11,8%) between 2001 and 2011, recording a headcount of just 5,6% in 2011 (down from 17,4% in 2001). This significant improvement in Free State helped it move up on the overall ranking, overtaking Northern Cape for the 7th spot.
Table 13: Poverty measures for Census 2001 and Census 2011 in Free State
Census year Headcount (H) Intensity (A) SAMPI (HxA) 2001 17,4% 44,3% 0,08 2011 5,6% 42,2% 0,02
As can be seen above, there was a 2,1 percentage point change in the intensity of poverty experienced by those residing in Free State between 2001 and 2011. In 2001, the intensity was measured at 44,3%, while in 2011 it had decreased to 42,2%. There was a tremendous improvement in the Free State SAMPI index score which dropped from 0,08 in 2001 to 0,02 by 2011.
Figure 17: Contribution of weighted indicators to SAMPI 2011 in Free State
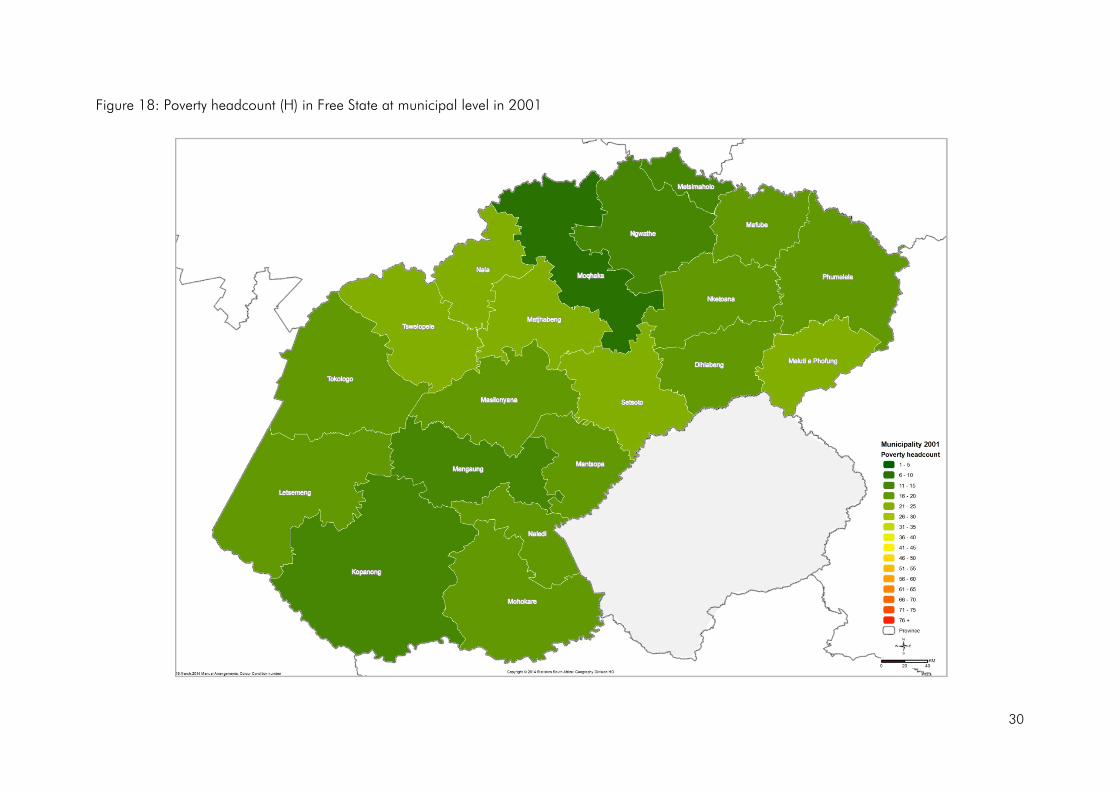
The contribution of indicators to the Free State SAMPI score also closely resembles the national profile. There was a noticeable improvement in the living standards dimension, especially in water, which is contributing roughly half compared to the national situation (4% in Free State versus 7% nationally). While the living standards dimension was better, the economic activity dimension was contributing more than what is happening at national level (44% in Free State versus 40% nationally). The child mortality indicator was also slightly higher than the national profile. The Moqhaka Municipality had the lowest headcount in both 2001 and 2011, measuring at 10,0% and 2,7% respectively. While the Maluti a Phofung Municipality was the worst off in 2001, reporting a headcount of 23,4% and a SAMPI score of 0,10, the poorest municipality in 2011 was Phumelela. In 2011, this municipality reported a headcount of 8,5%. The intensity of poverty experienced across municipalities was better in 2011, ranging from 41% to 43% as compared to between 41% and 47% in 2001.
Child Mortality2%
Years of Schooling
14% School Attendance
2%Lighting
5%
Heating7%
Cooking5%
Water4%
Sanitation7%
Dwelling6%
Assets4%
Unemployment44%
29
Table 14: Poverty measures for Census 2001 and Census 2011 at municipal level in Free State
Census 2001 Census 2011
Headcount (H) Intensity (A) SAMPI (HxA) Headcount (H) Intensity (A) SAMPI (HxA) Phumelela 18,5% 41,2% 0,08 8,5% 41,2% 0,03 Maluti a Phofung 23,4% 44,7% 0,10 7,9% 41,4% 0,03 Tokologo 19,2% 41,8% 0,08 7,7% 42,1% 0,03 Mafube 15,2% 42,2% 0,06 6,8% 41,8% 0,03 Setsoto 22,6% 43,2% 0,10 6,6% 42,3% 0,03 Mohokare 18,2% 42,4% 0,08 6,2% 42,7% 0,03 Nketoana 18,0% 41,9% 0,08 6,3% 41,5% 0,03 Dihlabeng 17,1% 43,5% 0,07 6,1% 42,3% 0,03 Nala 20,7% 43,5% 0,09 5,6% 42,6% 0,02 Matjhabeng 20,4% 46,6% 0,09 5,5% 43,0% 0,02 Letsemeng 18,7% 43,0% 0,08 5,6% 42,4% 0,02 Masilonyana 17,4% 43,9% 0,08 5,3% 41,8% 0,02 Metsimaholo 12,0% 44,6% 0,05 5,1% 42,8% 0,02 Mangaung 14,6% 44,3% 0,06 4,8% 42,2% 0,02 Tswelopele 20,3% 43,8% 0,09 4,8% 41,9% 0,02 Ngwathe 13,8% 43,0% 0,06 4,7% 42,2% 0,02 Mantsopa 16,1% 41,9% 0,07 4,6% 41,1% 0,02 Naledi 16,0% 43,5% 0,07 4,4% 42,2% 0,02 Kopanong 13,1% 42,5% 0,06 3,8% 41,6% 0,02 Moqhaka 10,0% 42,0% 0,04 2,7% 41,4% 0,01 Free State 17,4% 44,3% 0,08 5,5% 42,2% 0,02
30
Figure 18: Poverty headcount (H) in Free State at municipal level in 2001

31
Figure 19: Poverty headcount (H) in Free State at municipal level in 2011
32
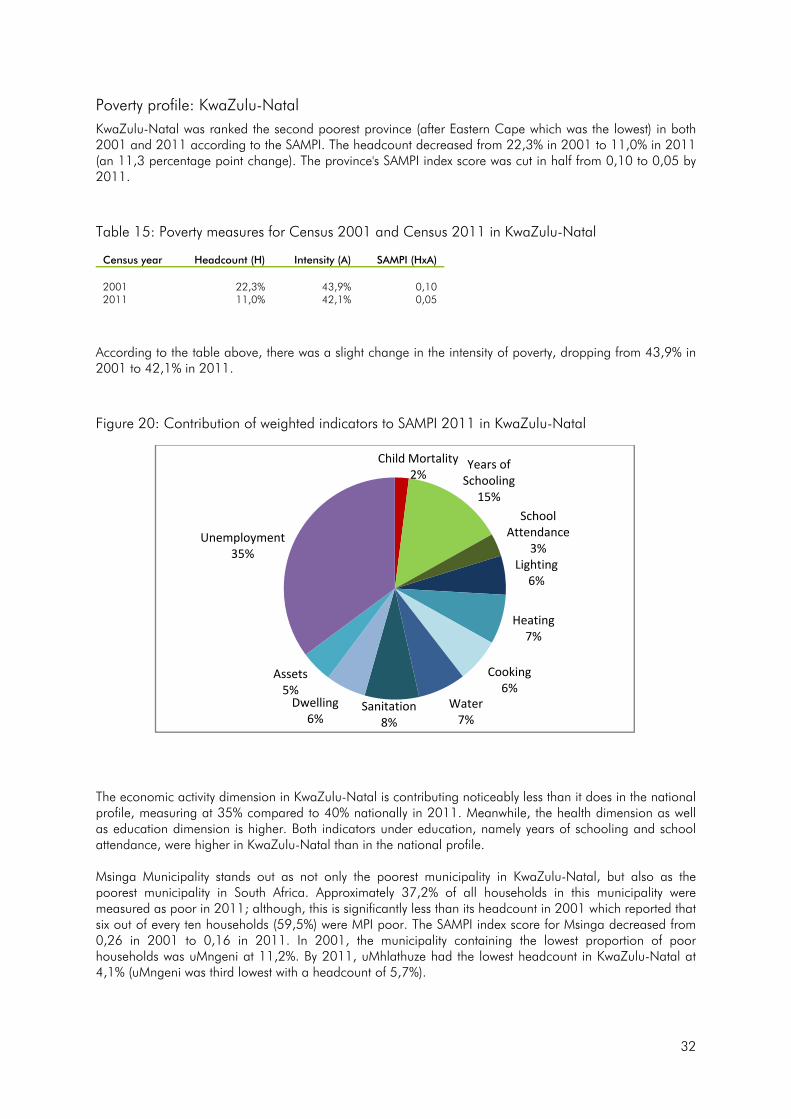
Poverty profile: KwaZulu-Natal
KwaZulu-Natal was ranked the second poorest province (after Eastern Cape which was the lowest) in both 2001 and 2011 according to the SAMPI. The headcount decreased from 22,3% in 2001 to 11,0% in 2011 (an 11,3 percentage point change). The province's SAMPI index score was cut in half from 0,10 to 0,05 by 2011.
Table 15: Poverty measures for Census 2001 and Census 2011 in KwaZulu-Natal
Census year Headcount (H) Intensity (A) SAMPI (HxA) 2001 22,3% 43,9% 0,10 2011 11,0% 42,1% 0,05
According to the table above, there was a slight change in the intensity of poverty, dropping from 43,9% in 2001 to 42,1% in 2011.
Figure 20: Contribution of weighted indicators to SAMPI 2011 in KwaZulu-Natal
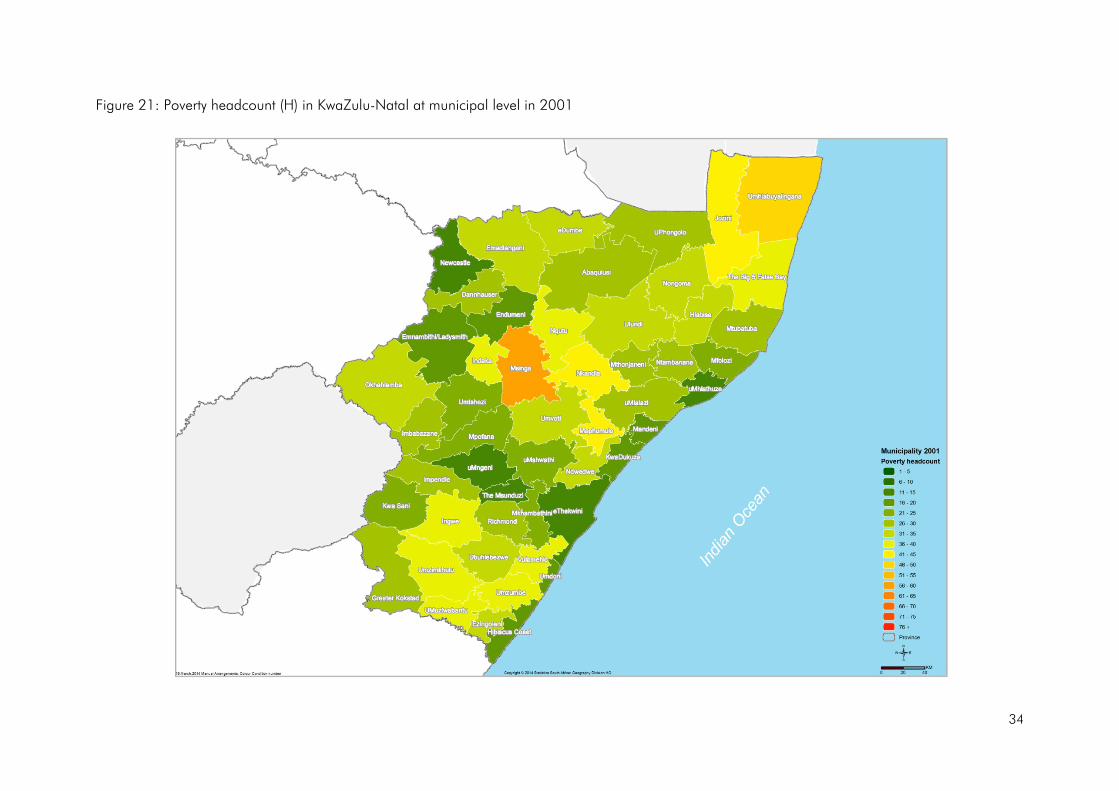
The economic activity dimension in KwaZulu-Natal is contributing noticeably less than it does in the national profile, measuring at 35% compared to 40% nationally in 2011. Meanwhile, the health dimension as well as education dimension is higher. Both indicators under education, namely years of schooling and school attendance, were higher in KwaZulu-Natal than in the national profile. Msinga Municipality stands out as not only the poorest municipality in KwaZulu-Natal, but also as the poorest municipality in South Africa. Approximately 37,2% of all households in this municipality were measured as poor in 2011; although, this is significantly less than its headcount in 2001 which reported that six out of every ten households (59,5%) were MPI poor. The SAMPI index score for Msinga decreased from 0,26 in 2001 to 0,16 in 2011. In 2001, the municipality containing the lowest proportion of poor households was uMngeni at 11,2%. By 2011, uMhlathuze had the lowest headcount in KwaZulu-Natal at 4,1% (uMngeni was third lowest with a headcount of 5,7%).
Child Mortality2%
Years of Schooling
15%School
Attendance3%
Lighting6%
Heating7%
Cooking6%
Water7%
Sanitation8%
Dwelling6%
Assets5%
Unemployment35%

33
Table 16: Poverty measures for Census 2001 and Census 2011 at municipal level in KwaZulu-Natal
Census 2001 Census 2011
Headcount (H) Intensity (A) SAMPI (HxA) Headcount (H) Intensity (A) SAMPI (HxA) Msinga 59,5% 44,0% 0,26 37,2% 43,1% 0,16 Umhlabuyalingana 48,9% 44,6% 0,22 29,5% 42,7% 0,13 Vulamehlo 36,2% 42,3% 0,15 29,0% 41,2% 0,12 Maphumulo 43,5% 42,7% 0,19 25,4% 40,6% 0,10 Nkandla 44,3% 43,3% 0,19 24,2% 41,2% 0,10 Jozini 43,0% 43,6% 0,19 22,3% 42,6% 0,09 Umzumbe 36,4% 42,4% 0,15 22,8% 41,2% 0,09 Umzimkhulu 40,0% 43,4% 0,17 22,2% 42,2% 0,09 Emadlangeni 33,5% 42,0% 0,14 21,4% 42,1% 0,09 Ubuhlebezwe 35,0% 43,3% 0,15 21,7% 41,5% 0,09 Ndwedwe 34,7% 42,4% 0,15 21,6% 41,0% 0,09 Ingwe 39,2% 43,0% 0,17 21,4% 41,3% 0,09 Umvoti 32,7% 41,8% 0,14 19,9% 41,4% 0,08 Nqutu 38,2% 43,9% 0,17 19,5% 41,6% 0,08 Okhahlamba 34,2% 44,5% 0,15 18,7% 42,5% 0,08 Indaka 35,5% 43,5% 0,15 18,3% 42,7% 0,08 The Big 5 False Bay 36,0% 43,6% 0,16 17,5% 42,1% 0,07 UMuziwabantu 37,7% 42,3% 0,16 17,4% 41,5% 0,07 Ntambanana 29,8% 41,6% 0,12 16,9% 41,3% 0,07 Hlabisa 33,5% 43,7% 0,15 16,1% 41,8% 0,07 Umtshezi 24,0% 46,0% 0,11 15,5% 43,3% 0,07 Mthonjaneni 27,1% 41,6% 0,11 16,4% 40,9% 0,07 Imbabazane 29,8% 43,4% 0,13 16,1% 41,5% 0,07 Nongoma 34,5% 43,0% 0,15 15,3% 41,7% 0,06 uMlalazi 27,3% 42,6% 0,12 15,6% 40,4% 0,06 Ezingoleni 32,0% 42,2% 0,14 15,0% 41,0% 0,06 Umdoni 19,3% 45,7% 0,09 13,8% 43,8% 0,06 Mkhambathini 23,3% 42,1% 0,10 14,8% 40,7% 0,06 Impendle 28,0% 43,1% 0,12 14,2% 41,3% 0,06 eDumbe 31,2% 42,8% 0,13 13,4% 41,2% 0,06 Richmond 26,2% 42,4% 0,11 13,0% 39,9% 0,05 UPhongolo 26,0% 42,3% 0,11 12,5% 41,4% 0,05 Ulundi 31,1% 43,9% 0,14 12,4% 41,6% 0,05 Dannhauser 27,4% 44,1% 0,12 11,6% 41,6% 0,05 Mtubatuba 27,2% 43,9% 0,12 11,6% 41,5% 0,05 Abaqulusi 27,0% 44,5% 0,12 11,2% 41,9% 0,05 KwaSani 21,0% 40,2% 0,08 10,9% 40,8% 0,04 Mpofana 21,8% 44,5% 0,10 10,8% 40,9% 0,04 uMshwathi 23,3% 41,4% 0,10 10,6% 40,3% 0,04 Mfolozi 23,9% 43,7% 0,10 10,0% 41,5% 0,04 Greater Kokstad 29,7% 42,6% 0,13 9,3% 42,9% 0,04 Mandeni 17,9% 43,1% 0,08 8,8% 41,2% 0,04 KwaDukuza 19,3% 42,6% 0,08 8,6% 41,2% 0,04 Emnambithi-Ladysmith 18,2% 43,7% 0,08 8,1% 41,6% 0,03 Hibiscus Coast 17,0% 43,2% 0,07 8,0% 41,8% 0,03 Endumeni 16,6% 45,3% 0,08 7,3% 43,3% 0,03 eThekwini 14,8% 45,5% 0,07 6,6% 42,8% 0,03 The Msunduzi 13,8% 44,4% 0,06 5,9% 42,5% 0,02 uMngeni 11,2% 41,4% 0,05 5,7% 43,4% 0,02 Newcastle 14,2% 44,0% 0,06 5,5% 42,1% 0,02 uMhlathuze 13,3% 44,6% 0,06 4,1% 41,6% 0,02 KwaZulu-Natal 22,3% 43,9% 0,10 10,9% 42,0% 0,05
34
Figure 21: Poverty headcount (H) in KwaZulu-Natal at municipal level in 2001

35
Figure 22: Poverty headcount (H) in KwaZulu-Natal at municipal level in 2011

36
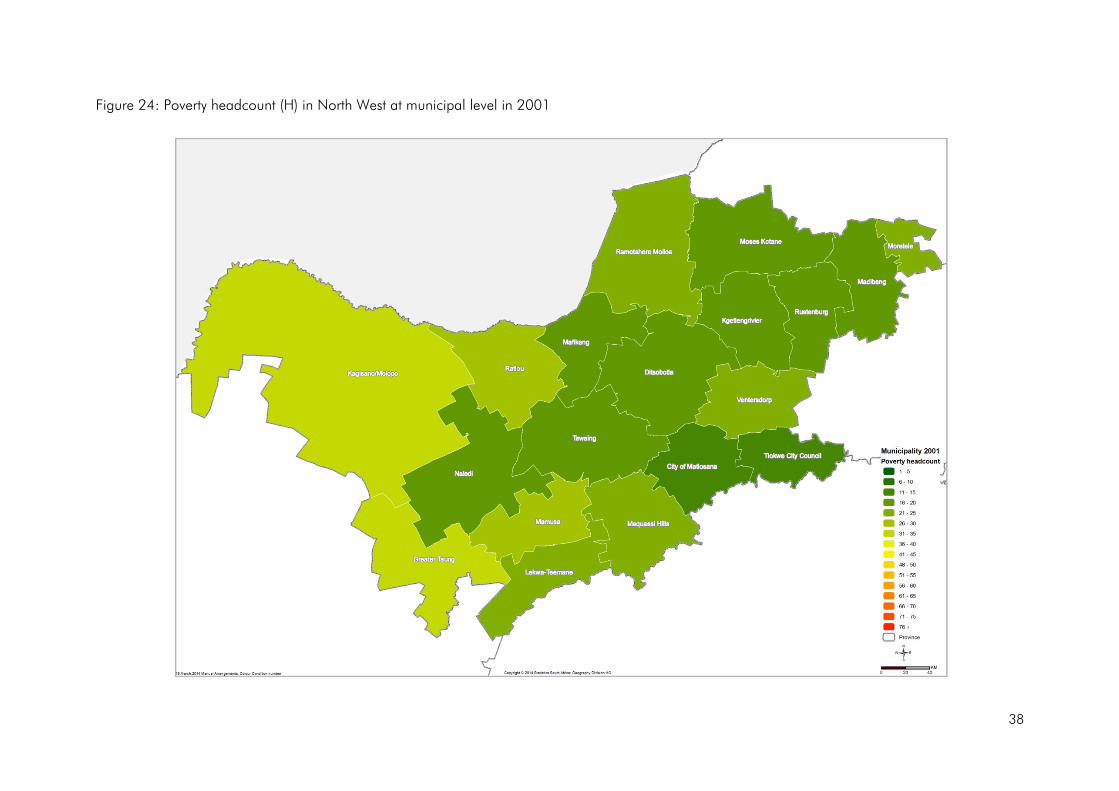
Poverty profile: North West
North West had the fourth highest poverty headcount of all provinces in 2001 and 2011, with the headcount decreasing by more than half from 19,5% in 2001 to 9,2% in 2011.
Table 17: Poverty measures for Census 2001 and Census 2011 in North West
Census year Headcount (H) Intensity (A) SAMPI (HxA) 2001 19,5% 43,4% 0,08 2011 9,2% 42,0% 0,04
The intensity of poverty in North West also saw a decrease from 2001 to 2011. This meant that the SAMPI halved from 0,08 in 2001 to 0,04 in 2011.
Figure 23: Contribution of weighted indicators to SAMPI 2011 in North West
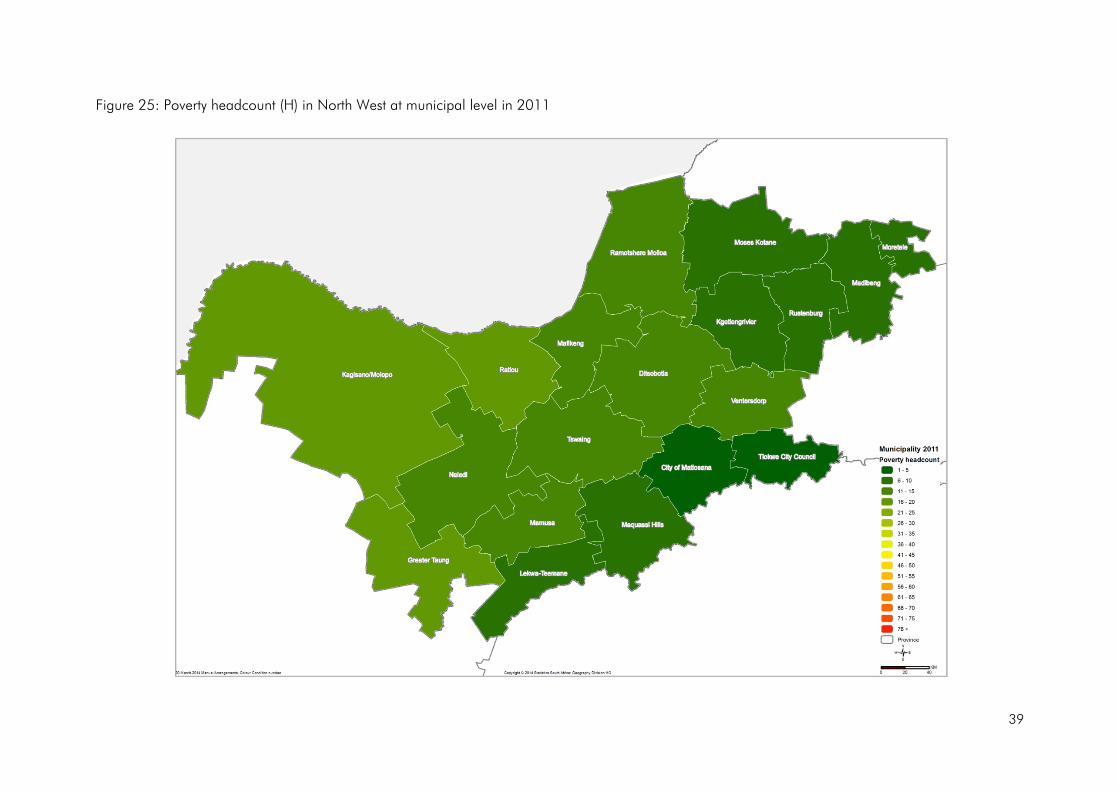
The education dimension played more of a contributory role to the SAMPI in North West than at national level, contributing 19% in 2011. While the economic activity dimension played less of a role, the standard of living dimension contributed a similar amount within North West as it had at national level. Greater Taung Municipality had the highest poverty headcount in 2001 at 32,3%. However, by 2011 the municipality with the highest headcount was Kagisano/Molopo at 17,0%, with Greater Taung joint second with Ratlou at 16,6%.
Child Mortality2% Years of
Schooling17%
School Attendance
2%Lighting
5%
Heating7%
Cooking6%
Water6%
Sanitation8%
Dwelling5%
Assets5%
Unemployment37%

37
Table 18: Poverty measures for Census 2001 and Census 2011 at municipal level in North West
Census 2001 Census 2011
Headcount (H) Intensity (A) SAMPI (HxA) Headcount (H) Intensity (A) SAMPI (HxA) Ratlou 28,9% 44,6% 0,13 16,6% 42,4% 0,07 Kagisano/Molopo 31,9% 42,6% 0,14 17,0% 41,3% 0,07 Greater Taung 32,3% 43,9% 0,14 16,6% 42,2% 0,07 Tswaing 19,8% 41,8% 0,08 13,4% 41,6% 0,06 Ramotshere Moiloa 21,7% 42,6% 0,09 13,2% 42,0% 0,06 Ditsobotla 19,3% 42,3% 0,08 11,6% 41,8% 0,05 Ventersdorp 20,1% 40,9% 0,08 11,4% 40,6% 0,05 Mafikeng 19,2% 44,1% 0,08 10,6% 42,5% 0,05 Naledi 18,2% 40,9% 0,07 10,7% 41,9% 0,04 Mamusa 25,8% 43,0% 0,11 10,1% 42,0% 0,04 Madibeng 19,7% 43,3% 0,09 9,5% 42,0% 0,04 Moses Kotane 16,5% 43,0% 0,07 8,3% 41,3% 0,03 Kgetlengrivier 19,4% 40,9% 0,08 8,2% 41,3% 0,03 Maquassi Hills 24,0% 42,1% 0,10 8,1% 40,8% 0,03 Moretele 21,3% 43,9% 0,09 7,9% 41,2% 0,03 Rustenburg 16,8% 43,6% 0,07 7,2% 42,9% 0,03 Lekwa-Teemane 20,1% 43,3% 0,09 5,1% 42,0% 0,02 City of Matlosana 14,6% 44,2% 0,06 4,5% 41,4% 0,02 Tlokwe City Council 11,4% 43,3% 0,05 3,9% 42,7% 0,02 North West 19,5% 43,4% 0,08 9,2% 42,0% 0,04
38
Figure 24: Poverty headcount (H) in North West at municipal level in 2001
39
Figure 25: Poverty headcount (H) in North West at municipal level in 2011
40
Poverty profile: Gauteng
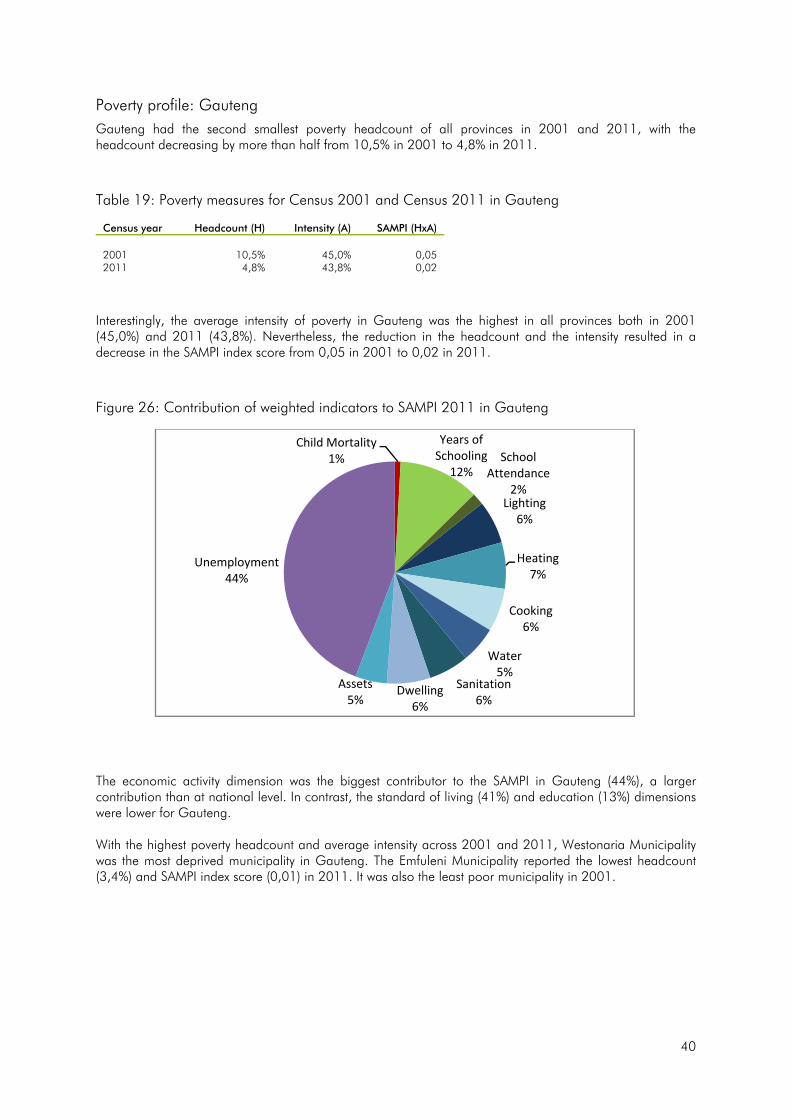
Gauteng had the second smallest poverty headcount of all provinces in 2001 and 2011, with the headcount decreasing by more than half from 10,5% in 2001 to 4,8% in 2011.
Table 19: Poverty measures for Census 2001 and Census 2011 in Gauteng
Census year Headcount (H) Intensity (A) SAMPI (HxA) 2001 10,5% 45,0% 0,05 2011 4,8% 43,8% 0,02
Interestingly, the average intensity of poverty in Gauteng was the highest in all provinces both in 2001 (45,0%) and 2011 (43,8%). Nevertheless, the reduction in the headcount and the intensity resulted in a decrease in the SAMPI index score from 0,05 in 2001 to 0,02 in 2011.
Figure 26: Contribution of weighted indicators to SAMPI 2011 in Gauteng
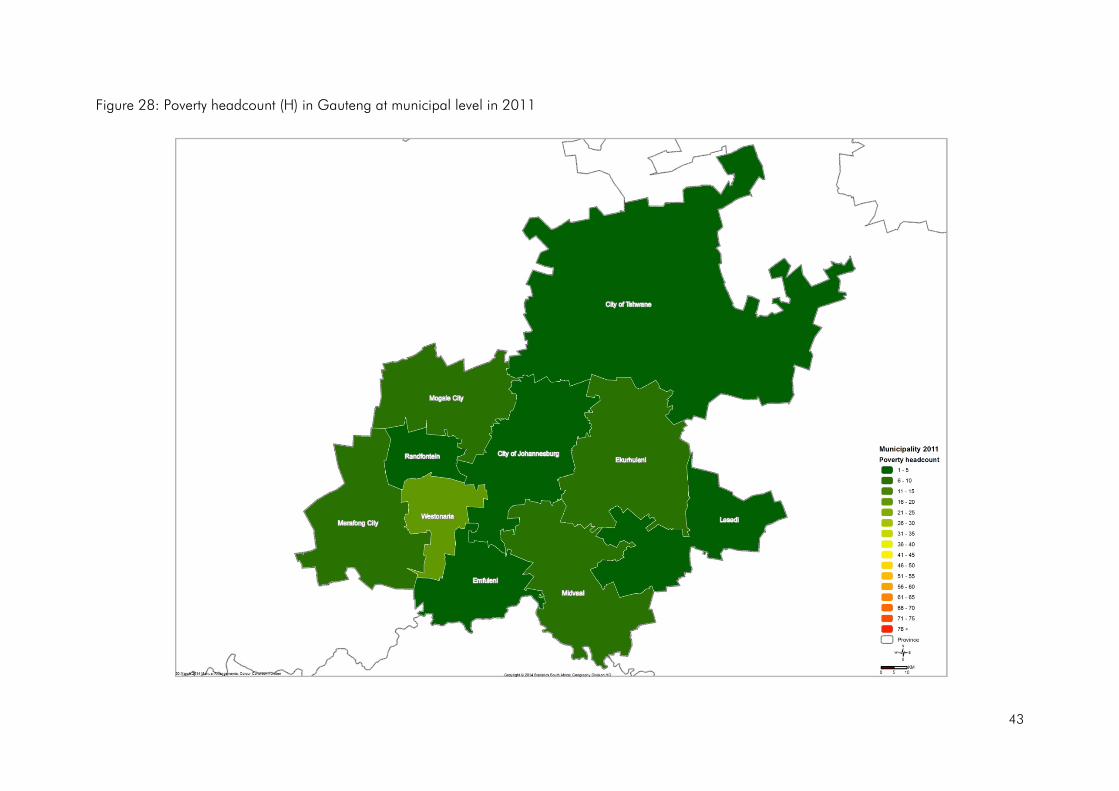
The economic activity dimension was the biggest contributor to the SAMPI in Gauteng (44%), a larger contribution than at national level. In contrast, the standard of living (41%) and education (13%) dimensions were lower for Gauteng. With the highest poverty headcount and average intensity across 2001 and 2011, Westonaria Municipality was the most deprived municipality in Gauteng. The Emfuleni Municipality reported the lowest headcount (3,4%) and SAMPI index score (0,01) in 2011. It was also the least poor municipality in 2001.
Child Mortality1%
Years of Schooling
12%School
Attendance2%
Lighting6%
Heating7%
Cooking6%
Water5%
Sanitation6%
Dwelling6%
Assets5%
Unemployment44%

41
Table 20: Poverty measures for Census 2001 and Census 2011 at municipal level in Gauteng
Census 2001 Census 2011
Headcount (H) Intensity (A) SAMPI (HxA) Headcount (H) Intensity (A) SAMPI (HxA) Westonaria 18,7% 46,9% 0,09 15,4% 45,0% 0,07 Merafong City 12,6% 46,2% 0,06 8,5% 44,5% 0,04 Midvaal 12,7% 43,3% 0,05 6,5% 44,1% 0,03 Ekurhuleni 13,4% 45,4% 0,06 6,4% 44,5% 0,03 Mogale City 10,6% 43,6% 0,05 5,8% 43,8% 0,03 Randfontein 10,5% 43,5% 0,05 4,9% 43,3% 0,02 Lesedi 13,1% 42,5% 0,06 4,8% 41,8% 0,02 City of Tshwane 10,0% 44,3% 0,04 4,2% 43,4% 0,02 City of Johannesburg 9,1% 45,1% 0,04 3,7% 43,3% 0,02 Emfuleni 8,6% 43,3% 0,04 3,4% 42,3% 0,01 Gauteng 10,5% 45,0% 0,05 4,8% 43,8% 0,02

42
Figure 27: Poverty headcount (H) in Gauteng at municipal level in 2001
43
Figure 28: Poverty headcount (H) in Gauteng at municipal level in 2011
44
Poverty profile: Mpumalanga
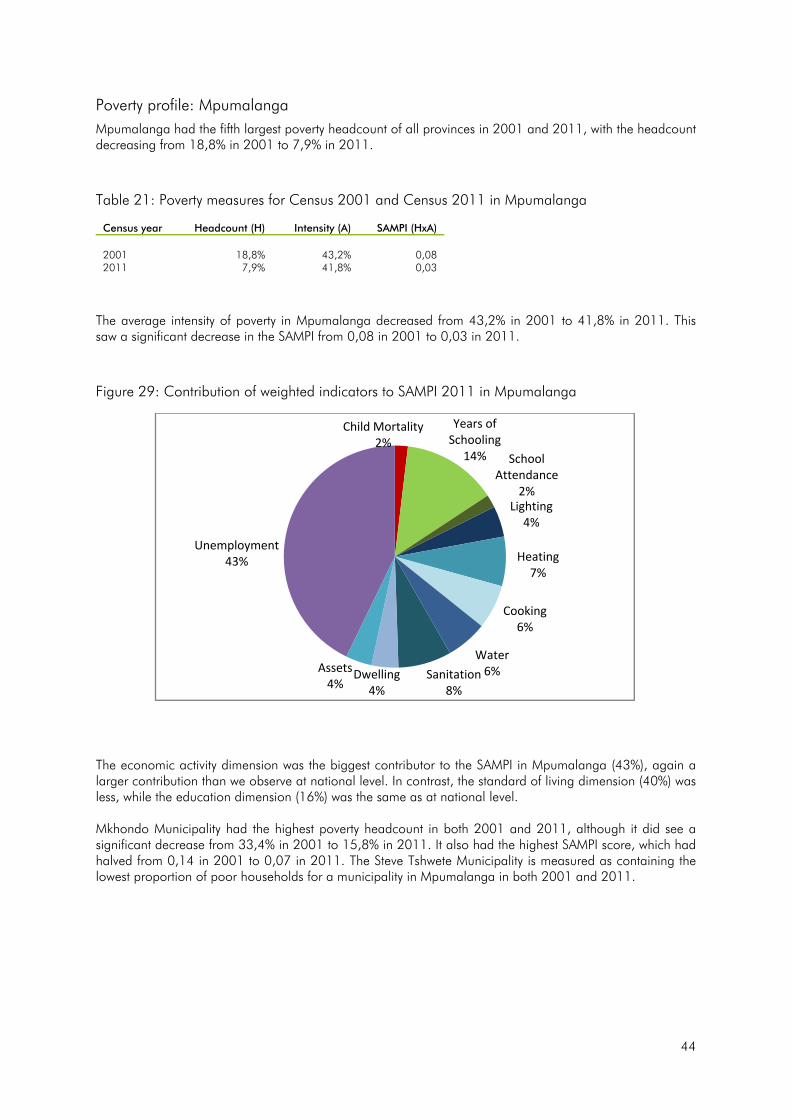
Mpumalanga had the fifth largest poverty headcount of all provinces in 2001 and 2011, with the headcount decreasing from 18,8% in 2001 to 7,9% in 2011.
Table 21: Poverty measures for Census 2001 and Census 2011 in Mpumalanga
Census year Headcount (H) Intensity (A) SAMPI (HxA) 2001 18,8% 43,2% 0,08 2011 7,9% 41,8% 0,03
The average intensity of poverty in Mpumalanga decreased from 43,2% in 2001 to 41,8% in 2011. This saw a significant decrease in the SAMPI from 0,08 in 2001 to 0,03 in 2011.
Figure 29: Contribution of weighted indicators to SAMPI 2011 in Mpumalanga
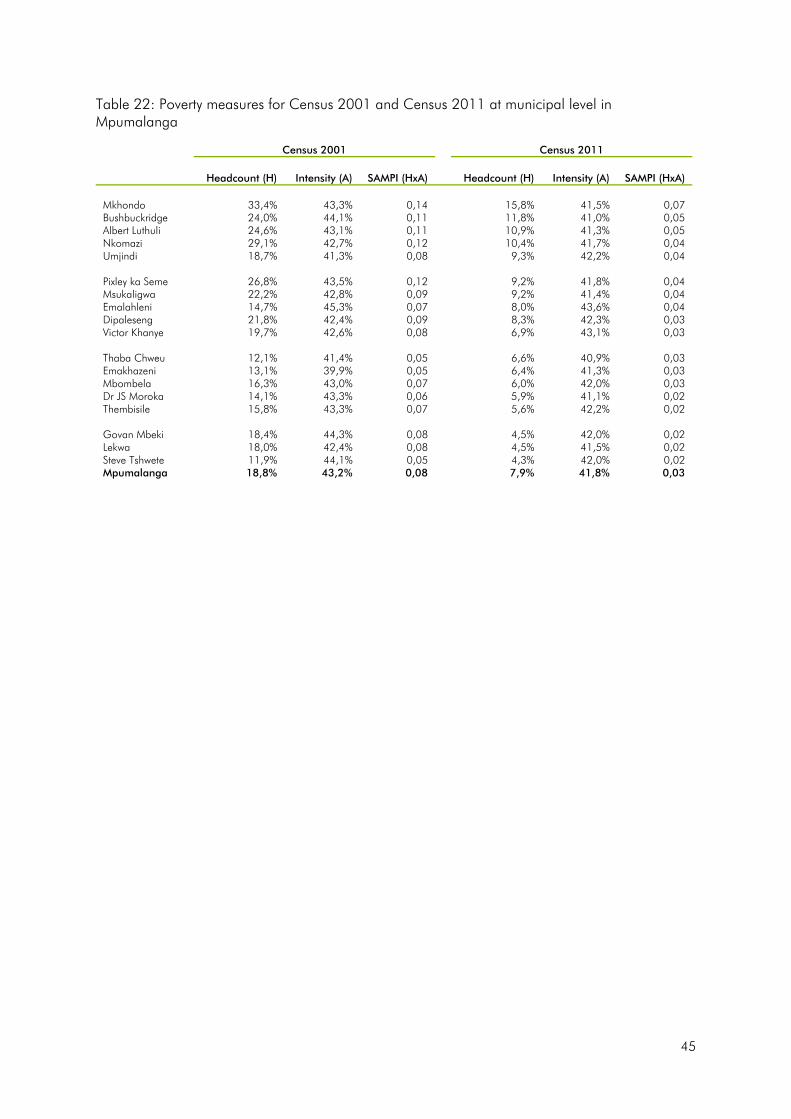
The economic activity dimension was the biggest contributor to the SAMPI in Mpumalanga (43%), again a larger contribution than we observe at national level. In contrast, the standard of living dimension (40%) was less, while the education dimension (16%) was the same as at national level. Mkhondo Municipality had the highest poverty headcount in both 2001 and 2011, although it did see a significant decrease from 33,4% in 2001 to 15,8% in 2011. It also had the highest SAMPI score, which had halved from 0,14 in 2001 to 0,07 in 2011. The Steve Tshwete Municipality is measured as containing the lowest proportion of poor households for a municipality in Mpumalanga in both 2001 and 2011.
Child Mortality2%
Years of Schooling
14% School Attendance
2%Lighting
4%
Heating7%
Cooking6%
Water6%Sanitation
8%Dwelling
4%
Assets4%
Unemployment43%
45
Table 22: Poverty measures for Census 2001 and Census 2011 at municipal level in Mpumalanga
Census 2001 Census 2011
Headcount (H) Intensity (A) SAMPI (HxA) Headcount (H) Intensity (A) SAMPI (HxA) Mkhondo 33,4% 43,3% 0,14 15,8% 41,5% 0,07 Bushbuckridge 24,0% 44,1% 0,11 11,8% 41,0% 0,05 Albert Luthuli 24,6% 43,1% 0,11 10,9% 41,3% 0,05 Nkomazi 29,1% 42,7% 0,12 10,4% 41,7% 0,04 Umjindi 18,7% 41,3% 0,08 9,3% 42,2% 0,04 Pixley ka Seme 26,8% 43,5% 0,12 9,2% 41,8% 0,04 Msukaligwa 22,2% 42,8% 0,09 9,2% 41,4% 0,04 Emalahleni 14,7% 45,3% 0,07 8,0% 43,6% 0,04 Dipaleseng 21,8% 42,4% 0,09 8,3% 42,3% 0,03 Victor Khanye 19,7% 42,6% 0,08 6,9% 43,1% 0,03 Thaba Chweu 12,1% 41,4% 0,05 6,6% 40,9% 0,03 Emakhazeni 13,1% 39,9% 0,05 6,4% 41,3% 0,03 Mbombela 16,3% 43,0% 0,07 6,0% 42,0% 0,03 Dr JS Moroka 14,1% 43,3% 0,06 5,9% 41,1% 0,02 Thembisile 15,8% 43,3% 0,07 5,6% 42,2% 0,02 Govan Mbeki 18,4% 44,3% 0,08 4,5% 42,0% 0,02 Lekwa 18,0% 42,4% 0,08 4,5% 41,5% 0,02 Steve Tshwete 11,9% 44,1% 0,05 4,3% 42,0% 0,02 Mpumalanga 18,8% 43,2% 0,08 7,9% 41,8% 0,03
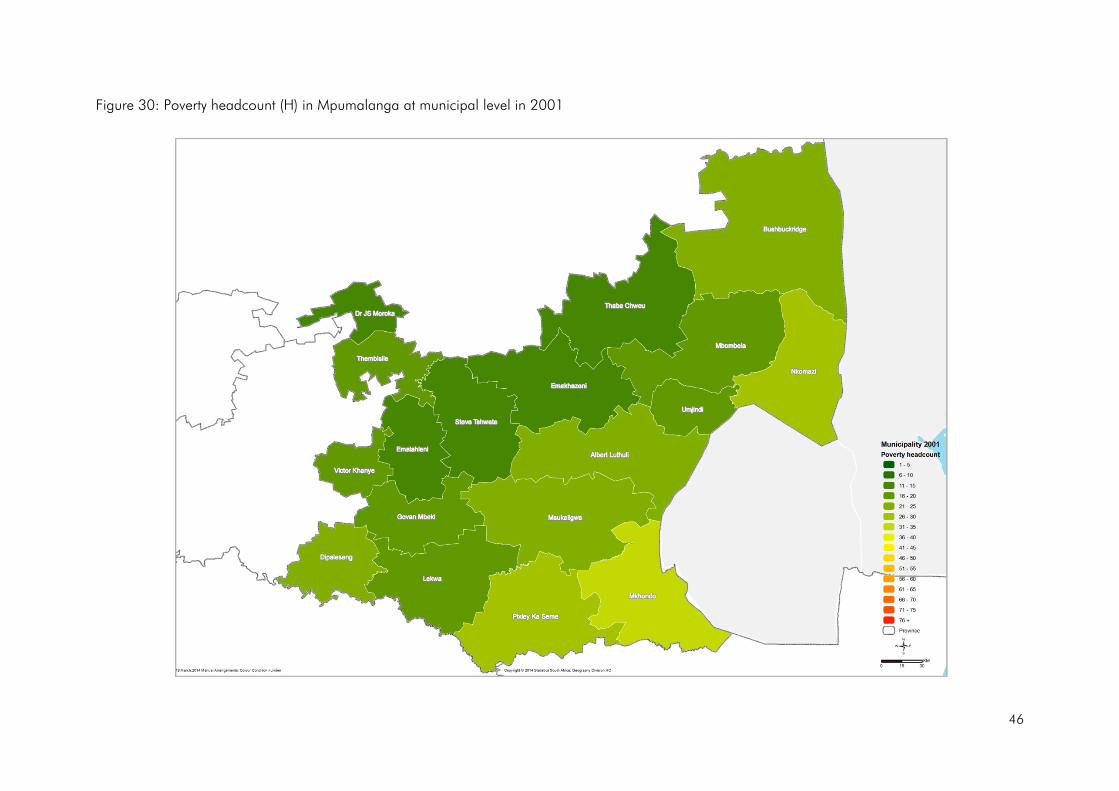
46
Figure 30: Poverty headcount (H) in Mpumalanga at municipal level in 2001
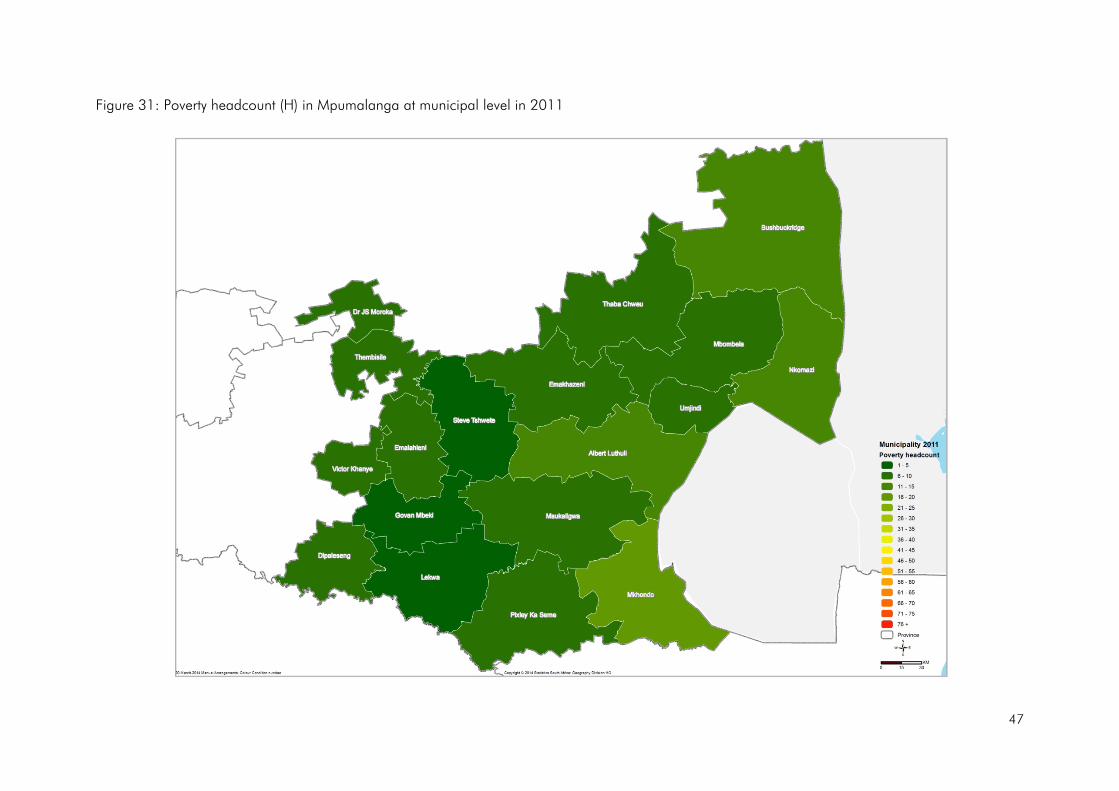
47
Figure 31: Poverty headcount (H) in Mpumalanga at municipal level in 2011
48
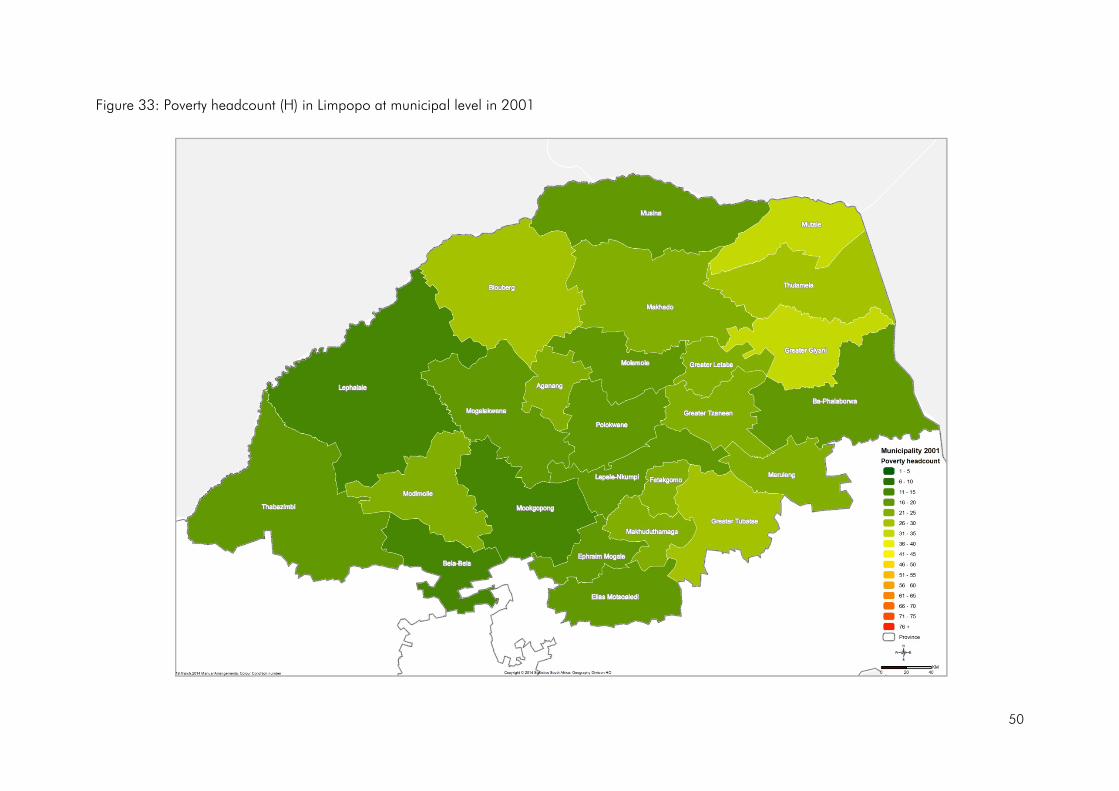
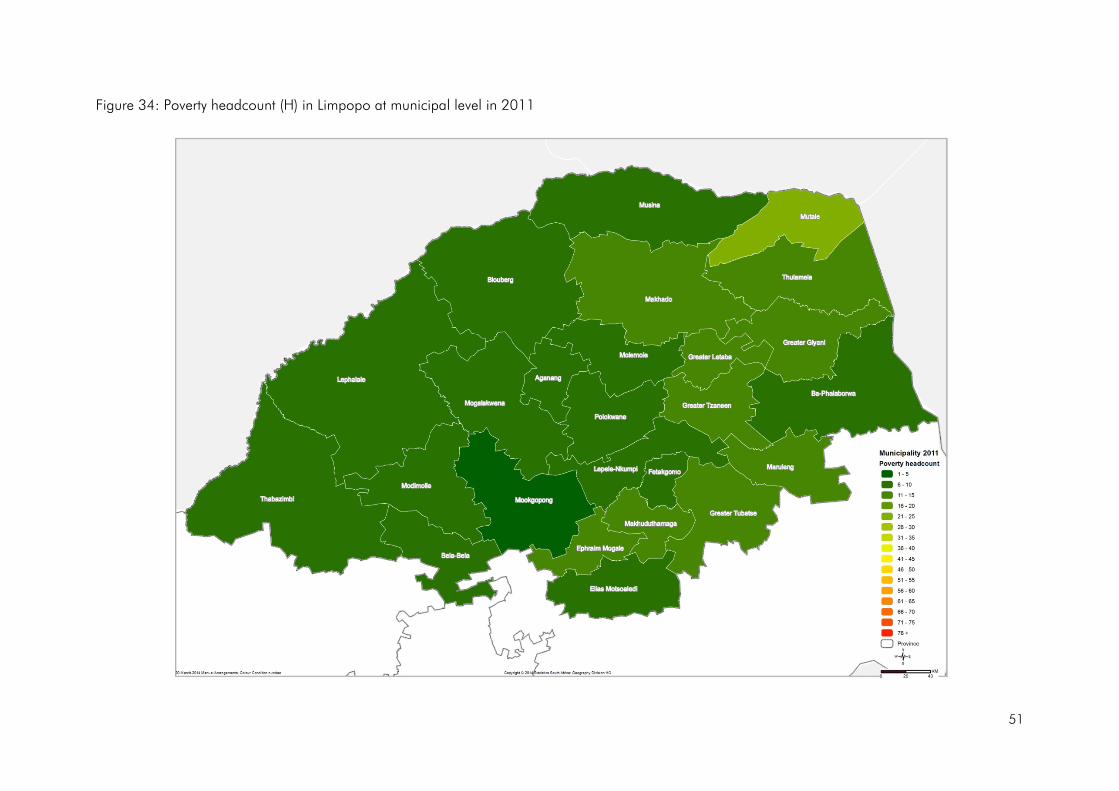
Poverty profile: Limpopo
Limpopo had the third largest poverty headcount of all provinces in 2001 and 2011 after Eastern Cape and KwaZulu-Natal. The province had a headcount that decreased from 21,8% in 2001 to 10,1% in 2011.
Table 23: Poverty measures for Census 2001 and Census 2011 in Limpopo
Census year Headcount (H) Intensity (A) SAMPI (HxA) 2001 21,8% 43,5% 0,09 2011 10,1% 41,6% 0,04
The average intensity of poverty in Limpopo decreased from 43,5% in 2001 to 41,6% in 2011. Its SAMPI index score decreased from 0,09 in 2001 to 0,04 in 2011.
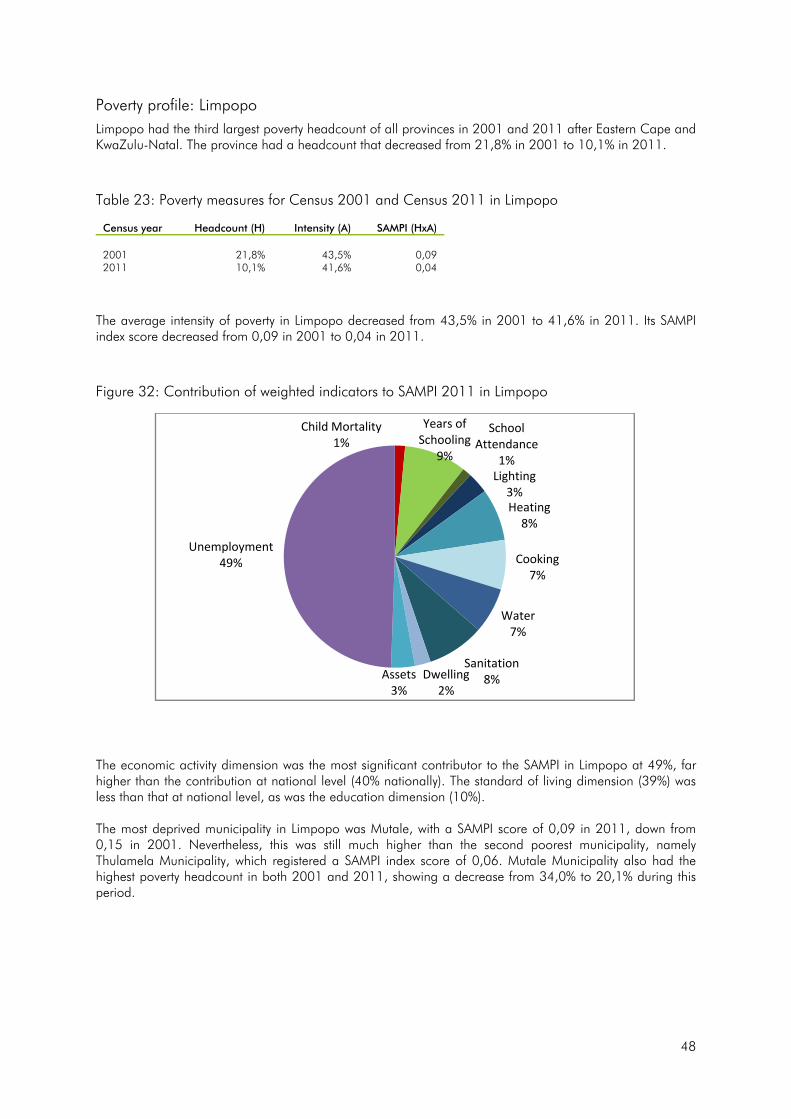
Figure 32: Contribution of weighted indicators to SAMPI 2011 in Limpopo
The economic activity dimension was the most significant contributor to the SAMPI in Limpopo at 49%, far higher than the contribution at national level (40% nationally). The standard of living dimension (39%) was less than that at national level, as was the education dimension (10%). The most deprived municipality in Limpopo was Mutale, with a SAMPI score of 0,09 in 2011, down from 0,15 in 2001. Nevertheless, this was still much higher than the second poorest municipality, namely Thulamela Municipality, which registered a SAMPI index score of 0,06. Mutale Municipality also had the highest poverty headcount in both 2001 and 2011, showing a decrease from 34,0% to 20,1% during this period.
Child Mortality1%
Years of Schooling
9%
School Attendance
1%Lighting
3%Heating
8%
Cooking7%
Water7%
Sanitation8%Dwelling
2%Assets
3%
Unemployment49%
49
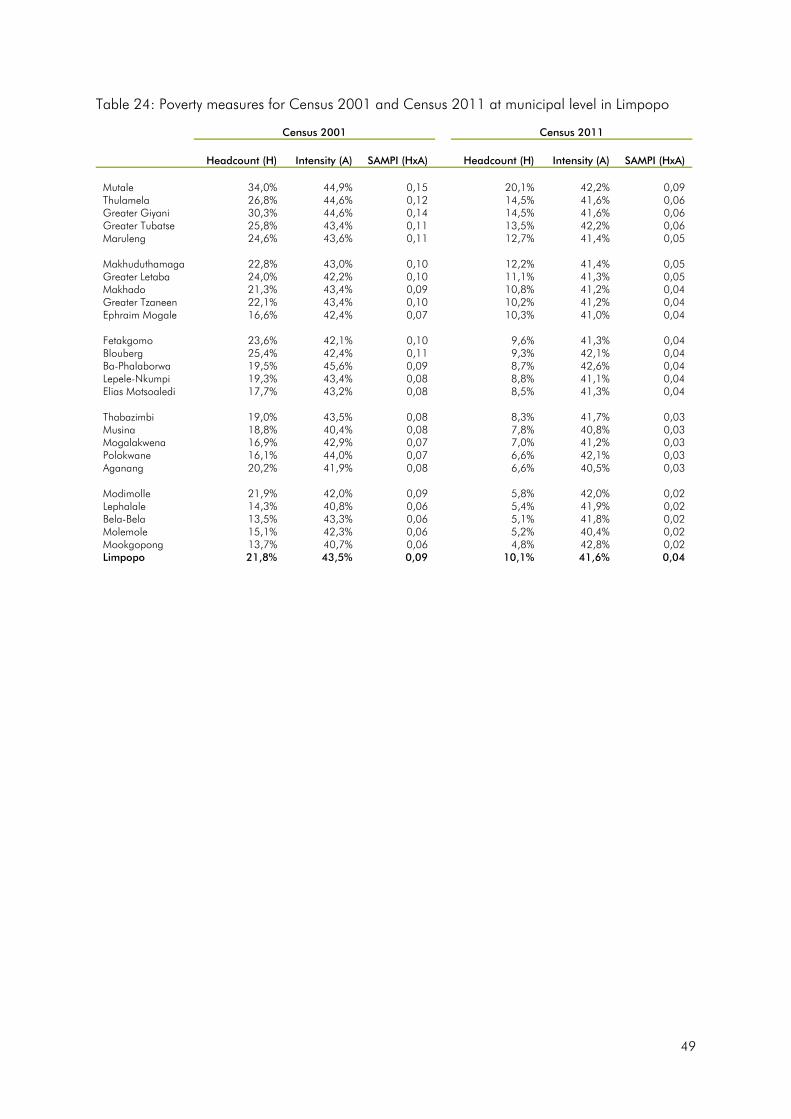
Table 24: Poverty measures for Census 2001 and Census 2011 at municipal level in Limpopo
Census 2001 Census 2011
Headcount (H) Intensity (A) SAMPI (HxA) Headcount (H) Intensity (A) SAMPI (HxA) Mutale 34,0% 44,9% 0,15 20,1% 42,2% 0,09 Thulamela 26,8% 44,6% 0,12 14,5% 41,6% 0,06 Greater Giyani 30,3% 44,6% 0,14 14,5% 41,6% 0,06 Greater Tubatse 25,8% 43,4% 0,11 13,5% 42,2% 0,06 Maruleng 24,6% 43,6% 0,11 12,7% 41,4% 0,05 Makhuduthamaga 22,8% 43,0% 0,10 12,2% 41,4% 0,05 Greater Letaba 24,0% 42,2% 0,10 11,1% 41,3% 0,05 Makhado 21,3% 43,4% 0,09 10,8% 41,2% 0,04 Greater Tzaneen 22,1% 43,4% 0,10 10,2% 41,2% 0,04 Ephraim Mogale 16,6% 42,4% 0,07 10,3% 41,0% 0,04 Fetakgomo 23,6% 42,1% 0,10 9,6% 41,3% 0,04 Blouberg 25,4% 42,4% 0,11 9,3% 42,1% 0,04 Ba-Phalaborwa 19,5% 45,6% 0,09 8,7% 42,6% 0,04 Lepele-Nkumpi 19,3% 43,4% 0,08 8,8% 41,1% 0,04 Elias Motsoaledi 17,7% 43,2% 0,08 8,5% 41,3% 0,04 Thabazimbi 19,0% 43,5% 0,08 8,3% 41,7% 0,03 Musina 18,8% 40,4% 0,08 7,8% 40,8% 0,03 Mogalakwena 16,9% 42,9% 0,07 7,0% 41,2% 0,03 Polokwane 16,1% 44,0% 0,07 6,6% 42,1% 0,03 Aganang 20,2% 41,9% 0,08 6,6% 40,5% 0,03 Modimolle 21,9% 42,0% 0,09 5,8% 42,0% 0,02 Lephalale 14,3% 40,8% 0,06 5,4% 41,9% 0,02 Bela-Bela 13,5% 43,3% 0,06 5,1% 41,8% 0,02 Molemole 15,1% 42,3% 0,06 5,2% 40,4% 0,02 Mookgopong 13,7% 40,7% 0,06 4,8% 42,8% 0,02 Limpopo 21,8% 43,5% 0,09 10,1% 41,6% 0,04
50
Figure 33: Poverty headcount (H) in Limpopo at municipal level in 2001
51
Figure 34: Poverty headcount (H) in Limpopo at municipal level in 2011

52
Conclusion
As this report has shown, there has been significant improvement in the poverty situation in South Africa between 2001 and 2011. We observe that the national headcount of those classified as being SAMPI poor has decreased from 17,9% in 2001 to 8,0% in 2011. When combined with the intensity, we see the country's SAMPI index score dropping from 0,08 to just 0,03. This change was mainly driven by the noticeable change in headcounts rather than changes in the intensity of poverty experienced by those who are poor. While the intensity of the poverty experienced only dropped from 43,9% in 2001 to 42,3% in 2011 nationally, the distribution of that intensity does reveal positive developments, namely a greater proportion of households within the 33,3% to 39,9% band and roughly half as many households within the extreme band of 60+%. At national level, the standard of living dimension contributed almost half (45,9%) to the SAMPI in 2001, with education contributing a further fifth (19,9%). By 2011, the contribution of the standard of living dimension had dropped to 42,6%, while education had also fallen by 3,9 percentage points to 16,0%. This reflects the improvements made by government in the delivery of basic services between 2001 and 2011. In contrast, the economic activity dimension, which contributed 32,9% to the SAMPI in 2001, saw an increase in contribution to 39,8% in 2011. This reaffirms the seriousness of the unemployment situation in the country and how that is significantly contributing to why households are poor in 2011. Eastern Cape, KwaZulu-Natal, Limpopo and North West are the provinces that reported the highest SAMPI index scores, and all had headcounts above the national average of 8,0% in 2011. Nevertheless, all have shown tremendous improvement since 2001. On the other hand, Western Cape, Gauteng and Free State are the three provinces with the lowest SAMPI index scores, all below the national score of 0,03 in 2011. It should be highlighted that Free State in particular reported amongst the highest percentage point changes between 2001 and 2011, along with Eastern Cape and KwaZulu-Natal. The contributing factors to poverty vary noticeably from province to province (and probably even further from municipality to municipality) and highlight that gains made in the standard of living, education, health and economic activity are not uniform across the provinces. The findings of the SAMPI will help inform provinces and municipalities on which issues they should prioritise resources and attention to further the fight against poverty.
The way forward
The next phase of analysis and mapping of poverty will take place at ward level within each of the municipalities. This analysis will also focus on the contribution of the weighted indicators within the different geographic locales. We acknowledge the shortcomings of the SAMPI (particularly as it pertains to the health dimension), which is constrained by the availability of data. Our longer term vision for the SAMPI is to continue generating this index whenever new census data become available – this will allow for continued disaggregation of the SAMPI to ward level. However, during 2015, we will be using data derived from the 2014 General Household Survey (GHS) to create a more nuanced SAMPI, which will then be updated on an annual basis using the same set of indicators from data gathered by whichever survey vehicle is in the field. Unfortunately, this data will only be able to provide disaggregation down to provincial level. Nevertheless, Stats SA is actively working towards providing increasingly lower level data through our household surveys through initiatives like the Continuous Population Survey (CPS); once structures like that are in place, we will be able to start providing the annual SAMPI at lower geographic levels as well.
ISBN 978-0-621-42616-8