Embed Size (px)
Citation preview
Hindawi Publishing CorporationTuberculosis Research and TreatmentVolume 2010, Article ID 406346, 6 pagesdoi:10.1155/2010/406346
Clinical Study
The Soluble Plasminogen Activator Receptor asa Biomarker on Monitoring the Therapy Progress ofPulmonary TB-AFB(+) Patients
Tri Yudani Mardining Raras1 and Iin Noor Chozin2
1 Laboratory of Biochemistry-Molecular Biology, Faculty of Medicine, Brawijaya University, Malang 65145, Indonesia2 Department of Pulmonology, Faculty of Medicine, Brawijaya University Malang-Dr. Saiful Anwar Hospital Malang,Malang 65145, Indonesia
Correspondence should be addressed to Tri Yudani Mardining Raras, [email protected]
Received 29 June 2010; Accepted 8 September 2010
Academic Editor: William N. Rom
Copyright © 2010 T. Y. Mardining Raras and I. Noor Chozin. This is an open access article distributed under the CreativeCommons Attribution License, which permits unrestricted use, distribution, and reproduction in any medium, provided theoriginal work is properly cited.
The role of soluble soluble urokinase-type plasminogen activator receptor (suPAR) as a biological marker for TB treatment efficacyon active pulmonary TB-AFB(+) patients was investigated. Twenty pulmonary TB-AFB(+) patients participated in a cohort studyfor six months. The plasma suPAR level was measured using ELISA method before treatment, two months, four months and sixmonths after treatment. At the same time clinical parameters were also measured. Results indicated that all patients (n = 20)showed highest plasma suPAR levels before treatment (median 12.775 ng/mL) and significantly decreased ( P = .0001 <.05,R2 = .890) after 2 months (median 8.019 ng/mL) and 4 months (median 5.771 ng/mL) of treatment, respectively. However, onlyslightly declined after 6 months therapy (median 5.009 ng/mL), near control group level (median 4.772 ng/mL). Interestingly, thesignificant reduced of suPAR level was parallel to treatment efficacy and correlated with other clinical and laboratory parameters,that is, decreasing of patients’ complaints, increasing of BMI (r = −0.281), thoracic imaging improvement, sputum conversion,decreasing of ESR (r = 0.577) and monocytes count (r = 0.536) with exception the width of lesion in thoracic imaging. Inconclusion, the suPAR level in could reflect the progress of TB therapy.
1. Background
The success in controlling Tuberculosis (TB) depends to agreat extent on the appropriate diagnosis, the right therapy,treatment monitoring, and evaluation. Particularly concern-ing the treatment, the long duration of therapy may adverselyaffect patient adherence to treatment and lead to failure ofthe recommended treatment program. This urges a stringentmonitoring program that could show the progress of thetherapy earlier than normal therapy (min. 6 months). In thelast decade, several biological markers have been intensivelystudied. Such markers could contribute, the improvement ofthe quality of clinical trials; and therefore enable develop-ment and validation of new therapeutic strategies.
One of the most intensively investigated biomarkers isurokinase plasminogen activator receptor (uPAR), a cellular
receptor for serine protease urokinase plasminogen activator(uPA). UPAR can be cleaved from the cell surface by anumber of protease, such as chymotrypsin, phospholipasesC, and uPA, to yield a soluble form of the receptor (suPAR)that has intrinsic chemotactic properties [1, 2]. One studyhas demonstrated elevated levels of suPAR in pulmonaryTB patient with higher suPAR levels in smear microscopy-positive patients compared to smear-negative patients [3].SuPAR is an inflammatory biomarker and thus not specificfor TB, but it is elevated by several infectious diseases and sto reflect the severity of disease and may hence be used as aprognostic tool. However, little is known about suPAR as aprognostic marker in extrapulmonary TB [4].
Assuming that serum levels of suPAR reflect the progressof the therapy, we investigated to access in prospective man-ner whether serum levels of suPAR may be used to monitor
2 Tuberculosis Research and Treatment
treatment of pulmonary TB-AFB(+) patients. In the presentstudy, the suPAR levels of TB pulmonary patients weremeasured during-six-month therapy and compared withother routine laboratory evaluation including Body MassIndex (BMI), monocyte count, Erytrocyte SedimentationRate, (ESR) and thorax imaging.
2. Material and Methods
2.1. Subjects. This study was conducted in Malang, wherethe prevalence of new smears or cultures positive for TB was107/100.000 population per year between 2008 and 2009. Forthe study, 5 tuberculin skin test positive healthy communitycontrols and 20 positive, newly diagnosed pulmonary TBwith sputum AFB-(Acid-fast bacillu) positive patients wereenrolled. The inclusive criteria were patients with category Iof pulmonary TB who regularly took medication, were maleand female aged between 15–50 years, had a BMI (BodyMass Index) >16, agreed to be the subject of the research,and signed the informed consent. Exclusion criteria wereTB patients with other diseases (severe bacterial pneumonia,HIV-AIDS, and heart disease, diabetes mellitus, heart andkidney problems), extra pulmonary TB, pregnant patients,and patients with psychiatric problems.
The patients received a six-month (26 weeks) directlyobserved short course antituberculosis therapy as recom-mended by the Indonesian National Tuberculosis Programbased on WHO TB guidelines.
2.2. TB Treatment. The drug regimen consisted of a fixedweight-dependent combination of INH (320–400 mg/day),rifampicin (480–600 mg/day), ethambutol (800–1200 mg/day), and pyrazinamide (1000–1250 mg/day) for the two-month intensive phase, followed by rifampicin and INH forthe four-month continuation phase.
2.3. Routine Examination. Patient’s complaint was con-ducted prior to the clinical and laboratory examination, bodymass index, monocyte count, and Erythrocyte Sedimenta-tion Rate (ESR). All were measured according to the standardprocedure conducted in Indonesian Hospital [5].
2.4. ChestX-Ray Grading of Disease. Standard postero-an-terior and lateral chest radiographs were taken prior totherapy and were read by a pulmonologist. The gradingincluded the following categories: (i) minimal lesion, thatis, lesion width is less than area restricted to median line,apex and front costae, solitaire lesion can be everywhere,and there is no cavity found, (ii) moderate advanced, thatis, width of cavity is less than one lobe, and if there is cavity,should be more than one lobe. (iii) far advance is width oflesion that more than minimal and moderate lesion, if withcavity, should not be more than 4 cm.
2.5. Sampling Handling. Study materials were 3 mL bloodspecimens obtained from new patients through aspirationusing injective needle before they started on antituberculosisdiagnosis at two, four, and six months after the initiation
of anti-TB drugs treatment based on WHO guideline(2HRHZE/4H3R3) [5, 6]. Serum was separated by centrifu-gation (6000 x g) at 4◦C for 7 min and aliquots of 500 mLstored at −80◦C.
2.6. Enzyme-Linked Immunoassaysorbant Assays. SerumsuPAR measurement was done in duplicate using com-mercially available ELISA kits according to the manufacture’sprotocol (suPARnostic, ViroGates A/S, Copenhagen, Den-mark) [7]. Plate reading was conducted using a Biotechmicro plate reader set to 450 nm, with the wavelengthcorrection set to 650 nm. Concentrations of the respectiveanalyses were determined using SPSS version 3.4 software.
2.7. Statistical Analysis. All statistical analysis on suPAR wascarried out using SPSS software version and the statisticalprogramming language. Analyzed statistically, using longitu-dinal model analysis, bivariate analysis, multivariate analysisand linear regression, these analysis were carried out with theSAS 9.13 (SAS Institute, Cary, NC, USA) and SPSS 16 (SPSSInc, Chicago, IL) program.
The difference between the patients and the controls wasanalyzed using one-way ANOVA. The association betweenthe immune parameters and the extent of disease wasassessed using the Mann Whitney U-test. A P-value ofP ≤ .05 was judged significant.
2.8. Ethics. Written consent was obtained from all partici-pants. The study was approved by the Ethics Committees,Saiful Anwar Public Hospital, Brawijaya University.
3. Results
Twenty patients with active pulmonary TB were observedduring the six-month treatment. Characteristics of thetwenty patients are presented in Table 1.
The number of female pulmonary TB patients whofulfilled the inclusion and exclusion criteria were (50%)equal to the number of male patients (50%). Distributionbased on age in this study showed that TB patients weremainly dominated by those aged between 19–30 years.
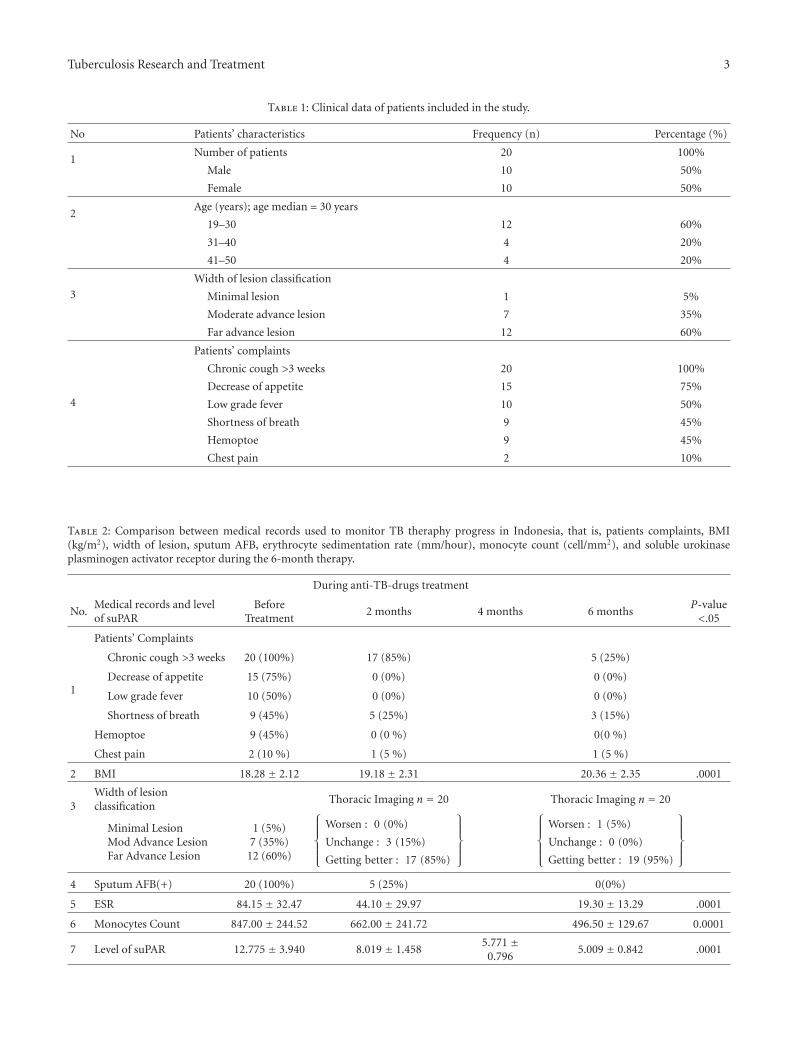
Measurement of suPAR concentration indicated thatthere was a high level of suPAR in infected patients beforetreatment (median 12.775 ng/mL), but suPAR levels droppedsignificantly (P = .0001 < .05) after two months (median8.019 ng/mL) and four months (median 5.771 ng/mL) oftherapy. However, at the sixth month of treatment, there wasonly slightly decrease although significant reached (median5.009 ng/mL) (Figure 1(a)). These were almost similar to thehealthy control group (median 4.772 ng/mL).
With regard to clinical symptoms (Table 2), chroniccough is the most common complaint, however, decreasingof appetite, low grade fever, shortness of breath, haemoptoe,and chest pain were also found. After the second and thesixth month of treatment, some patients still complainedabout coughing, shortness of breath, and chest pain. Con-cerning sputum conversion, before treatment, all patients(n = 20) had sputum-AFB(+) but after the two-month
Tuberculosis Research and Treatment 3
Table 1: Clinical data of patients included in the study.
No Patients’ characteristics Frequency (n) Percentage (%)
1Number of patients 20 100%
Male 10 50%
Female 10 50%
2Age (years); age median = 30 years
19–30 12 60%
31–40 4 20%
41–50 4 20%
3
Width of lesion classification
Minimal lesion 1 5%
Moderate advance lesion 7 35%
Far advance lesion 12 60%
4
Patients’ complaints
Chronic cough >3 weeks 20 100%
Decrease of appetite 15 75%
Low grade fever 10 50%
Shortness of breath 9 45%
Hemoptoe 9 45%
Chest pain 2 10%
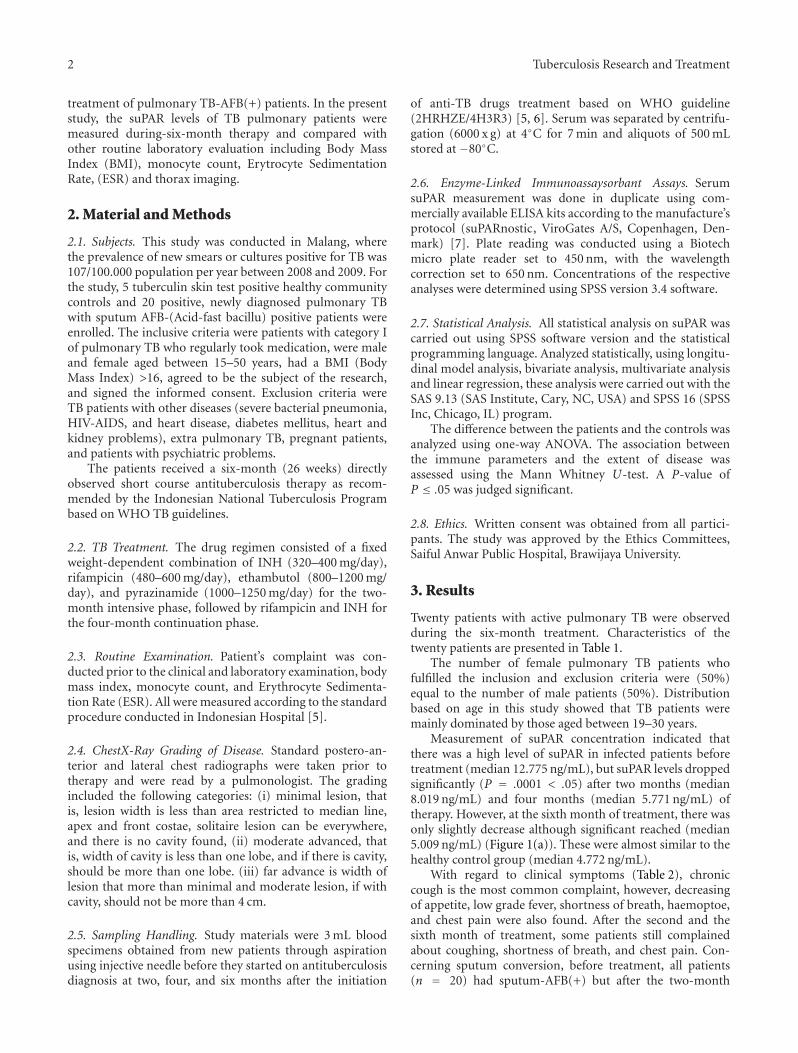
Table 2: Comparison between medical records used to monitor TB theraphy progress in Indonesia, that is, patients complaints, BMI(kg/m2), width of lesion, sputum AFB, erythrocyte sedimentation rate (mm/hour), monocyte count (cell/mm2), and soluble urokinaseplasminogen activator receptor during the 6-month therapy.
During anti-TB-drugs treatment
No.Medical records and levelof suPAR
BeforeTreatment
2 months 4 months 6 monthsP-value<.05
1
Patients’ Complaints
Chronic cough >3 weeks 20 (100%) 17 (85%) 5 (25%)
Decrease of appetite 15 (75%) 0 (0%) 0 (0%)
Low grade fever 10 (50%) 0 (0%) 0 (0%)
Shortness of breath 9 (45%) 5 (25%) 3 (15%)
Hemoptoe 9 (45%) 0 (0 %) 0(0 %)
Chest pain 2 (10 %) 1 (5 %) 1 (5 %)
2 BMI 18.28 ± 2.12 19.18 ± 2.31 20.36 ± 2.35 .0001
3Width of lesionclassification
Thoracic Imaging n = 20 Thoracic Imaging n = 20
Minimal LesionMod Advance LesionFar Advance Lesion
1 (5%)7 (35%)
12 (60%)
⎧⎪⎪⎪⎨
⎪⎪⎪⎩
Worsen : 0 (0%)
Unchange : 3 (15%)
Getting better : 17 (85%)
⎫⎪⎪⎪⎬
⎪⎪⎪⎭
⎧⎪⎪⎪⎨
⎪⎪⎪⎩
Worsen : 1 (5%)
Unchange : 0 (0%)
Getting better : 19 (95%)
⎫⎪⎪⎪⎬
⎪⎪⎪⎭
4 Sputum AFB(+) 20 (100%) 5 (25%) 0(0%)
5 ESR 84.15 ± 32.47 44.10 ± 29.97 19.30 ± 13.29 .0001
6 Monocytes Count 847.00 ± 244.52 662.00 ± 241.72 496.50 ± 129.67 0.0001
7 Level of suPAR 12.775 ± 3.940 8.019 ± 1.4585.771 ±
0.7965.009 ± 0.842 .0001
4 Tuberculosis Research and Treatment
Profile of suPAR level during treatment
y = −1.277x + 11.725
R2 = 0.890
0
5
10
15
20
25
30
0 2 4 6
During treatment (months)
suPA
Rle
vel(
ng/
mL
)
P-value .0001<.05
(a)
Profile of ESR during treatment
y = −10.15x + 76.25R2 = 0.9
0
20
40
60
80
100
120
140
0 2 4 6
During treatment (months)
ESR
(mm
/hou
r)
P-value .0001<.05
(b)
Profile of monocyte count during treatment
y = −55.98x + 817.79
R2 = 0.95
0
200
400
600
800
1000
1200
1400
1600
0 2 4 6
Mon
ocyt
eco
un
t(c
ell/
mm
3)
P-value .0001<.05
During treatment (months)
(c)
Profile of BMI during treatment
y = 0.34x + 18.37
R2 = 0.99
0
5
10
15
20
25
30
0 2 4 6
During treatment (months)
BM
I(k
g/m
2)
P-value .0001<.05
(d)
Figure 1: (a) Serum levels of soluble urokinase receptor (suPAR), (b) sedimentation rate of erythrocytes (ESR), (c) monocyte count (d)Body Mass Index (BMI) in 20 TB patient before (0), during (2 and 4 months), and after (6 months) completion of anti-TB treatment.Individual profile (dotted line) and median (thick line) levels are shown.
treatment, fifteen patients turned to be AFB(−), and bythe end of the six-month treatment, all patients showedsputum conversion. During observation, most patients (19)showed high level ESR, and it decreased significantly (P-value .0001 < .05) from time to time during the six-monthtreatment. ESR usually increased in active processes, butnormal ESR did not eliminate the diagnosis of TB [5]. Inthis papaer, the highest median of ESR before treatmentwas 84.2 mm/hour, and then it dropped to 44.1 mm/hourafter-two-month treatment. The lowest of the ESR levelwas reached after six-month treatment (19.3 mm/hour).(Figure 1(b)) A significant correlation between suPAR andESR was found (P-value .0001 < .05), with a quite strongcorrelation coefficient (r = 0.577).
The same trend was found on monocytes count. Beforetreatment, monocytes count showed the highest concen-tration (median 847 cell/mm3) However, it dropped signif-icantly (P = .0001 < .05) after two (median 662 cell/mm3)and-six-month treatment (median 497 cell/mm3) (Figure1(c)). The decreasing suPAR level correlated significantly(r = 0.536) with the decreasing of monocytes count (P-value .000 < .05). We observed light monocytosis beforetreatment, which went down in count during the treatmentperiod. In the normal condition, monocytes count in bloodwas in the range of 0.3–0.8× 10³ cell/mm3.
In contrast, BMI of the TB patients rose gradually but sig-nificant (P = .012) after two (median 19.18 kg/m2) and thesix-month of treatment. By the end of therapy, all patients’
weight reached the highest BMI mean (median 20.36 kg/m2).(Figure 1(d)). There was a significant correlation (P-value.012 < .05) albeit weak (r = −0.281) between the decreasein suPAR with the increasing of BMI.
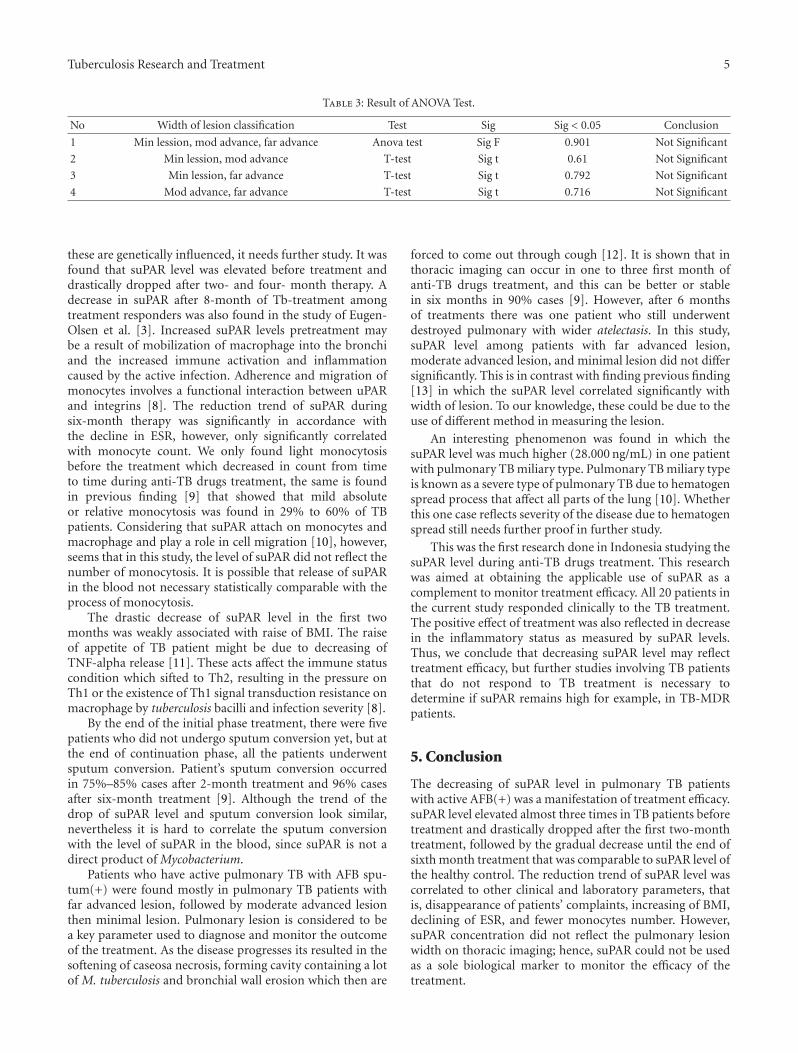
Finally, thoracic imaging of the patients who werediagnosed to have active pulmonary TB showed far advancedlesions (n = 12), moderate advanced lesions (n = 7), andminimal lesions (n = 1). However, there was no significantcorrelation between suPAR level with the width of lesionson thoracic imaging of the TB patients before and aftertreatment (Table 3).
4. Discussion
TB has remained in the third rank of infectious disease inIndonesia for years. Lack of accurate method in monitoringprogress in TB therapy could be one of the causes of thisproblem. The present study aimed to investigate the possibleuse of suPAR as a biomarker in pulmonary TB-AFB(+)patients, hence allow stratification of treatment regimenswith possibly shortening of treatment in a majority ofpatients that may not require a six-month treatment periodand intensified regimens in those with an increased risk forpoor response and relapse.
It is surprising to see in general that the range of suPARlevel in patients with active pulmonary TB (8.539 ng/mL–28.000 ng/mL) was rather different from African peoplewhich ranged between 0.9 ng/mL to 45 ng/mL [2]. Whether
Tuberculosis Research and Treatment 5
Table 3: Result of ANOVA Test.
No Width of lesion classification Test Sig Sig < 0.05 Conclusion
1 Min lession, mod advance, far advance Anova test Sig F 0.901 Not Significant
2 Min lession, mod advance T-test Sig t 0.61 Not Significant
3 Min lession, far advance T-test Sig t 0.792 Not Significant
4 Mod advance, far advance T-test Sig t 0.716 Not Significant
these are genetically influenced, it needs further study. It wasfound that suPAR level was elevated before treatment anddrastically dropped after two- and four- month therapy. Adecrease in suPAR after 8-month of Tb-treatment amongtreatment responders was also found in the study of Eugen-Olsen et al. [3]. Increased suPAR levels pretreatment maybe a result of mobilization of macrophage into the bronchiand the increased immune activation and inflammationcaused by the active infection. Adherence and migration ofmonocytes involves a functional interaction between uPARand integrins [8]. The reduction trend of suPAR duringsix-month therapy was significantly in accordance withthe decline in ESR, however, only significantly correlatedwith monocyte count. We only found light monocytosisbefore the treatment which decreased in count from timeto time during anti-TB drugs treatment, the same is foundin previous finding [9] that showed that mild absoluteor relative monocytosis was found in 29% to 60% of TBpatients. Considering that suPAR attach on monocytes andmacrophage and play a role in cell migration [10], however,seems that in this study, the level of suPAR did not reflect thenumber of monocytosis. It is possible that release of suPARin the blood not necessary statistically comparable with theprocess of monocytosis.
The drastic decrease of suPAR level in the first twomonths was weakly associated with raise of BMI. The raiseof appetite of TB patient might be due to decreasing ofTNF-alpha release [11]. These acts affect the immune statuscondition which sifted to Th2, resulting in the pressure onTh1 or the existence of Th1 signal transduction resistance onmacrophage by tuberculosis bacilli and infection severity [8].
By the end of the initial phase treatment, there were fivepatients who did not undergo sputum conversion yet, but atthe end of continuation phase, all the patients underwentsputum conversion. Patient’s sputum conversion occurredin 75%–85% cases after 2-month treatment and 96% casesafter six-month treatment [9]. Although the trend of thedrop of suPAR level and sputum conversion look similar,nevertheless it is hard to correlate the sputum conversionwith the level of suPAR in the blood, since suPAR is not adirect product of Mycobacterium.
Patients who have active pulmonary TB with AFB spu-tum(+) were found mostly in pulmonary TB patients withfar advanced lesion, followed by moderate advanced lesionthen minimal lesion. Pulmonary lesion is considered to bea key parameter used to diagnose and monitor the outcomeof the treatment. As the disease progresses its resulted in thesoftening of caseosa necrosis, forming cavity containing a lotof M. tuberculosis and bronchial wall erosion which then are
forced to come out through cough [12]. It is shown that inthoracic imaging can occur in one to three first month ofanti-TB drugs treatment, and this can be better or stablein six months in 90% cases [9]. However, after 6 monthsof treatments there was one patient who still underwentdestroyed pulmonary with wider atelectasis. In this study,suPAR level among patients with far advanced lesion,moderate advanced lesion, and minimal lesion did not differsignificantly. This is in contrast with finding previous finding[13] in which the suPAR level correlated significantly withwidth of lesion. To our knowledge, these could be due to theuse of different method in measuring the lesion.
An interesting phenomenon was found in which thesuPAR level was much higher (28.000 ng/mL) in one patientwith pulmonary TB miliary type. Pulmonary TB miliary typeis known as a severe type of pulmonary TB due to hematogenspread process that affect all parts of the lung [10]. Whetherthis one case reflects severity of the disease due to hematogenspread still needs further proof in further study.
This was the first research done in Indonesia studying thesuPAR level during anti-TB drugs treatment. This researchwas aimed at obtaining the applicable use of suPAR as acomplement to monitor treatment efficacy. All 20 patients inthe current study responded clinically to the TB treatment.The positive effect of treatment was also reflected in decreasein the inflammatory status as measured by suPAR levels.Thus, we conclude that decreasing suPAR level may reflecttreatment efficacy, but further studies involving TB patientsthat do not respond to TB treatment is necessary todetermine if suPAR remains high for example, in TB-MDRpatients.
5. Conclusion
The decreasing of suPAR level in pulmonary TB patientswith active AFB(+) was a manifestation of treatment efficacy.suPAR level elevated almost three times in TB patients beforetreatment and drastically dropped after the first two-monthtreatment, followed by the gradual decrease until the end ofsixth month treatment that was comparable to suPAR level ofthe healthy control. The reduction trend of suPAR level wascorrelated to other clinical and laboratory parameters, thatis, disappearance of patients’ complaints, increasing of BMI,declining of ESR, and fewer monocytes number. However,suPAR concentration did not reflect the pulmonary lesionwidth on thoracic imaging; hence, suPAR could not be usedas a sole biological marker to monitor the efficacy of thetreatment.
6 Tuberculosis Research and Treatment
Acknowledgments
This study was supported by Faculty of Medicine, BrawijayaUniversity. The authors thank to suPARnostic, ViroGatesA/S, Copenhagen, Denmark for giving special price for thekit. Special thanks for Dr. Jesper Eugene-Olsen, Danemarkfor editing the paper.
References
[1] M. Jo, K. S. Thomas, L. Wu, and S. L. Gonias, “SolubleUrokinase-type plasminogen activator receptor inhibits can-cer cell growth and invasion by direct Urokinase-independenteffects on cell signaling,” The Journal of Biological Chemistry,vol. 278, no. 47, pp. 46692–46698, 2003.
[2] P. Rabna, A. Andersen, C. Wejse et al., “High mortality riskamong individuals assumed to be TB-negative can be pre-dicted using a simple test,” Tropical Medicine and InternationalHealth, vol. 14, no. 9, pp. 986–994, 2009.
[3] J. Eugen-Olsen, P. Gustafson, N. Sidenius et al., “The serumlevel of soluble urokinase receptor is elevated in tuberculosispatients and predicts mortality during treatment: a com-munity study from Guinea-Bissau,” International Journal ofTuberculosis and Lung Disease, vol. 6, no. 8, pp. 686–692, 2002.
[4] J. F. D. Siawaya, M. Ruhwald, J. Eugen-Olsen, and G. Walzl,“Correlates for disease progression and prognosis during con-current HIV/TB infection,” International Journal of InfectiousDiseases, vol. 11, no. 4, pp. 289–299, 2007.
[5] PDPI. Perhimpunan Dokter Paru Indonesia, Tuberkulosis :Pedoman Diagnosis dan Penatalaksanaan di Indonesia, IndahOffset Citra Grafika, Jakarta, Indonesia, 2006.
[6] WHO, TB/HIV A Clinical Manual. Stop TB Dept. Dept ofHIV/AIDS. Dept Child and Adolescent Health and Develop-ment, World Health Organization, Geneva, Switzerland, 2004.
[7] ViroGates. suPARnostic ELISA Kit: Enzyme-linkedimmunosorbent assay for quantitative determination ofsoluble urokinase plasminogen activator receptor in humanplasma. Copenhagen, Denmark, 2007.
[8] P. F. Barnes and B. Wizel, “Type 1 cytokines and thepathogenesis of tuberculosis,” American Journal of Respiratoryand Critical Care Medicine, vol. 161, no. 6, pp. 1773–1774,2000.
[9] W. N. Rom and S. M. Garay, Tuberculosis, Lippincott Williams& Wilkins, Philadelphia, Pa, USA, 2nd edition, 2004.
[10] O. G. Wilhelm, S. Wilhelm, G. M. Escott et al., “Cellularglycosylphosphatidylinositol-specific phospholipase D regu-lates urokinase receptor shedding and cell surface expression,”Journal of Cellular Physiology, vol. 180, no. 2, pp. 225–235,1999.
[11] R. van Crevel, T. H. M. Ottenhoff, and J. W. M. van der Meer,“Innate immunity to Mycobacterium tuberculosis,” ClinicalMicrobiology Reviews, vol. 15, no. 2, pp. 294–309, 2002.
[12] H. Alsagaff and A. dan Mukty, Dasar-Dasar Ilmu PenyakitParu, Airlangga University Press, Surabaya, Indonesia , 2002.
[13] J. F. D. Siawaya, N. B. Bapela, K. Ronacher et al., “Immuneparameters as markers of tuberculosis extent of disease andearly prediction of anti-tuberculosis chemotherapy response,”Journal of Infection, vol. 56, no. 5, pp. 340–347, 2008.

Submit your manuscripts athttp://www.hindawi.com
Stem CellsInternational
Hindawi Publishing Corporationhttp://www.hindawi.com Volume 2014
Hindawi Publishing Corporationhttp://www.hindawi.com Volume 2014
MEDIATORSINFLAMMATION
of
Hindawi Publishing Corporationhttp://www.hindawi.com Volume 2014
Behavioural Neurology
EndocrinologyInternational Journal of
Hindawi Publishing Corporationhttp://www.hindawi.com Volume 2014
Hindawi Publishing Corporationhttp://www.hindawi.com Volume 2014
Disease Markers
Hindawi Publishing Corporationhttp://www.hindawi.com Volume 2014
BioMed Research International
OncologyJournal of
Hindawi Publishing Corporationhttp://www.hindawi.com Volume 2014
Hindawi Publishing Corporationhttp://www.hindawi.com Volume 2014
Oxidative Medicine and Cellular Longevity
Hindawi Publishing Corporationhttp://www.hindawi.com Volume 2014
PPAR Research
The Scientific World JournalHindawi Publishing Corporation http://www.hindawi.com Volume 2014
Immunology ResearchHindawi Publishing Corporationhttp://www.hindawi.com Volume 2014
Journal of
ObesityJournal of
Hindawi Publishing Corporationhttp://www.hindawi.com Volume 2014
Hindawi Publishing Corporationhttp://www.hindawi.com Volume 2014
Computational and Mathematical Methods in Medicine
OphthalmologyJournal of
Hindawi Publishing Corporationhttp://www.hindawi.com Volume 2014
Diabetes ResearchJournal of
Hindawi Publishing Corporationhttp://www.hindawi.com Volume 2014
Hindawi Publishing Corporationhttp://www.hindawi.com Volume 2014
Research and TreatmentAIDS
Hindawi Publishing Corporationhttp://www.hindawi.com Volume 2014
Gastroenterology Research and Practice
Hindawi Publishing Corporationhttp://www.hindawi.com Volume 2014
Parkinson’s Disease
Evidence-Based Complementary and Alternative Medicine
Volume 2014Hindawi Publishing Corporationhttp://www.hindawi.com


![Tissue-Type Plasminogen Activator-Mediated Activation of ... · TISSUE PLASMINOGEN ACTIVATOR IN STREPTOCOCCAL BINDING 197 sodium phosphate, 0.14 Msodium chloride [pH 7.4]) con- taining0.02%(wt/vol)](https://img.pdfslide.us/doc/110x75/5f46a6d9df5f79688c496b2a/tissue-type-plasminogen-activator-mediated-activation-of-tissue-plasminogen.jpg)