Embed Size (px)
Citation preview

The
Solar Terrestrial Activity Reportwww.solen.info/solar/

History
• ~1995 – monthly report (paper)• 1997 – daily reports (Internet)• 2002 – detailed sunspot analysis• 2002 – archive of daily reports• 2002 – Coronal hole numbering and archive• 2010 – Switch from SOHO to SDO as image source• 2010 – Sunspot number using 2K SDO continuum
images• 2011 – Sunspot analysis using polarity overlays• 2012 – Added 1K SDO sunspot number. Sunspot image
documentation at 1, 2 and 4K resolution
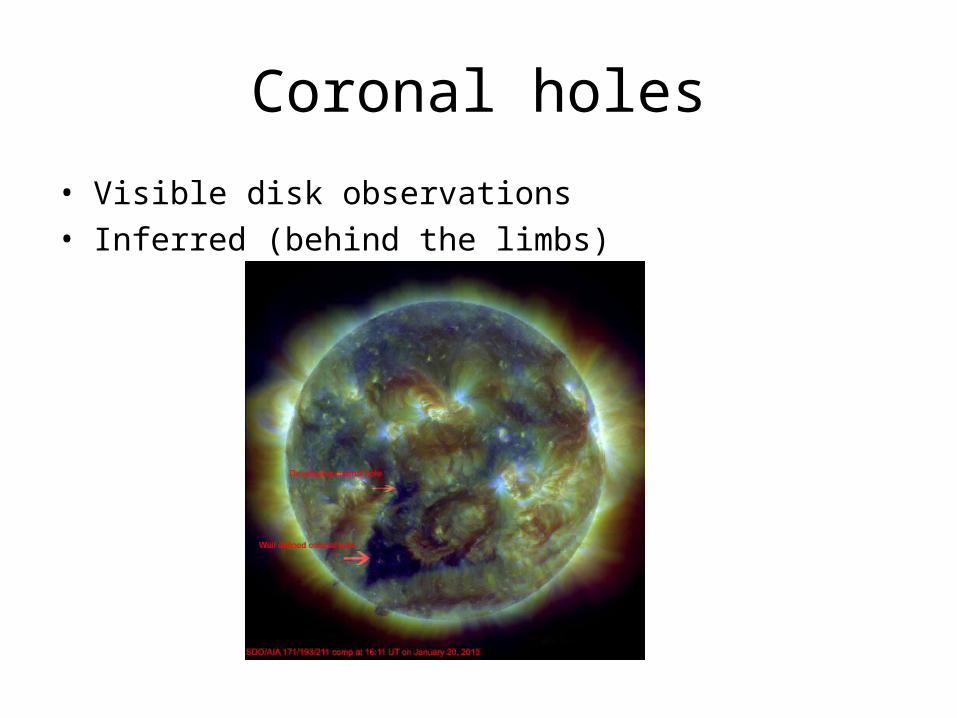
Coronal holes
• Visible disk observations• Inferred (behind the limbs)

Sunspots – image creation
• Using magnetic overlays greatly aids spot analysis – both at the overview and detailed level
The transformation from 2 images to the magnetic overlay image only requires a few steps. Easily done in Gimp or Photoshop
+ =

Sunspots – magnetic deltas
• Quickly detect magnetic delta structures
AR 11515 developed many magnetic delta structures in early July 2012
AR 11515 produced 1 X and 6 M class flares on July 6
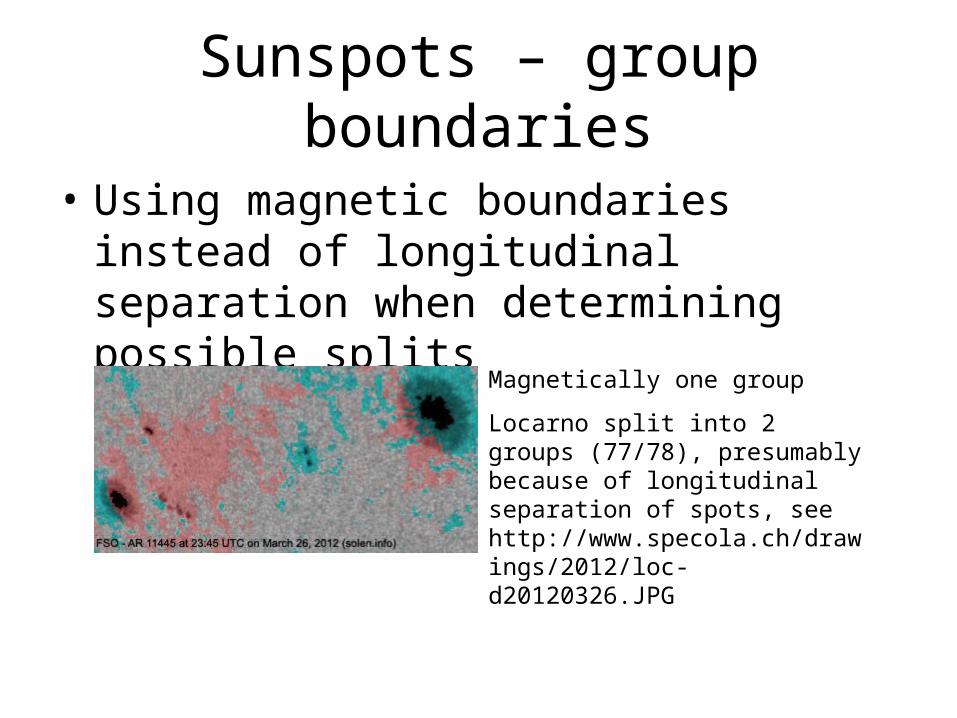
Sunspots – group boundaries
• Using magnetic boundaries instead of longitudinal separation when determining possible splits
Magnetically one group
Locarno split into 2 groups (77/78), presumably because of longitudinal separation of spots, see http://www.specola.ch/drawings/2012/loc-d20120326.JPG

Sunspots – early detection• Early detection improves quality of related
solar data
NOAA recorded a C5.8 flare at 17:07 UTC on January 18 and attributed it to AR 11654.
SDO/EVE SAM confirms that the flare occurred in AR S2181 (now 11660)

Sunspots – high latitude obs.AR S2052, location: N42E30
Easily observed in 1K resolution on Nov.14, 2012
AR S1968, location: N51E04
Poorly defined spot, observed in 2K on October 8, 2012
AR S1578, location: S41E22
Several spots in 2K, one in 1K resolution. Observed on April 10, 2012

Solar cycle charts
Comparison with similar cycles
Cycle 24 progress, current statusSmoothed max in Feb.’12: 66.9NH smoothed max in Sept.’11: 41.3SH smoothed max in April ’12: 30.1
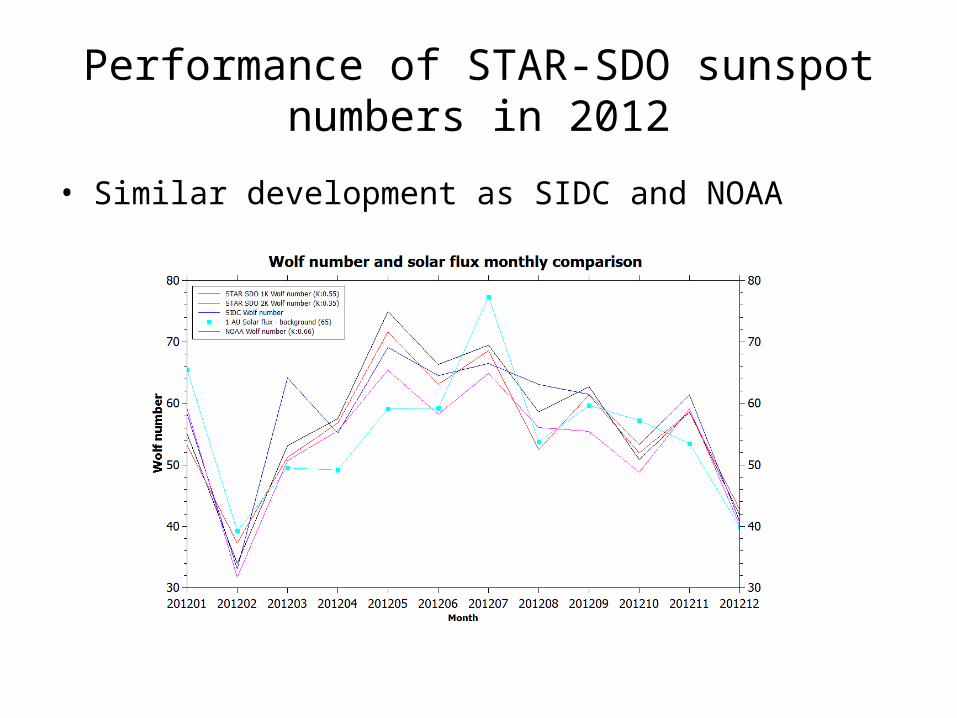
Performance of STAR-SDO sunspot numbers in 2012
• Similar development as SIDC and NOAA

Monthly K factors in 2012
• Peak in March for STAR-SDO and NOAA