Embed Size (px)
Citation preview
NRIAG Journal of Astronomy and Geophysics (2016) xxx, xxx–xxx
National Research Institute of Astronomy and Geophysics
NRIAG Journal of Astronomy and Geophysics
www.elsevier.com/locate/nrjag
The solar activity by wavelet-based multifractal
analysis
E-mail address: [email protected]
Peer review under responsibility of National Research Institute of
Astronomy and Geophysics.
Production and hosting by Elsevier
http://dx.doi.org/10.1016/j.nrjag.2016.10.0032090-9977 � 2016 Production and hosting by Elsevier B.V. on behalf of National Research Institute of Astronomy and Geophysics.This is an open access article under the CC BY-NC-ND license (http://creativecommons.org/licenses/by-nc-nd/4.0/).
Please cite this article in press as: Maruyama, F. The solar activity by wavelet-based multifractal analysis. NRIAG Journal of Astronomy and Geophysicshttp://dx.doi.org/10.1016/j.nrjag.2016.10.003
Fumio Maruyama
Matsumoto Agatagaoka High School, Agata, Matsumoto 390-8543, Japan
Received 5 August 2016; revised 8 October 2016; accepted 12 October 2016
KEYWORDS
The sunspot number;
Solar flux;
Total ozone;
Wavelet;
Multifractal
Abstract The interest in the relation between the solar activity and climate change is increasing. As
for the solar activity, a fractal property of the sunspot series was studied by many works. In general,
a fractal property was observed in the time series of dynamics of complex systems. The purposes of
this study were to investigate the relationship between the sunspot number, solar radio flux at
10.7 cm (F10.7 cm) and total ozone from a view of multifractality. To detect the changes of multi-
fractality, we examined the multifractal analysis on the time series of the solar activity and total
ozone indices. The changes of fractality of the sunspot number and F10.7 cm are very similar. When
the sunspot number becomes maximum, the fractality of the F10.7 cm changes from multifractality
to monofractality. The changes of fractality of the F10.7 cm and the total ozone are very similar.
When the sunspot number becomes maximum, the fractality of the total ozone changes from mul-
tifractality to monofractality. A change of fractality of the F10.7 cm and total ozone was observed
when the solar activity became maximum. The influence of the solar activity on the total ozone was
shown by the wavelet coherence, phase and the similarity of the change of fractality. These findings
will contribute to the research of the relationship between the solar activity and climate.� 2016 Production and hosting by Elsevier B.V. on behalf of National Research Institute of Astronomy
and Geophysics. This is an open access article under the CC BY-NC-ND license (http://creativecommons.
org/licenses/by-nc-nd/4.0/).
1. Introduction
The influence of solar activity on climate has been a matter ofdebate for a long time.
Recent measurements from space indicate that the totalsolar irradiance changes associated with the 11-year solar sun-
spots cycle are negligibly small (0.1%), although larger (4–8%)variations are found in the ultraviolet (UV) range of 200–250 nm (Lean et al., 1997). Even if we do not expect direct
solar cycle impacts at Earth’s surface, a significant influenceshould be detected in the stratopause region (Kodera andKuroda, 2002).
A decadal variation of tropical lower stratospheric ozoneand temperature has previously been identified that correlatespositively with the 11 year solar activity cycle. However, the ElNino-Southern Oscillation (ENSO) also influences lower
stratospheric ozone and temperature (Hood et al., 2010).
(2016),

Figure 1 Multifractal spectrum s(q) for individual SSN between
2 F. Maruyama
Various objects in nature show the so-called self-similarityor fractal property. Monofractal shows an approximately sim-ilar pattern at different scales and is characterized by a fractal
dimension. Multifractal is a non-uniform, more complex frac-tal and is decomposed into many subsets characterized by dif-ferent fractal dimensions. Fractal property can be observed in
the time series representing dynamics of complex systems aswell. A change of fractality accompanies a phase transitionand changes of state. The multifractal properties of daily rain-
fall were investigated in two contrasting climates: an EastAsian monsoon climate with extreme rainfall variability anda temperate climate with moderate rainfall variability(Svensson et al., 1996). In both the climates, the frontal rainfall
shows monofractality and the convective-type rainfall showsmultifractality.
Hence, climate change can be interpreted from the perspec-
tive of fractals. A change of fractality may be observed whenthe climate changes. We attempt to explain changes in climate,referred to as regime shifts, by analyzing fractality. We use the
wavelet transform to analyze the multifractal behavior of theclimate index. Wavelet methods are useful for the analysis ofcomplex non-stationary time series. The wavelet transform
allows reliable multifractal analysis to be performed (Muzyet al., 1991).
In our previous paper (Maruyama et al., 2015), in terms ofthe multifractal analysis, we conclude that a climatic regime
shift corresponds to a change from multifractality tomonofractality of the Pacific Decadal Oscillation (PDO) index.
We examined the relationships between the solar activity
and total ozone in this study. To detect the changes of multi-fractality, we examine the multifractal analysis on the sunspotnumber (SSN), solar radio flux at 10.7 cm (F10.7 cm), and
total ozone using the wavelet transform. Moreover we exam-ined the wavelet coherence and phase of those indices.
2. Data and method of analysis
The sunspot number (SSN) provided by Solar Influences DataAnalysis Center (sidc.oma.be), the solar radio flux at 10.7 cm
provided by NOAA’s space weather prediction center (www.swpc.noaa.gov), and the total ozone provided by NASA(nasasearch.nasa.gov) were used. The F10.7 cm is an excellentindicator of the solar activity.
We used the Daubechies wavelet as the analyzing waveletbecause it is widely used in solving a broad range of problems,e.g., self-similarity properties of a signal or fractal problems
and signal discontinuities. The data used were a discrete signalthat fitted the Daubechies Mother wavelet with the capabilityof precise inverse transformation. Hence, precisely optimal
value of s(q) could be calculated as explained below. We thenestimated the scaling of the partition function Zq(a), which isdefined as the sum of the q-th powers of the modulus of thewavelet transform coefficients at scale a. In our study, the
wavelet-transform coefficients did not become zero, and there-fore, for a precise calculation, the summation was consideredfor the entire set. Muzy et al. (1991) defined Zq(a) as the
sum of the q-th powers of the local maxima of the modulusto avoid division by zero. We obtained the partition functionZq(a) as follows:
ZqðaÞ ¼X
jWu½f�ða; bÞjq; ð1Þ
Please cite this article in press as: Maruyama, F. The solar activity by wavelet-basehttp://dx.doi.org/10.1016/j.nrjag.2016.10.003
where Wu[f](a, b) is the wavelet coefficient of the function f, a
is a scale parameter and b is a space parameter. The time win-dow was set to six years for the following outlined reasons. Wecalculated the wavelets using a time window of various peri-
ods, 10, 6 and 4 years. For a time window of 10 years, a slowchange of fractality was observed. The overlap of the first andsubsequent data was 9 years, which is longer than the 3 yearsin the case of the 4-year calculation and thus the change of
fractality was small. Thus, this case was inappropriate to finda rapid change of regime shift. For four years, a fast change offractality was observed. The overlap of the first and subse-
quent data was 3 years, which is shorter than the 9 years inthe case of the 10-year calculation and thus the change of frac-tality was large. For six years, a moderate change of fractality
was observed and hence the time window was set to this per-iod. For small scales, we expect
ZqðaÞ � asðqÞ: ð2ÞFirst, we investigate the changes of Zq(a) in time series at a
different scale a for each q. A plot of the logarithm of Zq(a)against the logarithm of timescale a was created. Here s(q) isthe slope of the linear fitted line on the log–log plot for each
q. Next, we plot s(q) vs q. The time window was then shiftedforward one year and the process repeated. We definemonofractal and multifractal as follows: if s(q) is linear with
respect to q, then the time series is said to be monofractaland if s(q) is convex upwards with respect to q, then the timeseries is classified as multifractal (Frish and Parisi, 1985). We
define that the value of R2 is the coefficient of determination,for fitting straight line; if R2 P 0.98 the time series ismonofractal and if 0.98 > R2 that is multifractal.
We calculated the multifractal spectrum s(q) of different
moments q for individual records for the SSN index. InFig. 1, the multifractal spectrum s(q) for individual SSNbetween 1967 and 1979 is shown. The data were analyzed in
6 year sets, for example, the multifractal spectrum s(q) of s67
1967 and 1979.
d multifractal analysis. NRIAG Journal of Astronomy and Geophysics (2016),
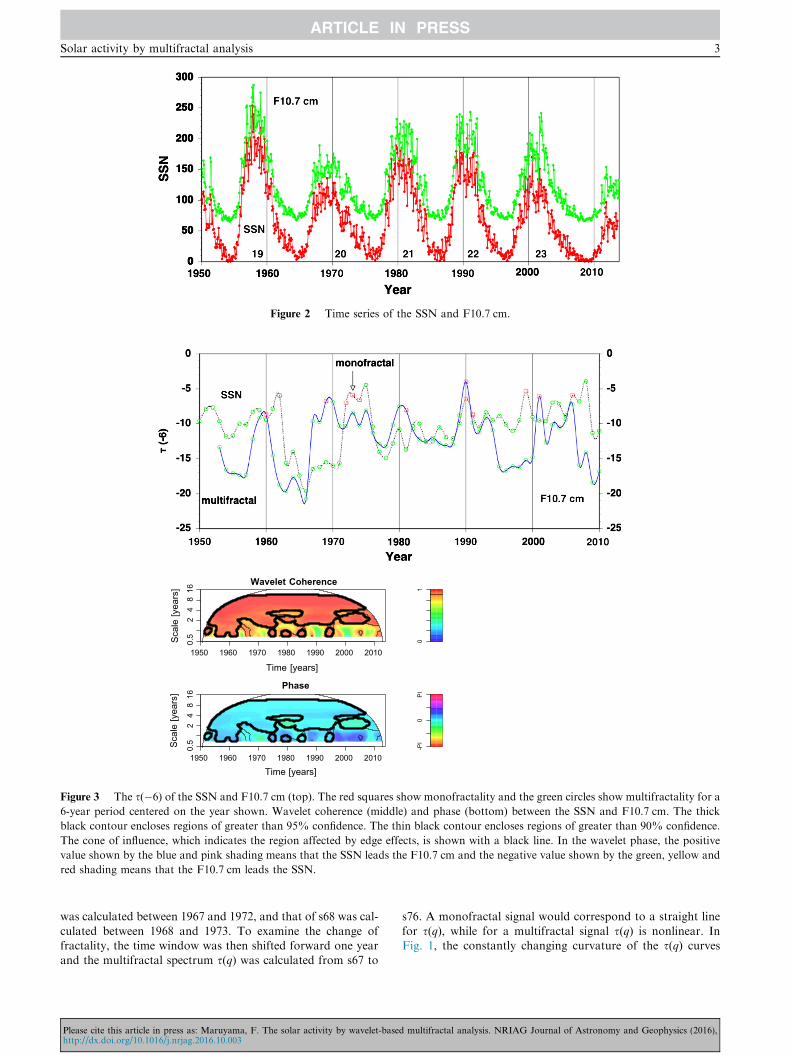
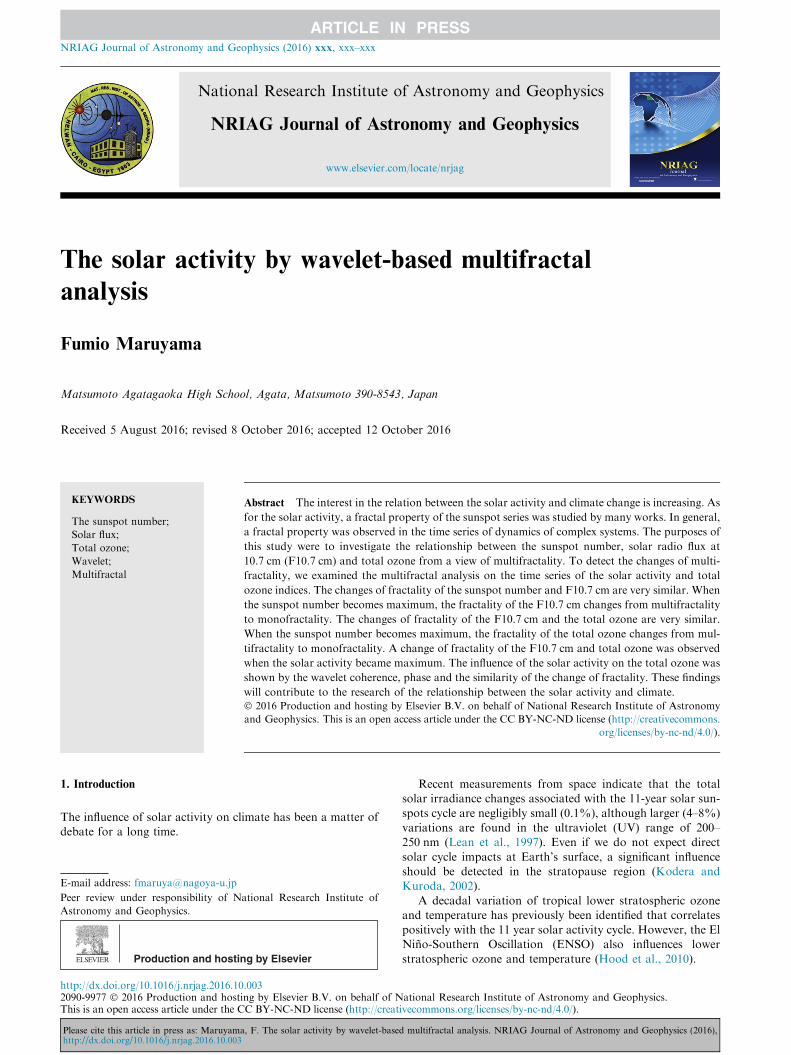
Figure 2 Time series of the SSN and F10.7 cm.
Time [years]
Scale[years]
Scale[years]
1950 1960 1970 1980 1990 2000 2010
0.5
24816
0.5
24816
Wavelet Coherence
01
Time [years]1950 1960 1970 1980 1990 2000 2010
Phase
-PI
0PI
Figure 3 The s(�6) of the SSN and F10.7 cm (top). The red squares show monofractality and the green circles show multifractality for a
6-year period centered on the year shown. Wavelet coherence (middle) and phase (bottom) between the SSN and F10.7 cm. The thick
black contour encloses regions of greater than 95% confidence. The thin black contour encloses regions of greater than 90% confidence.
The cone of influence, which indicates the region affected by edge effects, is shown with a black line. In the wavelet phase, the positive
value shown by the blue and pink shading means that the SSN leads the F10.7 cm and the negative value shown by the green, yellow and
red shading means that the F10.7 cm leads the SSN.
Solar activity by multifractal analysis 3
was calculated between 1967 and 1972, and that of s68 was cal-
culated between 1968 and 1973. To examine the change offractality, the time window was then shifted forward one yearand the multifractal spectrum s(q) was calculated from s67 to
Please cite this article in press as: Maruyama, F. The solar activity by wavelet-basedhttp://dx.doi.org/10.1016/j.nrjag.2016.10.003
s76. A monofractal signal would correspond to a straight line
for s(q), while for a multifractal signal s(q) is nonlinear. InFig. 1, the constantly changing curvature of the s(q) curves
multifractal analysis. NRIAG Journal of Astronomy and Geophysics (2016),

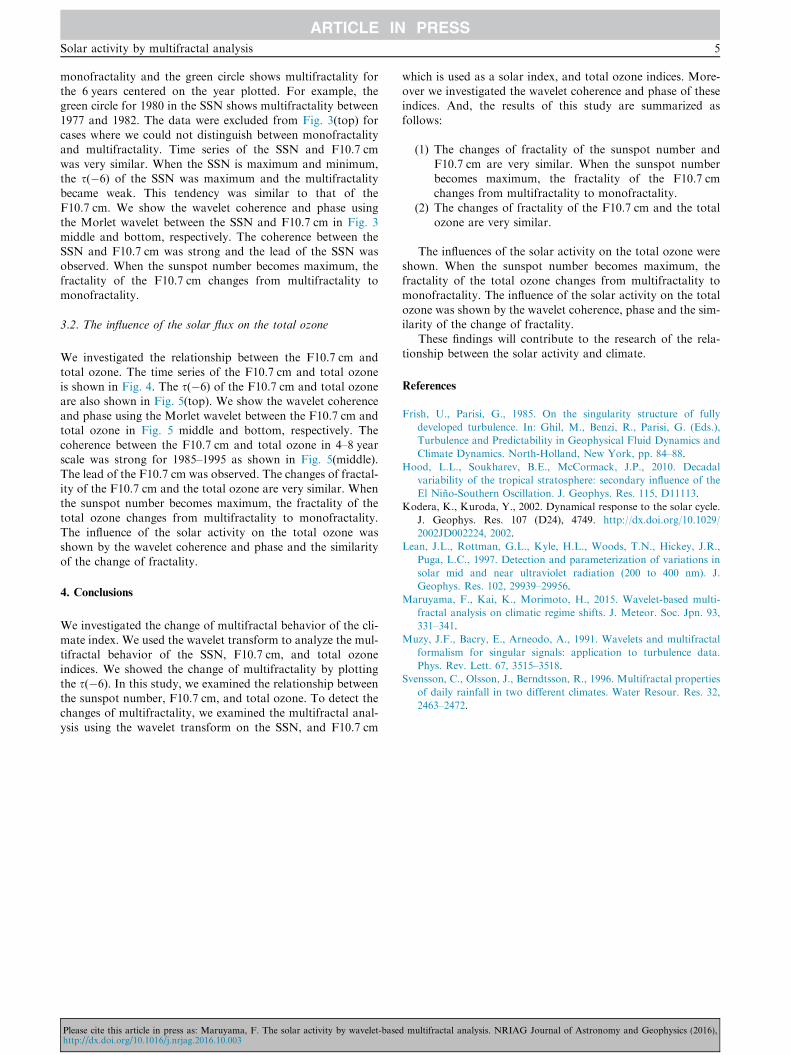
Figure 4 Time series of the F10.7 cm and total ozone.
Time [years]
Time [years]
Scale[years]
Scale[years]
1980 1985 1990 1995 2000 2005 2010
0.51
24
80.51
24
8
Wavelet Coherence
01
1980 1985 1990 1995 2000 2005 2010
Phase
-PI
0PI
Figure 5 The s(�6) of the F10.7 cm and total ozone (top). Wavelet coherence (middle) and phase (bottom) between the F10.7 cm and
total ozone. In the wavelet phase, the positive value means that the F10.7 cm leads the total ozone and the negative value means that the
total ozone leads the F10.7 cm.
4 F. Maruyama
for s67, s68, and s72 – s74 suggests multifractality. In contrast,
s(q) is linear for s69 – s71, which indicates monofractality.We plot the value of the s(�6) in each index. The negative
large values of the s(�6) show large multifractality. For the s(�6), q = �6 is the appropriate number to show the change ofs. The value of the s(�6) does not always correspond to thefractality obtained from the value of R2.
Please cite this article in press as: Maruyama, F. The solar activity by wavelet-basehttp://dx.doi.org/10.1016/j.nrjag.2016.10.003
3. Results and discussions
3.1. The solar activity observed by the SSN and F10.7 cm
To investigate the solar activity, the time series of the SSN andF10.7 cm is shown in Fig. 2. The s(�6) of the SSN andF10.7 cm are shown in Fig. 3(top). The red square shows
d multifractal analysis. NRIAG Journal of Astronomy and Geophysics (2016),
Solar activity by multifractal analysis 5
monofractality and the green circle shows multifractality forthe 6 years centered on the year plotted. For example, thegreen circle for 1980 in the SSN shows multifractality between
1977 and 1982. The data were excluded from Fig. 3(top) forcases where we could not distinguish between monofractalityand multifractality. Time series of the SSN and F10.7 cm
was very similar. When the SSN is maximum and minimum,the s(�6) of the SSN was maximum and the multifractalitybecame weak. This tendency was similar to that of the
F10.7 cm. We show the wavelet coherence and phase usingthe Morlet wavelet between the SSN and F10.7 cm in Fig. 3middle and bottom, respectively. The coherence between theSSN and F10.7 cm was strong and the lead of the SSN was
observed. When the sunspot number becomes maximum, thefractality of the F10.7 cm changes from multifractality tomonofractality.
3.2. The influence of the solar flux on the total ozone
We investigated the relationship between the F10.7 cm and
total ozone. The time series of the F10.7 cm and total ozoneis shown in Fig. 4. The s(�6) of the F10.7 cm and total ozoneare also shown in Fig. 5(top). We show the wavelet coherence
and phase using the Morlet wavelet between the F10.7 cm andtotal ozone in Fig. 5 middle and bottom, respectively. Thecoherence between the F10.7 cm and total ozone in 4–8 yearscale was strong for 1985–1995 as shown in Fig. 5(middle).
The lead of the F10.7 cm was observed. The changes of fractal-ity of the F10.7 cm and the total ozone are very similar. Whenthe sunspot number becomes maximum, the fractality of the
total ozone changes from multifractality to monofractality.The influence of the solar activity on the total ozone wasshown by the wavelet coherence and phase and the similarity
of the change of fractality.
4. Conclusions
We investigated the change of multifractal behavior of the cli-mate index. We used the wavelet transform to analyze the mul-tifractal behavior of the SSN, F10.7 cm, and total ozone
indices. We showed the change of multifractality by plottingthe s(�6). In this study, we examined the relationship betweenthe sunspot number, F10.7 cm, and total ozone. To detect thechanges of multifractality, we examined the multifractal anal-
ysis using the wavelet transform on the SSN, and F10.7 cm
Please cite this article in press as: Maruyama, F. The solar activity by wavelet-basedhttp://dx.doi.org/10.1016/j.nrjag.2016.10.003
which is used as a solar index, and total ozone indices. More-over we investigated the wavelet coherence and phase of theseindices. And, the results of this study are summarized as
follows:
(1) The changes of fractality of the sunspot number and
F10.7 cm are very similar. When the sunspot numberbecomes maximum, the fractality of the F10.7 cmchanges from multifractality to monofractality.
(2) The changes of fractality of the F10.7 cm and the totalozone are very similar.
The influences of the solar activity on the total ozone were
shown. When the sunspot number becomes maximum, thefractality of the total ozone changes from multifractality tomonofractality. The influence of the solar activity on the total
ozone was shown by the wavelet coherence, phase and the sim-ilarity of the change of fractality.
These findings will contribute to the research of the rela-
tionship between the solar activity and climate.
References
Frish, U., Parisi, G., 1985. On the singularity structure of fully
developed turbulence. In: Ghil, M., Benzi, R., Parisi, G. (Eds.),
Turbulence and Predictability in Geophysical Fluid Dynamics and
Climate Dynamics. North-Holland, New York, pp. 84–88.
Hood, L.L., Soukharev, B.E., McCormack, J.P., 2010. Decadal
variability of the tropical stratosphere: secondary influence of the
El Nino-Southern Oscillation. J. Geophys. Res. 115, D11113.
Kodera, K., Kuroda, Y., 2002. Dynamical response to the solar cycle.
J. Geophys. Res. 107 (D24), 4749. http://dx.doi.org/10.1029/
2002JD002224, 2002.
Lean, J.L., Rottman, G.L., Kyle, H.L., Woods, T.N., Hickey, J.R.,
Puga, L.C., 1997. Detection and parameterization of variations in
solar mid and near ultraviolet radiation (200 to 400 nm). J.
Geophys. Res. 102, 29939–29956.
Maruyama, F., Kai, K., Morimoto, H., 2015. Wavelet-based multi-
fractal analysis on climatic regime shifts. J. Meteor. Soc. Jpn. 93,
331–341.
Muzy, J.F., Bacry, E., Arneodo, A., 1991. Wavelets and multifractal
formalism for singular signals: application to turbulence data.
Phys. Rev. Lett. 67, 3515–3518.
Svensson, C., Olsson, J., Berndtsson, R., 1996. Multifractal properties
of daily rainfall in two different climates. Water Resour. Res. 32,
2463–2472.
multifractal analysis. NRIAG Journal of Astronomy and Geophysics (2016),