Embed Size (px)
Citation preview
THE SOCIOLOGY OF TEACHING AND LEARNING UNDERGRADUATE SOCIAL STATISTICS IN HIGHER EDUCATION: ACCESS, ASSESSMENT
AND ARTS-BASED RESEARCH METHODS
A DISSERTATION
SUBMITTED IN PARTIAL FULFILLMENT OF THE REQUIREMENTS
FOR THE DEGREE OF DOCTOR OF PHILOSOPHY
IN THE GRADUATE SCHOOL OF THE
TEXAS WOMAN’S UNIVERSITY
DEPARTMENT OF SOCIOLOGY AND SOCIAL WORK
COLLEGE OF ARTS AND SCIENCES
BY
ALLISON RAY REAGAN, B.A.A.S., M.A.
DENTON, TEXAS
MAY 2019
ii
ACKNOWLEDGEMENTS
I would like to express my gratitude to the many people whose contributions
added value to my time in graduate school.
My Family
Fully expressing my gratitude for my husband, George Stroud Reagan, Jr. would
require a dissertation-length document. I am thankful for George’s patience and
flexibility during my “research rabbit holes” and his devotion to caring for our family. He
not only saved my life but also makes my life worth living every day. George is literally
and metaphorically a rock star husband who never misses out on an opportunity to drive
us in our VW bus rock hunting- to get our ‘geological kicks on route 66’. I also want to
express my gratitude for our children Drew, Jacob, Elijah, Mary, and Maddie. I am
thankful to my mother Gail LaRosa, my father Robert LaRosa, my brother-in-law Eric,
and Jacob’s fiancé Caris for their loving support and encouragement. I want to thank my
two best friends, Dr. Luis Espinoza and Dr. Lucas Espinoza for their wisdom, guidance,
and support.
Dissertation Committee Members
I am indebted to Dr. Jessica Smartt Gullion, my committee chair and mentor.
Academically, she introduced me to qualitative research and she served as committee
chair for both my thesis and dissertation. On a personal level, she inspired me with her
iii
passion for social justice and alternative arts-based data dissemination methodologies. I
would attribute a lion’s share of the credit to her for becoming the arts-based qualitative
educational activist researcher I am today. In addition to Dr. Gullion, I am thankful my
other dissertation committee members. I am appreciative of Dr. Mahmoud Sadri’s
insightful feedback that shaped the scope of my dissertation research. I am also grateful
to Dr. James L. Williams for his mentorship as my faculty resource person when I was
the undergraduate criminal justice adviser and insightful comments throughout the
dissertation process.
TWU’s Department of Sociology and Social Work Faculty and Staff
First, I am quite appreciative to Dr. Philip Q. Yang, a professor and Graduate
Program Director. He served as a trusted academic advisor throughout my time as a
graduate student and as my faculty resource person for all of the social statistics courses
that I taught. Most importantly, as a statistics instructor, Dr. Yang facilitated my access to
statistical knowledge and inspired me to teach social statistics. I am also grateful to Dr.
Celia Lo, Professor and Chair of the Department of Sociology and Social Work.
Academically, she patiently taught me how to conceptualize a research model.
Professionally, the graduate assistantships awarded to me by Dr. Lo enabled me to
support my family and to build invaluable professional skills as an academic adviser,
undergraduate instructor of record, and course builder.
iv
ABSTRACT
ALLISON RAY REAGAN
THE SOCIOLOGY OF TEACHING AND LEARNING UNDERGRADUATE SOCIAL STATISTICS IN HIGHER EDUCATION: ACCESS, ASSESSMENT
AND ARTS-BASED RESEARCH METHODS
MAY 2019
This dissertation follows a three-article format. The unifying theme for all three
articles are the ways in which instructors face the challenges of facilitating access to
course knowledge for undergraduate students enrolled in online introductory statistics
courses. Each of the three articles are interrelated by the unifying theme but contributes
in its own distinct way. The first article is a systematic review of literature from 2010 to
2018, which explores broad theoretical questions related to access to statistical education
opportunities, the challenges for learning, and the innovative strategies associated with
teaching introductory statistics online. The second article is a qualitative classroom
assessment of epistemically-focused course design and instructional strategies
implemented in six sections of online undergraduate introductory social statistics courses
(N students=103). The third article introduces the novel quilt/cARTography method
designed to increase access to course knowledge through metaphorical and arts-based
experiential instructional interventions. Collectively, these articles explore teaching and

v
learning challenges and innovative instructional interventions associated with widening
access to undergraduate statistical education through online course delivery.
vi
TABLE OF CONTENTS
Page
ACKNOWLEDGMENTS ........................................................................................... ii
ABSTRACT ................................................................................................................ iv
LIST OF FIGURES .................................................................................................. viii
PROLOGUE ............................................................................................................... ix
Chapter
I. INTRODUCTION .................................................................................................... 1
Introduction ............................................................................................................. 1 Background: Origin of Research ............................................................................ 2 Problem Statement .................................................................................................. 4 Purpose .................................................................................................................... 5 Rationale ................................................................................................................. 6 Dissertation Organization ....................................................................................... 7
II. PROBLEMATIZING THE INTELLECTUAL ARCHITECTURE OF ONLINE SOCIAL STATISTICS COURSES ............................................................................. 9
Review of the Literature ......................................................................................... 9 Conceptualization ................................................................................................. 10 Theory ................................................................................................................... 11 Conceptual Model ................................................................................................. 12
III. WIDENING ACCESS TO ONLINE UNDERGRADUATE SOCIAL STATISTICS EDUCATION ............................................................................................................ 15
Article One: Access to Higher Education Through Distance Learning: Exploring Challenges, Innovations, and Strategies for Online Statistical Education ............ 15
Article One Citation .......................................................................................... 15 Article One Abstract ......................................................................................... 15

vii
Article One Web Link ....................................................................................... 16 Article Two: Teaching Undergraduate Social Statistics Online: A Classroom Assessment of Instructional Interventions to Reduce Statistics Anxiety and Facilitate Student Success ..................................................................................... 16
Article Two Citation ......................................................................................... 16 Article Two Abstract ......................................................................................... 17 Article Two Web Link ...................................................................................... 17
Article Three: Quilt/cARTography: Using Craftivism to Explore Food Insecurity on a College Campus ............................................................................................ 18
Article Three Citation ........................................................................................ 18 Article Three Abstract ........................................................................................ 18 Article Three Web Link ..................................................................................... 18
IV. IMPLICATIONS AND CONCLUSION ............................................................. 19
Pedagogical Implications ...................................................................................... 19 Implications for Further Research......................................................................... 21 Conclusion ............................................................................................................ 21
REFERENCES .......................................................................................................... 23
APPENDICES
A. Course Syllabus Example ..................................................................................... 29 B. Module Checklist Example ................................................................................... 52 C. Grade Calculation Sheet Example ......................................................................... 54 D. List of Online Learning Environment Student Resources .................................... 61 E. IRB Exemption Letter ........................................................................................... 68
viii
LIST OF FIGURES
Figure Page
2.1 Proactive Integrative Democratized Pedagogical Model ............................... 14

ix
PROLOGUE FOR ONLINE SOCIAL STATISTICS INSTRUCTORS
One of my main objectives in writing this three-article dissertation was to not
only formally present my doctoral research, but to also to create a practical resource to
demystify epistemically-focused course design and instructional interventions. Even the
most knowledgeable statistics educators may feel uneasy by the thought of teaching
social statistics online. How do we demystify statistics for our students? What are the
learning challenges for students who enroll in online statistics courses? How can we best
support their online learning?
I had all these questions and more when I was assigned to teach my first social
statistics course. I spent countless hours scouring the literature and taking teaching
courses to find the answers. I certainly would not be so presumptuous as to state that I
have all the answers. What I can offer though is to save you time in researching best
practices, by compiling them along with epistemically-focused instructional interventions
into one document. I intended to include the actual resources as a supplement to each
article; however, due to publishing constraints such as maximum article length prohibited
me from sharing the actual pedagogical tools described within the article. Instead, I have
included the following resources at the end of this dissertation. (1) An example of the
syllabus that I used for my online courses is provided as Appendix A. (2) An example of
x
a module checklist for online social statistics is provided as Appendix B. (3) An example
of the grade calculation worksheet that I used in my online courses is provided as
Appendix C. (4) A list of resources that I include within the online learning
environments student resources is provided as Appendix D.
1
CHAPTER I
INTRODUCTION
The globalized data-driven technological nature of society poses
challenges to student’s statistical literacy by bombarding daily with facts and information
in the media. These factual claims reported in the media require at least a minimum-level
of statistical literacy for individuals to make informed decisions (Sharma 2017).
Statistical literacy is a critical skill, as such, it should be an objective for all social
statistics courses (Rumsey 2002). Research suggests that undergraduate students who
lack statistical literacy have difficulty not only discriminating between fact and opinion,
but also interpreting and evaluating various types of information in the media (Sharma
2017). Further, in recognition of the importance of statistical literacy, approximately 75
percent of undergraduate sociology programs, in national universities, require successful
completion of at least one statistics course by sociology majors (Delia Deckard 2017). At
the same time, the trend in higher education is to utilize technological advances in course
delivery systems to widen access to higher education opportunities (Bousquet 2008;
Cottom 2017; Fielding 2016; Garcia and Cuello 2010; Kinghorn 2014) by enabling time
and place constrained students to complete courses online. The popularity of online
course enrollment is evidenced by Allen, Seaman, Poulin, and Straut’s (2016) research
2
that reported approximately 2.85 million students completed their undergraduate
coursework online.
As a result of these initiatives and trend for online enrollment, many sociology
instructors are tasked with redesigning their traditionally-structured social statistics
courses that are delivered on campus to online courses. This is not an easy task because
of the significant challenges for both teaching and learning online (Conole 2009;
Dykeman 2011; Everson & Garfield 2008; Hedges 2017; Letseka and Pitsoe 2014;
Mannay and Wilcock 2015; Mills and Raju 2011; Morrow, 2009; Zimmerman and
Johnson 2017). As such, instructors in higher education and educational researchers need
to gain a better understanding of the challenges associated with teaching and learning
online undergraduate introductory statistics. More specifically, how can instructors
design, implement, and assess innovative online learning environments that minimize the
challenges associated with learning statistics online? The three articles presented within
this dissertation study this question and contributes to the answer in its own distinct way.
A contextual overview of the background and origin of this dissertation research is
discussed in detail within the next section of this introductory chapter. The origin of my
research leads to my problematization of the issue that resulted in a new theoretical
framework, which connects the research in articles two and three.
BACKGROUND: ORIGIN OF RESEARCH
This research began informally in my second semester as a graduate teaching
instructor who wanted to find a way to increase student satisfaction and successful course
completion. Around that time, I also began to enroll in graduate-level teaching and
3
learning in higher education course, six in total across multiple disciplines. Additionally,
was accepted into two university-sponsored teaching certificate-type programs (New
Faculty Development Course and Practices for Instruction and Learning for Online
Teaching) which were held during the summer semester. These 18 hours of graduate
instruction as well as the specialization courses were invaluable in building my
instructional and organizational knowledge. When I was assigned to teach my second
social statistics course, I used this specialized training by revising my course syllabus,
content delivery methods, learning assignments and activities, and assessments. These
changes appeared to help; I only had anecdotal classroom observations.
I realized that if I wanted to enact change for my students, then I needed to
approach teaching social statistics in an alternative way. To accomplish this goal, I
proposed a three-article dissertation to my committee to conduct this educational action
research. Article 1 would involve thorough review of the literature and serve as the
literary foundation for articles 2 and 3. The second article would present my course
design, instructional interventions, as well as classroom assessment. The third article
would present an innovative arts-based method for pedagogy. During the proposal
defense, a committee member challenged me to think deeper about my research by
posing interesting questions for me to think about: What was it exactly that I was doing
that was differently in my classes? “and what is it called?” This influenced the way in
which I framed the theme for this dissertation research. I realized that even though the
changes that I had made to my statistics courses were based on the literature, they did not
follow a particular pedagogical theory/framework due to the gap in current literature on
4
this topic. What I was doing in my classes was implementing interventions and course
design from a problem-based epistemically-focused framework that I had developed after
problematizing the ways in which instructors face the challenges of facilitating access to
course knowledge for undergraduate students enrolled in online introductory statistics
courses.
PROBLEM STATEMENT
The current societal practices of credentialism and the deskilling of workers
compel many individuals to earn a degree to be competitive in the U.S. job market
(Cottom, 2017; Bosquet, 2008). This obligation is compounded by the data-driven
technological nature of society that requires statistical literacy so that individuals can
discriminate between various types of data and sources of data to make informed
decisions (Sharma, 2017). The higher education system is often viewed as a gateway to
these economic opportunities (Mannay & Wilcock, 2015). Fortunately, the higher
education system in the US. acknowledges its role and has responded with strategic
initiatives to widen access to students. Currently, the trend among many colleges and
universities is to use technological advances to improve access to higher education
through online course delivery (Bousquet, 2008; Cottom, 2017; Fielding, 2016; Garcia &
Cuello, 2010; Kinghorn, 2014).
This trend in online enrollment poses significant challenges for both sociology
instructors and students. One of the main challenges is that approximately 75 percent of
sociology programs at national universities require completion of at least one statistics
course by all undergraduate sociology majors (Delia Deckard, 2017). As such, sociology
5
instructors who teach social statistics must redesign their traditional on-campus courses
into online courses. This course re-design can be particularly difficult due to the
statistics-specific learning challenges reported in the literature such as high levels of
student statistics anxiety (Dykeman 2011; Onwuegbuzie, 2004; Pan & Tang, 2005), fear
of course failure and course failure delaying graduation (Onwuegbuzie, 1997), and low-
levels of academic self-efficacy (Schacht & Stewart, 1990). The challenges of statistics
anxiety and low self-efficacy were reported to negatively affect learning, course
performance, and engagement in research (Onwuegbuzie & Seaman, 1995; Schacht &
Stewart, 1990). Unfortunately, I found that a minimal body of current scholarship exists
within the discipline of sociology regarding instructional interventions to minimize
anxiety and facilitate student success in online social statistics courses.
PURPOSE
The purpose of this dissertation was to bridge the gap in current SoTL scholarship
by examining the way in which access to statistical education opportunities is
democratized by online course delivery and presenting an epistemically-focused
framework for online course design and innovative instructional intervention
implementation. I accomplish these objectives by first, examining current literature on
the subject of widening access to undergraduate introductory statistics courses that are
delivered online to identify challenges and instructional facilitators. These challenges and
instructional interventions formed the foundation for my theorizations. Next, I developed
a new online course design model, the Proactive Integrative Democratized Pedagogical
6
Model, and instructional interventions. Then, I conducted a classroom assessment to
analyze the implementation of the new course model and instructional interventions.
RATIONALE
Access to undergraduate statistical education due to inequities within the higher
educational system may not only limit student’s levels of statistical literacy and constrain
their abilities to make informed decisions (Sharma 2017), but also serve as an economic
barrier for future employability. By conducting a classroom assessment of six sections
(N=103 students) of online social statistics and reporting the findings in a three-article
format, this dissertation research contributes to practice, future research, and policy. In
other words, this three-article formatted dissertation shares the unifying theme of
democratizing educational opportunities by facilitating access to course knowledge for all
undergraduate students enrolled in online introductory statistics courses. However, each
of the three articles contributes to practice, research, and policy in its own distinct way.
For example, the first article is a systematic review of literature from 2010 to 2018,
which explores broad theoretical questions related to access to statistical education
opportunities, the challenges for learning, and the innovative strategies associated with
teaching introductory statistics online. This article develops and moves forward
sociological teaching and learning literature by adding new insights regarding teaching
undergraduate-level social statistics online. Additionally, this body of work responds to
the National Research Council’s call for action by educational researchers to produce
7
scholarship that “accumulates, synthesizes, and disseminates existing knowledge… to
build a cumulative knowledge base” (2001:299).
The second article is a classroom assessment of epistemically-focused course
design and instructional strategies implemented in six sections of online undergraduate
introductory social statistics courses (N students=103). The third article introduces the
novel quilt/cARTography method designed to increase access to course knowledge
through metaphorical and arts-based experiential instructional interventions. These two
articles highlight my original research and the innovative value-added parts of my
dissertation. Both of these articles discuss propositions that are distinctly my own. For
example, Article 2 outlines a new theoretical framework and course communication
strategy, and Article 3 introduces my novel quilt/cARTography method of data
dissemination and pedagogical tool. Collectively, these articles have practical,
theoretical, and educational policy implications.
DISSERTATION ORGANIZATION
I introduce the topic and describe the background and origin of my dissertation
research in chapter one. Chapter 1 also contains the statement of problem, purpose, and
rationale which clearly discusses the importance of conducting this classroom assessment
research to democratize access to higher statistical education. In Chapter 2, I
problematize the phenomenon of access to education, discuss my theorization and
conceptualization processes, and then present a new model for designing and
implementing online undergraduate social statistics courses. This is followed by Chapter
3 which contains a section for each of the three articles that I published. Each section of

8
Chapter 3 identifies the article title, abstract, and web link to the article on the journal’s
website. Then in Chapter 4, I discuss the implications, recommendations, and draw
conclusions. Lastly, I included a number of useful resources as appendices.
9
CHAPTER II
PROBLEMATIZING THE INTELLECTUAL ARCHITECTURE OF ONLINE SOCIAL
STATISTICS COURSES
In this chapter, I outline my theorization process and model. I begin by describing
the multi-stage model of inquiry that I used to review literature for Article 1. Then I
discuss the way in which problematizing the issue of expanding access to educational
opportunities for undergraduate students led to the conceptualization of a course design
and delivery framework. The chapter concludes with the presentation of the new
framework.
REVIEW OF LITERATURE
I used a multi-stage model of inquiry to complete the literature review sections of
this dissertation (presented in Article 1). I first explored educational research published
between 2010 and 2018 to build an understanding of the evolving trends for expanding
formal access to educational opportunities. Then, using the same snap-shot in time, I
conducted the second-stage of the literature review by exploring the instructional, and
learning challenges of accessing statistical education through distance education and the
pedagogical responses for teaching and learning statistics online (see Article 1 for search
terms, article identification inclusion and exclusion methodology, and systematic review
of the literature). The second-stage of inquiry involved meaning making and analyzation
of the literature. My first observation was the sheer volume of research dedicated to
10
formal access to educational opportunities and the small fraction in comparison of
research dedicated to informal (i.e., epistemic access). I discuss the competing views and
importance of distinction between formal and informal access in Article 1 (pg. 88).
This body of literature provided me with a broad understanding and insight into
the challenges that online students’ face in not only accessing higher educational
opportunities, but also challenges for learning course content and for successfully
completing online courses. I observed a pattern in the scholarship that stemmed from
challenges at the institutional-level to minimize educational inequity by expanding access
to higher education using distance learning as an alternative mode of access/course
delivery. Interestingly, the underlying ‘access’ issue is entangled in the instructor’s role
of delivering statistical education online (i.e., increasing divide in human capital and
educational inequities). The significant gap in sociological literature (see Article 1
discussion, pg. 91) coupled with competing access philosophies serve as the catalyst for
my theorization of the phenomenon of informal/epistemic access (Swedberg 2014).
CONCEPTUALIZATION
Guided by Swedberg’s (2014) phases of social theorizing, I began to
systematically problematize the pedagogical architecture of teaching and learning social
statistics online. I began by identifying the challenges and the structural components for
teaching and learning online. Then, based on a review of the literature and classroom
observations I derived theories about the relationships between student challenges, course
structure, and instructional interventions. This enabled me to construct a conceptual
model to serve as a framework to design, implement, and assess the online learning
11
environment. I discuss the theorization in greater detail and present my framework in
Chapter 2. The following is an excerpt, from Article 2, which narrates my pre-study
observations and preliminary collection qualitative social data (Swedberg 2014):
I was extremely excited to have the opportunity to teach the social statistics course. When I told a colleague that I was assigned the course, she gave me her condolences. I was puzzled as to why she responded in this manner until she shared with me that the consensus among our graduate teaching assistant (GTA) colleagues was that this was the most difficult undergraduate course within our department to teach. Unsurprisingly, the challenges experienced by the GTAs within our department were not isolated incidences… I have kept a teaching journal since the first day of the very first class that I taught. Upon reflection of student course introductions, while teaching my second section of social statistics, I noticed a pattern among student introductions that were similar to the first section that I taught. This was concerning because the nature of the student’s discontent/fear could potentially impact their success in the course. The pattern of comments emerged into the following main themes: (a) high levels of statistics anxiety (specifically lack of perceived skills in math, test taking anxiety/failure and not graduating, the way in which their learning style might hinder them in learning a difficult subject online, and communicating with a statistics instructor) and (b) frustration for being required to enroll in and successfully complete the social statistics course as part of the degree plan due to lack of perception of perceived value in the real world. There appeared to be a variability or, in other words, a disconnect between instructors’ perceived student resource need, which informs their pedagogical strategies and instructional interventions used to teach the course with students attitudes towards their actual academic needs, and what are useful resources for them in successful completing social statistics (Reagan, 2018b:2).
THEORY
I theorize that problematizing the intellectual architecture of access to online
statistical education at the undergraduate-level can inform the reformation of curricular
and instructional design, in particular pedagogical strategies, and techniques to ameliorate
the unintended negative consequence of the current educational model that serves as a
barrier for accessing the discourse and knowledge construction for online students. The
following outlines the critical components of this theorization. First, is idea that student
access to educational opportunities should be conceptualized as two distinct but
12
intertwined forms of access (a) formal (i.e., entrance or enrollment in) at the institutional-
level and (b) epistemic access (i.e. strategies to increase self-efficacy and human capital)
at an instructional-level. The second, is that conceptualizing access in this way enables
course instructors to focus on what was within their power. For example, in the role as a
graduate teaching assistant, I am granted power to modify the following within my
assigned courses (a) teaching philosophy, (b) instructor policies, (c) course policies
(limited), (d) course structure/design (limited with FRP approval), (e) communication, (f)
learning activities, and (g) assessments.
CONCEPTUAL MODEL
I propose a new model for implementing course design and instructional
interventions for social statistics courses that are delivered online, The Proactive
Integrative Democratized Pedagogical Model is illustrated below (see Figure 2.1).
Within this model, the term formal access is conceptualized as the ability to enroll in a
course to build knowledge and epistemic access is conceptualized by nature of the
teaching the student received and the ability to access knowledge and disciplinary
discourse taught in the course (Morrow 2009). The proactive integrative democratized
pedagogical model proactively acknowledge the assumption that in the context of the
higher education system formal access initiatives to minimizing education inequities
should also include informal access initiatives at the instructional-level. Additionally, the
model proactively uses technological advances to foster student self-efficacy by
providing student support and instructional interventions from first-day-of-course versus
crisis management after a student is classified as at-risk for low performance. Further, as
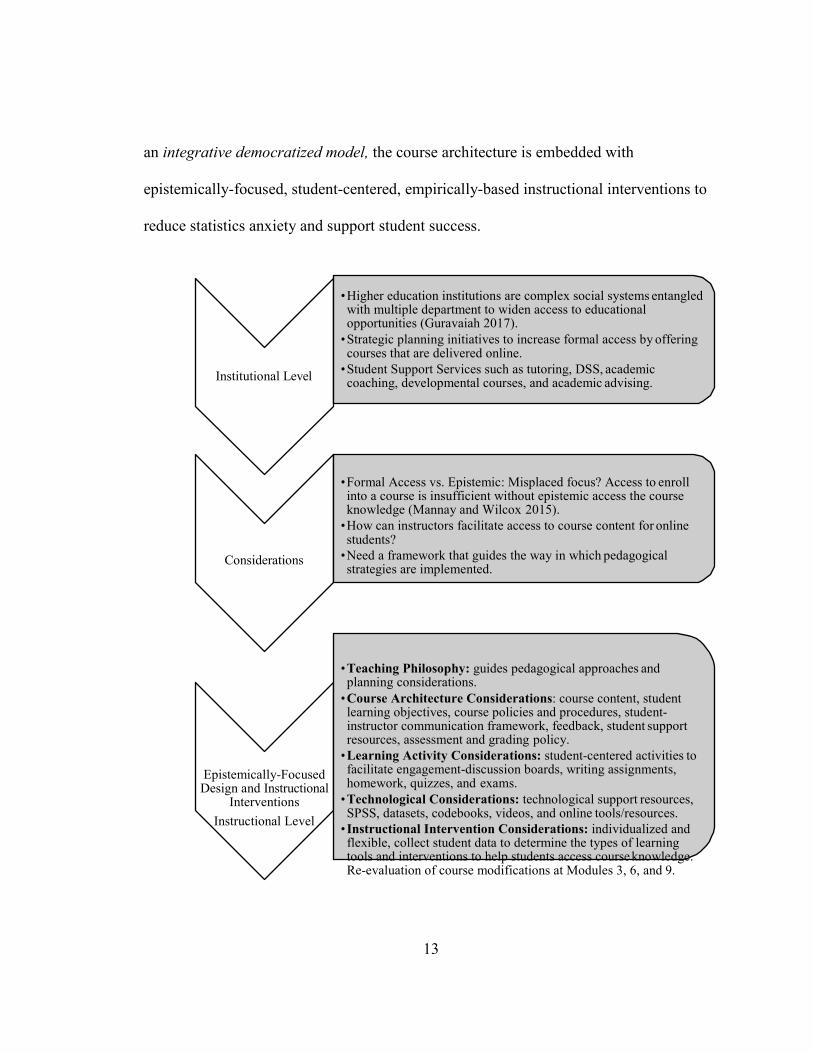
13
an integrative democratized model, the course architecture is embedded with
epistemically-focused, student-centered, empirically-based instructional interventions to
reduce statistics anxiety and support student success.
Institutional Level
• Higher education institutions are complex social systems entangled with multiple department to widen access to educational opportunities (Guravaiah 2017).
• Strategic planning initiatives to increase formal access by offering courses that are delivered online.
• Student Support Services such as tutoring, DSS, academic coaching, developmental courses, and academic advising.
Considerations
• Formal Access vs. Epistemic: Misplaced focus? Access to enroll into a course is insufficient without epistemic access the course knowledge (Mannay and Wilcox 2015).
• How can instructors facilitate access to course content for online students?
• Need a framework that guides the way in which pedagogical strategies are implemented.
Epistemically-Focused Design and Instructional
Interventions Instructional Level
• Teaching Philosophy: guides pedagogical approaches and planning considerations.
• Course Architecture Considerations: course content, student learning objectives, course policies and procedures, student- instructor communication framework, feedback, student support resources, assessment and grading policy.
• Learning Activity Considerations: student-centered activities to facilitate engagement-discussion boards, writing assignments, homework, quizzes, and exams.
• Technological Considerations: technological support resources, SPSS, datasets, codebooks, videos, and online tools/resources.
• Instructional Intervention Considerations: individualized and flexible, collect student data to determine the types of learning tools and interventions to help students access course knowledge. Re-evaluation of course modifications at Modules 3, 6, and 9.

14
Figure 2.1. Proactive Integrative Democratized Pedagogical Model
15
CHAPTER III
WIDENING ACCESS TO ONLINE UNDERGRADUATE SOCIAL STATISTICS EDUCATION
This chapter is divided into three sections, one for each article. The organization
of each sub-section begins with the title of the article and journal in which the article is
published. This is followed by the articles citation, abstract, and a direct web link to the
article on the journal’s website. My drive to democratize access to disciplinary
knowledge not only informed this dissertation methodologies, but also the way in which
the findings were disseminated. I made the decision to publish my finding into three
separate specialized articles instead of merging all of the information into one book-sized
dissertation document. My hope in writing three specialized articles was that each could
be a practical resource for instructors, educational researchers, and educational policy
decision makers. In my opinion, a crucial step in democratizing access to statistical
education for undergraduate students is to first facilitate access to empirically-based
knowledge for statistical educators. Therefore, I mindfully formatted this chapter using
technological advances in dissertation publishing to facilitate access to articles that are
published within copy written journals. Instead of simply providing an article citation that
must be manually located within each journal, I include clickable direct web links for
each article within the journal’s web page.
16
ARTICLE 1: ACCESS TO HIGHER EDUCATION THROUGH DISTANCE
LEARNING: EXPLORING CHALLENGES, INNOVATIONS, AND STRATEGIES
FOR ONLINE STATISTICAL EDUCATION
An Article Submitted for Publication in
International Journal of Novel Research in Education and Learning
Allison R. Reagan, B.A.A.S, M.A.
Article 1 Citation
Reagan, Allison R. 2018. “Access to Higher Education through Distance Learning:
Exploring Challenges, Innovations and Strategies for Online Statistical Education.”
International Journal of Novel Research in Education and Learning 5(5):82-95.
Article 1 Abstract
Recognition of the data-driven technological nature of society the current trend in
the sociology of education is emphasis on statistical literacy. As such, many university-
level sociology departments across the globe require undergraduate students to
successfully complete a social statistics course to meet minimum program requirements.
In an effort to increase student access to the required statistical education, courses
(traditionally taught exclusively on campus) are now moving to online platforms. There
are a number of significant challenges that impact both the instructor’s ability to
effectively teach and enrolled student’s ability to successfully complete an online
statistics courses. Unfortunately, the most current review of scholarship on the topic of
17
challenges and innovations in teaching statistics examined literature published between
1993 and 2010 is outdated due to rapid advancement in educational technology. The
purpose of this systematic review of literature (2010 to 2018) is to contribute to the
scholarship of teaching and learning undergraduate social statistics online in two distinct
ways. First, to provide a resource for educational researchers, by compiling, synthesizing,
and discussing a decade of academic literature on the topic of challenges to teaching and
learning undergraduate statistics online into one easily accessible manuscript. Second, to
provide a resource for educators, by adding new pedagogical insights and suggestions for
practical instructional interventions to address teaching and learning challenges.
Article 1 Web Link
Direct web link to article: http://www.noveltyjournals.com/journal/IJNREL/Issue-
5- September-2018-October-2018/0
ARTICLE 2: TEACHING UNDERGRADUATE SOCIAL STATISTICS ONLINE: A
CLASSROOM ASSESSMENT OF INSTRUCTIONAL INTERVENTIONS TO
REDUCE STATISTICS ANXIETY AND FACILITATE STUDENT SUCCESS
An Article Submitted For Publication in
Journal of Education and Social Policy
Allison R. Reagan, B.A.A.S, M.A.
Article 2 Citation
Reagan, Allison R. 2018. “Teaching Undergraduate Social Statistics Online: A
Classroom Assessment of Instructional Interventions to Reduce Statistics Anxiety and
18
Facilitate Student Success.” Journal of Education and Social Policy 5(4):186-196. doi:
10.30845/jesp.v5n4p22
Article 2 Abstract
Instructional interventions for teaching introductory social statistics courses
online differ from those used when teaching in traditional on-campus courses. Despite the
expansion in online course offerings to accommodate the high rate of university
sociology programs that require social statistics to graduate, a gap exists in scholarship
regarding empirically-based recommendations for effective pedagogical online course
design and implementation strategies. In this manuscript, I describe my experiences
teaching and creating undergraduate social statistics courses designed to minimize
student challenges for learning statistics online by incorporating innovative pedagogical
strategies and interventions. Additionally, I report students’ perceptions of the usefulness
of the pedagogical course design strategies and instructional interventions in reducing
their statistics anxiety and success in learning course material. The data for this
qualitative classroom assessment was collected from six sections of online undergraduate
introductory-level social statistics courses. The results can guide online instructors,
researchers, and course designers.
Article 2 Web Link
Direct web link to article:
http://www.jespnet.com/journals/Vol_5_No_4_December_2018/22.pdf
19
ARTICLE 3: “QUILT/CARTOGRAPHY: USING CRAFTIVISM TO EXPLORE FOOD
INSECURITY ON A COLLEGE CAMPUS”
An Article Submitted For Publication in
Art/Research International: A Transdisciplinary Journal
Allison Ray Reagan, B.A.A.S, M.A.
Article 3 Citation
Reagan, Allison Ray. 2019. “Quilt/cARTography: Using Craftivism to Explore Food
Insecurity on a College Campus.” Art/Research International 4(1):322-350.
doi: http://dx.doi.org/10.18432/ari29390
Article 3 Abstract
Quilt/cARTography emerged from an arts-based inquiry method for research
dissemination. I used quilt-making as an embodied craft and metaphor to illustrate how
crafting research is similar to piecing together neighborhood food environment data in an
undergraduate social statistics course. As an innovative pedagogical tool,
cARTographical quilts transform data into accessible tactile mediums that cross
disciplinary boundaries and educational levels to explore hunger on a college campus.
Article 3 Web Link
Direct web link to article:
https://journals.library.ualberta.ca/ari/index.php/ari/article/view/29390
20
CHAPTER IV
IMPLICATIONS AND CONCLUSION
PEDAGOGICAL IMPLICATIONS
Throughout current literature, academic researchers have noted various challenges
for teaching online statistics courses (Addison, Stowell, and Reab 2015; Dykeman 2011;
Everson and Garfield 2008; Kapur 2015; Pan and Tang 2004; Waples 2016). Findings
within this dissertation (see article 2) suggest that by designing an online statistics course
with built in instructional interventions and re-assessment can minimize those challenges.
Thapliyal’s (2014) instructional intervention findings were similar and reported they
facilitated student access to educational opportunities. Thapliyal (2014) suggested the
following instructional interventions (a) discuss each student learning objective and the
way in which they will be assessed (for example, see Appendix A course syllabus) (b)
provide online students with a list of resources and support services (for example, see
Article 2, student resources). Guru-Gharana and Flanagan (2013) hypothesized that
students with higher levels of participation would have higher final scores. As such, they
suggested that instructors should incorporate strategies to increase participation (for
example, see Article 2, learning activities) (Guru-Gharana and Flanagan 2013). Lastly,
providing multiple opportunities to complete quizzes and homework assignments actively
engages students with the course content (Ferrandino 2016) and reduces statistics anxiety
21
and increases mastery of course content (for examples, see Article 2, multiple attempts
and grading) (Reagan 2018b).
In my third article, I present the pedagogical and data dissemination implications
for the quilt/cARTography method. The quilt/cARTography method is useful for
creatively-minded researchers to actively engage with pieces of data into fiber art quilt. I
found that this creative method, unlike a highly technical academic thesis, could be easily
accessed by a wider-audience. Similarly, Gullion and Schäfer (2017) indicated that arts-
based methods enable researchers to effectively conceptualize and disseminate social
science research in an accessible way.
In addition to the benefits of data dissemination, quilt/cARTography can also be
used as an effective arts-based pedagogical tool. Denzin and Lincoln (1999) note that
arts-based pedagogy has the potential to add to student’s knowledge construction. Levy
(2015) adds that arts-based methods are useful when conducting problem-centered
research (Leavy 2015). In my third article, I discussed in detail the following practical
pedagogical implications of the quilt/cARTography method: (a) the quilting metaphor as
a pluralistic teaching approach to help students make metaphorical connections between
crafting a quilt and crafting research (Koelsch 2012), (b) the quilting metaphor is
effective with diverse student populations, (c) the quilting metaphor simplifies the
academic research process and encourages active participation in the knowledge building
process (Ausband 2006; Sommers 1997), and (d) as a finished quilt, real world data is
transformed from numerical values into a visual and tactile medium for individuals to
actively engage (Kellner 1999; Saukko 2000).
22
IMPLICATIONS FOR FURTHER RESEARCH
In article two, I made the following recommendations for instructors who teach
social statistics online: (a) incorporation of statistics-anxiety-reducing pedagogical
strategies, (b) incorporate student feedback in mid-course modification (Reagan 2018b).
With regard to future instructor-researcher classroom assessments, I made the following
suggestions in Article 2: (a) create instructor videos focused on SPSS activities and
assess student perceptions, (b) create instructor videos scaffolding various statistical
procedures with real-world data and assess student perceptions, (c) create voice-over
PowerPoints® and assess student perceptions (Reagan 2018b). According to Aragon and
Wickramasinghe (2016), online students who watched course-related videos were more
successful than the online students who do not watch videos. Additionally, future
academic research should consider following the model presented in Article 2 and
investigate the following variables: “(a) student course completion rate to measure
student retention (i.e., drop-out rate) and (b) student success rate to measure the rate of
successful course completion (i.e., the rate of students who successfully complete the
course with a minimum grade of c)” (Reagan 2018b:9).
CONCLUSION
In conclusion, this dissertation, which is composed of three-published articles,
significantly contributes to both sociological and social science research. The first article
which reviewed and synthesized current teaching and learning scholarship is a useful
resource for educators and researchers by contributing new insights to the limited body of
scholarship on the topic of challenges and practical interventions for teaching social
23
statistics online (Reagan 2018a). The mixed-methods (i.e., quantitative and qualitative)
classroom assessment article that outlined and assessed online course design and
instructional interventions is a valuable resource for online statistics educators. This
article reports new empirically-based online teaching interventions such as an innovative
communications and assessment framework, an automated feedback methodology, and
pedagogical strategy to assess student perceptions at three-points during the semester
providing an instructor with the opportunity to re-assess and modify pedagogical
strategies (Reagan 2018b). Additionally, my second article outlines an empirically-based
methodology for designing a user-friendly student-centered online learning environment
that includes technological, career, and academic resources. This course design has the
potential to facilitate student self-efficacy and epistemic assess to course knowledge,
encourage student engagement with real-world issues and data that relate to their future
career aspirations, minimize statistics and test taking anxiety, and support successful
course completion (Reagan 2018b). Lastly, my third article explores quilt/cARTography
as an innovative pedagogical and data dissemination tool. In spite noted snags, the
limitations did not significantly impact the research. Rather, the findings derived from the
qualitative research data that I collected, supports the quilt/cARTography as an effective
dissemination method and pedagogical tool for use in undergraduate social statistics
classrooms (Reagan 2019).
REFERENCES
Addison, William E., Jeffrey R. Stowell, and Mitchell D. Reab. 2015. “Attributes of
Introductory Psychology and Statistics Teachers: Findings from Comments on
RateMyProfessor.com.” Scholarship of Teaching and Learning in Psychology,
1:229-234.
Allen, I. Elaine, Jeff Seaman, Russell Poulin, and Terry Taylor Straut. 2016. “Online
Report Card: Tracking Online Education in the United States.” Retrieved May 10,
2018 (https://onlinelearningconsortium.org/survey_report/2015-online-report-
card-tracking-online-education-united-states/).
Aragon, Regina, and Indika P. Wickramasinghe. 2016. “What has an Impact on Grades?
Instructor-Made Videos, Communication, and Timing in an Online Statistics
Course.” Journal of Humanist Mathematics 6(2):84-95.
Ausband, Leigh. 2006. “Qualitative Research and Quilting: Advice for Novice
Researchers.” The Qualitative Report 11(4):764-770.
Bousquet, Marc. 2008 How the University Works: Higher Education and the Low-Wage
Nation. New York, NY: New York University Press.
Conole, Grainne. 2009. “Stepping over the Edge: The Implications of New Technologies
for Education.” in Web 2.0 Based E-Learning: Applying Social Informatics for
23
24
Tertiary Teaching, edited by M. J.W. Lee, and C. McLoughlin. Hershey, PA:
Information Science Publishing.
Cottom, Tressie McMillan. 2017. Lower Ed: The Troubling Rise of For-Profit Colleges
in the New Economy. New York, NY: The New Press Publishers.
Delia Deckard, Natalie M. 2017. “Statistics Education for Undergraduate Sociology
Majors: Survey Findings Across Institutions.” Numeracy 10(2):article 8.
Denzin, Norman K., and Yvonna S. Lincoln, eds. 1999. The SAGE Handbook of
Qualitative Research. 3rd ed. Thousand Oaks, CA: Sage Publications.
Dykeman, Bruce F. 2011. “Statistics Anxiety: Antecedents and Instructional
Interventions.” Education 132(2):441-446.
Everson, Michelle G. and Joan Garfield. 2008. “An Innovative Approach to Teaching
Online Statistics Courses.” Technology Innovations in Statistics Education
2(1):article 3.
Ferrandino, Joseph A. 2016. “Student Achievement in Undergraduate Statistics: The
Potential Value of Allowing Failure.” Journal of the Scholarship of Teaching and
Learning 16(6):1-18.
Fielding, Heather. 2016. “Any Time, Any Place: The Myth of Universal Access and the
Semiprivate Space of Online Education.” Computers and Composition 40:103-
114.
Garcia, Ana Maria Delgado, and Rafael Oliver Cuello. 2010. “A Model of Equitable and
Sustainable Redistribution of Knowledge.” Educational Technology Research and
Development 58(6):781-790.
25
Gullion, Jessica. S., and Lisa Schäfer, L. 2017. “Arts-Based Research in Sociology,
Anthropology, and Psychology.” Pp. 511-525 in The Handbook of Arts-Based
Research, edited by P. Leavy. New York, NY: Guilford Press.
Guravaiah, P. 2017. “A Review of Higher Education Issues, Challenges, and Responses
in India.” International Journal of Research in Commerce and Management
8(9):49-53.
Guru-Gharana, Kishor, and J. Flanagan. 2013. “Econometric Study of Time Use and
Scores in Online MBA Statistics Class: A Gender Analysis.” Journal of
Economics and Economic Education Research 13(3):59-80.
Hedges, Sarai. 2017. “Statistics Student Performance and Anxiety: Comparisons in
Course Delivery and Student Characteristics.” Statistics Education Research
Journal 16(1):320-336.
Kapur, Manu. 2015. “Learning From Productive Failure.” Learning: Research and
Practice 1(1):51-65.
Kellner, Douglas. 1999. “Theorizing McDonaldization: A Multiperspectivist Approach.”
Pp.186-206 in Resisting McDonaldization, edited by B. Smart. London, UK:
Sage.
Koelsch, Lori E. 2012. “The Virtual Patchwork Quilt: A Qualitative Feminist Research
Method.” Qualitative Inquiry 18(10):823-829.
Leavy, Patricia. 2015. Method Meets Art: Arts-Based Research Practice. 2nd ed. New
York, NY: The Guilford Press.
26
Letseka, Moeketsi, and Victor Pitsoe. 2014. “The Challenges and Prospects of Access to
Higher Education at UNISA.” Studies in Higher Education 39(10):1942-1954.
Mannay, Dawn, and Ceri Wilcock. 2015. “What Students Want? Exploring the Role of
the Institution in Supporting Successful Learning Journeys in Online Distance
Education.” Widening Participation and Lifelong Learning 17(1):49-63.
Mills, Jamie D., and Dheeraj Raju. 2011. “Teaching Statistics Online: A Decade’s
Review of the Literature About What Works.” Journal of Statistics Education
19(2):1-27.
Morrow, Wally. 2009. Bounds of Democracy: Epistemological Access in Higher
Education. Cape Town, South Africa: HSRC Press.
National Research Council. 2001. “Knowing What Students Know: The Science and
Design of Educational Assessment.” Washington, DC: The National Academies
Press.
Onwuegbuzie, Anthony J., and Michael A. Seaman. 1995. “The Effect of Time
Constraints and Statistics Anxiety on Test Performance in a Statistics Course.”
Journal of Experimental Education 63(2):115-124.
Onwuegbuzie, Anthony J. 1997. “Writing a Research Proposal: The Role of Library
Anxiety, Statistics Anxiety, and Compositional Anxiety.” Library and
Information Science Research 19(1):5-33.
Onwuegbuzie, Anthony J. 2004. “Academic Procrastination and Statistics Anxiety.”
Assessment and Evaluation in Higher Education 29(1):3-19.
27
Pan, Wei, and Mei Tang. 2004. “Examining the Effectiveness of Innovative Instructional
Methods on Reducing Statistics Anxiety for Graduate Students in the Social
Sciences.” Journal of Instructional Psychology 31(2):149-159.
Pan, Wei, and Mei Tang. 2005. “Students’ Perceptions of Factors of Statistics Anxiety
and Instructional Strategies.” Journal of Instructional Psychology 32:205-214.
Reagan, Allison R. 2018a. “Access to Higher Education Through Distance Learning:
Exploring Challenges, Innovations and Strategies for Online Statistical
Education.” International Journal of Novel Research in Education and Learning
5(5):82-95.
Reagan, Allison R. 2018b. “Teaching Undergraduate Social Statistics Online: A
Classroom Assessment of Instructional Interventions to Reduce Statistics Anxiety
and Facilitate Student Success.” Journal of Education and Social Policy 5(4):1-
11.
Reagan, Allison Ray. 2019. “Quilt/cARTography: Using Craftivism to Explore Food
Insecurity on a College Campus.” Art/Research International 4(1):322-350.
doi: http://dx.doi.org/10.18432/ari29390
Rumsey, Deborah J. 2002. “Statistical Literacy as a Goal for Introductory Statistics
Courses.” Journal of Statistics Education 10(3):1-12.
Saukko, Paula. 2000. “Between Voice and Discourse: Quilting Interviews on Anorexia.”
Qualitative Inquiry 6(3):229-317.
Schacht, Steven, and Brad J. Stewart. 1990. “What’s Funny About Statistics? A
Technique for Reducing Student Anxiety.” Teaching Sociology 18(1):52-56.
28
Sharma, Sashi. 2017. “Definitions and Models of Statistical Literacy: A Literature
Review.” Open Review of Educational Research 4(1):118-133.
Sommers, Rhonda C. 1997. “The Quilting Bee: A Research Metaphor.” The Qualitative
Report 3(4):1-3.
Swedberg, Richard. 2014. The Art of Social Theory. Princeton, NJ: Princeton University
Press.
Thapliyal, Upasna. 2014. “Perceived Quality Dimensions in Distance Education:
Excerpts from Student Experiences.” Turkish Online Journal of Distance
Education 15(3):60-67.
Waples, J. A. 2016. “Teacher-Ready Research Review: Building Emotional Rapport with
Students in Statistics Courses.” Scholarship of Teaching and Learning in
Psychology 2(4):285-293.
Zimmerman, Whitney A., and Glenn Johnson. 2017. “Exploring Factors Related to
Completion of an Online Undergraduate-Level Introductory Statistics Course.”
Online Learning 21(3):191-205.

29
APPENDIX A
COURSE SYLLABUS EXAMPLE
30
SOCI 3163.50 SOCIAL STATISTICS
Syllabus
Spring 2019
Allison Ray Reagan, MA, Doctoral Candidate
Department of Sociology and Social Work
Texas Woman's University
CAVEAT: ALL materials including the syllabus, tentative course calendar, rubrics, course requirements, and procedures in this course are subject to change in the event of extenuating circumstances.
31
Course Information Semester: Spring Year: 2019 Course Prefix: SOCI Course Number: 3163.50 Course Title: Social Statistics Delivery Method: Online Course Description and Overview: Introduction to basic statistics in the social and behavioral sciences and data analysis using SPSS. Basic descriptive statistics, measures of central tendency and variation, normal curve, hypothesis testing, t-tests, ANOVA, chi square test, measures of association, regression and correlation. May not be used to satisfy University General Education requirements. Three lecture hours a week. Credit: Three hours. Prerequisites Courses or Conditions: Sociology majors must have completed SOCI 1013- Introduction to Sociology before taking this course. Course Access: For some of you, this is your first online class, and you may not be completely comfortable with the format. This class is held online through Canvas. You may access the Canvas sign-in page through http://online.twu.edu - I recommend bookmarking this page. Canvas is a web-based course delivery system, but no one has access to the system or our class except those who are appropriately registered. You will sign in to the Canvas system by using your Pioneer Portal user ID and password. Please make sure you can access our course and familiarize yourself with the course layout prior to the beginning of class.
Faculty Contact Information Instructor: Allison Ray (Reagan), MA, Doctoral Candidate*please note that you
may see my name listed as either Allison Ray or Allison Reagan. I was recently married and it takes a while for the official name change to be processed with all of the departments across the university.
Office Location: CFO 301a Email: [email protected]
Email is the best way to contact me. When emailing me, please type SOCI 3163.50-‘reason for contact’ in the subject line. For example, SOCI 3163.50 Assignment One Question.
Office Phone: 940-898-2052 (email is the best way to contact me) Virtual Office Hours:
Thursdays from 11:00-1:00 (virtual/online) My goal is for you to have a positive and successful experience in this class. Please email me immediately if you are having difficulty understanding any of the class activities, readings, assignments, quizzes or exams. Also, if you find that discussing your question(s) virtually (i.e., via email) is not working for you, I am happy to discuss the question (s) by telephone. When you email me, please include the following: question(s) you would like to discuss (this will allow for me to prepare to discuss your question or concern), the date, and time that you would like to talk, and your telephone number for me to call.
32
COURSE MATERIALS AND SUPPLIES
REQUIRED TEXTS Two textbooks are required for this course.
REQUIRED SOFTWARE One software package is required for this course.
IBM SPSS STATISTICS 25 Great news! You do not have to purchase this software, thanks to TWU. All TWU students have access to this software for FREE.
SPSS Technology Resources: Contact the Technology Service Desk to obtain the current SPSS authorization code. 940-898-3971, email [email protected]
TWU’s Update SPSS License Code Webpage: https://servicecenter.twu.edu/TDClient/KB/ArticleDet?I D=18579
TWU’s Install SPSS Statistics 25 on a PC Webpage: https://servicecenter.twu.edu/TDClient/KB/ArticleDet?I D=15187
TWU’s Install SPSS Statistics 25 on a MAC Webpage: https://servicecenter.twu.edu/TDClient/KB/ArticleDet?I D=23425
Frankfort-Nachmias, Chava, and Anna Leon- Guerrero. 2018. Social Statistics for a Diverse Society, 8th Edition. Thousand Oaks, CA: Sage Publications. ISBN: 9781506347202
Babbie, Earl, R., William E. Wagner, III, and Jeanne Zaino. 2018. Adventures in Social Research: Data Analysis Using IBM® SPSS® Statistics, 10th Edition. Los Angeles, CA: Sage. ISBN-13: 978-1506362779
33
SUPPLIES
• A calculator is strongly recommended for basic calculations on quizzes, homework, and exams.
STUDENT LEARNING OUTCOMES
MEASURABLE STUDENT LEARNING OUTCOMES
Upon successful completion of this course, students will be able to:
1. Explain basic concepts in social statistics. 2. Choose appropriate statistical techniques based on research questions and data. 3. Interpret statistical data. 4. Apply statistical techniques to answering research questions. 5. Perform social data management and analysis using SPSS for Windows.
Each of the above student learning outcomes must be performed at an appropriate level as stated in each course assignment requirements, grading rubric.
METHODS OF ASSESSMENT
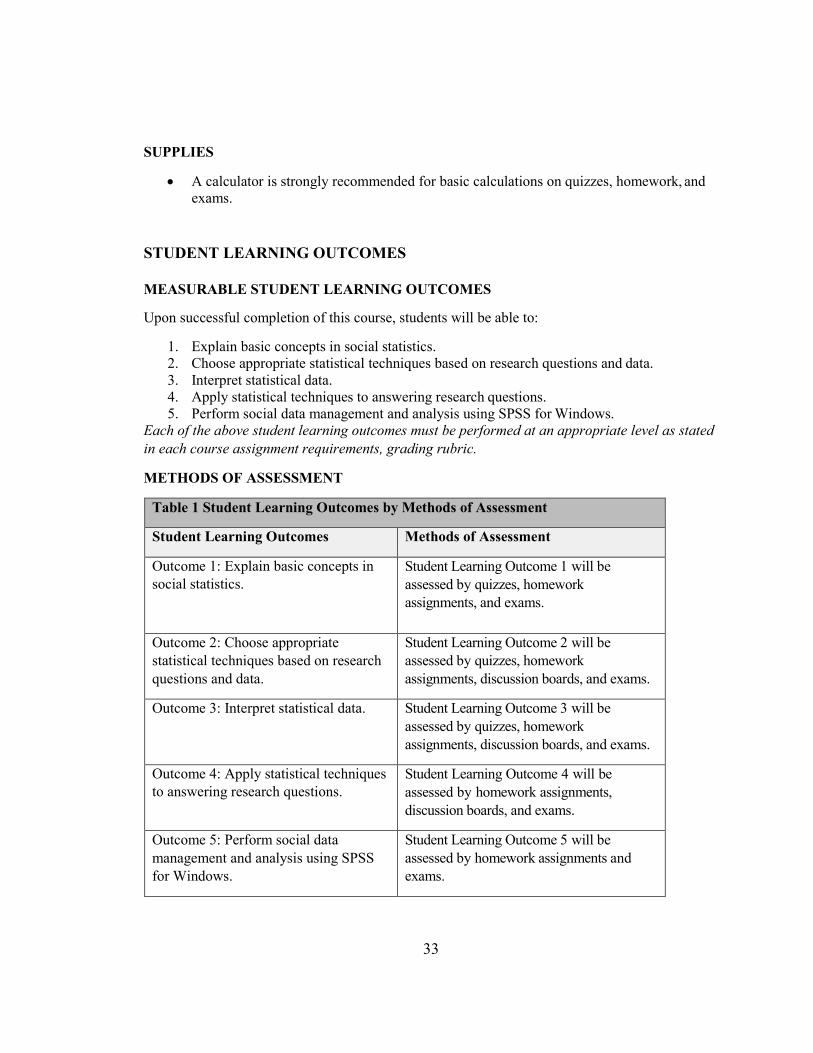
Table 1 Student Learning Outcomes by Methods of Assessment
Student Learning Outcomes Methods of Assessment
Outcome 1: Explain basic concepts in social statistics.
Student Learning Outcome 1 will be assessed by quizzes, homework assignments, and exams.
Outcome 2: Choose appropriate statistical techniques based on research questions and data.
Student Learning Outcome 2 will be assessed by quizzes, homework assignments, discussion boards, and exams.
Outcome 3: Interpret statistical data. Student Learning Outcome 3 will be assessed by quizzes, homework assignments, discussion boards, and exams.
Outcome 4: Apply statistical techniques to answering research questions.
Student Learning Outcome 4 will be assessed by homework assignments, discussion boards, and exams.
Outcome 5: Perform social data management and analysis using SPSS for Windows.
Student Learning Outcome 5 will be assessed by homework assignments and exams.
34
COURSE ASSIGNMENTS AND EXAMINATION DESCRIPTIONS
The following is a brief description of the different assignments and examinations for this course. A more detailed description for each is available on Canvas.
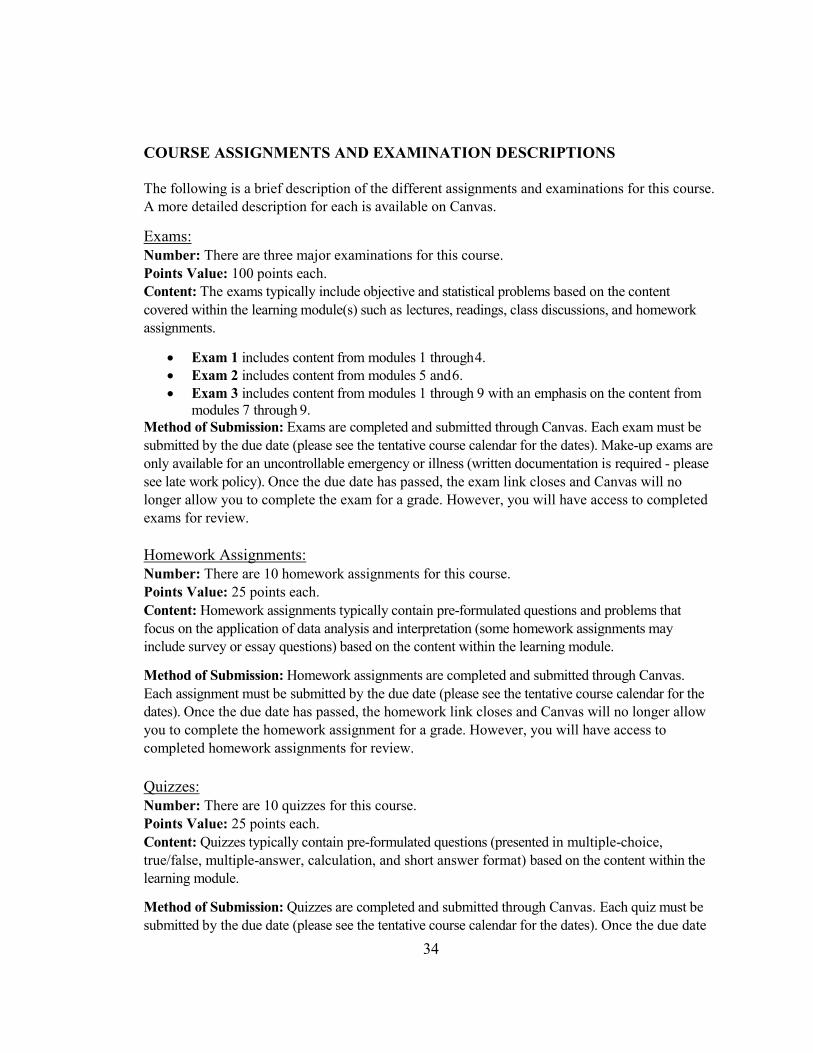
Exams: Number: There are three major examinations for this course. Points Value: 100 points each. Content: The exams typically include objective and statistical problems based on the content covered within the learning module(s) such as lectures, readings, class discussions, and homework assignments.
• Exam 1 includes content from modules 1 through 4. • Exam 2 includes content from modules 5 and 6. • Exam 3 includes content from modules 1 through 9 with an emphasis on the content from
modules 7 through 9. Method of Submission: Exams are completed and submitted through Canvas. Each exam must be submitted by the due date (please see the tentative course calendar for the dates). Make-up exams are only available for an uncontrollable emergency or illness (written documentation is required - please see late work policy). Once the due date has passed, the exam link closes and Canvas will no longer allow you to complete the exam for a grade. However, you will have access to completed exams for review.
Homework Assignments: Number: There are 10 homework assignments for this course. Points Value: 25 points each. Content: Homework assignments typically contain pre-formulated questions and problems that focus on the application of data analysis and interpretation (some homework assignments may include survey or essay questions) based on the content within the learning module.
Method of Submission: Homework assignments are completed and submitted through Canvas. Each assignment must be submitted by the due date (please see the tentative course calendar for the dates). Once the due date has passed, the homework link closes and Canvas will no longer allow you to complete the homework assignment for a grade. However, you will have access to completed homework assignments for review.
Quizzes: Number: There are 10 quizzes for this course. Points Value: 25 points each. Content: Quizzes typically contain pre-formulated questions (presented in multiple-choice, true/false, multiple-answer, calculation, and short answer format) based on the content within the learning module.
Method of Submission: Quizzes are completed and submitted through Canvas. Each quiz must be submitted by the due date (please see the tentative course calendar for the dates). Once the due date
35
has passed, the quiz link closes and Canvas will no longer allow you to complete the quiz for a grade. However, you will have access to completed quizzes for review.
• Syllabus Quiz: This is the first quiz that you will complete in this course. The quiz questions focus on information contained within this syllabus. You complete the quiz on canvas. See course summary on Canvas for due date.
Discussion Boards: Number: There are 10 discussion boards for this course Points Value: 20 total points each (Major post value 15 points and Minor Post value 5).
Content: Since this is an online course we will use Canvas Discussion Boards to facilitate the class participation and attendance. Each module, you will be given questions to answer and discuss amongst your classmates and myself over that module’s readings. Method of Submission: You are required to complete 1 major post and 1 minor post per module (please see tentative course calendar for due dates). A rubric is be used to grade both your major and minor posts. This rubric is available for you to view within our Canvas course.
• Course Introduction Discussion Board Post: This is the first discussion board that you will complete in this course. The purpose of this discussion board is to get to know your classmates and instructor. A list of potential topics to share are posted on canvas. Refer to the course summary section of the syllabus, located at the bottom of the syllabus section in Canvas, for due date.
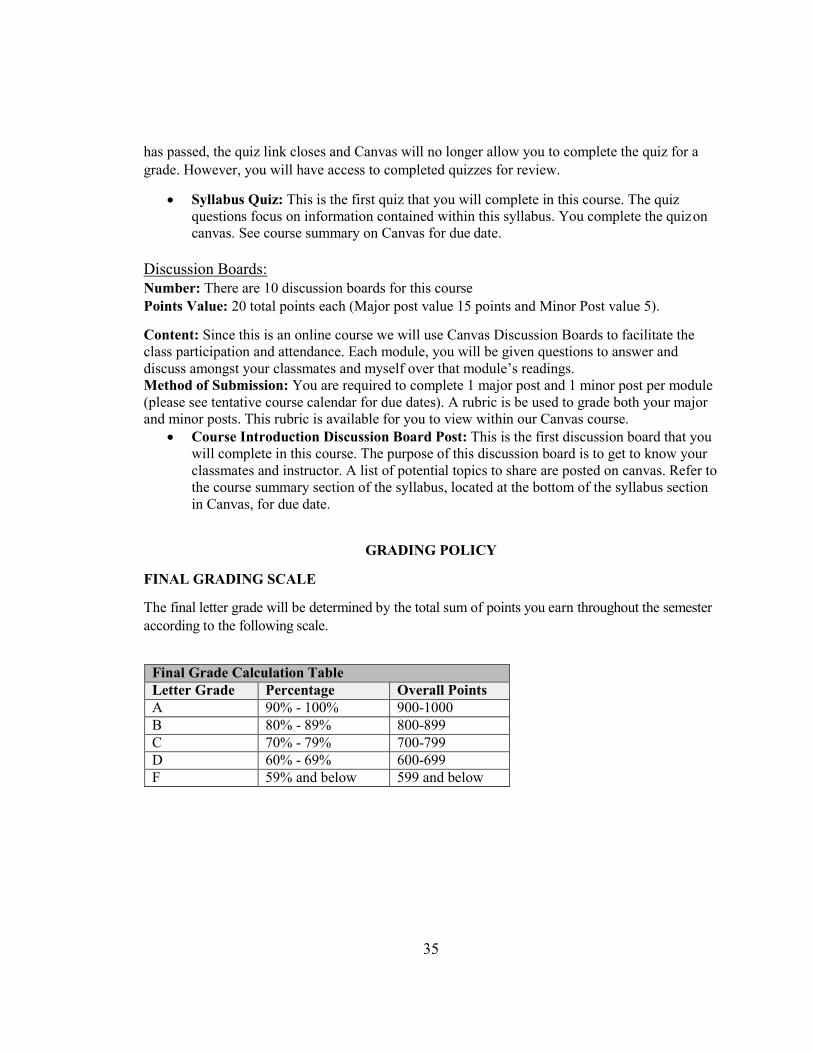
GRADING POLICY
FINAL GRADING SCALE
The final letter grade will be determined by the total sum of points you earn throughout the semester according to the following scale.
Final Grade Calculation Table Letter Grade Percentage Overall Points A 90% - 100% 900-1000 B 80% - 89% 800-899 C 70% - 79% 700-799 D 60% - 69% 600-699 F 59% and below 599 and below
36
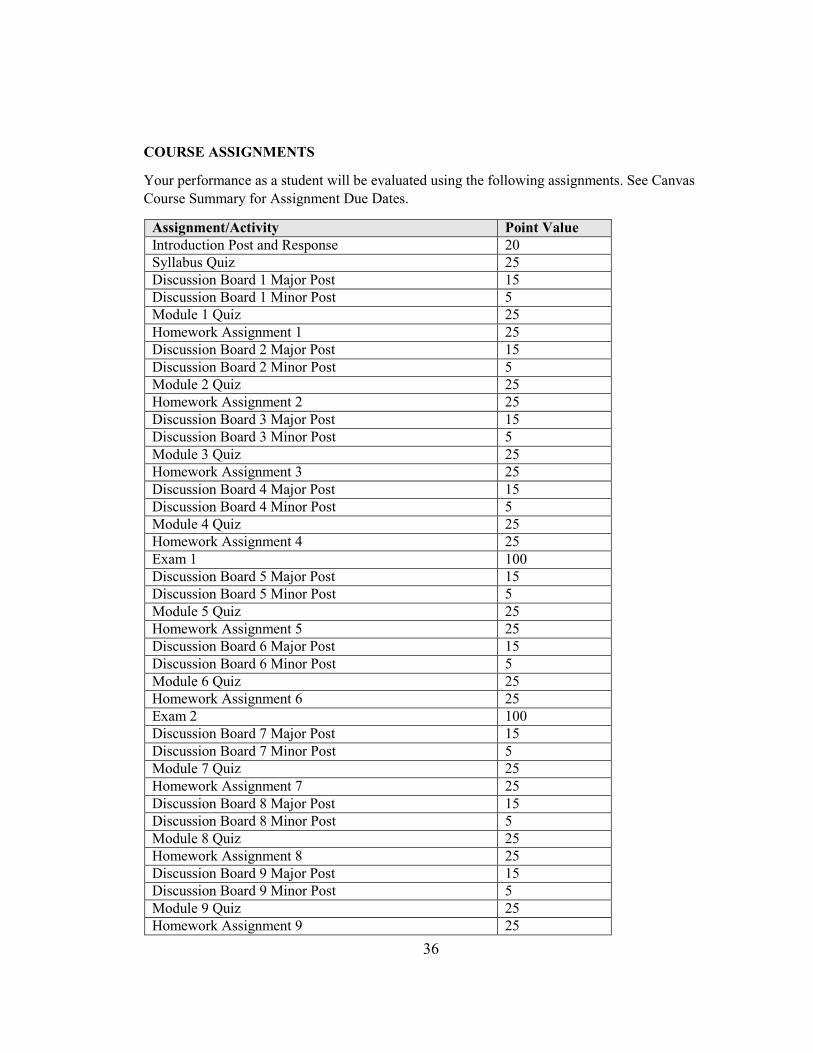
COURSE ASSIGNMENTS
Your performance as a student will be evaluated using the following assignments. See Canvas Course Summary for Assignment Due Dates.
Assignment/Activity Point Value Introduction Post and Response 20 Syllabus Quiz 25 Discussion Board 1 Major Post 15 Discussion Board 1 Minor Post 5 Module 1 Quiz 25 Homework Assignment 1 25 Discussion Board 2 Major Post 15 Discussion Board 2 Minor Post 5 Module 2 Quiz 25 Homework Assignment 2 25 Discussion Board 3 Major Post 15 Discussion Board 3 Minor Post 5 Module 3 Quiz 25 Homework Assignment 3 25 Discussion Board 4 Major Post 15 Discussion Board 4 Minor Post 5 Module 4 Quiz 25 Homework Assignment 4 25 Exam 1 100 Discussion Board 5 Major Post 15 Discussion Board 5 Minor Post 5 Module 5 Quiz 25 Homework Assignment 5 25 Discussion Board 6 Major Post 15 Discussion Board 6 Minor Post 5 Module 6 Quiz 25 Homework Assignment 6 25 Exam 2 100 Discussion Board 7 Major Post 15 Discussion Board 7 Minor Post 5 Module 7 Quiz 25 Homework Assignment 7 25 Discussion Board 8 Major Post 15 Discussion Board 8 Minor Post 5 Module 8 Quiz 25 Homework Assignment 8 25 Discussion Board 9 Major Post 15 Discussion Board 9 Minor Post 5 Module 9 Quiz 25 Homework Assignment 9 25
37
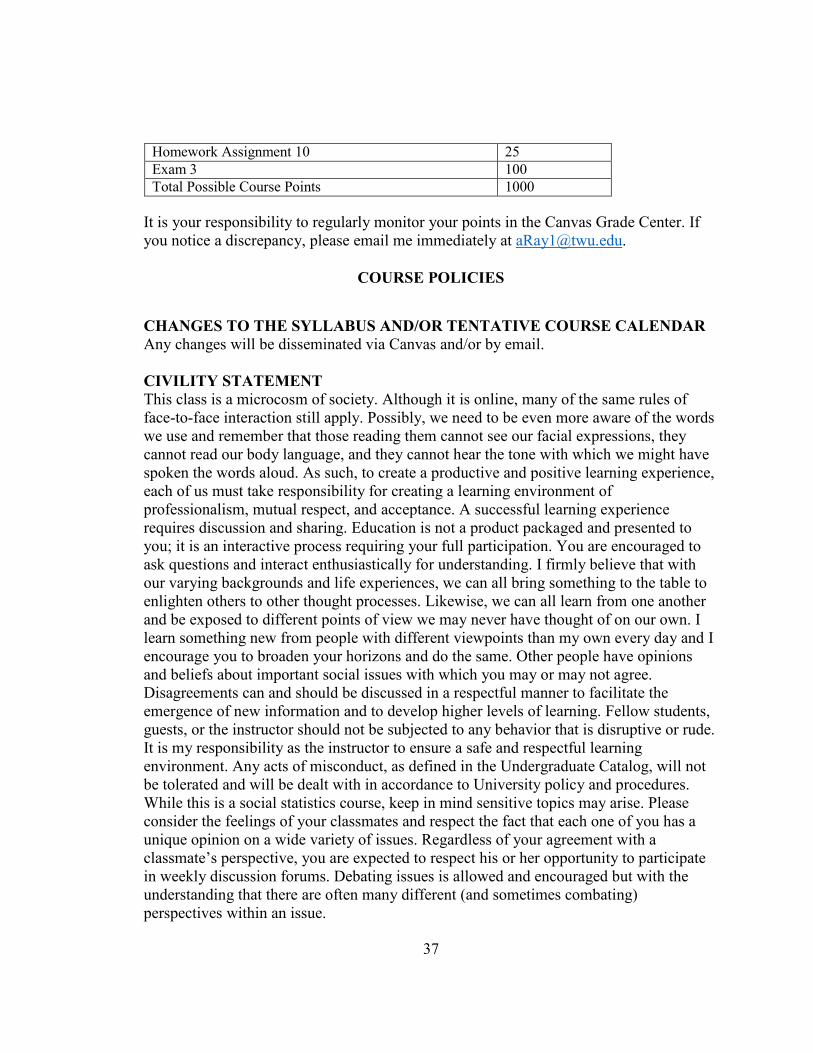
Homework Assignment 10 25 Exam 3 100 Total Possible Course Points 1000
It is your responsibility to regularly monitor your points in the Canvas Grade Center. If you notice a discrepancy, please email me immediately at [email protected].
COURSE POLICIES
CHANGES TO THE SYLLABUS AND/OR TENTATIVE COURSE CALENDAR Any changes will be disseminated via Canvas and/or by email.
CIVILITY STATEMENT This class is a microcosm of society. Although it is online, many of the same rules of face-to-face interaction still apply. Possibly, we need to be even more aware of the words we use and remember that those reading them cannot see our facial expressions, they cannot read our body language, and they cannot hear the tone with which we might have spoken the words aloud. As such, to create a productive and positive learning experience, each of us must take responsibility for creating a learning environment of professionalism, mutual respect, and acceptance. A successful learning experience requires discussion and sharing. Education is not a product packaged and presented to you; it is an interactive process requiring your full participation. You are encouraged to ask questions and interact enthusiastically for understanding. I firmly believe that with our varying backgrounds and life experiences, we can all bring something to the table to enlighten others to other thought processes. Likewise, we can all learn from one another and be exposed to different points of view we may never have thought of on our own. I learn something new from people with different viewpoints than my own every day and I encourage you to broaden your horizons and do the same. Other people have opinions and beliefs about important social issues with which you may or may not agree. Disagreements can and should be discussed in a respectful manner to facilitate the emergence of new information and to develop higher levels of learning. Fellow students, guests, or the instructor should not be subjected to any behavior that is disruptive or rude. It is my responsibility as the instructor to ensure a safe and respectful learning environment. Any acts of misconduct, as defined in the Undergraduate Catalog, will not be tolerated and will be dealt with in accordance to University policy and procedures. While this is a social statistics course, keep in mind sensitive topics may arise. Please consider the feelings of your classmates and respect the fact that each one of you has a unique opinion on a wide variety of issues. Regardless of your agreement with a classmate’s perspective, you are expected to respect his or her opportunity to participate in weekly discussion forums. Debating issues is allowed and encouraged but with the understanding that there are often many different (and sometimes combating) perspectives within an issue.
38
COMPUTER, INTERNET, AND WORD PROCESSING SOFTWARE ACCESS Each of you will need to have regular Internet access to participate in this course. You do not need extensive experience with computers or the Internet, but you do need to have a basic familiarity with web browsing, personal computers, and the Internet.
EMAIED ASSIGNMENTS I do not accept assignments by email. All assignments must be submitted though the appropriate assignment link within the Canvas course.
EMAIL COMMUNICATIONS You are responsible for checking our Canvas course and your TWU email regularly. “I haven’t checked my email” or “I haven’t logged into Canvas” will not be an acceptable excuse for not knowing the latest course information. For protection of your privacy, I will only respond to official TWU email addresses.
Subject Line and Subheading Guideline: Typically, I teach multiple courses each semester. Therefore, to increase response time, it is critical that you include SOCI 3163.50 in the subject line and include a sub-heading with the purpose of the email.
Example 1: SOCI 3163. 50- Quiz 1, Clarification on Question 1 Example 2: SOCI 3163. 50- Homework Assignment, Question 5 Example 3: SOCI 3163. 50 – Office Hour Appointment Request
Instructor Response Time Guideline: I am happy to answer any questions that you may have. I make every effort to respond within 1 to 2 business days. If for some extremely rare reason you do not receive a response within two business days, please email me again and use the following format: SOCI 3163. 50 SECOND REQUEST. Also, please make sure that you email me from your official TWU email account. Often, when students do not use their TWU email account, the emails are automatically filtered into my spam box for some reason.
EXTRA CREDIT Currently, there are no planned or guaranteed extra credit opportunities for this course. If any extra credit opportunities are offered, they are at the discretion of the instructor, and they will be offered to the entire class.
GRADING AND FEEDBACK I use gradebook within Canvas for grading and feedback. To minimize any statistics anxiety, I strive to grade assignments as quickly as possible. I know students like to keep an eye on their progress, so here are some basic guidelines for when you can expect to see grades:
Quizzes and Homework Assignments: I have spent countless hours creating quizzes and homework assignments that are not only graded automatically upon completion by Canvas, but that also provide detailed feedback on each question that was answered incorrectly. I did this because I know how frustrating it can be
39
when you only have a limited amount of time to study because of work, family, or life but then you have to wait for an instructor to grade and provide feedback for assignments. Exams: Examinations are graded by Canvas upon completion. Examinations do not automatically provide feedback for each question that is answered incorrectly.
Discussion Boards: will be graded within 4 business days of the due date for the minor post. These are manually graded. Once graded, you can see the grade along with any comments or feedback by selecting that assignment in Canvas grade book and reading the instructors comments.
If I anticipate a variation in these grading and feedback time frames, I will let the class know (i.e., emergencies and illnesses for example do happen to instructors too) by email or/ announcement. You can help me grade more efficiently by completing assignment on time and refraining from contacting me about missing grades until the above timeframes have elapsed.
LATE WORK Students are expected to meet all deadlines for assignments. Given the modular nature of this course, it is even more important that all deadlines be carefully met. Be sure to check Canvas for announcements at the beginning of each week for any changes. Unless otherwise stated in the syllabus, all coursework is due at 11:59 p.m. on the date listed in Canvas course summary. Late coursework will only be accepted for a documented health issue, pregnancy, or personal/family emergency. Please contact me as soon as possible to let me know. Unfortunately since our course is held in a virtual environment (where we do not have face-to-face contact weekly), if you do not contact me to make me aware that you are experiencing an issue/emergency I won’t know and I will miss the opportunity to try to help you.
READINGS Assigned and recommended readings will help you to understand the material covered in this class. Therefore, you are required to follow the course schedule and read chapters when they are assigned. Any changes to the reading schedule will be communicated via Canvas.
SOCIAL MEDIA As a policy I do not ‘friend’ current students on Facebook. If you have a bad night in class, come to my office hours so we can talk about it. Don’t post it on Facebook, Twitter, your blog, or elsewhere. Academia is a small world -- be cognizant of how your social media activities impact you professionally.
40
TIME MANAGEMENT Please do not underestimate the significant time commitment and amount of effort that a university course requires. You will have reading assignments specified for each week. Plan to begin reading immediately. In order to be successful in this type of class, you must devote time to your readings and give yourself enough time to complete the course assignments. The following can be found on page 64 of the TWU undergraduate catalog: “Students are expected to prepare for classes with a minimum of two to three hours of study for each credit hour” (p.64). Thus, for a 3 credit course, the expectation, at the very minimum, is 6 to 9 hours of study weekly. Keep in mind that this would be in addition to the time that a face-to-face course would require.
TURNITIN SOFTWARE In an effort to ensure the integrity of the academic process, Texas Woman’s University vigorously affirms the importance of academic honesty as defined by the Student Handbook. Therefore, in an effort to detect and prevent plagiarism, faculty members at Texas Woman’s University may now use a tool called TurnItIn to compare a student’s work with multiple sources. It then reports a percentage of similarity and provides links to those specific sources. The tool itself does not determine whether or not a paper has been plagiarized. Instead, that judgment must be made by the individual faculty member. All required assignments in this course may be checked for plagiarism using TurnItIn.
UNIVERSITY POLICIES
ACADEMIC GRADES AND APPEALS POLICY It is the intention of the University to provide students who have complaints and appeals with adequate internal review and to begin resolving them promptly at the level at which the complaint or appeal originated. The faculty member or administrator receiving the complaint or appeal will respond within ten class days not including weekends, holidays, or days between academic sessions. The complaints and procedure form can be found at:https://www.twu.edu/academic-affairs/academic-complaints-appeals/ (Links to an external site.)Links to an external site. Undergraduate Grade Appeals, Advising Issues, & Other Academic Program Issues 1. Faculty Member/Instructor (Grade Appeals only) 2. Chair, Director, or Associate Dean 3. College Dean 4. Associate Provost for Undergraduate Studies and Academic Partnerships (Decision is
final.)
41
ACADEMIC INTEGRITY Honesty in completing assignments is essential to the mission of the University and to the development of the personal integrity of students. In submitting graded assignments, students affirm that they have neither given nor received unauthorized assistance, and that they have abided by all other provisions of the Code of Conduct in the TWU Student Handbook. Cheating, plagiarism, collusion, dual submission of a paper or other kinds of academic dishonesty will not be tolerated and will result in appropriate sanctions that may include failing an assignment, failing the class, removal from an academic program, or being suspended or expelled. Allegations of academic dishonesty in this course may be reported to the Office of Civility and Community Standards. The specific disciplinary process for academic dishonesty is found at https://servicecenter.twu.edu/TDClient/KB/?CategoryID=4608 as part of the TWU Student Code of Conduct. The TWU library link, “Avoiding Plagiarism,” will aid students in completing their assignments with integrity.
DISABILITY SUPPORT POLICY STATEMENT Texas Woman's University strives to make all learning experiences as accessible as possible. If you anticipate or experience academic barriers based on your disability (including mental health, chronic, or temporary medical conditions), please contact me via email/phone or during office hours, so that we may privately discuss options. To establish reasonable accommodations, please register with Disability Services for Students (DSS). After registration, contact me as soon as possible to discuss your accommodations so that they may be implemented in a timely fashion. DSS contact information: [email protected]; 940-898-3835; CFO 106.
Title IX: Students who may need academic accommodations due to pregnancy (including termination of pregnancy, childbirth, and lactation) are encouraged to contact Dr. Stephanie Brown, Associate Vice President for Student Enrichment, Health and Support ([email protected]) and me to discuss your academic needs.
TWU ATTENDANCE POLICY Consistent attendance is vital to academic success and is expected of all students. Grades are determined by academic performance, and instructors may give students written notice that attendance related to specific classroom activities is required. Absences do not exempt students from academic requirements. Excessive absences, even if documented, may result in a student’s failing the course. Excused absences are within the purview of the instructor. Students must consult with instructors regarding make-up work.
42
ADDITIONAL RESOURCES AND INFORMATION
ACCESSING OUR COURSE THROUGH CANVAS We will use Canvas for this course. For those of you who are not familiar with it, Canvas is a web-based course delivery system. It provides private space on a web server that is used for members of a class. No one has access to our classroom "space" except for those who are registered for the course and guests who are added to the course. The space that is set aside for our class includes: space to post documents, a bulletin board to post comments, a Java-based chat room facility, a place to post grades, a section for links to outside resources, personal homepages for students, and several other similar features. You may access the Canvas sign-in page through http://online.twu.edu- I recommend bookmarking this page. You will sign in to the Canvas system by using your Pioneer Portal user ID and password. Please make sure you can access our course and familiarize yourself with the course layout prior to the beginning of class. Each of you will need a Pioneer Portal user ID and password to access the Canvas system. Your Canvas user ID and password will be the same as your Portal user ID. If you have used the Canvas system before, you’re ID and password will remain the same as when you last used it. If you do not know your user ID, you can call the Information Technology Services help desk at 940-898-3971 for assistance.
GETTING STARTED GUIDE If you are new to distance education and/or you have never used the Canvas system, please take the time to become familiar with the system by reviewing the “Getting Started Guide” located at http://www.twu.edu/de/getting-started-guide.asp. If, after reviewing the materials provided through these links, you have questions, concerns, or simply can’t find what you need on Canvas let me know – I’m here to help you.
MATHEMATICS AND TECHNOLOGY SUCCESS CENTER The Mathematics and Technology Success Center (https://twu.edu/mtsc/) is located on the TWU Denton Campus in MCL 307. It is available to assist TWU students in reaching their educational goals in math through individual or group tutoring. Tutoring is provided for TWU students who are enrolled in any courses with math or technology components. They also tutor any statistics course and the statistical software: SAS and SPSS.
SMARTTHINKING Smarthinking is an online tutoring service that provides tutoring in statistics. It is available to undergraduate and graduate students enrolled in at least one Distance Education course. To access Smarthinking:
1. Log-in to your Pioneer Portal Account. 2. Click on "My Tools." 3. Click on "Student Tools."
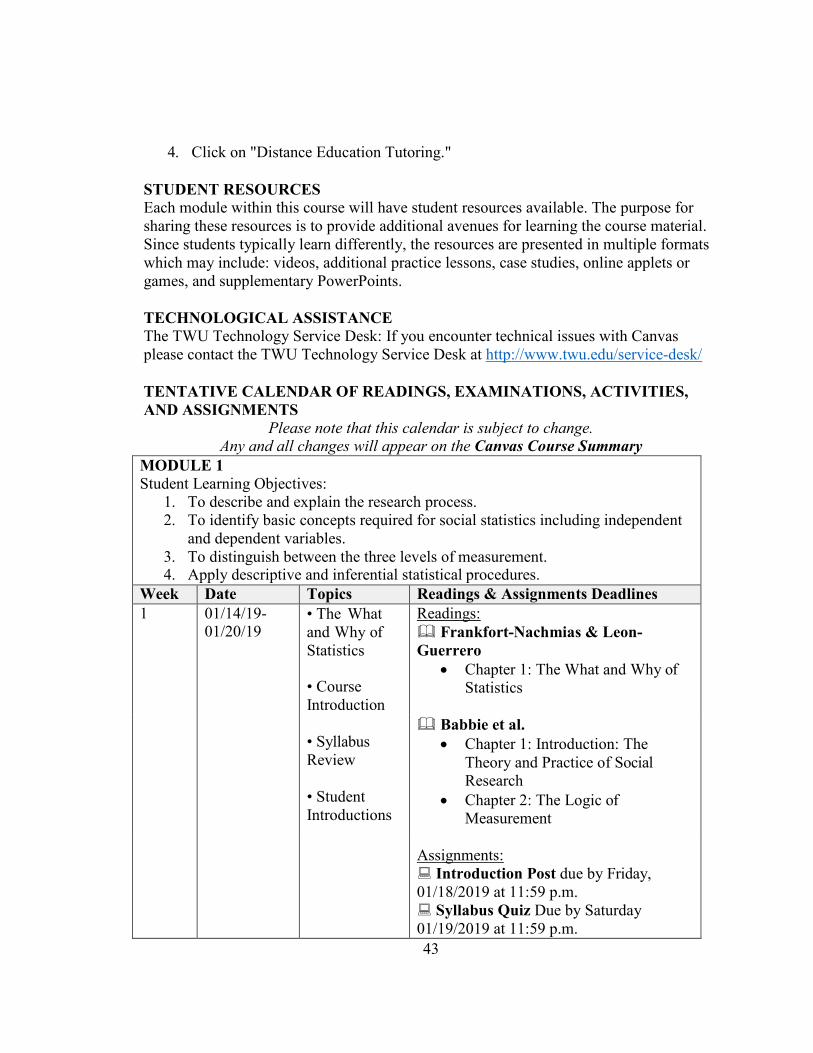
43
4. Click on "Distance Education Tutoring."
STUDENT RESOURCES Each module within this course will have student resources available. The purpose for sharing these resources is to provide additional avenues for learning the course material. Since students typically learn differently, the resources are presented in multiple formats which may include: videos, additional practice lessons, case studies, online applets or games, and supplementary PowerPoints.
TECHNOLOGICAL ASSISTANCE The TWU Technology Service Desk: If you encounter technical issues with Canvas please contact the TWU Technology Service Desk at http://www.twu.edu/service-desk/
TENTATIVE CALENDAR OF READINGS, EXAMINATIONS, ACTIVITIES, AND ASSIGNMENTS
Please note that this calendar is subject to change. Any and all changes will appear on the Canvas Course Summary
MODULE 1 Student Learning Objectives:
1. To describe and explain the research process. 2. To identify basic concepts required for social statistics including independent
and dependent variables. 3. To distinguish between the three levels of measurement. 4. Apply descriptive and inferential statistical procedures.
Week Date Topics Readings & Assignments Deadlines 1 01/14/19-
01/20/19 • The What and Why of Statistics
• Course Introduction
Readings: Frankfort-Nachmias & Leon- Guerrero
• Chapter 1: The What and Why of Statistics
• Syllabus Review
• Student Introductions
Babbie et al. • Chapter 1: Introduction: The
Theory and Practice of Social Research
• Chapter 2: The Logic of Measurement
Assignments: Introduction Post due by Friday, 01/18/2019 at 11:59 p.m. Syllabus Quiz Due by Saturday 01/19/2019 at 11:59 p.m.
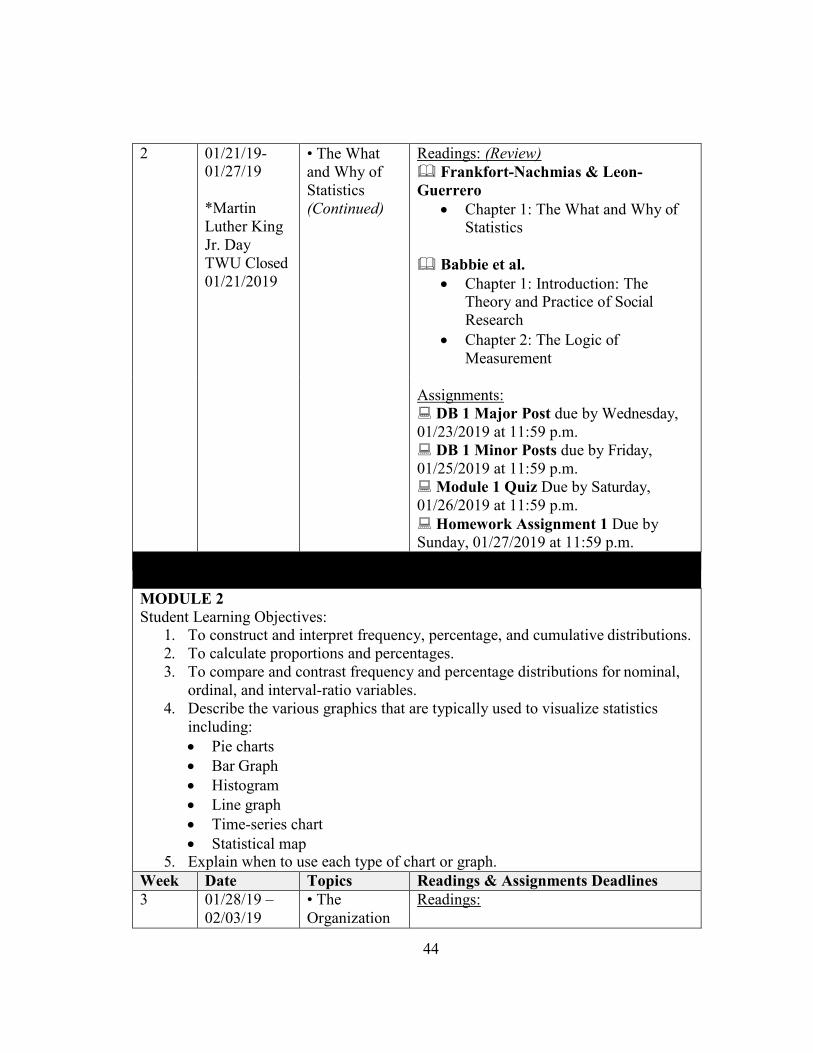
44
2 01/21/19- 01/27/19
*Martin Luther King Jr. Day TWU Closed 01/21/2019
• The What and Why of Statistics (Continued)
Readings: (Review) Frankfort-Nachmias & Leon- Guerrero
• Chapter 1: The What and Why of Statistics
Babbie et al.
• Chapter 1: Introduction: The Theory and Practice of Social Research
• Chapter 2: The Logic of Measurement
Assignments: DB 1 Major Post due by Wednesday, 01/23/2019 at 11:59 p.m. DB 1 Minor Posts due by Friday, 01/25/2019 at 11:59 p.m. Module 1 Quiz Due by Saturday, 01/26/2019 at 11:59 p.m. Homework Assignment 1 Due by Sunday, 01/27/2019 at 11:59 p.m.
MODULE 2 Student Learning Objectives:
1. To construct and interpret frequency, percentage, and cumulative distributions. 2. To calculate proportions and percentages. 3. To compare and contrast frequency and percentage distributions for nominal,
ordinal, and interval-ratio variables. 4. Describe the various graphics that are typically used to visualize statistics
including: • Pie charts • Bar Graph • Histogram • Line graph • Time-series chart • Statistical map
5. Explain when to use each type of chart or graph. Week Date Topics Readings & Assignments Deadlines 3 01/28/19 – • The Readings:
02/03/19 Organization
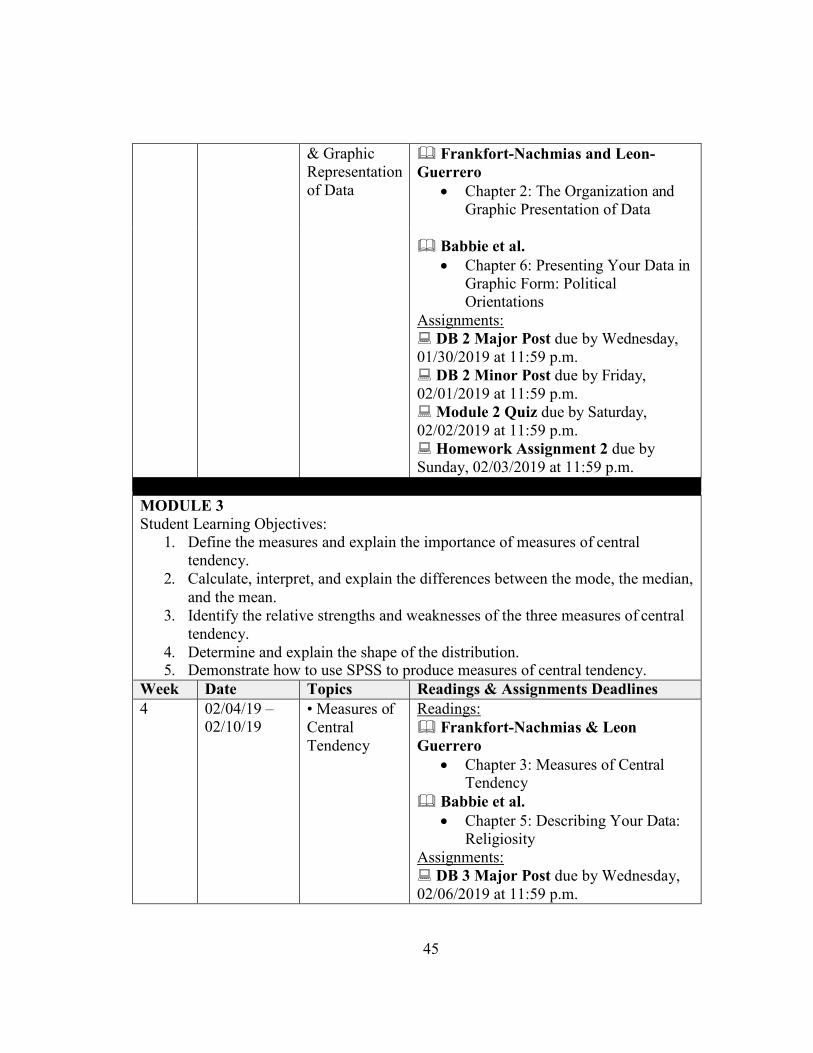
45
& Graphic Representation of Data
Frankfort-Nachmias and Leon- Guerrero
• Chapter 2: The Organization and Graphic Presentation of Data
Babbie et al. • Chapter 6: Presenting Your Data in
Graphic Form: Political Orientations
Assignments: DB 2 Major Post due by Wednesday, 01/30/2019 at 11:59 p.m. DB 2 Minor Post due by Friday, 02/01/2019 at 11:59 p.m. Module 2 Quiz due by Saturday, 02/02/2019 at 11:59 p.m. Homework Assignment 2 due by Sunday, 02/03/2019 at 11:59 p.m.
MODULE 3 Student Learning Objectives:
1. Define the measures and explain the importance of measures of central tendency.
2. Calculate, interpret, and explain the differences between the mode, the median, and the mean.
3. Identify the relative strengths and weaknesses of the three measures of central tendency.
4. Determine and explain the shape of the distribution. 5. Demonstrate how to use SPSS to produce measures of central tendency.
Week Date Topics Readings & Assignments Deadlines 4 02/04/19 –
02/10/19 • Measures of Central Tendency
Readings: Frankfort-Nachmias & Leon Guerrero
• Chapter 3: Measures of Central Tendency
Babbie et al. • Chapter 5: Describing Your Data:
Religiosity Assignments: DB 3 Major Post due by Wednesday, 02/06/2019 at 11:59 p.m.
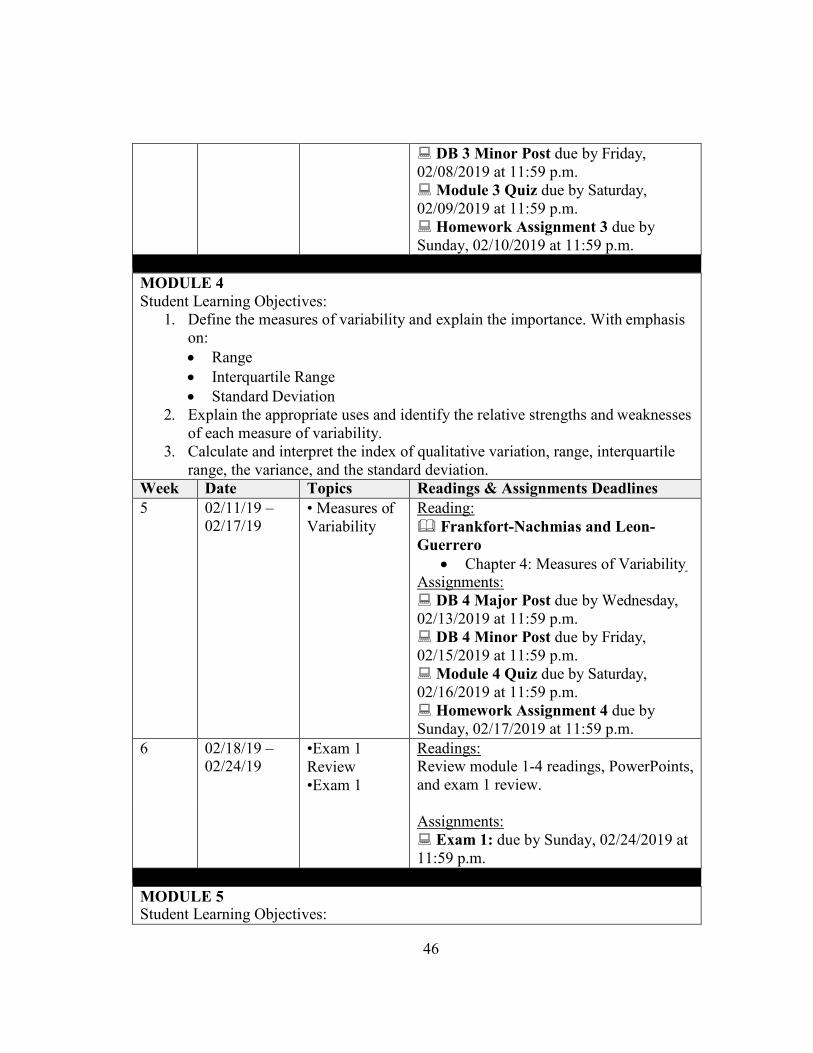
46
DB 3 Minor Post due by Friday, 02/08/2019 at 11:59 p.m. Module 3 Quiz due by Saturday, 02/09/2019 at 11:59 p.m. Homework Assignment 3 due by Sunday, 02/10/2019 at 11:59 p.m.
MODULE 4 Student Learning Objectives:
1. Define the measures of variability and explain the importance. With emphasis on: • Range • Interquartile Range • Standard Deviation
2. Explain the appropriate uses and identify the relative strengths and weaknesses of each measure of variability.
3. Calculate and interpret the index of qualitative variation, range, interquartile range, the variance, and the standard deviation.
Week Date Topics Readings & Assignments Deadlines 5 02/11/19 –
02/17/19 • Measures of Variability
Reading: Frankfort-Nachmias and Leon- Guerrero
• Chapter 4: Measures of Variability Assignments: DB 4 Major Post due by Wednesday, 02/13/2019 at 11:59 p.m. DB 4 Minor Post due by Friday, 02/15/2019 at 11:59 p.m. Module 4 Quiz due by Saturday, 02/16/2019 at 11:59 p.m. Homework Assignment 4 due by Sunday, 02/17/2019 at 11:59 p.m.
6 02/18/19 – 02/24/19
•Exam 1 Review •Exam 1
Readings: Review module 1-4 readings, PowerPoints, and exam 1 review.
Assignments: Exam 1: due by Sunday, 02/24/2019 at 11:59 p.m.
MODULE 5 Student Learning Objectives:
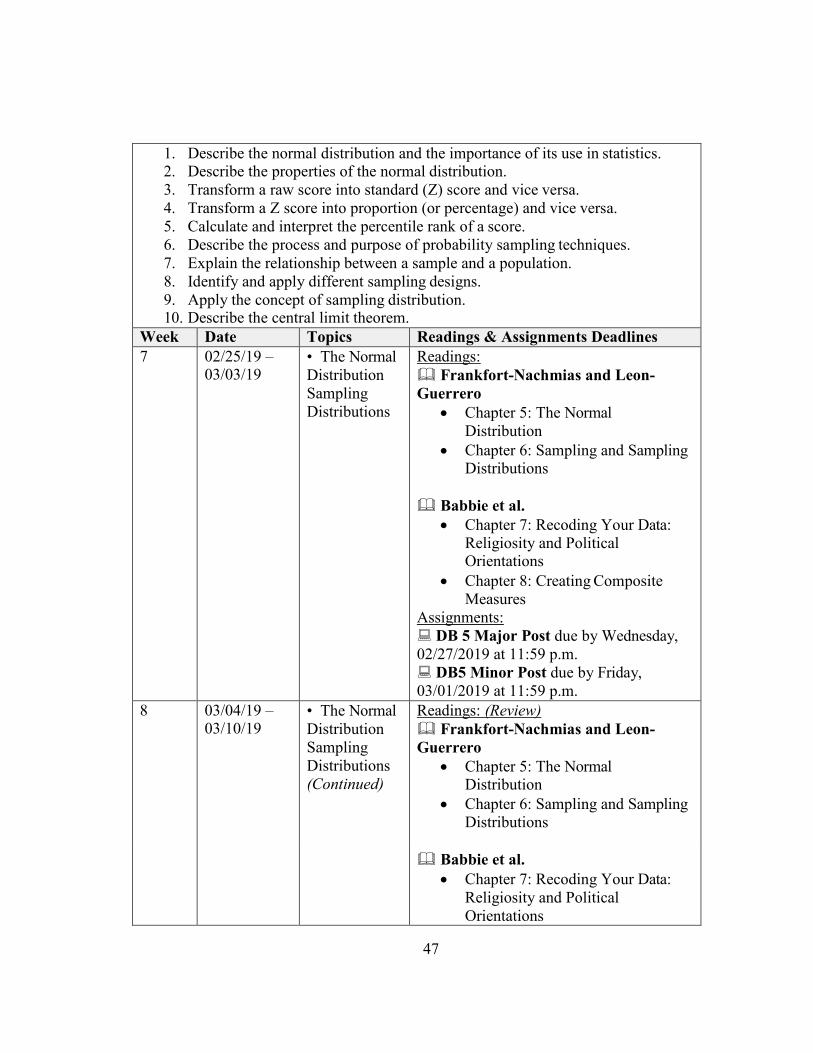
47
1. Describe the normal distribution and the importance of its use in statistics. 2. Describe the properties of the normal distribution. 3. Transform a raw score into standard (Z) score and vice versa. 4. Transform a Z score into proportion (or percentage) and vice versa. 5. Calculate and interpret the percentile rank of a score. 6. Describe the process and purpose of probability sampling techniques. 7. Explain the relationship between a sample and a population. 8. Identify and apply different sampling designs. 9. Apply the concept of sampling distribution. 10. Describe the central limit theorem.
Week Date Topics Readings & Assignments Deadlines 7 02/25/19 –
03/03/19 • The Normal Distribution Sampling Distributions
Readings: Frankfort-Nachmias and Leon- Guerrero
• Chapter 5: The Normal Distribution
• Chapter 6: Sampling and Sampling Distributions
Babbie et al.
• Chapter 7: Recoding Your Data: Religiosity and Political Orientations
• Chapter 8: Creating Composite Measures
Assignments: DB 5 Major Post due by Wednesday, 02/27/2019 at 11:59 p.m. DB5 Minor Post due by Friday, 03/01/2019 at 11:59 p.m.
8 03/04/19 – 03/10/19
• The Normal Distribution Sampling Distributions (Continued)
Readings: (Review) Frankfort-Nachmias and Leon- Guerrero
• Chapter 5: The Normal Distribution
• Chapter 6: Sampling and Sampling Distributions
Babbie et al.
• Chapter 7: Recoding Your Data: Religiosity and Political Orientations
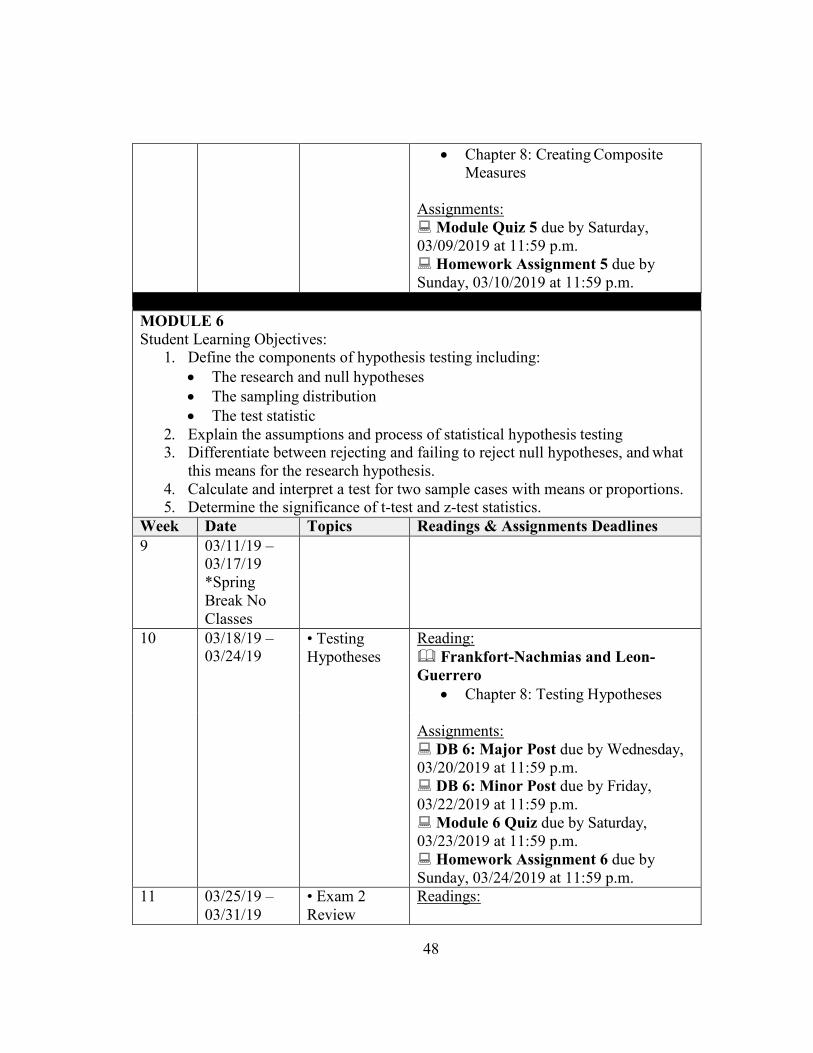
48
• Chapter 8: Creating Composite Measures
Assignments: Module Quiz 5 due by Saturday, 03/09/2019 at 11:59 p.m. Homework Assignment 5 due by Sunday, 03/10/2019 at 11:59 p.m.
MODULE 6 Student Learning Objectives:
1. Define the components of hypothesis testing including: • The research and null hypotheses • The sampling distribution • The test statistic
2. Explain the assumptions and process of statistical hypothesis testing 3. Differentiate between rejecting and failing to reject null hypotheses, and what
this means for the research hypothesis. 4. Calculate and interpret a test for two sample cases with means or proportions. 5. Determine the significance of t-test and z-test statistics.
Week Date Topics Readings & Assignments Deadlines 9 03/11/19 –
03/17/19 *Spring Break No Classes
10 03/18/19 – 03/24/19
• Testing Hypotheses
Reading: Frankfort-Nachmias and Leon- Guerrero
• Chapter 8: Testing Hypotheses
Assignments: DB 6: Major Post due by Wednesday, 03/20/2019 at 11:59 p.m. DB 6: Minor Post due by Friday, 03/22/2019 at 11:59 p.m. Module 6 Quiz due by Saturday, 03/23/2019 at 11:59 p.m. Homework Assignment 6 due by Sunday, 03/24/2019 at 11:59 p.m.
11 03/25/19 – • Exam 2 Readings: 03/31/19 Review
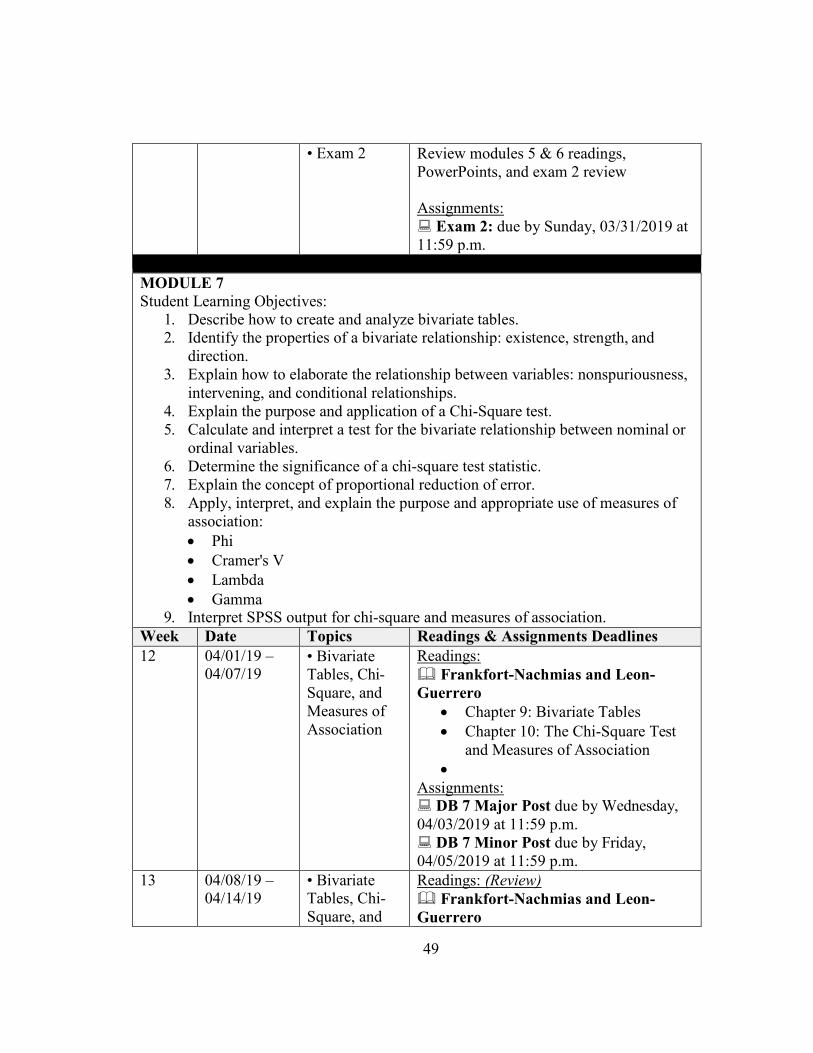
49
• Exam 2 Review modules 5 & 6 readings, PowerPoints, and exam 2 review
Assignments: Exam 2: due by Sunday, 03/31/2019 at 11:59 p.m.
MODULE 7 Student Learning Objectives:
1. Describe how to create and analyze bivariate tables. 2. Identify the properties of a bivariate relationship: existence, strength, and
direction. 3. Explain how to elaborate the relationship between variables: nonspuriousness,
intervening, and conditional relationships. 4. Explain the purpose and application of a Chi-Square test. 5. Calculate and interpret a test for the bivariate relationship between nominal or
ordinal variables. 6. Determine the significance of a chi-square test statistic. 7. Explain the concept of proportional reduction of error. 8. Apply, interpret, and explain the purpose and appropriate use of measures of
association: • Phi • Cramer's V • Lambda • Gamma
9. Interpret SPSS output for chi-square and measures of association. Week Date Topics Readings & Assignments Deadlines 12 04/01/19 –
04/07/19 • Bivariate Tables, Chi- Square, and Measures of Association
Readings: Frankfort-Nachmias and Leon- Guerrero
• Chapter 9: Bivariate Tables • Chapter 10: The Chi-Square Test
and Measures of Association •
Assignments: DB 7 Major Post due by Wednesday, 04/03/2019 at 11:59 p.m. DB 7 Minor Post due by Friday, 04/05/2019 at 11:59 p.m.
13 04/08/19 – 04/14/19
• Bivariate Tables, Chi- Square, and
Readings: (Review) Frankfort-Nachmias and Leon- Guerrero
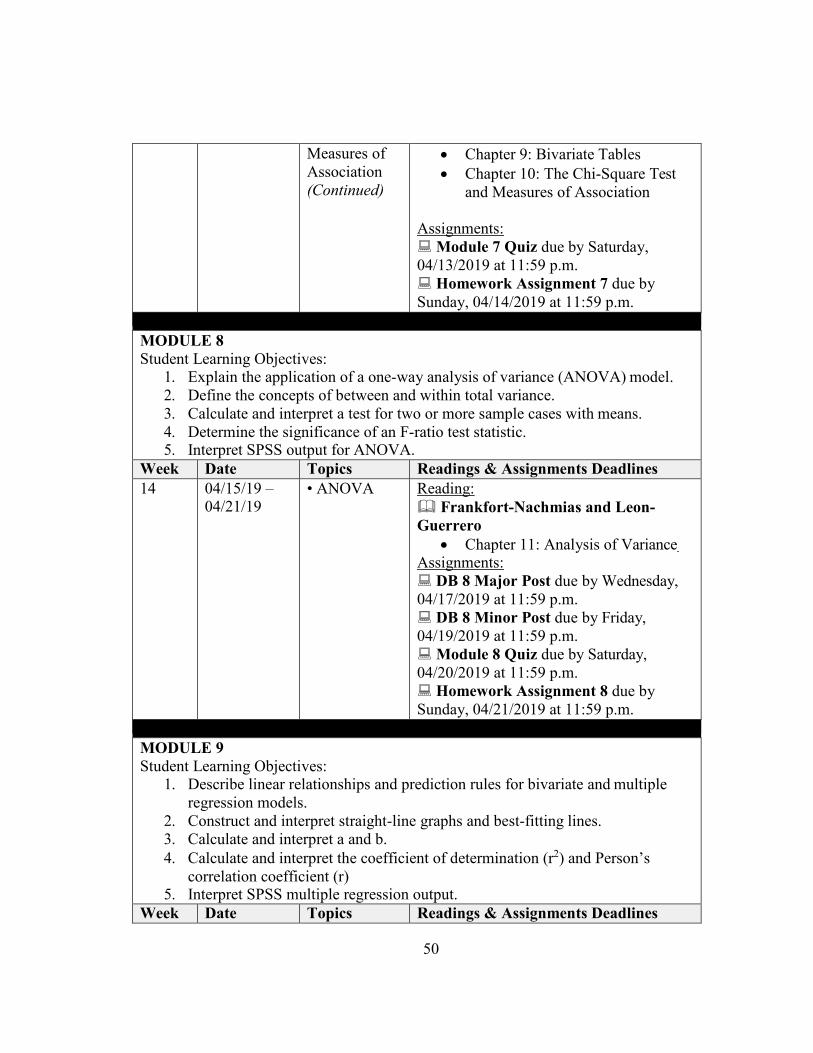
50
Measures of Association (Continued)
• Chapter 9: Bivariate Tables • Chapter 10: The Chi-Square Test
and Measures of Association Assignments: Module 7 Quiz due by Saturday, 04/13/2019 at 11:59 p.m. Homework Assignment 7 due by Sunday, 04/14/2019 at 11:59 p.m.
MODULE 8 Student Learning Objectives:
1. Explain the application of a one-way analysis of variance (ANOVA) model. 2. Define the concepts of between and within total variance. 3. Calculate and interpret a test for two or more sample cases with means. 4. Determine the significance of an F-ratio test statistic. 5. Interpret SPSS output for ANOVA.
Week Date Topics Readings & Assignments Deadlines 14 04/15/19 –
04/21/19 • ANOVA Reading:
Frankfort-Nachmias and Leon- Guerrero
• Chapter 11: Analysis of Variance Assignments: DB 8 Major Post due by Wednesday, 04/17/2019 at 11:59 p.m. DB 8 Minor Post due by Friday, 04/19/2019 at 11:59 p.m. Module 8 Quiz due by Saturday, 04/20/2019 at 11:59 p.m. Homework Assignment 8 due by Sunday, 04/21/2019 at 11:59 p.m.
MODULE 9 Student Learning Objectives:
1. Describe linear relationships and prediction rules for bivariate and multiple regression models.
2. Construct and interpret straight-line graphs and best-fitting lines. 3. Calculate and interpret a and b. 4. Calculate and interpret the coefficient of determination (r2) and Person’s
correlation coefficient (r) 5. Interpret SPSS multiple regression output.
Week Date Topics Readings & Assignments Deadlines
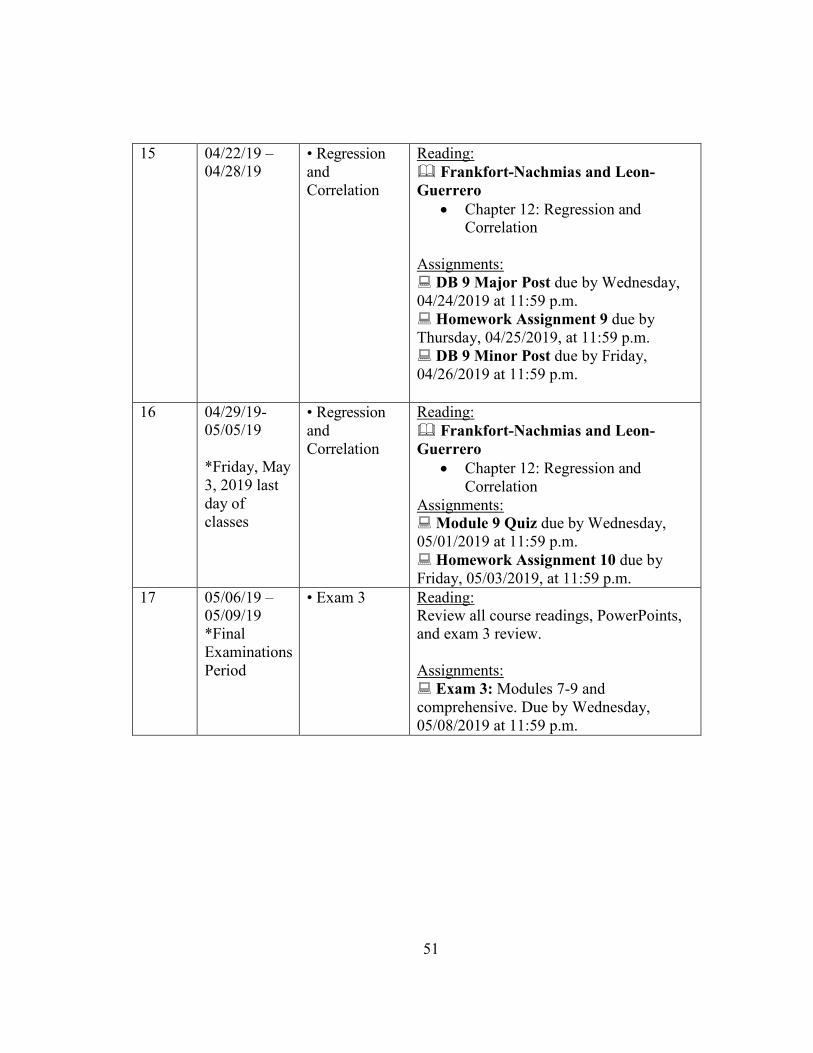
51
15 04/22/19 – 04/28/19
• Regression and Correlation
Reading: Frankfort-Nachmias and Leon- Guerrero
• Chapter 12: Regression and Correlation
Assignments: DB 9 Major Post due by Wednesday, 04/24/2019 at 11:59 p.m. Homework Assignment 9 due by Thursday, 04/25/2019, at 11:59 p.m. DB 9 Minor Post due by Friday, 04/26/2019 at 11:59 p.m.
16 04/29/19- 05/05/19
*Friday, May 3, 2019 last day of classes
• Regression and Correlation
Reading: Frankfort-Nachmias and Leon- Guerrero
• Chapter 12: Regression and Correlation
Assignments: Module 9 Quiz due by Wednesday, 05/01/2019 at 11:59 p.m. Homework Assignment 10 due by Friday, 05/03/2019, at 11:59 p.m.
17 05/06/19 – 05/09/19 *Final Examinations Period
• Exam 3 Reading: Review all course readings, PowerPoints, and exam 3 review.
Assignments: Exam 3: Modules 7-9 and comprehensive. Due by Wednesday, 05/08/2019 at 11:59 p.m.

52
APPENDIX B
MODULE CHECKLIST EXAMPLE
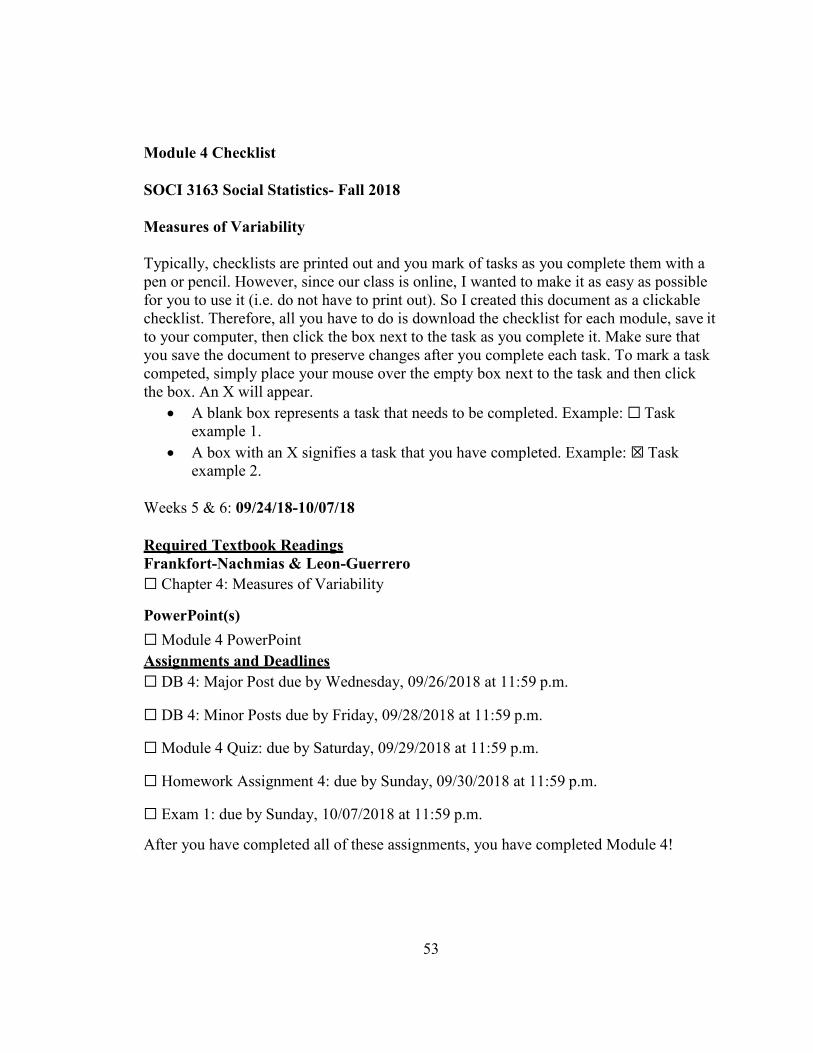
53
Module 4 Checklist
SOCI 3163 Social Statistics- Fall 2018
Measures of Variability
Typically, checklists are printed out and you mark of tasks as you complete them with a pen or pencil. However, since our class is online, I wanted to make it as easy as possible for you to use it (i.e. do not have to print out). So I created this document as a clickable checklist. Therefore, all you have to do is download the checklist for each module, save it to your computer, then click the box next to the task as you complete it. Make sure that you save the document to preserve changes after you complete each task. To mark a task competed, simply place your mouse over the empty box next to the task and then click the box. An X will appear.
• A blank box represents a task that needs to be completed. Example: ☐ Task example 1.
• A box with an X signifies a task that you have completed. Example: ☒ Task example 2.
Weeks 5 & 6: 09/24/18-10/07/18
Required Textbook Readings Frankfort-Nachmias & Leon-Guerrero ☐ Chapter 4: Measures of Variability
PowerPoint(s) ☐ Module 4 PowerPoint Assignments and Deadlines ☐ DB 4: Major Post due by Wednesday, 09/26/2018 at 11:59 p.m.
☐ DB 4: Minor Posts due by Friday, 09/28/2018 at 11:59 p.m.
☐ Module 4 Quiz: due by Saturday, 09/29/2018 at 11:59 p.m.
☐ Homework Assignment 4: due by Sunday, 09/30/2018 at 11:59 p.m.
☐ Exam 1: due by Sunday, 10/07/2018 at 11:59 p.m.
After you have completed all of these assignments, you have completed Module 4!

54
APPENDIX C
GRADE CALCULATION SHEET EXAMPLE
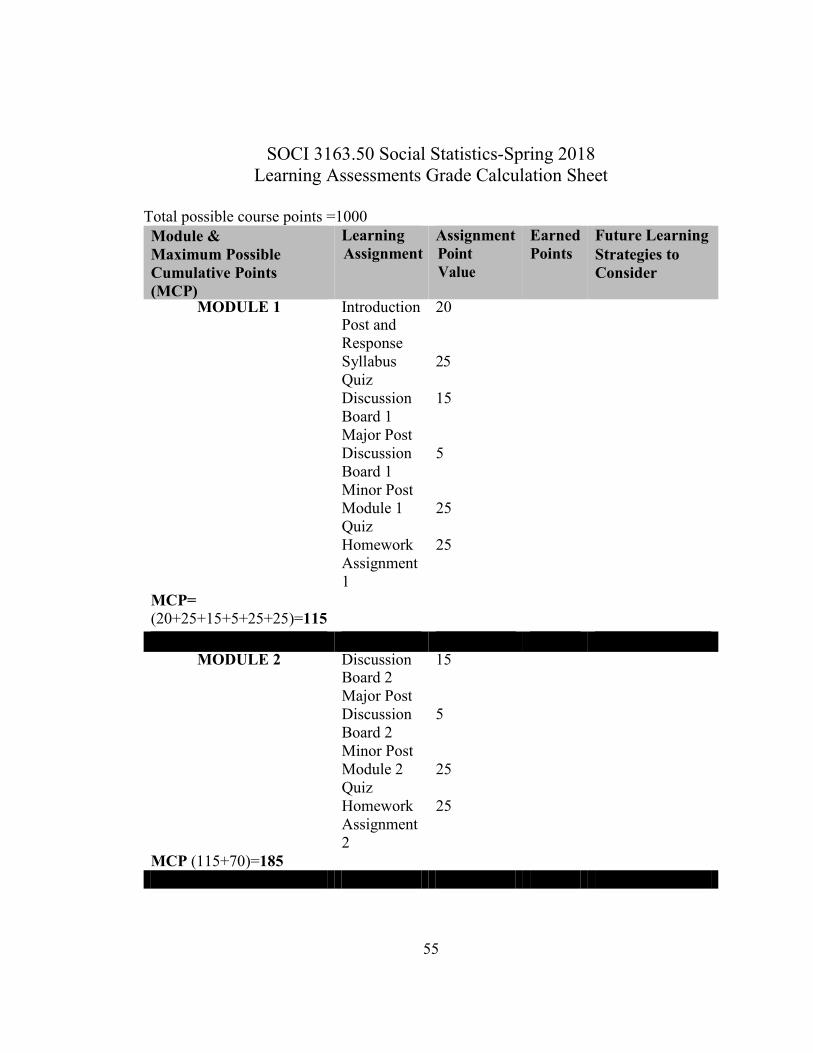
55
SOCI 3163.50 Social Statistics-Spring 2018 Learning Assessments Grade Calculation Sheet
Total possible course points =1000
MODULE 1 Introduction 20
Post and Response Syllabus 25 Quiz Discussion 15 Board 1 Major Post Discussion 5 Board 1 Minor Post Module 1 25 Quiz Homework 25 Assignment 1
MCP= (20+25+15+5+25+25)=115
MODULE 2 Discussion 15 Board 2 Major Post Discussion 5 Board 2 Minor Post Module 2 25 Quiz Homework 25 Assignment 2
MCP (115+70)=185
Strategies to Consider
Points Assignment Point
Learning Assignment Earned Future Learning Module & Maximum Possible Cumulative Points (MCP)
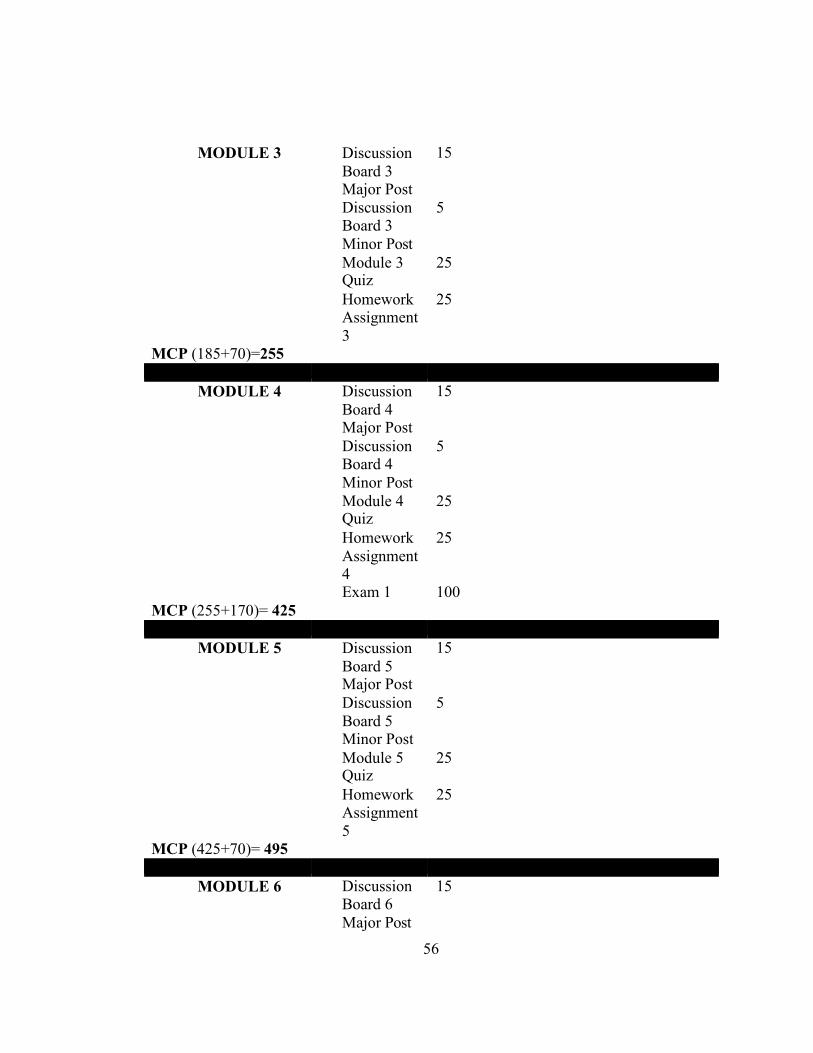
56
MODULE 3 Discussion Board 3 Major Post
15
Discussion Board 3 Minor Post
5
Module 3 Quiz
25
Homework Assignment 3
25
MCP (185+70)=255
MODULE 4 Discussion Board 4 Major Post
15
Discussion Board 4 Minor Post
5
Module 4 Quiz
25
Homework Assignment 4
25
Exam 1 100 MCP (255+170)= 425
MODULE 5 Discussion
Board 5 Major Post
15
Discussion Board 5 Minor Post
5
Module 5 Quiz
25
Homework Assignment 5
25
MCP (425+70)= 495
MODULE 6 Discussion Board 6 Major Post
15
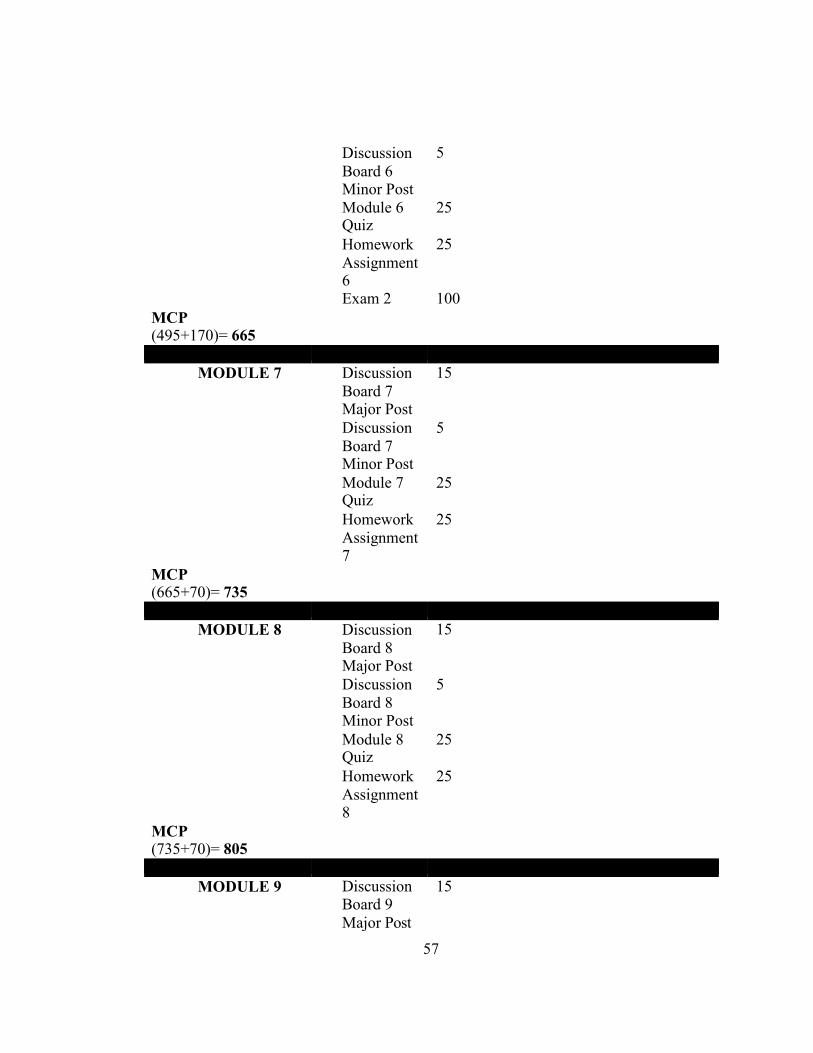
57
Discussion Board 6 Minor Post
5
Module 6 Quiz
25
Homework Assignment 6
25
Exam 2 100 MCP (495+170)= 665
MODULE 7 Discussion
Board 7 Major Post
15
Discussion Board 7 Minor Post
5
Module 7 Quiz
25
Homework Assignment 7
25
MCP (665+70)= 735
MODULE 8 Discussion
Board 8 Major Post
15
Discussion Board 8 Minor Post
5
Module 8 Quiz
25
Homework Assignment 8
25
MCP (735+70)= 805
MODULE 9 Discussion
Board 9 Major Post
15
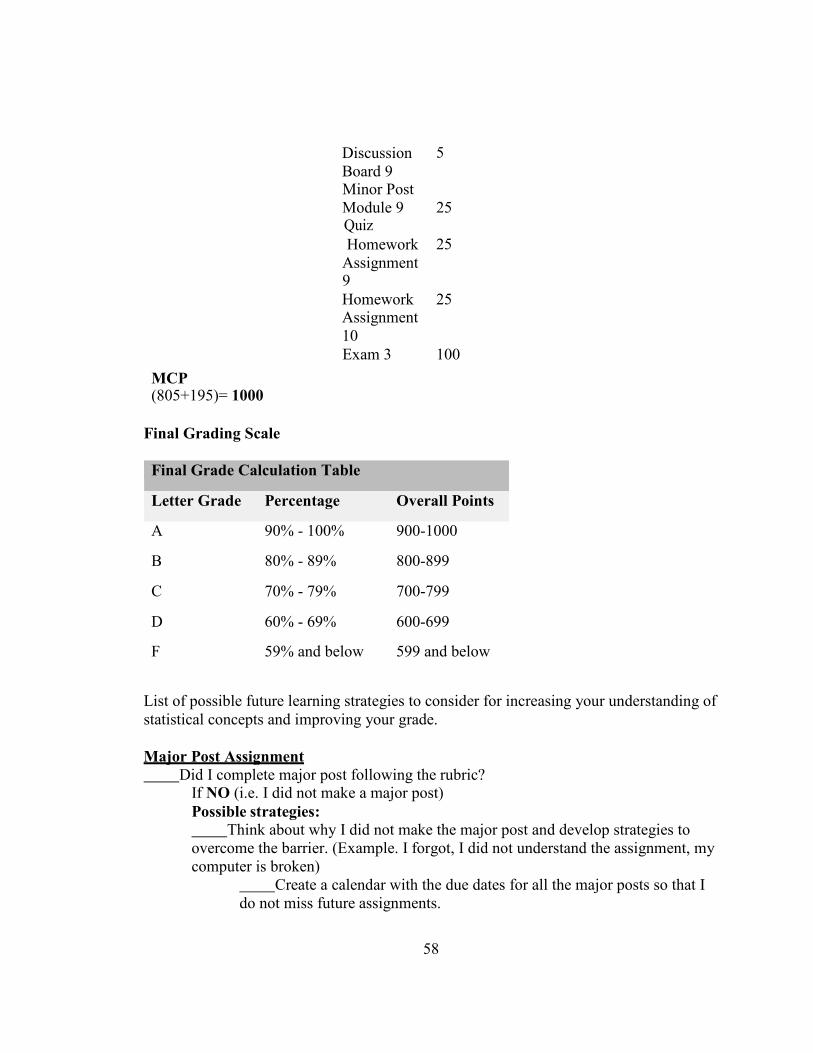
58
Discussion Board 9 Minor Post
5
Module 9 Quiz
25
Homework Assignment 9
25
Homework Assignment 10
25
Exam 3 100 MCP (805+195)= 1000
Final Grading Scale
Final Grade Calculation Table
Letter Grade Percentage Overall Points
A 90% - 100% 900-1000
B 80% - 89% 800-899
C 70% - 79% 700-799
D 60% - 69% 600-699
F 59% and below 599 and below
List of possible future learning strategies to consider for increasing your understanding of statistical concepts and improving your grade.
Major Post Assignment Did I complete major post following the rubric?
If NO (i.e. I did not make a major post) Possible strategies: Think about why I did not make the major post and develop strategies to overcome the barrier. (Example. I forgot, I did not understand the assignment, my computer is broken)
Create a calendar with the due dates for all the major posts so that I do not miss future assignments.
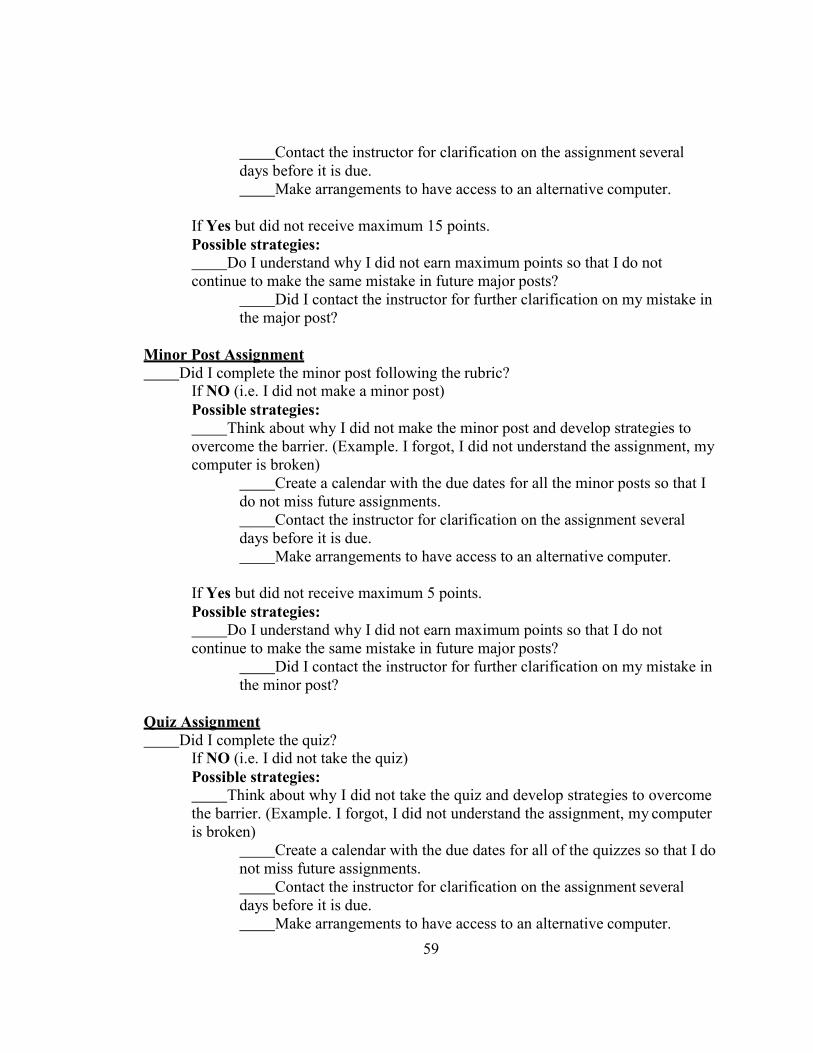
59
Contact the instructor for clarification on the assignment several days before it is due. Make arrangements to have access to an alternative computer.
If Yes but did not receive maximum 15 points. Possible strategies: Do I understand why I did not earn maximum points so that I do not continue to make the same mistake in future major posts?
Did I contact the instructor for further clarification on my mistake in the major post?
Minor Post Assignment Did I complete the minor post following the rubric?
If NO (i.e. I did not make a minor post) Possible strategies: Think about why I did not make the minor post and develop strategies to overcome the barrier. (Example. I forgot, I did not understand the assignment, my computer is broken)
Create a calendar with the due dates for all the minor posts so that I do not miss future assignments. Contact the instructor for clarification on the assignment several days before it is due. Make arrangements to have access to an alternative computer.
If Yes but did not receive maximum 5 points. Possible strategies: Do I understand why I did not earn maximum points so that I do not continue to make the same mistake in future major posts?
Did I contact the instructor for further clarification on my mistake in the minor post?
Quiz Assignment Did I complete the quiz?
If NO (i.e. I did not take the quiz) Possible strategies: Think about why I did not take the quiz and develop strategies to overcome the barrier. (Example. I forgot, I did not understand the assignment, my computer is broken)
Create a calendar with the due dates for all of the quizzes so that I do not miss future assignments. Contact the instructor for clarification on the assignment several days before it is due. Make arrangements to have access to an alternative computer.
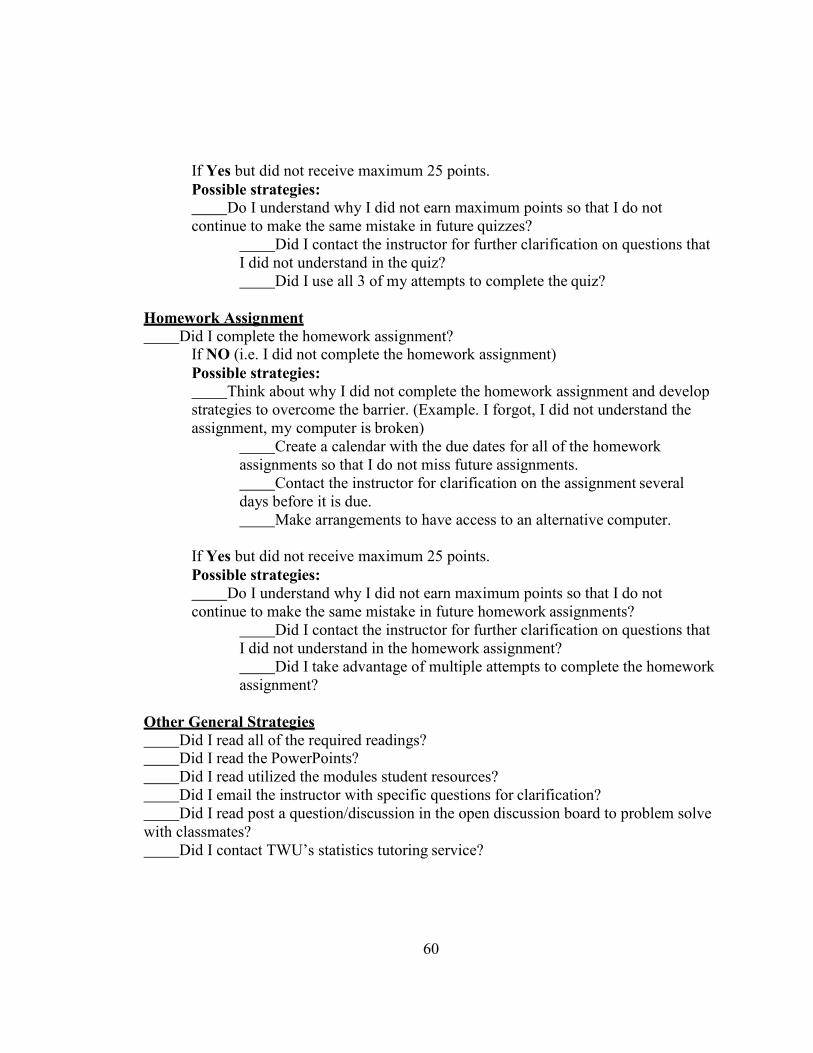
60
If Yes but did not receive maximum 25 points. Possible strategies: Do I understand why I did not earn maximum points so that I do not continue to make the same mistake in future quizzes?
Did I contact the instructor for further clarification on questions that I did not understand in the quiz? Did I use all 3 of my attempts to complete the quiz?
Homework Assignment Did I complete the homework assignment?
If NO (i.e. I did not complete the homework assignment) Possible strategies: Think about why I did not complete the homework assignment and develop strategies to overcome the barrier. (Example. I forgot, I did not understand the assignment, my computer is broken)
Create a calendar with the due dates for all of the homework assignments so that I do not miss future assignments. Contact the instructor for clarification on the assignment several days before it is due. Make arrangements to have access to an alternative computer.
If Yes but did not receive maximum 25 points. Possible strategies: Do I understand why I did not earn maximum points so that I do not continue to make the same mistake in future homework assignments?
Did I contact the instructor for further clarification on questions that I did not understand in the homework assignment? Did I take advantage of multiple attempts to complete the homework assignment?
Other General Strategies Did I read all of the required readings? Did I read the PowerPoints? Did I read utilized the modules student resources? Did I email the instructor with specific questions for clarification? Did I read post a question/discussion in the open discussion board to problem solve with classmates? Did I contact TWU’s statistics tutoring service?
61
APPENDIX D
LIST OF ONLINE LEARNING ENVIRONMENT STUDENT RESOURCES
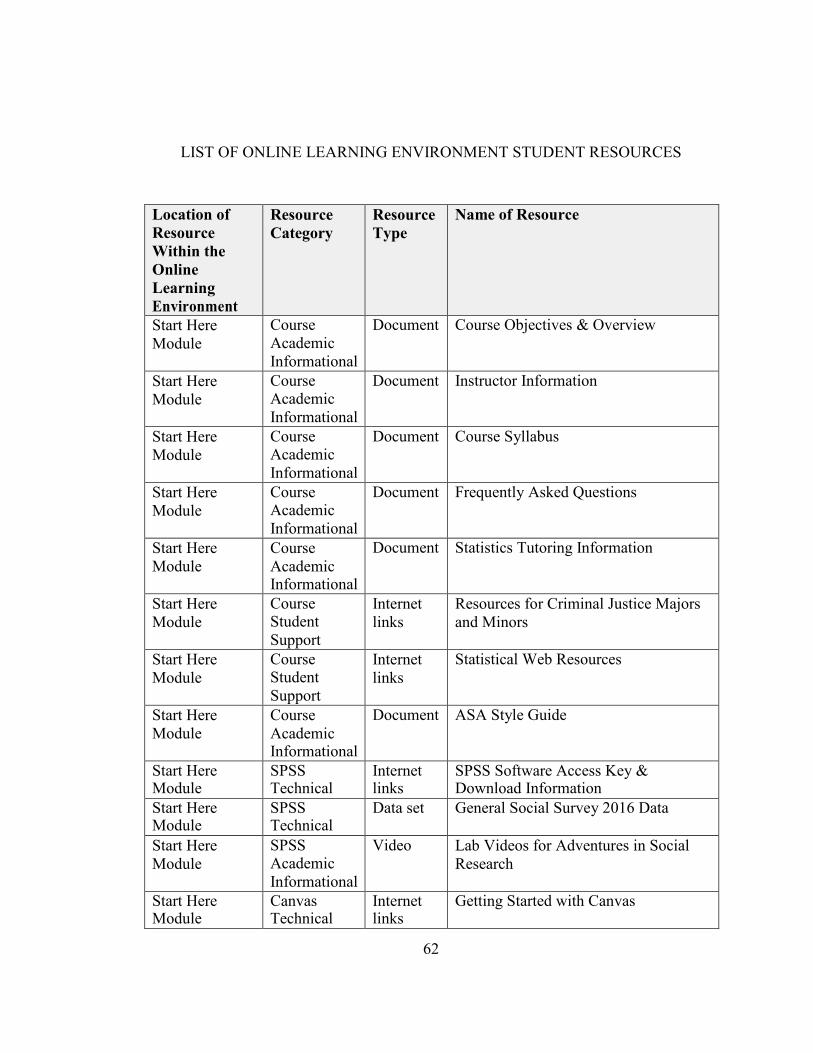
62
LIST OF ONLINE LEARNING ENVIRONMENT STUDENT RESOURCES
Location of Resource Within the Online Learning Environment
Resource Category
Resource Type
Name of Resource
Start Here Module
Course Academic Informational
Document Course Objectives & Overview
Start Here Module
Course Academic Informational
Document Instructor Information
Start Here Module
Course Academic Informational
Document Course Syllabus
Start Here Module
Course Academic Informational
Document Frequently Asked Questions
Start Here Module
Course Academic Informational
Document Statistics Tutoring Information
Start Here Module
Course Student Support
Internet links
Resources for Criminal Justice Majors and Minors
Start Here Module
Course Student Support
Internet links
Statistical Web Resources
Start Here Module
Course Academic Informational
Document ASA Style Guide
Start Here Module
SPSS Technical
Internet links
SPSS Software Access Key & Download Information
Start Here Module
SPSS Technical
Data set General Social Survey 2016 Data
Start Here Module
SPSS Academic Informational
Video Lab Videos for Adventures in Social Research
Start Here Module
Canvas Technical
Internet links
Getting Started with Canvas
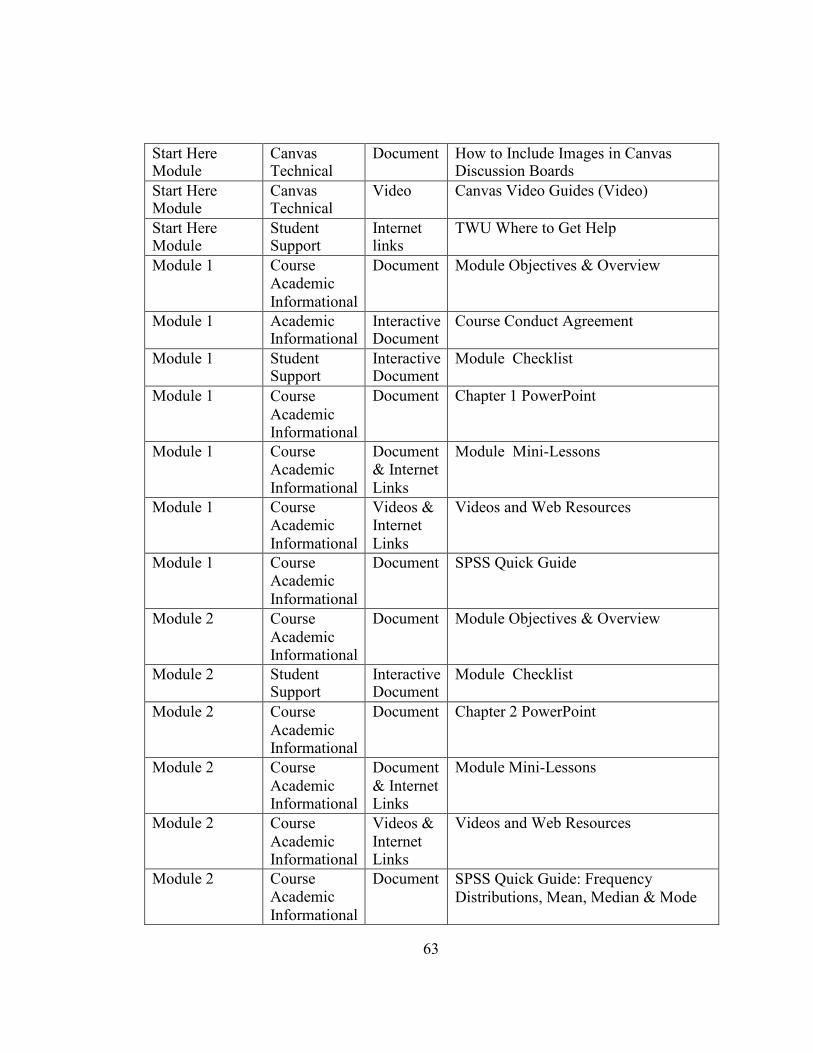
63
Start Here Module
Canvas Technical
Document How to Include Images in Canvas Discussion Boards
Start Here Module
Canvas Technical
Video Canvas Video Guides (Video)
Start Here Module
Student Support
Internet links
TWU Where to Get Help
Module 1 Course Academic Informational
Document Module Objectives & Overview
Module 1 Academic Informational
Interactive Document
Course Conduct Agreement
Module 1 Student Support
Interactive Document
Module Checklist
Module 1 Course Academic Informational
Document Chapter 1 PowerPoint
Module 1 Course Academic Informational
Document & Internet Links
Module Mini-Lessons
Module 1 Course Academic Informational
Videos & Internet Links
Videos and Web Resources
Module 1 Course Academic Informational
Document SPSS Quick Guide
Module 2 Course Academic Informational
Document Module Objectives & Overview
Module 2 Student Support
Interactive Document
Module Checklist
Module 2 Course Academic Informational
Document Chapter 2 PowerPoint
Module 2 Course Academic Informational
Document & Internet Links
Module Mini-Lessons
Module 2 Course Academic Informational
Videos & Internet Links
Videos and Web Resources
Module 2 Course Academic Informational
Document SPSS Quick Guide: Frequency Distributions, Mean, Median & Mode
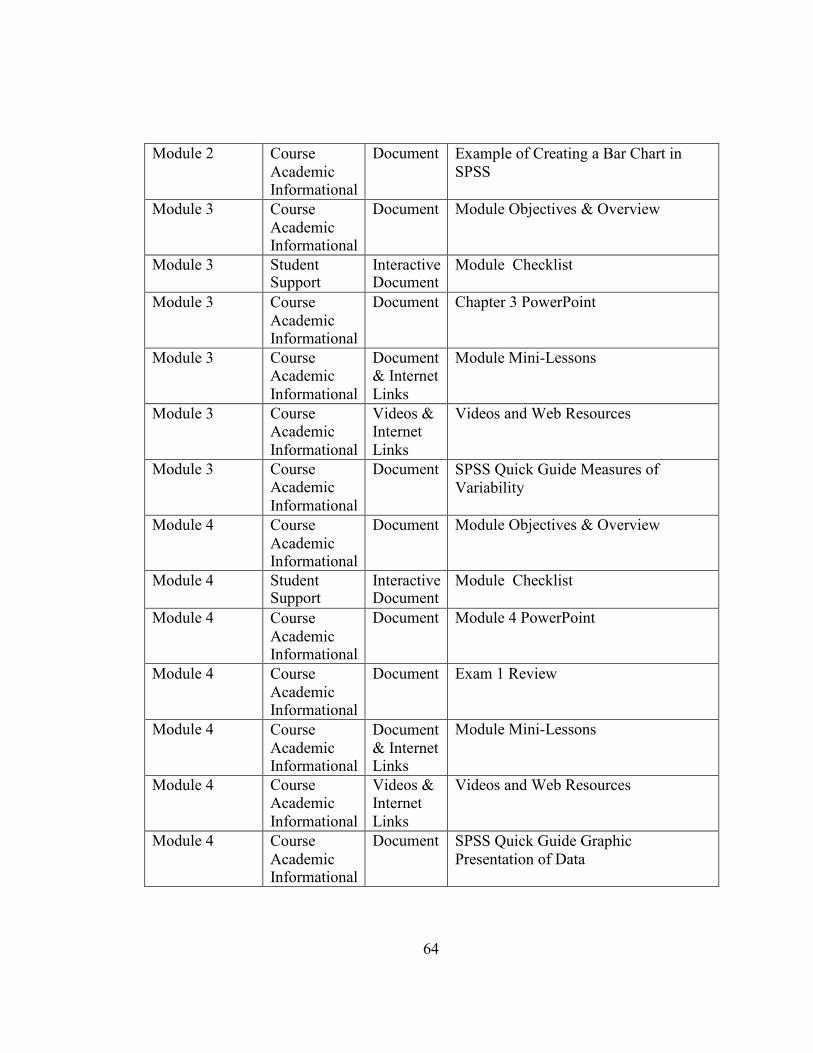
64
Module 2 Course Academic Informational
Document Example of Creating a Bar Chart in SPSS
Module 3 Course Academic Informational
Document Module Objectives & Overview
Module 3 Student Support
Interactive Document
Module Checklist
Module 3 Course Academic Informational
Document Chapter 3 PowerPoint
Module 3 Course Academic Informational
Document & Internet Links
Module Mini-Lessons
Module 3 Course Academic Informational
Videos & Internet Links
Videos and Web Resources
Module 3 Course Academic Informational
Document SPSS Quick Guide Measures of Variability
Module 4 Course Academic Informational
Document Module Objectives & Overview
Module 4 Student Support
Interactive Document
Module Checklist
Module 4 Course Academic Informational
Document Module 4 PowerPoint
Module 4 Course Academic Informational
Document Exam 1 Review
Module 4 Course Academic Informational
Document & Internet Links
Module Mini-Lessons
Module 4 Course Academic Informational
Videos & Internet Links
Videos and Web Resources
Module 4 Course Academic Informational
Document SPSS Quick Guide Graphic Presentation of Data
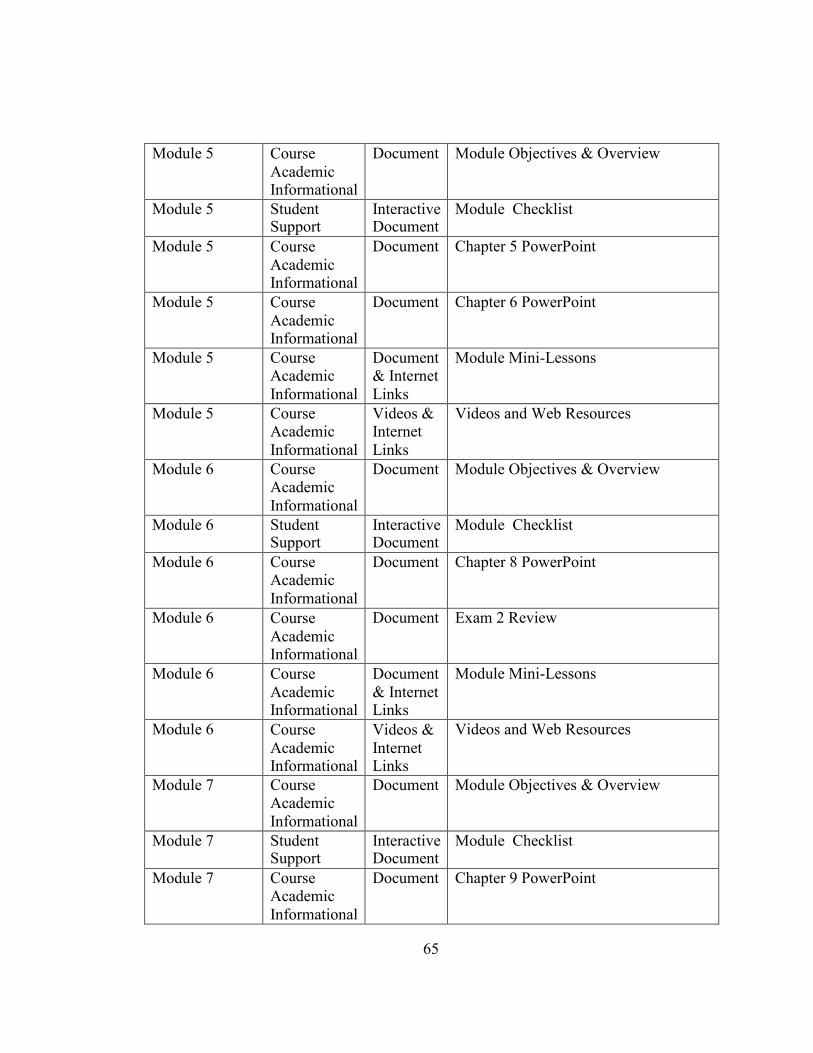
65
Module 5 Course Academic Informational
Document Module Objectives & Overview
Module 5 Student Support
Interactive Document
Module Checklist
Module 5 Course Academic Informational
Document Chapter 5 PowerPoint
Module 5 Course Academic Informational
Document Chapter 6 PowerPoint
Module 5 Course Academic Informational
Document & Internet Links
Module Mini-Lessons
Module 5 Course Academic Informational
Videos & Internet Links
Videos and Web Resources
Module 6 Course Academic Informational
Document Module Objectives & Overview
Module 6 Student Support
Interactive Document
Module Checklist
Module 6 Course Academic Informational
Document Chapter 8 PowerPoint
Module 6 Course Academic Informational
Document Exam 2 Review
Module 6 Course Academic Informational
Document & Internet Links
Module Mini-Lessons
Module 6 Course Academic Informational
Videos & Internet Links
Videos and Web Resources
Module 7 Course Academic Informational
Document Module Objectives & Overview
Module 7 Student Support
Interactive Document
Module Checklist
Module 7 Course Academic Informational
Document Chapter 9 PowerPoint
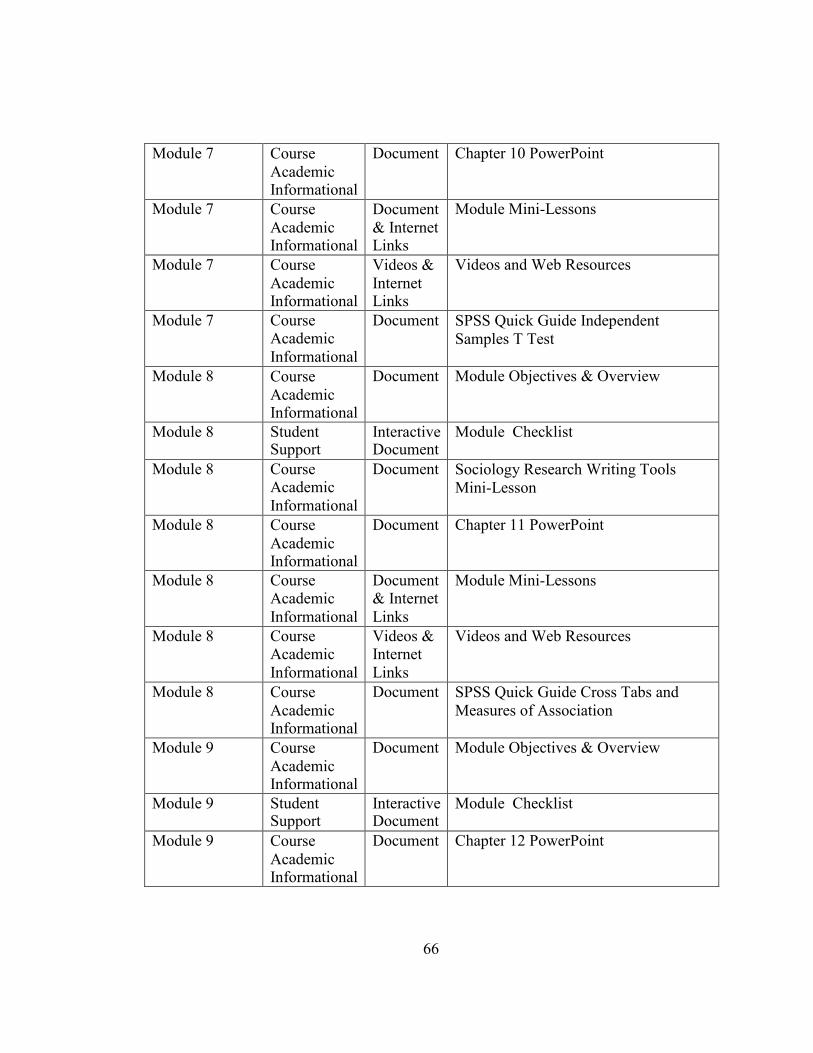
66
Module 7 Course Academic Informational
Document Chapter 10 PowerPoint
Module 7 Course Academic Informational
Document & Internet Links
Module Mini-Lessons
Module 7 Course Academic Informational
Videos & Internet Links
Videos and Web Resources
Module 7 Course Academic Informational
Document SPSS Quick Guide Independent Samples T Test
Module 8 Course Academic Informational
Document Module Objectives & Overview
Module 8 Student Support
Interactive Document
Module Checklist
Module 8 Course Academic Informational
Document Sociology Research Writing Tools Mini-Lesson
Module 8 Course Academic Informational
Document Chapter 11 PowerPoint
Module 8 Course Academic Informational
Document & Internet Links
Module Mini-Lessons
Module 8 Course Academic Informational
Videos & Internet Links
Videos and Web Resources
Module 8 Course Academic Informational
Document SPSS Quick Guide Cross Tabs and Measures of Association
Module 9 Course Academic Informational
Document Module Objectives & Overview
Module 9 Student Support
Interactive Document
Module Checklist
Module 9 Course Academic Informational
Document Chapter 12 PowerPoint
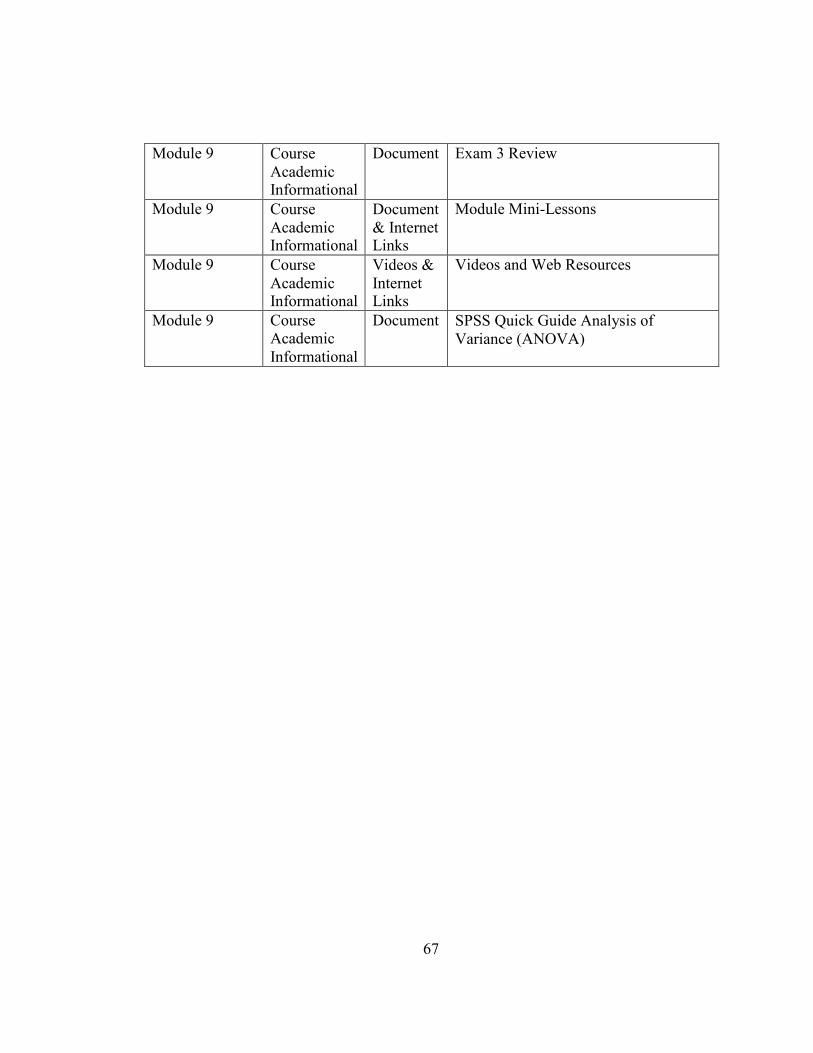
67
Module 9 Course Academic Informational
Document Exam 3 Review
Module 9 Course Academic Informational
Document & Internet Links
Module Mini-Lessons
Module 9 Course Academic Informational
Videos & Internet Links
Videos and Web Resources
Module 9 Course Academic Informational
Document SPSS Quick Guide Analysis of Variance (ANOVA)

68
APPENDIX E:
IRB EXEMPTION LETTER
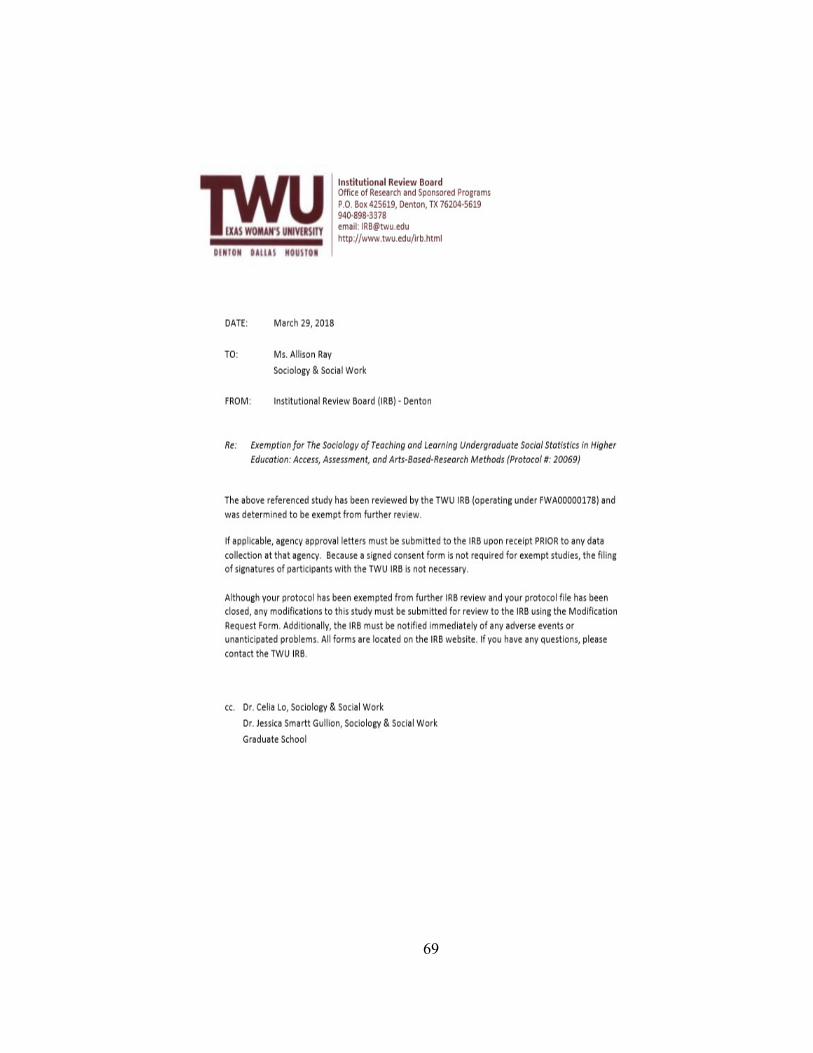
69