Embed Size (px)
Citation preview

The sociogenomics of sexual and reproductive
behaviour
Melinda Mills
University of Oxford & Nuffield College

Completed Cohort Fertility, birth cohorts 1935-1972
Source: Human Fertility Database (https://www.humanfertility.org/cgi-bin/main.php), accessed April 3,
2018. Figure produced by Melinda.

Average childlessness levels in Europe, women born 1900–1972
0
5
10
15
20
25
30
0
5
10
15
20
25
1900 1905 1910 1915 1920 1925 1930 1935 1940 1945 1950 1955 1960 1965 1970
Nu
mb
er
of
cou
ntr
ies
cove
red
Shar
e o
f w
om
en
ch
ildle
ss (
%)
Year of birth
European AverageAustria, Germany, Switzerland
Eastern & south-eastern Europe
Central Europe
Western Europe
Italy & Spain
Nordic countries
Sobotka (2017)

Women’s Mean Age First Birth, 1960-2016
Source: Human Fertility Database (https://www.humanfertility.org/cgi-bin/main.php), accessed April
3, 2018. Figure produced by Melinda.
20
22
24
26
28
30
32
1960
1962
1964
1966
1968
1970
1972
1974
1976
1978
1980
1982
1984
1986
1988
1990
1992
1994
1996
1998
2000
2002
2004
2006
2008
2010
2012
2014
Wo
men
's M
ean
Ag
e at
Fir
st B
irth
Year
Austria
Canada
Czech Republic
Estonia
Finland
Hungary
Iceland
Italy
Netherlands
Norway
Portugal
Spain
Sweden
Switzerland
USA


Social behaviour (and some diseases)influenced by:
reproductive span;
ovulation, sperm
production, etc.
personality; partner
& individual
characteristics
contraceptive laws;
childcare,
educational systems,
housing, marriage
norms

Contraception, norms & values, educational level, labour market participation, role incompatibility, work-life, social networks, gender equity
Social factors, environment
Age at first birth
Number of children
Infertility
Menarche, menopause
Genetic RiskLocation of genetic variants (GWAS)
Predictive variable: polygenic score
Gene x Environment
Fertility
Sociogenomics: bridges 2 parallel approaches

What do demographers know about sex and fertility?

Sex and fertility demography = 28,313 citations
Top hits:
• Sex ratio (17,050)
• Divided by age and sex
• Sex selection / sex (boy) preference
• Same-sex couples

Sexual intercourse, fertility and demography (4,489)
…and contraceptive behaviour or use
…and coitus interruptus
…and abstinence
…and HIV/AIDS
…and preselection
…and preference
…and impact of female’s educational attainment
…and breastfeeding
…and at age first intercourse

Sexual intercourse, fertility and demography (4,489)
…and father absence
…and sex roles
…and violent conflict
…and infant mortality
…and cohabitation
…and polygamy
…and migration
...and seasonality of conception
…and ‘premarital birth’

‘Leading by losing: Sex and fertility on crack cocaine’ (1994)
‘Gall stones in a Danish population: fertility period, pregnancies and
exogeneous female sex hormones’ (1988)
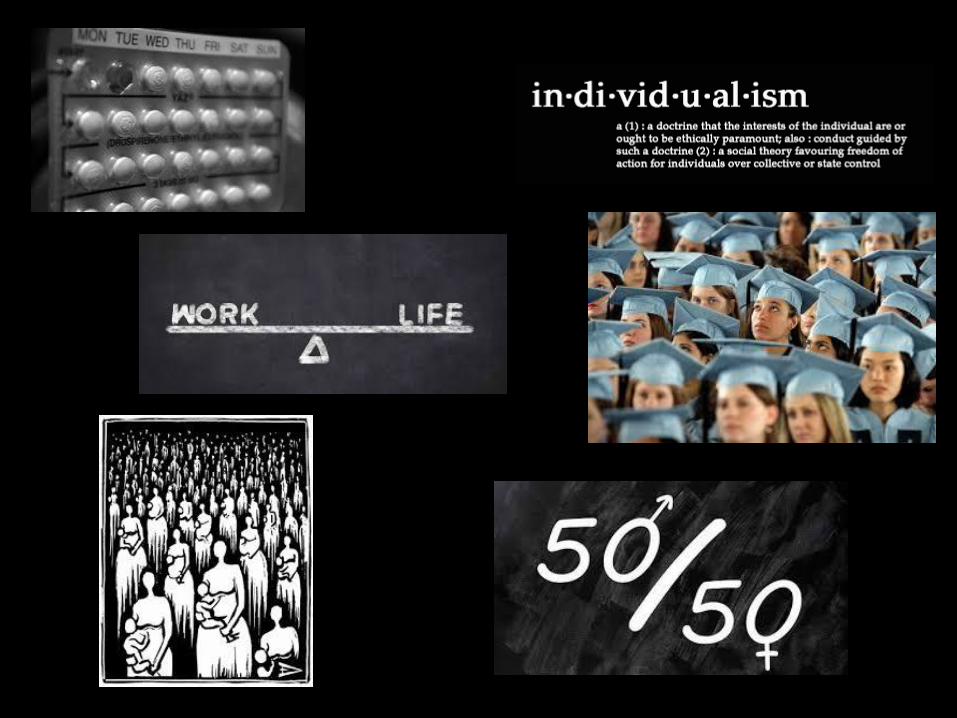
Average age first sex (2005, 2007)
19,218,9
18,518,3 18,2 18,1 18,1 18 17,9
17,617,3 17,3
16,5 16,516,2 16,1
15,6
15
15,5
16
16,5
17
17,5
18
18,5
19
19,5
Av
era
ge
ag
e fi
rst
sex
Country
Durex Network Research Unit 2009, Face of Global Sex report, 2005 - 2009, SSL International plc, Cambridge, viewed 20th October, 2009, <http://www.durexnetwork.org/en-GB/research>.
Harris Interactive 2006, The Durex Sexual Wellbeing Global Survey, 2006, SSL International plc, Cambridge, viewed 20th October, 2009, <http://www.durex.com/en-US/SexualWellbeingSurvey>.

Sexual behavior & fertility
• AFS: Age at first sexual intercourse
• AFB: Age at first birth
• NEB: Number of children ever born
• CL: Childlessness
Also link with reproductive window:
age at menarche, voice breaking in boys, age at menopause
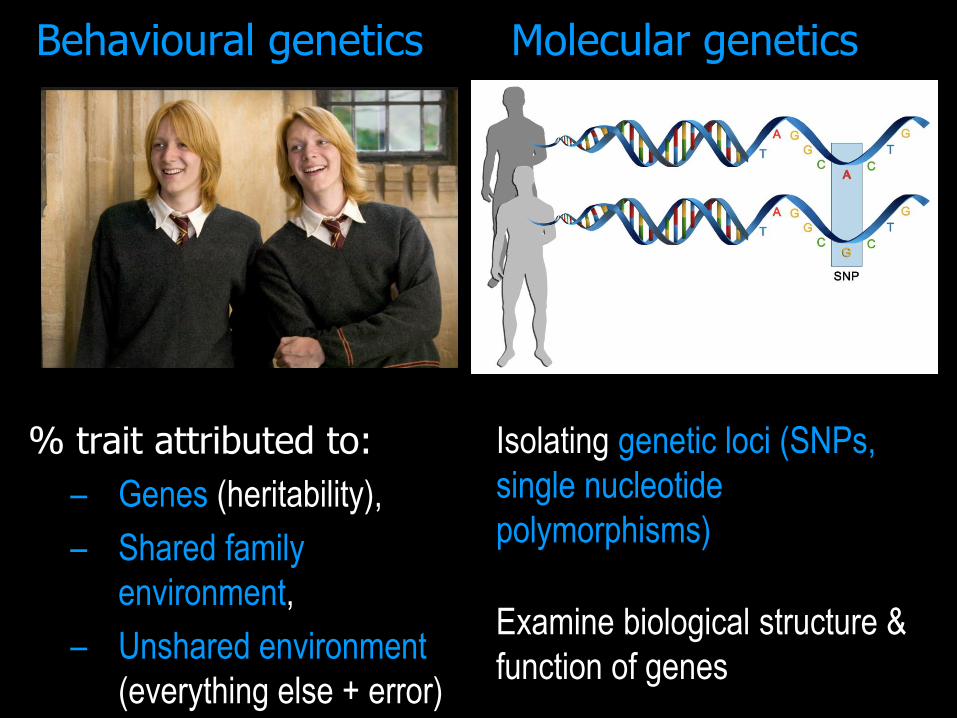
Behavioural genetics
% trait attributed to:
– Genes (heritability),
– Shared family
environment,
– Unshared environment
(everything else + error)
Molecular genetics
Isolating genetic loci (SNPs,
single nucleotide
polymorphisms)
Examine biological structure &
function of genes

Heritability of fertilityAround 25 to even 50%
Mills, M. & F. Tropf (2015). The biodemography of fertility: A review and future research frontiers
Conclusions we can draw from twin studies
Large variation in heritability by:• Overall amount (25-50%)• Country• Birth cohort
Virtually no studies of men

Courtiol, Tropf & Mills (2016) When genes & environment
disagree: Making Sense of Trends in Recent human
evolution, Proceedings of the National Academy of Sciences,
113(28): 7693-95.

uses measured SNPs to estimate genetic relatedness between unrelated individuals
(Yang et al. 2010)
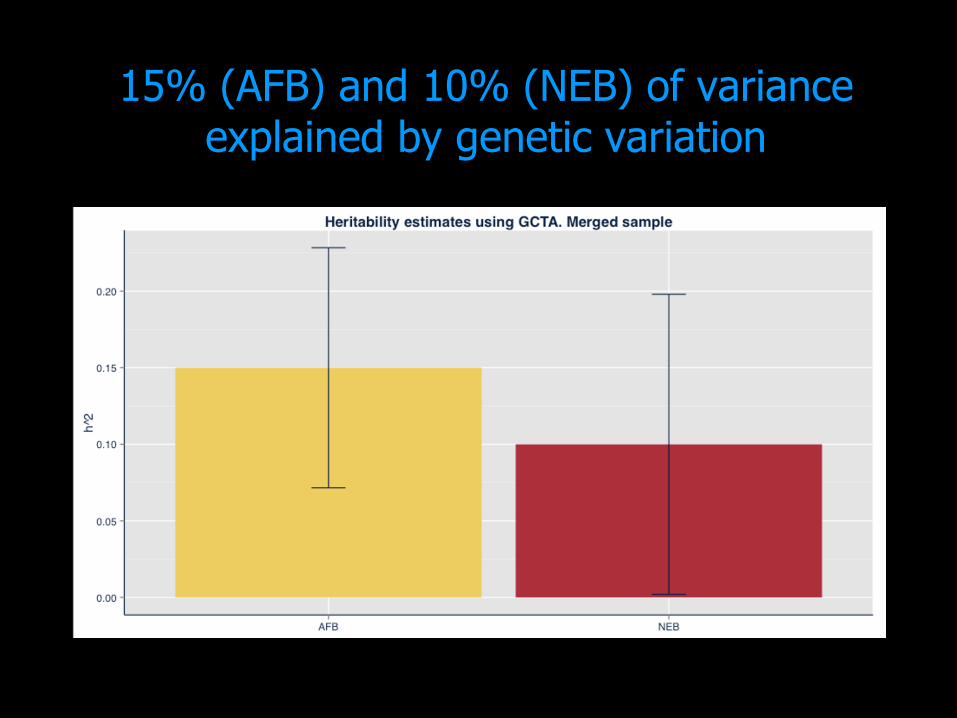
15% (AFB) and 10% (NEB) of variance explained by genetic variation

So What?
What are the genes?Do they have a biological
function?

GWAS
• Genome-Wide Association Study
• study of genetic variation across the entire human genome that is designed to identify genetic associations with observable traits (breast cancer, age at first birth, educational attainment)
• Data mining on SNPs
• Mandatory independent QC & replication


Sample size
AFB NEB
Women 189,656 225,230
Men 48,408 103,909
Totalmean±SD
238,06426.8±4.7 yrs
329,1392.3±1.43 children
• 63 datasets from US, Canada, Northern & Western Europe (European ancestry)
• Data from scientific studies (medical, social science), insurance and commercial companies

Age at first birth
10 significant loci
9 in both sexes
1 in women only
Number of children ever born
3 significant loci
2 in both sexes
1 in men only

Identified causal function & role(e.g. gene expression analysis, gene methylation analysis, functional
network or enrichment analysis, pathway analysis, regulatory analysis)
• Sperm: spermatid differentiation (CREB3L4); spermatid maturation & acrosome reaction (HYAL3); spermatogenesis/testis (RBM5; CYHR1; GPT; RECQL4; PPP1R16A)
• Fertility in female mice (EFNA5)
• Hormones related to fertility (HCN1)
• Ovum, oocyte, fallopian tube, prostate (e.g., MST1R; CRTC2)
• Estrogen responsive gene, sexual maturation, development, (ESR1)
• Metabolic endocrine abnormalities, FSH levels (GPT)
• Endometriosis (GATAD2B, ESR1)
• Polycystic ovary syndrome (DENND4B)

Some genes have biological / epigenetic function
• Lead genetic loci on Chr 3 linked with:
– methylation & expression of genes known to play a role in sperm function
– Altering expression of genes RBM5/6 –linked to lower sperm count & quality

Linked with human development
• LD Score regression
• underlying human development, hormonal link
• later AFB linked to later pubertal timing
• Fertility shift

Shift of reproductive window & longevity for those with particular
genetic architecture
probability
100age
10 20 51 60463015
age menarcheage first sex
age first birthage menopause
age death
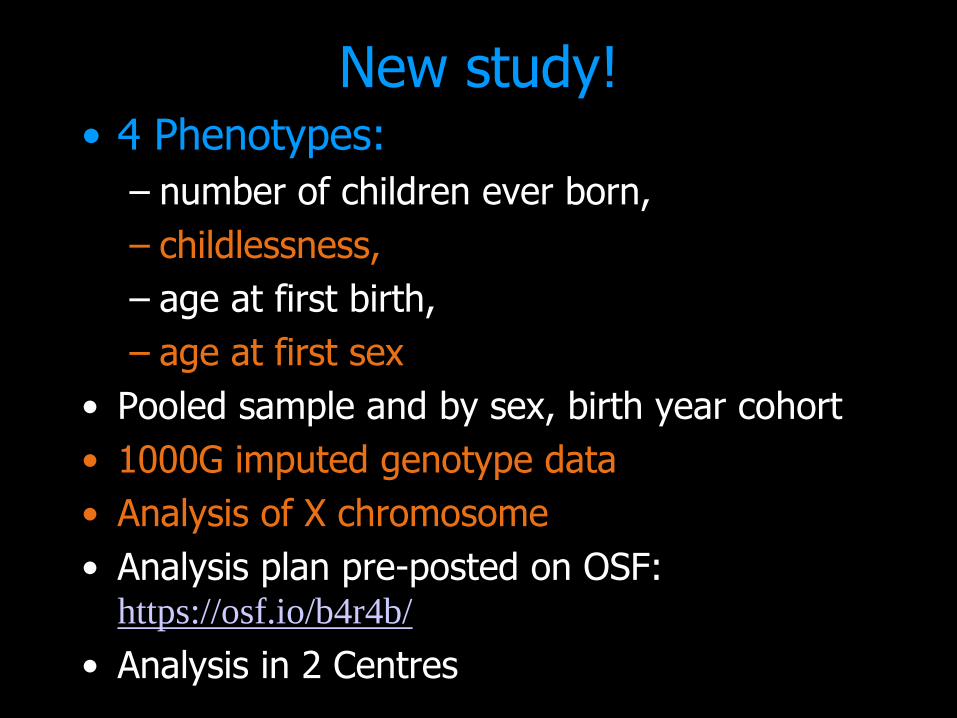
New study!• 4 Phenotypes:
– number of children ever born,
– childlessness,
– age at first birth,
– age at first sex
• Pooled sample and by sex, birth year cohort
• 1000G imputed genotype data
• Analysis of X chromosome
• Analysis plan pre-posted on OSF: https://osf.io/b4r4b/
• Analysis in 2 Centres


Larger sample combines 42 datasets
Age at
first sex
(AFS)
Age at first
birth (AFB)
Number
of
children
ever born
(NEB)
Childless-
ness (CL)
Women 214,547 407,377 534,989 245,047
Men 182,791 124,008 301,525 205,035
Pooled 387,338 542,901 717,062 450,082

Many new genetic loci!
• 271 (Age first sex, AFS, previously 38),
• 88 (Age first birth, AFB, 84 + 4 on the X Chromosome, previously 10),
• 28 (Number of children ever born, NEB, previously 3)
• 16 (CH, Childlessness)

More & stronger genetic hits

Polygenic scores
weighted average of individual genetic information

Polygenic Score (PGS)
• R2 as a measure of goodness-of-fit
Out of sample prediction
• ~5.5% of the variance for AFS,
• ~3% for AFB
• ~1.5% for NEB

PGS getting close to standard demographic predictors!
Age at
partnership
Educational
attainment
Labour force
participation
PGS Age
first sex
PGS Age
first birth
Pseudo R2 10 6,5 6 5,5 3
0
1
2
3
4
5
6
7
8
9
10
PS
EU
DO
R2

PGS prediction in multivariate models with standard
predictors

How well do PGS predict childlessness when social factors are included?
women men
AFB PGS
significant
AFB PGS,
Azoospermia
significant
Reference groups: married before age 21, first job: clerk, LFP: job of 5+ years.
1.094*
1.314*
0.612***
1.304***
1.189**
1.153*
1.127*1.177*
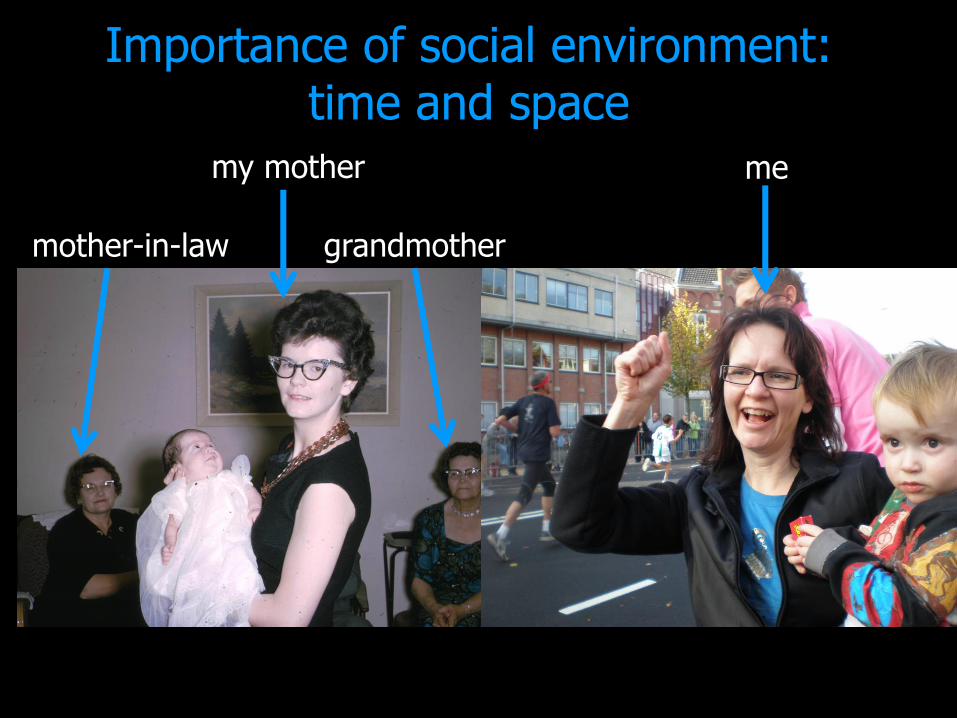
grandmothermother-in-law
Importance of social environment: time and space
my mother me

Tropf…M.C.Mills (2016) Nature Human Behavior
Age at first birth women,by birth cohort
Using HFD!


Increase explanation if you interact genetic component with birth cohort (C) and population (P)

Increased genetic heritability by birth cohort
Mean AFB
SNP H2

G x E: Age life course effects
Age: decreasedbiological ability toconcieve by age
• PGS infertility strongerfor women 35+
• PGS sperm defects stronger effects withage
RENSKE
VERWEIJ

Genetic overlap fertility and related traits
David
Brazel AFS & AFB

Conclusion: Fertility is in the genes (and we know which ones)
• fertility has a genetic component
• we offer you new variables to control for and test gene x environment relationships
• sex is related to fertility
• biological function of genetic loci (particularly men)
• links to natural selection and evolution
• Extend to non-European populations

Conclusion: some critical thoughts
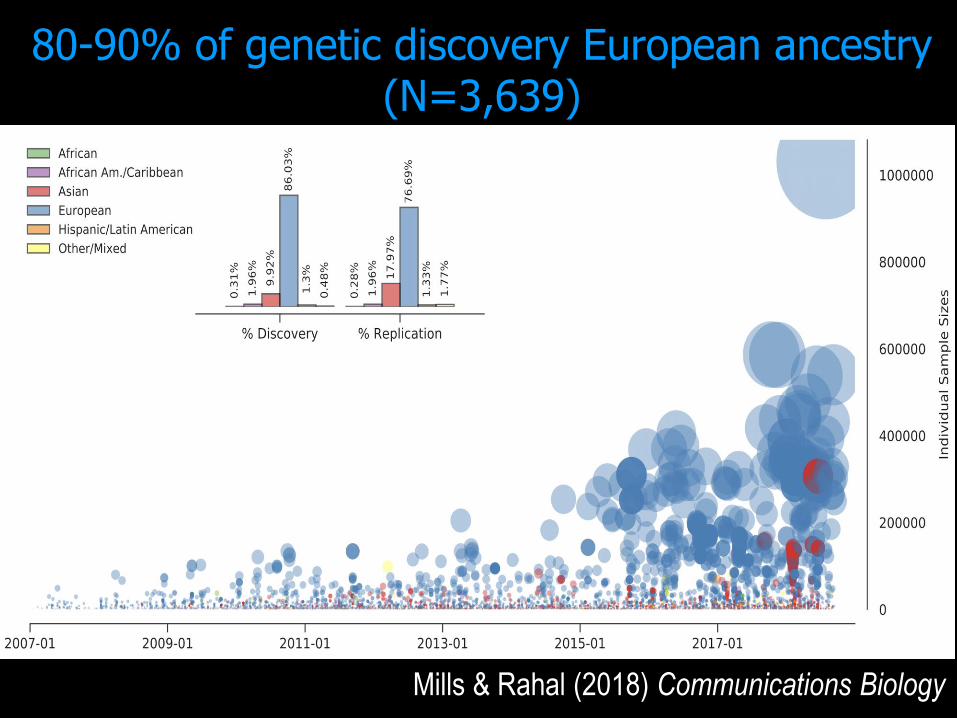
80-90% of genetic discovery European ancestry (N=3,639)
Mills & Rahal (2018) Communications Biology

72% respondents from 3 countries
Mills & Rahal (2018) Communications Biology

www.sociogenome.org
www.melindacmills.com

Why the focus on European ancestry?
• Analytical need for homogeneous cohorts (share geographic & socio-environmental factors)
• Population stratification: subgroups have history of mixing & different ancestry
• Subgroups differ in allele frequency & prevalence of a trait (e.g., type II diabetes in Native Americans)
• Some SNPs more common in certain subgroups, thus risk for false positive
• Logistical, genetic, historical, funding, cultural reasons


Sexual dimorphism: genes contributing to female childlessness passed on via male lineage (and vice-versa for women)
Example: female childlessness passed on through male lineage
We found different sets of genes for childlessness for men and women

AFB PGS relevant birth cohorts 1933-1951 among men in HRS

![Integrative analysis of DNA methylation and gene ...Hypermethylation in gene promoter regions, such as in tumor suppressor genes, is usually related to gene silen-cing [9, 11]. Some](https://img.pdfslide.us/doc/110x75/609313e724030e55f25f9312/integrative-analysis-of-dna-methylation-and-gene-hypermethylation-in-gene-promoter.jpg)