Embed Size (px)
Citation preview
The Social Security
Administration's Youth Transition
Demonstration Projects: Interim
Report on Colorado Youth WINS
April 7, 2011
Thomas Fraker Peter Baird Alison Black Arif Mamun Michelle Manno John Martinez Anu Rangarajan Debbie Reed

Contract Number: SS00-05-60084
Mathematica Reference Number: 06209.125
Submitted to: Social Security AdministrationOffice of Program Development and Research 500 E St., SW, Room 905 Washington, DC 20254 Telephone: (202) 358-6509Facsimile: (202) 358-6505 Project Officer: Joyanne Cobb
Submitted by:Mathematica Policy Research600 Maryland Avenue, SW Suite 550 Washington, DC 20024-2512Telephone: (202) 484-9220Facsimile: (202) 863-1763 Project Director: Thomas Fraker
The Social Security
Administration's Youth
Transition Demonstration
Projects: Interim Report on
Colorado Youth WINS
April 7, 2011
Thomas Fraker Peter Baird Alison Black Arif Mamun Michelle Manno John Martinez Anu Rangarajan Debbie Reed

Interim Report on Colorado Youth WINS Contents
CONTENTS
ACRONYMS ............................................................................................................... xiii
EXECUTIVE SUMMARY................................................................................................. xv
I INTRODUCTION .............................................................................................1
A. The YTD Conceptual Framework..............................................................2
B. The YTD Evaluation .................................................................................5
C. The Youth WINS Project ...........................................................................6
D. Research Objectives for This Report ........................................................8
II STUDY DESIGN, METHODS, AND DATA SOURCES ............................................9
A. Impact Analysis .......................................................................................9
1. Outcome Measures ...........................................................................9 2. Sample Selection and Recruitment .................................................. 12 3. Data Sources and Analytic Sample .................................................. 15 4. Estimating Overall Impacts ............................................................. 19 5. Estimating Subgroup Impacts ......................................................... 20 6. Other Analytic Considerations ........................................................ 21
B. Process Analysis ....................................................................................22
1. Analytic Approach .......................................................................... 22 2. Data Sources and Sample................................................................ 23
III IMPLEMENTATION OF YOUTH WINS ..............................................................27
A. Overview of the Sponsoring Organization and Partners ..........................28
B. Local Context and Infrastructure ...........................................................29
1. County Socioeconomic Characteristics ............................................ 30 2. Existing Services for People with Disabilities ...................................30
C. Youth WINS Services ..............................................................................33
D. Enrollment in Youth WINS ......................................................................39
1. Enrolling Youth in Project Services .................................................. 41 2. Characteristics of Participants and Non-Participants ....................... 43
iii
Interim Report on Colorado Youth WINS Contents (continued)
E. Project Implementation .........................................................................45
1. Integration into the Workforce Centers ........................................... 45 2. Project Management .......................................................................45 3. Fidelity to the YTD Program Model .................................................. 46 4. Staff Turnover.................................................................................46 5. Staff Training..................................................................................47
F. Service Use............................................................................................48
1. PCP Development ........................................................................... 49 2. Types of Services Received .............................................................49 3. Timing and Intensity of Services ..................................................... 54
G. Participation Patterns over Time ............................................................57
H. Youth Satisfaction with Services.............................................................61
I. Implementation Lessons and Challenges ...............................................61
IV IMPACTS ON THE USE OF EMPLOYMENT SERVICES AND OTHER SERVICES ......67
A. Youth WINS Increased the Use of Employment Services ..........................68
B. Youth WINS Led to Increases in the Amount of All Services Used ............70
C. Youth WINS Increased Understanding of the Relationship Between Benefits and Employment ......................................................................73
D. Youth WINS Had Little Impact on the Types of Service Providers Used ....75
E. Impacts on the Use of Employment Services Did Not Vary Across Subgroups ..............................................................................................76
V IMPACTS ON EMPLOYMENT AND EARNINGS..................................................79
A. No Impact of Youth WINS on Employment ..............................................79
B. No Impacts of Youth WINS on Hours of Work or Earnings .......................82
C. No Impacts of Youth WINS on Job Characteristics ...................................86
D. No Impact of Youth WINS on Employment for Key Subgroups ................89
E. Descriptive Analysis of Job Characteristics and Job Search Activities ......90
VI IMPACTS ON EDUCATION .............................................................................93
A. Youth WINS Did Not Improve Education Outcomes.................................93
B. Youth WINS Had No Impact on Education for Any Subgroup ...................95
VII IMPACTS ON YOUTH INCOME, SSA BENEFITS, AND RELATED OUTCOMES ......97
iv
Interim Report on Colorado Youth WINS Contents (continued)
A. Youth WINS Had No Impact on Youth Income .........................................97
B. Youth WINS Had Little Impact on the Use of SSA Work Incentives .........101
C. Youth WINS Increased Coverage by Public Health Insurance .................102
D. Youth WINS Had No Impact on Youth Income for Any Subgroup ...........104
VIII IMPACTS ON ATTITUDES AND EXPECTATIONS ............................................105
A. Youth WINS Had No Impact on Goals for Future Work and Earnings .....106
B. Youth WINS Had No Impacts on Independence, Decision Making, and Social Interactions ...............................................................................109
C. Youth WINS Had No Impact on Goals for Future Work and Earnings for Any Subgroup ................................................................................109
IX EXPLORATORY ANALYSES OF IMPACTS ON TRAINING AND PRODUCTIVE ACTIVITIES.................................................................................................113
A. Youth WINS Had No Impact on Participation in Training .......................113
B. Youth WINS Had No Impact on a Composite Measure of Participation in Productive Activities ........................................................................ 114
APPENDIX B: I-TEAM JOB DESCRIPTIONS ................................................................... B.1
APPENDIX C: SUPPORTING TABLES FOR CHAPTER III: RECEIPT OF SPECIFIC YOUTH WINS SERVICES .................................................................................... C.1
APPENDIX D: THE SSA WAIVERS FOR YTD .................................................................. D.1
APPENDIX E: MATERIALS PROVIDED BY COLORADO WIN PARTNERS ........................... E.1
X CONCLUSION.............................................................................................117
REFERENCES .............................................................................................................119
APPENDIX A: ADDITIONAL ANALYSES AND TECHNICAL DISCUSSION ..........................A.1
v

Interim Report on Colorado Youth WINS Tables
TABLES
II.1 Primary and Supplementary Outcomes ..................................................11
II.2 Baseline Characteristics of the Analytic Sample ......................................17
II.3 Sample Size by Subgroup ......................................................................22
III.1 Characteristics of the Service Environment for Youth WINS ....................31
III.2 Staff Efforts to Enroll Treatment Group Members in Youth WINS ............42
III.3 Baseline Characteristics of Treatment Group Members Who Did/Did Not Participate in Youth WINS ...................................................44
III.4 Receipt of PCP Services ..........................................................................50
III.5 Receipt of Youth WINS Services ..............................................................51
III.6 Percentage of Youth WINS Participants Who Used SSA Work Incentives and Waivers ..........................................................................53
III.7 Timing of Youth WINS Services ..............................................................55
III.8 Intensity of Youth WINS Services ............................................................56
III.9 Use of Youth WINS Services in Post-Enrollment Quarters, by Enrollment Cohort .................................................................................59
III.10 Satisfaction with Youth WINS Services Among Participants .....................62
IV.1 Use of Employment-Promoting Services and Non-Employment Services.................................................................................................69
IV.2 Amount of Services Used and Unmet Service Needs ...............................72
IV.3 Knowledge and Sources of Information on SSA Requirements and Work Incentives ..............................................................................74
IV.4 Use of Services by Type of Provider .......................................................77
IV.5 Use of Any Employment-Promoting Service, by Subgroup......................78
V.1 Employment and Number of Jobs ..........................................................80
V.2 Total Hours Worked ...............................................................................84
V.3 Earnings ................................................................................................86
V.4 Job Tenure, Hours of Work, Hourly Wage, and Benefits for the Primary Job............................................................................................88
vii
Interim Report on Colorado Youth WINS Tables (continued)
V.5 Ever Employed in Paid Job During the First Year After Random Assignment, by Subgroup......................................................................89
V.6 Types of Paid Jobs Most Frequently Reported by Treatment Group Members with Paid Employment ..................................................90
VI.1 Educational Progress .............................................................................94
VI.2 School Enrollment or Completion of High School, by Subgroup..............96
VII.1 Youth Total Income ...............................................................................98
VII.2 Receipt and Amount of SSA Benefits ....................................................100
VII.3 Use of SSA Work Incentives ..................................................................102
VII.4 Health Insurance Coverage and Receipt of Other Public Assistance ...........................................................................................103
VII.5 Youth Total Income—Earnings and SSA Benefits, by Subgroup .............104
VIII.1 Expectations and Self-Efficacy .............................................................107
VIII.2 Independent Activities, Decision Making, and Social Interactions .........110
VIII.3 Goals Include Working and Earning Enough to Stop Receiving Social Security Benefits, by Subgroup...................................................111
IX.1 Participation in Training Programs .......................................................114
IX.2 Composite Measure of Participation in Productive Activities.................115
A.1 Youth Characteristics by Enrollment in the Evaluation...........................A.2
A.2 Additional Baseline Characteristics of the Analytic Sample ....................A.4
A.3 Baseline Characteristics of the Research Sample ...................................A.5
A.4 Control Variables for Regression-Adjusted Analysis of Impacts ............A.8
A.5 Descriptive Statistics on Outcomes by Treatment Status and Unadjusted Estimated Impacts ..............................................................A.9
A.6 Difference in Simple Means Versus Regression-Adjusted Means for Primary Outcomes.........................................................................A.20
A.7 Baseline Characteristics for Respondents and Non-Respondents ........A.22
A.8 Annual SSA Benefit Receipt for Respondents and Non-Respondents ......................................................................................A.24
A.9 Impacts on Outcomes Measured with Administrative Records, Respondent and Full Sample...............................................................A.25
viii
Interim Report on Colorado Youth WINS Tables (continued)
A.10 Average SSA Benefit Amount by Months Before and After Random Assignment ..........................................................................A.28
A.11 Impact on Use of Employment Services for Additional Subgroups..........................................................................................A.30
A.12 Impact on Ever Employed in a Paid Job for Additional Subgroups ........A.31
A.13 Impact on Ever Enrolled in School or Has Completed High School for Additional Subgroups.........................................................A.32
A.14 Impact on Income for Additional Subgroups .......................................A.33
A.15 Impact on Goals Include Working and Earning Enough to Stop Receiving Social Security Benefits for Additional Subgroups ................A.34
A.16 Self-Efficacy .......................................................................................A.37
C.1 Receipt of Case Management/Support Services or Referrals ................. C.1
C.2 Receipt of Benefits Planning Services ................................................... C.3
C.3 Receipt of Additional Discussions About the SSA Waivers for YTD..................................................................................................... C.4
C.4 Receipt of Employment-Related Services ............................................. C.5
C.5 Receipt of Education-Related Services ................................................. C.6
C.6 Mode of Contact by Type of YTD Service .............................................. C.7
ix

Interim Report on Colorado Youth WINS Figures
FIGURES
I.1 Conceptual Framework for SSA’s YTD Projects .........................................3
II.1 Intake Flow Diagram for Youth WINS ......................................................14
III.1 Participant Flow Through Youth WINS Services .......................................35
V.1 Employment Rate by Month Following Random Assignment ...................82
V.2 Cumulative Employment Rate by Month Following Random Assignment ...........................................................................................83
V.3 Average Hours Worked per Week by Month Following Random Assignment ...........................................................................................85
V.4 Earnings by Month Following Random Assignment ................................87
VII.1 Youth Income by Month Following Random Assignment ........................99
VII.2 SSA Benefit Amount by Month Following Random Assignment .............101
A.1 Average SSA Benefit Amount by Months Before and After Random Assignment ..........................................................................A.27
xi

Interim Report on Colorado Youth WINS Acronyms
ACRONYMS
AWIC = area work incentives coordinator
BLS = Bureau of Labor Statistics
BPAO = Benefits, Planning, Assistance, and Outreach (grant or project; superseded by WIPA)
CCB = Community Centered Board
CDB = Childhood Disability Benefits
CDR = continuing disability review
CPI-W = consumer price index for urban wage earners and clerical workers
CWP = Colorado WIN Partners, University of Colorado Denver
DI = Social Security Disability Insurance
DOL = U.S. Department of Labor
DPN = Youth WINS disability program navigator1
DVR = Colorado Division of Vocational Rehabilitation
EIE = earned income exclusion
ETO = Efforts-to-Outcomes, a management information system
GED = general educational development (or general equivalency diploma)
IDA = individual development account
IEP = individualized education program
IMP = individual marketing profile
ITT = intent to treat
I-Team = Independence Teams; staff teams that delivered Youth WINS services
MEF = Master Earnings File
1 In this report, the “DPN” acronym refers to the disability program navigator position in the Colorado Youth WINS YTD project. This position was modeled after, but was not formally part of, the Disability Program Navigator Initiative that was funded jointly by the U.S. Department of Labor and the Social Security Administration.
xiii
Interim Report on Colorado Youth WINS Acronyms
MIS = management information system
MOU = memorandum of understanding
NBS = National Beneficiary Survey
ODEP = Office of Disability Employment Policy, U.S. Department of Labor
OLS = ordinary least squares
PASS = plan for achieving self-support
PCP = person-centered planning (plan)
RA = random assignment
SEIE = student earned income exclusion
SNAP = Supplemental Nutrition Assistance Program
SSA = Social Security Administration
SSI = Supplemental Security Income
TANF = Temporary Assistance for Needy Families
TOT = treatment on the treated
TRF = Ticket Research File
WIB = Workforce Investment Board
WINS = Work Incentive Network of Supports
WIPA = Work Incentives Planning and Assistance (grant or project; preceded by BPAO)
YTD = Youth Transition Demonstration
xiv
Interim Report on Colorado Youth WINS Executive Summary
EXECUTIVE SUMMARY
The Youth Transition Demonstration (YTD) is a large-scale demonstration and evaluation sponsored by the Social Security Administration (SSA) to improve understanding of how to help youth with disabilities reach their full economic potential. In particular, SSA is interested in developing and testing promising approaches for helping young people with disabilities become more self-sufficient and less reliant on disability benefits. The YTD program model, which is based on best practices in facilitating youth transition, specifies that the six projects participating in the evaluation provide employment services (emphasizing paid competitive employment), benefits counseling, links to services available in the community, and other assistance to youth with disabilities and their families. Additionally, participating youth are eligible for SSA waivers of certain benefit program rules, which allow them to retain more of their disability benefits and health insurance while they work for pay. Using a rigorous random assignment methodology, the YTD evaluation team is assessing whether these services and incentives are effective in helping youth with disabilities achieve greater independence and economic self-sufficiency.2 The earliest of the evaluation projects began operations in 2006 and ended in 2009. The latest started in 2008 and will end in 2012.
In this report, we present first-year evaluation findings for the Colorado Youth WINS (Work Incentive Network of Supports) YTD project, which served youth in four counties from August 2006 to December 2009. While it will take several more years before we fully observe the transitions that youth participants make to adult life, early data from the evaluation provide rich information on how the Youth WINS project operated and the difference it made during the initial stages of the transitions. Specifically, the report includes findings from our process analysis of Youth WINS, including a description of the program model, how the project was implemented and services were delivered, and the project’s fidelity to the YTD program model. The report also includes impact findings, based on data collected 12 months after youth entered the evaluation, on the use of services, paid employment, participation in education, income from earnings and benefits, and attitudes and expectations.
In brief, we learned through the process analysis that Youth WINS, as implemented, deviated from the YTD program model in ways that may have reduced its potential to achieve certain critical YTD objectives. In particular, the project focused more on case management and less on the delivery of employment services directly to youth than indicated by the YTD program model. Notwithstanding that focus, the impact analysis revealed that youth who had been given the opportunity to participate in Youth WINS were more likely to have used services to promote employment than youth in a randomly selected control group. However, we found no impacts on key measures of youth employment, income, and expectations during the year following random assignment.
2 In 2005, under SSA contract #SS00-05-60084, Mathematica Policy Research, a nonpartisan firm that conducts policy research and surveys, and its partner organizations, MDRC and TransCen, Inc., were awarded a contract to design and conduct the YTD evaluation and provide technical assistance to projects as they developed and implemented their interventions. The evaluation is advised by a technical working group consisting of young adults with disabilities, providers of services to teenagers and young adults with disabilities, policy researchers, academics, and representatives of federal agencies other than SSA.
xv
Interim Report on Colorado Youth WINS Executive Summary
The Youth Transition Demonstration Evaluation
The target population for the YTD evaluation is youth ages 14 through 25 who are either receiving SSA disability benefits or are at risk of receiving them in the future. The evaluation is based on a rigorous random assignment design. Youth who agree to participate in the evaluation are assigned at random to a treatment or control group. Youth in the treatment group are eligible to receive YTD services in addition to the SSA waivers, while those in the control group may receive only those services available in their communities, independent of the YTD initiative. The evaluation seeks to enroll approximately 880 youth in each of the six project sites.
We gathered information from a variety of sources to inform the findings in this report. We obtained information about project operations and the service environment through reviews of project documents, site visits, interviews with managers and staff, and focus group discussions with participating youth and their parents. We also examined data on enrollment of youth and service provision in the project’s management information system. Data for the impact analysis came from a 12-month follow-up survey and SSA administrative records. The survey focused on outcomes such as service use, employment, earnings, education, and attitudes and expectations. SSA administrative records provided data on benefits and the use of SSA work incentives and waivers. We also collected baseline data prior to random assignment through a survey and SSA administrative records. The comprehensive final report on the YTD evaluation, scheduled for 2014, will use data from a survey conducted 36 months after random assignment and SSA administrative records to assess more completely the transition process and the extent to which Youth WINS and the other five random assignment YTD projects improved transition outcomes.
The Youth WINS Project
The Youth WINS project, administered by Colorado WIN Partners of the University of Colorado Denver, was a person-centered case management intervention that first sought to gain an understanding of each participant’s goals and service needs and then used resources in the existing service system to meet those needs. The Youth WINS front-line staff were organized into four I-Teams (short for “Independence Teams”) based in One-Stop Workforce Centers in Boulder, Larimer, Pueblo, and El Paso counties. Each I-Team consisted of a disability program navigator (DPN), a benefits planner, and at least one career counselor. The DPN tried to ensure that participating youth understood the services to which they were entitled from various governmental agencies and community-based organizations and that they received the necessary services. The benefits planner informed the youth and their families about SSA benefits, work incentives, and the special waivers for YTD, and encouraged the use of the waivers through employment. After helping the youth develop employment goals, the career counselor provided assistance, either through referrals to other service providers or directly, to find jobs consistent with those goals.
Youth WINS targeted age-eligible youth who were current or recent recipients of SSA disability benefits and lived in the four counties in which the project operated: Boulder, Larimer, Pueblo, and El Paso. Mathematica randomly selected youth satisfying these criteria from the SSA disability rolls and recruited them into the study starting in August 2006 and ending in March 2008. After the youth completed the baseline interview and provided written consent to participate in the study, we admitted them into the evaluation’s research sample. Mathematica then randomly assigned members of this sample to the evaluation’s treatment or control group at a six-to-five ratio, resulting in a treatment group of 468 youth and a control group of 387.
xvi
Interim Report on Colorado Youth WINS Executive Summary
Youth in the study were about 20 years old on average at the time of random assignment. Reflecting the characteristics of youth in the target age range, about 55 percent of the study participants were male, nearly 75 percent were white, and mental illness and cognitive or developmental disabilities were the primary disabling conditions for more than 60 percent of them. About half of the youth were in school at the time of random assignment, and about one in three reported having worked for pay during the year prior to random assignment.
The I-Teams were responsible for enrolling treatment group members in Youth WINS services. Through an intensive effort from August 2006 through May 2008, they obtained written consent to participate in services for 401 youth, or 86 percent of the treatment group members. Following their enrollment in services, the I-Teams sought to engage youth in discussions on a broad range of topics related to the transition to adulthood. From these discussions, the teams identified short- and long-term goals for the youth and incorporated these goals into evolving person-centered plans. The plans specified the services the youth required to achieve the goals. The I-Teams then arranged for those services to be delivered, either through referrals to other service providers or directly by the I-Team members. Youth were eligible to receive services for 18 months.3 Services were terminated in fall 2009, and the project formally ended in January 2010.
Implementation Findings for Youth WINS
Youth WINS, which initially was funded through a cooperative agreement between SSA and Colorado WIN Partners in 2003, originally focused on the fragmentation and poor coordination of services for youth with disabilities. Accordingly, staffing was structured primarily around the provision of case management and brokering services; the delivery of direct services occurred only when service gaps existed. By the time SSA contracted with Mathematica in 2005 for a random assignment evaluation of YTD projects, Youth WINS had been operating on a pilot basis for two years, based on a program model that did not include a strong employment component. As a condition for its selection into the random assignment evaluation, the management of Youth WINS agreed to modify the project’s employment component to make it consistent with the YTD model.
As modified, Youth WINS was designed to facilitate the provision of services that covered all core intervention components specified in the YTD program model. Leveraging their housing in the One-Stop Workforce Centers, the I-Teams were to broker resources and services so that those youth whose person-centered plans included employment or who otherwise expressed interest in employment could obtain individualized work-based experiences, including career exploration, vocational assessments, and connections to employment. Participants were empowered to take charge of their own transitions through the person-centered planning process. Families also were engaged in the planning process. In addition, disability program navigation connected participants with other services for which they were eligible, including referrals to social and health services. Finally, benefits counselors worked with youth and their families to provide individualized information on SSA benefits, waivers, and other sources of public assistance; they also provided advice on the compatibility of paid employment with receipt of SSA benefits.
Youth WINS succeeded in enrolling a large number of youth with disabilities and delivering individualized case management services to nearly all of them. The I-Teams were well-integrated into the One-Stops in which they were based and also had good relationships with other agencies in
3 Youth who enroll in YTD project services are eligible for the SSA waivers for four years following random assignment, or until age 22, whichever comes later. All wavier eligibility is scheduled to cease in September 2013.
xvii
Interim Report on Colorado Youth WINS Executive Summary
their communities, such as the Colorado Division of Vocational Rehabilitation (DVR) and the Community Centered Boards (CCBs). Data from the project’s management information system indicate that the I-Teams delivered case management and benefits planning services to approximately 90 percent of Youth WINS participants, but they provided employment services to only about half of them. Although more than 40 percent of participants who responded to the evaluation’s one-year follow-up survey could not recall having received services from Youth WINS, most who could recall those services were satisfied with them.
While Youth WINS delivered case management, benefits counseling, and program navigation services to youth, the services lacked a strong and clear focus on employment. The Youth WINS model entailed the leveraging of existing services; however, over time, it became apparent that the service systems in the four study counties could not adequately deliver the job development, job placement, and other employment services that were key features of the YTD program model. These gaps in employment services arose because of cuts in the budgets of partner agencies such as DVR and the CCBs, and because the existing service system simply was not capable of meeting the needs of a large proportion of the Youth WINS population. To respond to these challenges in a manner consistent with the terms of its participation in the YTD random assignment evaluation, Youth WINS needed to realign its priorities and shift to delivering substantially more employment services directly. While the project was able to shift some staff and training resources to begin addressing these new realities, there were impediments to fully implementing this revised service delivery approach. Such impediments included conflicts with the original mission and philosophy of the project, inconsistent communication between management and staff about the evolving goals and staff roles, inadequate management support for external technical assistance to the I-Teams on the delivery of employment services, and other challenges inherent in shifting from a case management focus to the direct delivery of intensive employment services.
Given the funding shortfalls for employment and social welfare programs in Colorado and the overall scarcity of employment services for youth with disabilities, Youth WINS was positioned to be an innovative leader in the delivery of those services. However, the project’s original design and the philosophical commitment on the part of Youth WINS management to the original case-management program model ultimately may have limited its capacity to make a difference in employment outcomes for participating youth.
First-Year Impact Findings for Youth WINS
We estimated the impacts of Youth WINS on outcomes in five domains: (1) employment-promoting services, (2) paid employment, (3) education, (4) youth income, and (5) attitudes and expectations. Within each domain, we analyzed one primary outcome and a number of secondary outcomes. The results for the primary outcomes are the basis for our principal conclusions regarding the project’s impacts in the year following random assignment.
Impacts on the Use of Services
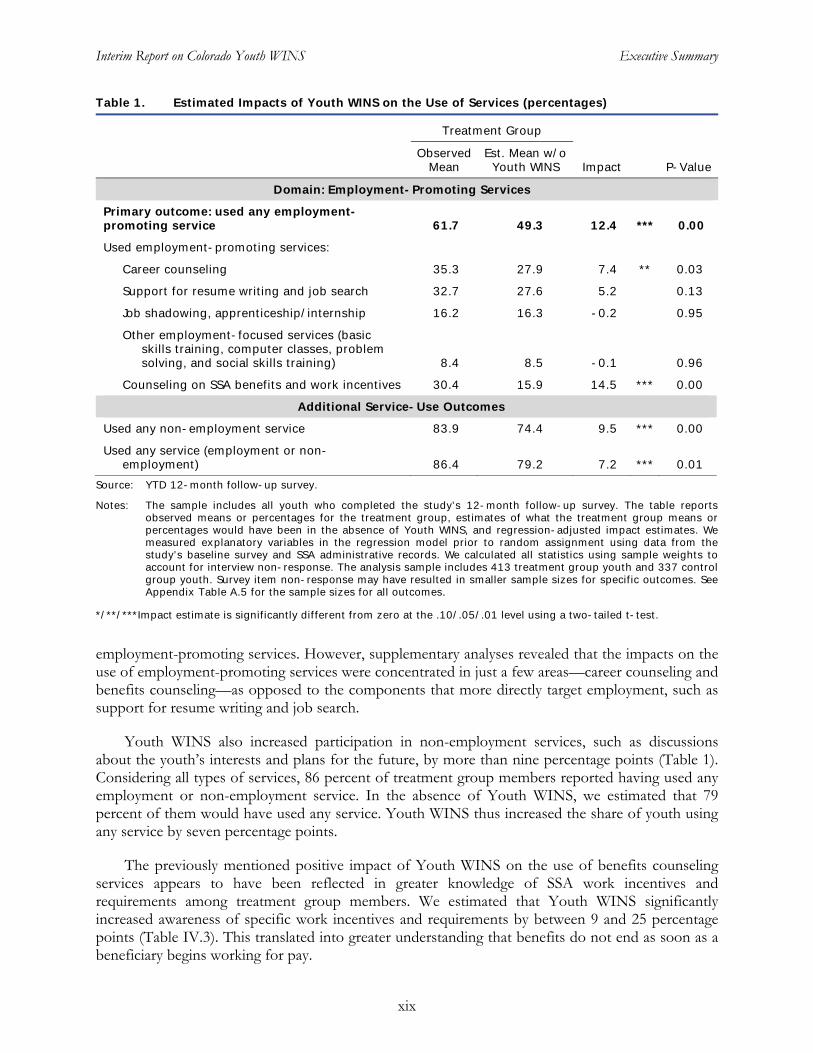
Consistent with the YTD program model, Youth WINS increased the use of employment-promoting services by youth with disabilities. Nearly 62 percent of treatment group youth reported in the 12-month follow-up survey having used any employment-promoting service (from Youth WINS or from other service providers) in the year following random assignment (Table 1). We estimated that, in the absence of Youth WINS, only about 49 percent of these youth would have used any such service. The impact of Youth WINS thus was a 12 percentage point increase in the use of
xviii
Interim Report on Colorado Youth WINS Executive Summary
Table 1. Estimated Impacts of Youth WINS on the Use of Services (percentages)
Treatment Group
Observed Est. Mean w/o Mean Youth WINS Impact P-Value
Domain: Employment-Promoting Services
Primary outcome: used any employment-promoting service 61.7 49.3 12.4 *** 0.00
Used employment-promoting services:
Career counseling 35.3 27.9 7.4 ** 0.03
Support for resume writing and job search 32.7 27.6 5.2 0.13
Job shadowing, apprenticeship/internship 16.2 16.3 -0.2 0.95
Other employment-focused services (basicskills training, computer classes, problem solving, and social skills training) 8.4 8.5 -0.1 0.96
Counseling on SSA benefits and work incentives 30.4 15.9 14.5 *** 0.00
Additional Service-Use Outcomes
Used any non-employment service 83.9 74.4 9.5 *** 0.00
Used any service (employment or nonemployment) 86.4 79.2 7.2 *** 0.01
Source: YTD 12-month follow-up survey.
Notes: The sample includes all youth who completed the study’s 12-month follow-up survey. The table reportsobserved means or percentages for the treatment group, estimates of what the treatment group means or percentages would have been in the absence of Youth WINS, and regression-adjusted impact estimates. Wemeasured explanatory variables in the regression model prior to random assignment using data from the study’s baseline survey and SSA administrative records. We calculated all statistics using sample weights toaccount for interview non-response. The analysis sample includes 413 treatment group youth and 337 control group youth. Survey item non-response may have resulted in smaller sample sizes for specific outcomes. See Appendix Table A.5 for the sample sizes for all outcomes.
*/**/***Impact estimate is significantly different from zero at the .10/.05/.01 level using a two-tailed t-test.
employment-promoting services. However, supplementary analyses revealed that the impacts on the use of employment-promoting services were concentrated in just a few areas—career counseling and benefits counseling—as opposed to the components that more directly target employment, such as support for resume writing and job search.
Youth WINS also increased participation in non-employment services, such as discussions about the youth’s interests and plans for the future, by more than nine percentage points (Table 1). Considering all types of services, 86 percent of treatment group members reported having used any employment or non-employment service. In the absence of Youth WINS, we estimated that 79 percent of them would have used any service. Youth WINS thus increased the share of youth using any service by seven percentage points.
The previously mentioned positive impact of Youth WINS on the use of benefits counseling services appears to have been reflected in greater knowledge of SSA work incentives and requirements among treatment group members. We estimated that Youth WINS significantly increased awareness of specific work incentives and requirements by between 9 and 25 percentage points (Table IV.3). This translated into greater understanding that benefits do not end as soon as a beneficiary begins working for pay.
xix
Interim Report on Colorado Youth WINS Executive Summary
Impacts on Paid Employment and Other Key Outcomes
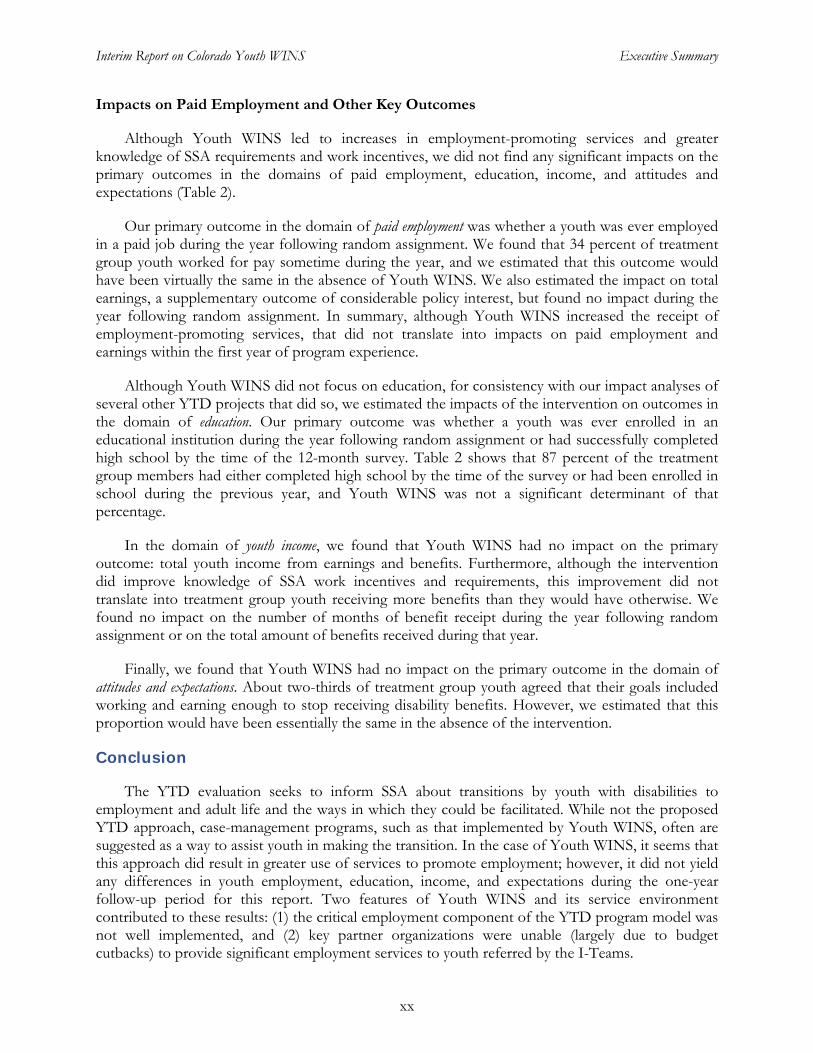
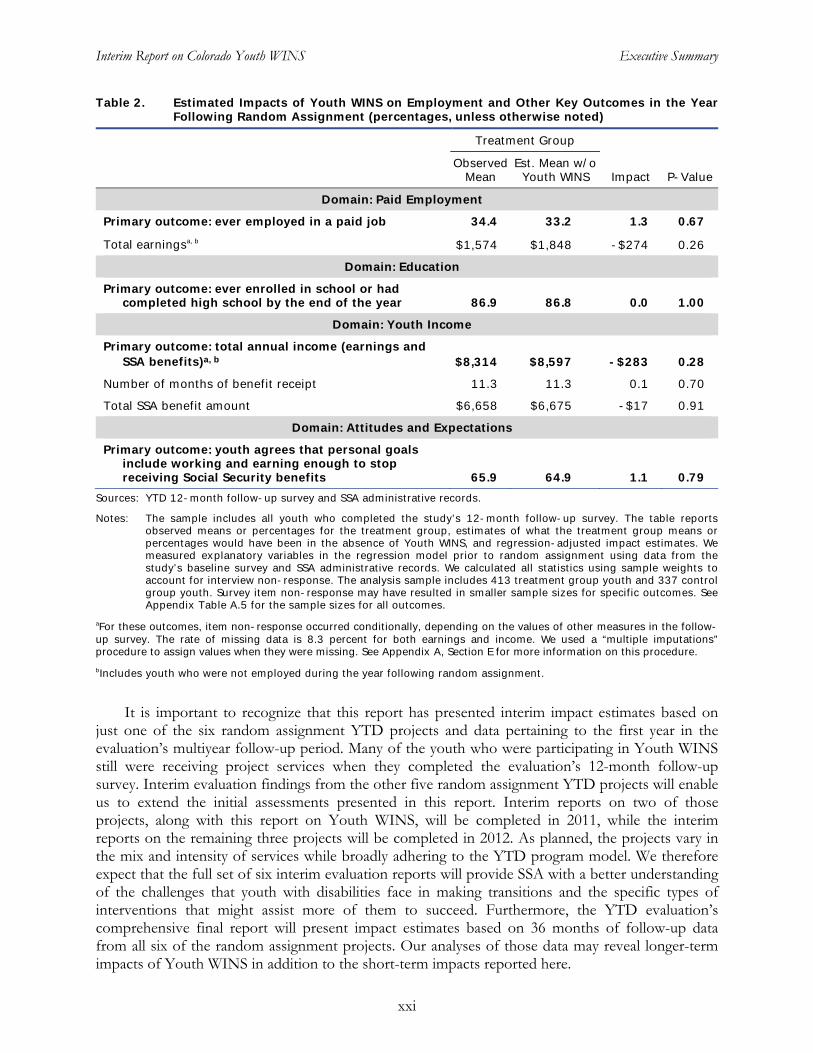
Although Youth WINS led to increases in employment-promoting services and greater knowledge of SSA requirements and work incentives, we did not find any significant impacts on the primary outcomes in the domains of paid employment, education, income, and attitudes and expectations (Table 2).
Our primary outcome in the domain of paid employment was whether a youth was ever employed in a paid job during the year following random assignment. We found that 34 percent of treatment group youth worked for pay sometime during the year, and we estimated that this outcome would have been virtually the same in the absence of Youth WINS. We also estimated the impact on total earnings, a supplementary outcome of considerable policy interest, but found no impact during the year following random assignment. In summary, although Youth WINS increased the receipt of employment-promoting services, that did not translate into impacts on paid employment and earnings within the first year of program experience.
Although Youth WINS did not focus on education, for consistency with our impact analyses of several other YTD projects that did so, we estimated the impacts of the intervention on outcomes in the domain of education. Our primary outcome was whether a youth was ever enrolled in an educational institution during the year following random assignment or had successfully completed high school by the time of the 12-month survey. Table 2 shows that 87 percent of the treatment group members had either completed high school by the time of the survey or had been enrolled in school during the previous year, and Youth WINS was not a significant determinant of that percentage.
In the domain of youth income, we found that Youth WINS had no impact on the primary outcome: total youth income from earnings and benefits. Furthermore, although the intervention did improve knowledge of SSA work incentives and requirements, this improvement did not translate into treatment group youth receiving more benefits than they would have otherwise. We found no impact on the number of months of benefit receipt during the year following random assignment or on the total amount of benefits received during that year.
Finally, we found that Youth WINS had no impact on the primary outcome in the domain of attitudes and expectations. About two-thirds of treatment group youth agreed that their goals included working and earning enough to stop receiving disability benefits. However, we estimated that this proportion would have been essentially the same in the absence of the intervention.
Conclusion
The YTD evaluation seeks to inform SSA about transitions by youth with disabilities to employment and adult life and the ways in which they could be facilitated. While not the proposed YTD approach, case-management programs, such as that implemented by Youth WINS, often are suggested as a way to assist youth in making the transition. In the case of Youth WINS, it seems that this approach did result in greater use of services to promote employment; however, it did not yield any differences in youth employment, education, income, and expectations during the one-year follow-up period for this report. Two features of Youth WINS and its service environment contributed to these results: (1) the critical employment component of the YTD program model was not well implemented, and (2) key partner organizations were unable (largely due to budget cutbacks) to provide significant employment services to youth referred by the I-Teams.
xx
Interim Report on Colorado Youth WINS Executive Summary
Table 2. Estimated Impacts of Youth WINS on Employment and Other Key Outcomes in the Year Following Random Assignment (percentages, unless otherwise noted)
Treatment Group
Observed Est. Mean w/o Mean Youth WINS Impact P-Value
Domain: Paid Employment
Primary outcome: ever employed in a paid job 34.4 33.2 1.3 0.67
Total earningsa, b $1,574 $1,848 -$274 0.26
Domain: Education
Primary outcome: ever enrolled in school or hadcompleted high school by the end of the year 86.9 86.8 0.0 1.00
Domain: Youth Income
Primary outcome: total annual income (earnings andSSA benefits)a, b $8,314 $8,597 -$283 0.28
Number of months of benefit receipt 11.3 11.3 0.1 0.70
Total SSA benefit amount $6,658 $6,675 -$17 0.91
Domain: Attitudes and Expectations
Primary outcome: youth agrees that personal goalsinclude working and earning enough to stop receiving Social Security benefits 65.9 64.9 1.1 0.79
Sources: YTD 12-month follow-up survey and SSA administrative records.
Notes: The sample includes all youth who completed the study’s 12-month follow-up survey. The table reportsobserved means or percentages for the treatment group, estimates of what the treatment group means or percentages would have been in the absence of Youth WINS, and regression-adjusted impact estimates. Wemeasured explanatory variables in the regression model prior to random assignment using data from the study’s baseline survey and SSA administrative records. We calculated all statistics using sample weights toaccount for interview non-response. The analysis sample includes 413 treatment group youth and 337 control group youth. Survey item non-response may have resulted in smaller sample sizes for specific outcomes. See Appendix Table A.5 for the sample sizes for all outcomes.
aFor these outcomes, item non-response occurred conditionally, depending on the values of other measures in the follow-up survey. The rate of missing data is 8.3 percent for both earnings and income. We used a “multiple imputations”procedure to assign values when they were missing. See Appendix A, Section E for more information on this procedure.
bIncludes youth who were not employed during the year following random assignment.
It is important to recognize that this report has presented interim impact estimates based on just one of the six random assignment YTD projects and data pertaining to the first year in the evaluation’s multiyear follow-up period. Many of the youth who were participating in Youth WINS still were receiving project services when they completed the evaluation’s 12-month follow-up survey. Interim evaluation findings from the other five random assignment YTD projects will enable us to extend the initial assessments presented in this report. Interim reports on two of those projects, along with this report on Youth WINS, will be completed in 2011, while the interim reports on the remaining three projects will be completed in 2012. As planned, the projects vary in the mix and intensity of services while broadly adhering to the YTD program model. We therefore expect that the full set of six interim evaluation reports will provide SSA with a better understanding of the challenges that youth with disabilities face in making transitions and the specific types of interventions that might assist more of them to succeed. Furthermore, the YTD evaluation’s comprehensive final report will present impact estimates based on 36 months of follow-up data from all six of the random assignment projects. Our analyses of those data may reveal longer-term impacts of Youth WINS in addition to the short-term impacts reported here.
xxi

Interim Report on Colorado Youth WINS Chapter I: Introduction
I. INTRODUCTION
Youth with disabilities often face a particularly difficult transition to adulthood. In addition to the host of issues facing all transition-age youth, those with disabilities face special challenges related to health, social isolation, service needs, and lack of access to supports. These challenges complicate their planning for education, work, and adult life in general. Many of these youth experience poor educational and employment outcomes, high risk of dependency on public benefits, and a lifetime of poverty. Despite broad recognition of these challenges and poor outcomes (Loprest and Wittenburg 2005, 2007), little is known about how best to help transitioning youth with disabilities improve their employment and earnings opportunities in adulthood.
To understand more fully how to help youth with disabilities reach their economic potential, the Social Security Administration (SSA) initiated the Youth Transition Demonstration (YTD) evaluation. The purpose of the evaluation is to find and test the most promising service strategies for helping youth with disabilities maximize their economic self-sufficiency as they transition from school to work. The SSA is also interested in testing the effectiveness of altering certain benefit program rules as an incentive to encourage youth with disabilities to initiate work or increase their work activity to increase earnings. The target population for YTD is youth ages 14 to 25 who currently receive SSA disability benefits or are at risk of receiving such benefits.4
Using a rigorous random assignment methodology, the YTD evaluation examines the extent to which the various work-promoting services and incentives help youth with disabilities achieve greater economic self-sufficiency as they transition to adulthood.5 Under YTD, SSA (with input from the evaluation contractor) selected six project sites for evaluation based on their adoption of promising strategies to support youth with disabilities. The YTD projects focus on youth empowerment, self-sufficiency, employment, and earnings, and provide employment services, benefits counseling, links to services in the broader community, and other family and youth supports. In addition, SSA has provided special waivers for YTD to improve work incentives by allowing participating youth to retain more of their disability benefits and health insurance in the short term while they work or engage in work-based experiences.
As part of the YTD evaluation, Mathematica Policy Research and its subcontractors are conducting site-specific interim studies to examine implementation of the intervention and assess the short-term impacts during the year after youth were offered demonstration services. In this report, we present the first set of findings for the Colorado Youth WINS (Work Incentive Network of Supports) demonstration. We provide both a detailed explanation of the Youth WINS
4 The SSA disability population eligible for YTD includes beneficiaries of the following programs: child and adult Supplemental Security Income (SSI), Social Security Disability Insurance (DI), and Childhood Disability Benefits (CDB). SSI is a means-tested program for which eligibility is based on severe functional limitations (for child SSI benefits) or a medically determined disability that prevents substantial gainful employment (for adult SSI benefits). DI beneficiaries are individuals with an earnings history and a disability that prevents substantial gainful employment. CDB beneficiaries must be under age 25, have a disabling condition with an onset before age 22, and a parent receiving Social Security benefits (see Rangarajan et al. 2009a, pp. 18-19).
5 Under SSA contract #SS00-05-60084, Mathematica Policy Research, a nonpartisan firm that conducts policy research and surveys, assembled a multidisciplinary team, including key partner organizations MDRC and TransCen, Inc., to design and conduct the YTD evaluation and provide technical assistance to the projects as they develop and implement their YTD interventions. The YTD project is advised by a technical working group that has reviewed the evaluation design (Rangarajan et al. 2009a).
1
Interim Report on Colorado Youth WINS Chapter I: Introduction
intervention and an in-depth discussion of how the project was implemented, including its fidelity to the intended demonstration model. We also provide estimates of the impacts of the project on the receipt of services by youth and on short-term outcomes, such as increased participation in paid employment, advancement in education, higher income from earnings and benefits, and a stronger sense of self-efficacy. In this evaluation’s comprehensive final report, we will assess longer-term effects of this project and the other five random assignment YTD projects on the transition to adult life, particularly in terms of improved employment and income.
We begin the report with an introduction to the YTD initiative, the YTD evaluation, and the Youth WINS project. In Chapter II, we describe our approach to conducting the process and impact analyses, including data sources, samples, key measures, and our analytic methodology. In Chapter III, we present the analysis of program implementation. In Chapters IV through IX, we present the short-term impacts on outcomes such as service use, employment, educational experiences, income, and youths’ expectations about the future. We present our conclusions from this interim research in Chapter X. In Appendices A through D, we present technical discussions and supplementary analyses.
A. The YTD Conceptual Framework
The YTD evaluation tests whether the provision of services and new work incentives to youth with disabilities can help young people overcome the barriers they face during their transition to adulthood. Many youth with disabilities, particularly those whose impairments are sufficiently severe to qualify them for SSA disability benefits, do not reach their full potential and instead experience high rates of unemployment, poverty, and incarceration (Loprest and Wittenburg 2007).
In designing the YTD intervention, we identified several barriers to successful transitions and then drew on the existing evidence to determine promising means of addressing those barriers. In particular, earlier demonstration projects provided evidence about what has worked for serving people similar to YTD youth.6 We also drew on the Guideposts for Success, developed by the National Collaborative on Workforce and Disability for Youth (2005). In the YTD evaluation design report (Rangarajan et al. 2009a), we summarize the research evidence that forms the basis of the demonstration.
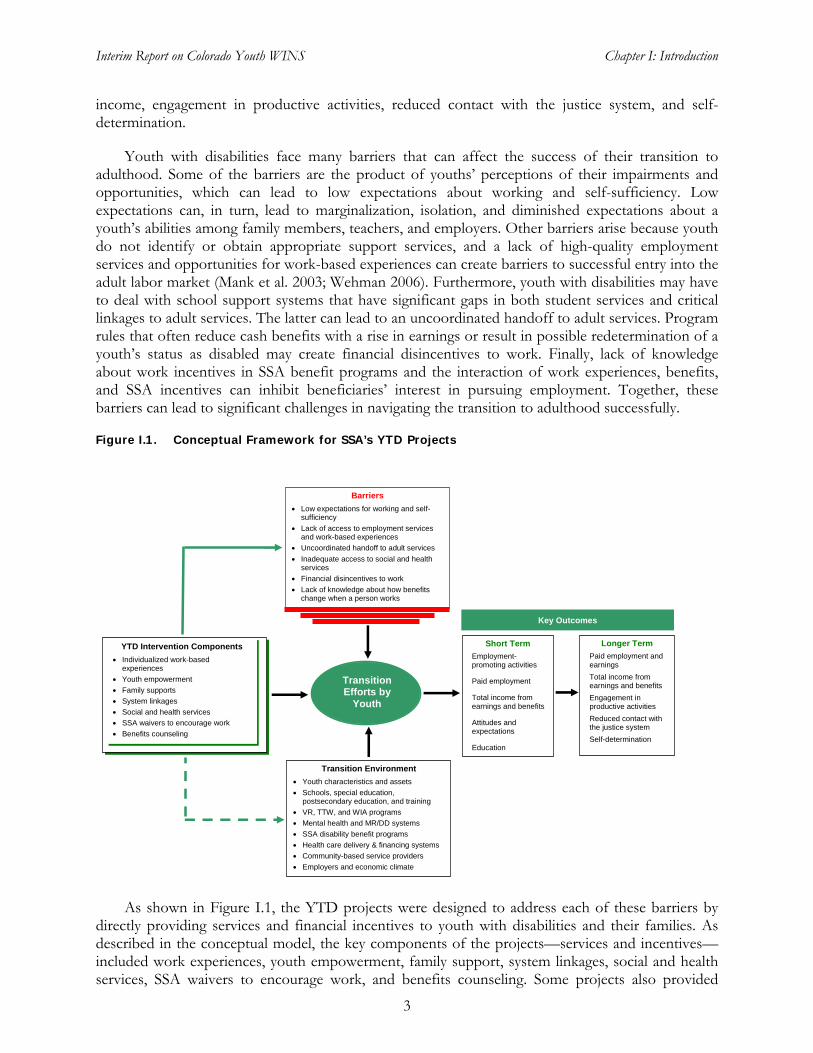
The YTD intervention design and evaluation are guided by a conceptual framework (Figure I.1) based on the research evidence and informed by SSA’s goals for the intervention. The transitions to adulthood made by youth with disabilities are shaped by the youths’ characteristics and their social, educational, and employment environments. However, several barriers may inhibit those transitions. The YTD intervention is intended to address the barriers and work within the environment of each demonstration site to facilitate better transitions. The evaluation assesses whether youth offered YTD services achieve improved short- and longer-term outcomes relative to youth not offered the services. In the short term, as examined in this interim report, we assess whether the planned intervention was delivered; the impact of YTD on service use; and short-term outcomes in employment, earnings, education, income, and expectations. In the longer term, we will examine whether YTD affected the key markers of a successful transition to adult life: employment, earnings,
6 The U.S. Department of Labor’s Structured Training and Employment Transitional Services demonstration and SSA’s Transitional Employment Training Demonstration provided valuable evidence for the design of the YTD intervention (Rangarajan et al. 2009a).
2
Interim Report on Colorado Youth WINS Chapter I: Introduction
income, engagement in productive activities, reduced contact with the justice system, and self-determination.
Youth with disabilities face many barriers that can affect the success of their transition to adulthood. Some of the barriers are the product of youths’ perceptions of their impairments and opportunities, which can lead to low expectations about working and self-sufficiency. Low expectations can, in turn, lead to marginalization, isolation, and diminished expectations about a youth’s abilities among family members, teachers, and employers. Other barriers arise because youth do not identify or obtain appropriate support services, and a lack of high-quality employment services and opportunities for work-based experiences can create barriers to successful entry into the adult labor market (Mank et al. 2003; Wehman 2006). Furthermore, youth with disabilities may have to deal with school support systems that have significant gaps in both student services and critical linkages to adult services. The latter can lead to an uncoordinated handoff to adult services. Program rules that often reduce cash benefits with a rise in earnings or result in possible redetermination of a youth’s status as disabled may create financial disincentives to work. Finally, lack of knowledge about work incentives in SSA benefit programs and the interaction of work experiences, benefits, and SSA incentives can inhibit beneficiaries’ interest in pursuing employment. Together, these barriers can lead to significant challenges in navigating the transition to adulthood successfully.
Figure I.1. Conceptual Framework for SSA’s YTD Projects
Short Term
Employment-promoting activities
Paid employment
Total income from earnings and benefits
Attitudes and expectations
Education
Longer Term
Paid employment and earnings
Total income from earnings and benefits
Engagement in productive activities
Reduced contact with the justice system
Self-determination
Key Outcomes
Transition Efforts by
Youth
Transition Environment
Youth characteristics and assets
Schools, special education, postsecondary education, and training
VR, TTW, and WIA programs
Mental health and MR/DD systems
YTD Intervention Components
Individualized work-based experiences
Youth empowerment
Family supports
System linkages
Social and health services
SSA waivers to encourage work
Benefits counseling
Barriers
Low expectations for working and self-sufficiency
Lack of access to employment services and work-based experiences
Uncoordinated handoff to adult services
Inadequate access to social and health services
Financial disincentives to work
Lack of knowledge about how benefits change when a person works
SSA disability benefit programs
Health care delivery & financing systems
Community-based service providers
Employers and economic climate
As shown in Figure I.1, the YTD projects were designed to address each of these barriers by directly providing services and financial incentives to youth with disabilities and their families. As described in the conceptual model, the key components of the projects—services and incentives— included work experiences, youth empowerment, family support, system linkages, social and health services, SSA waivers to encourage work, and benefits counseling. Some projects also provided
3
Interim Report on Colorado Youth WINS Chapter I: Introduction
education services. Although the YTD projects were not intended to bring about systems change, they may have improved the transition environment indirectly. For example, the YTD projects may have helped local service providers learn how better to meet the needs of youth with disabilities. The YTD evaluation does not test this potentially indirect effect (shown by the dotted arrow in the conceptual framework).
YTD was intended to help youth become as economically self-sufficient as possible as they transitioned to adulthood. Work-based experiences were a core component of the YTD intervention, and the YTD model stressed the importance of paid employment experiences. The projects offered a range of work-based service options, including career exploration, job shadowing, volunteer work, internships, apprenticeships, and paid employment. These experiences helped youth learn workplace skills, identify career preferences, and identify the workplace supports and accommodations that may be essential to employment success. The YTD intervention’s various options were designed to address the lack of access to employment services and paid work experiences faced by youth with disabilities. In addition, recognizing that education is an important determinant of future work success, some YTD projects supported educational goals, such as completing high school, obtaining a general educational development (GED) credential, and enrolling in postsecondary education. However, education-related services were not a major component of Youth WINS.
By emphasizing youth empowerment—the acquisition of skills and knowledge that enable youth to control their life choices—the YTD intervention addressed youths’ low expectations associated with working and self-sufficiency. Empowerment is critical to choices about participation in services that will influence youths’ education, employment, and career directions. The YTD projects facilitated empowerment by involving youth in developing person-centered plans for services that promote success in future goals. Through this process, the YTD projects identified the key barriers relevant to each youth and specified steps for addressing them.
Other important components of the YTD intervention included supporting the family with training and information to help youth make appropriate choices and navigate the service environment. Such support helped families address the barriers of low expectations and inadequate access to social and health services. In addition, to address the barriers resulting from uncoordinated service environments and inadequate access to services, the intervention emphasized linkages between systems, particularly those between academic coursework and work-based experiences and effective coordination of social and health services after school exit.
To enhance work incentives, the YTD projects also provided SSA waivers of disability program regulations. One barrier faced by youth is the disincentive to work per SSA program rules that reduce benefits as earnings rise, effectively reducing the extent to which employment financially benefits youth with disabilities. In response, the waivers for YTD encouraged paid employment by allowing youth to keep more of their earnings while continuing to pursue education and asset accumulation.
Under the earned income exclusion (EIE), SSI benefits are reduced by $1 for every $2 earned above a base amount. An important SSA waiver for YTD made the EIE more generous, so that benefits were reduced by only $1 for every $4 earned above a base amount.
For the student earned income exclusion (SEIE), which disregards up to $1,640 per month (in 2009) of a student’s earnings for those age 21 and younger, a waiver extended
4
Interim Report on Colorado Youth WINS Chapter I: Introduction
the earnings exclusion to all youth participating in YTD who attended school, regardless of age.
For youth who are determined ineligible for disability insurance for medical reasons, based on a continuing disability review (CDR) or age-18 medical redetermination, a waiver delayed the cessation of benefits for the duration of the other waivers.
In addition to the above waivers, SSA provided YTD participants with enhanced incentives for investing in self-sufficiency goals and accumulating savings. For youth with approved plans for achieving self-sufficiency goals (known as the “plan for achieving self-support,” or PASS), SSA disregarded the funds used for the PASS from eligibility determination and adjusted benefits to compensate partially for these expenses. The YTD waiver expanded eligible PASS activities to include postsecondary education and career exploration. Finally, SSA encouraged asset accumulation in federally-funded individual development accounts (IDAs) by not including any beneficiary deposits in the calculation of earned income that would reduce benefits and disregarding matching deposits, account balances, and interest earned from eligibility determinations. For YTD participants, these exclusions were extended to IDAs that are not federally funded. In Appendix D, we provide more complete descriptions of the five SSA waivers for YTD.
Finally, the YTD intervention provided benefits counseling to compensate for the lack of information about benefits and clarify the relationship between benefits and work. YTD benefits counseling assisted youth and their families in understanding the complexity of work incentives under SSA program rules.
The YTD evaluation team identified the key intervention components deemed best practices and required all projects to consider these components as part of their service models. TransCen, Inc., a subcontractor to Mathematica on the evaluation, provided the projects with training and technical assistance on implementation. However, each project enjoyed flexibility to customize its approach to service delivery in the manner determined to be most effective in improving outcomes for youth. It also should be noted that the components were delivered within the existing transition environment, and the projects, to varying degrees, leveraged services available in their communities. For these reasons, the projects differed in their service models and implementation, which in turn may have led to differential impacts on youth outcomes.
B. The YTD Evaluation
The YTD evaluation design called for six projects to be selected to participate in the national impact evaluation. The projects were required to meet four key criteria. First, they had to offer high-quality intervention services expected to improve self-sufficiency. Second, as a group, the sites had to reflect a mix of service strategies and target populations. Third, they had to demonstrate the ability and willingness to participate in a random assignment evaluation. Finally, they had to be sufficiently large to serve 400 youth over a two- to three-year period.
In 2003, SSA entered into cooperative agreements with seven organizations to implement YTD projects that emphasized employment and youth empowerment. In 2006, SSA selected three of the seven projects for the random assignment evaluation.7 The choice of projects, based on
7 Among the four original YTD projects that did not participate in the random assignment evaluation, two (located in Iowa and Maryland) ceased operations in 2007 and two others (in California and Mississippi) continued providing services through 2009. Descriptions of the seven original YTD projects can be found in Martinez et al. (2010).
5
Interim Report on Colorado Youth WINS Chapter I: Introduction
recommendations from the evaluation team, included those with the capacity to serve the large number of youth required by the evaluation and a willingness to use a random assignment design. The projects were the Youth WINS project in four counties in Colorado; the Transition WORKS project in Erie County, New York; and the City University of New York Youth Transition Demonstration project in Bronx County, New York.
Also in 2006, the evaluation team conducted a nationwide search for potential new YTD projects by reaching out to organizations that either were operating strong transition programs or had the capacity to do so and met the evaluation requirements of an adequately sized target population and a willingness to implement random assignment. That search resulted in the selection of five organizations in fall 2006 to run pilot programs in 2007. Based on recommendations from the evaluation team, in November 2007, SSA selected three of the five organizations to implement their interventions fully and participate in the national impact study: These were Abilities, Inc., in Miami-Dade County, Florida; St. Luke’s House, in Montgomery County, Maryland; and the Human Resources Development Foundation, Inc., in 19 counties in West Virginia.8 Descriptions of all six random assignment YTD projects can be found in Martinez et al. (2008).
The YTD evaluation is based on a multicomponent design to provide strong evidence on the extent to which the intervention led to intended changes in the transition outcomes of youth. The process analysis examines the implementation of YTD in the six projects and considers how well the intended intervention was delivered. The impact analysis is based on a rigorous random assignment design. The target number of youth voluntarily enrolled for each site was 880, with 480 randomly assigned to a treatment group and the remainder assigned to the control group. Youth in the treatment group could receive YTD services as well as the SSA waivers, while those in the control group could receive only those services available in their communities, independent of the YTD initiative. Finally, the evaluation’s cost analysis examines the costs of the intervention components so as to assess the potential benefits and costs of scaling up implementation of the intervention.
Information for the evaluation comes from a wide range of data sources. We rely on program documents, site visits, interviews with managers and staff, and focus groups with youth and parents to examine the program service model, implementation, and participation. We also examine service provision data from the evaluation’s management information system, which was used by each project. Data for the impact analysis come from baseline and follow-up surveys and SSA administrative records. The follow-up surveys gather information on youth and family characteristics, as well as outcome measures such as service use, employment, earnings, and attitudes and expectations. They are conducted at one year and three years following random assignment. The administrative records provide information on earnings and benefits and on a small number of individual characteristics, covering a period ranging from one year before to three to four years after random assignment.
C. The Youth WINS Project
Youth WINS was administered by Colorado WIN Partners (CWP), which is housed within the University of Colorado Denver. Youth WINS was an intensive, person-centered case management intervention that first sought to gain a deep understanding of each youth’s unique goals and service needs and then used resources within the existing service system to meet those needs. Youth WINS
8 SSA funding for the two pilot projects (located in Vermont and Washington) not selected into the random assignment evaluation ceased on December 31, 2007.
6
Interim Report on Colorado Youth WINS Chapter I: Introduction
targeted those youth ages 14 to 25 who received SSA disability benefits and lived within the four counties in which the project operated: Boulder, Larimer, Pueblo, and El Paso.
Youth WINS services were delivered by I-Teams (short for "Independence Teams"), which were based in the local One-Stop Workforce Centers. This co-location with the workforce centers was unique among YTD projects. Each I-Team consisted of a disability program navigator (DPN), a benefits planner, and at least one career counselor. The DPN tried to ensure that the youth understood the services to which he or she was entitled from various governmental agencies and community-based organizations and that they received the necessary services. The benefits planner informed the youth and his or her family about SSA work incentives and the SSA waivers for YTD and encouraged their use through employment. After helping the youth develop employment goals, the career counselor then provided assistance, either directly or through referrals to other service providers, to find a job that would be consistent with those goals.
In Colorado, as in four of the other five YTD sites, SSA provided Mathematica with lists of Social Security beneficiaries from which to draw a random sample of youth eligible for Youth WINS. Mathematica conducted outreach to and recruited sample members for the study. The recruitment process extended from August 2006 until April 2008, when we obtained the target number (880) of baseline interviews and written consents for participation in the evaluation. After the initial outreach, the baseline interviews, and grants of consent, Mathematica randomly assigned youth to the treatment or control groups. Youth WINS began enrolling treatment group youth in project services in August 2006. Services terminated in the fall of 2009 and the project formally ended in January 2010.
After a youth enrolled in the project, the I-Teams sought to engage him or her in discussions on a broad range of topics related to the transition to adulthood. From these discussions, short- and long-term goals for the youth were identified and incorporated into an evolving person-centered plan. The plan specified the services the youth needed to achieve the goals. The I-Teams then arranged for those services to be delivered, either directly by I-Team members or indirectly through referrals to other service providers. Youth were eligible to receive services for 18 months.9
The Youth WINS program model entailed the leveraging of existing employment services. Over time, it became apparent that the service systems in the four counties where the project was operating could not adequately deliver job development, job placement, and other employment services that were key features of the YTD program model. While the project was able to shift some staff and training resources to partially address the need for employment services, due to the philosophical commitment on the part of Youth WINS management to their original case-management model, the project ultimately lacked a strong emphasis on employment services and individualized work-based experiences which ultimately may have limited its capacity to make a difference in employment outcomes for participating youth.
In Chapter III, we provide a fuller description of the Youth WINS project, the intended sequence of services for a youth who enrolled in the program, the roles of the team members, and the services actually provided by the project.
9 Youth who enrolled in YTD project services are eligible for the SSA waivers for four years past random assignment, or until the youth reaches age 22, whichever comes later. All waiver eligibility ceases after September 2013.
7
Interim Report on Colorado Youth WINS Chapter I: Introduction
D. Research Objectives for This Report
In this interim report, we examine the services that Youth WINS provided, assess how they were delivered and their fidelity to the proposed service model, and identify the successes and challenges associated with implementation. This analysis, known as process analysis, provides critical information for future replication or adoption of promising practices and informs policy by providing evidence of what is needed to implement programs similar to Youth WINS. The process analysis also improves our understanding of major impacts (or the lack thereof) by examining factors such as the fidelity of implementation to the proposed design, who participated in project activities, the intensity of services received, and challenges faced by the project.
Building on the process analysis, we examine whether Youth WINS improved short-run outcomes for youth 12 months after random assignment. If the project succeeded in engaging youth in services, we would expect that youth randomly selected to have the opportunity to participate in Youth WINS (treatment group members) would have higher levels of service use than youth ineligible for Youth WINS (control group members). Engaging youth in work-related activities through employment services is of particular importance for YTD, and we would expect to find an impact of Youth WINS on receipt of such services. We also would expect youth to take advantage of at least some of the SSA waivers within the first year. Furthermore, all YTD sites emphasized youth empowerment and individual goal setting; thus, we would expect some measures of youth empowerment, such as future expectations, to improve within the first year.
Given that the YTD program model emphasized paid employment and all YTD project sites were required to adopt an employment focus, it is important to examine short-term impacts on paid employment, earnings, and benefits. All YTD projects made some effort to place youth in employment. In light of this, the short-run impacts on employment-related measures reflect both participation in the YTD projects and the outcomes resulting from that participation. Indeed, more substantial employment impacts beyond project placements may not be subject to immediate influence, especially for youth who are under age 18 or in school. Hence, while we examine employment outcomes as part of this interim report, we will focus more attention on them in subsequent reports.
Although Youth WINS was not among the subset of YTD projects that also provided education services, Youth WINS may have improved educational outcomes through its support for developing and pursuing life goals. In addition, Youth WINS may have motivated participants to invest in education as an important step toward self-sufficiency. For these reasons, we also examine the short-term impact of Youth WINS on youths’ educational progress.
Before turning to the process and impact analyses, we describe our evaluation approach in Chapter II, including key outcome measures, data sources and analysis samples, and our approaches to conducting the process and impact analyses.
8
Interim Report on Colorado Youth WINS Chapter II: Study Design, Methods, and Data Sources
II. STUDY DESIGN, METHODS, AND DATA SOURCES
Rigorous assessment of the impacts of the YTD projects is a central component of the YTD evaluation. An experimental design, often considered the gold standard for evaluations, allows us to infer with a high degree of certainty whether project services lead to any impacts on youth. As important as it is to estimate project impacts, it is also critical to describe the process by which YTD services were delivered so that others considering the development of similar interventions will benefit from an understanding of both the context for interpreting project impacts and the information on project implementation successes and challenges. In this chapter, we describe our approach for conducting the impact and process analyses.
A. Impact Analysis
One of the hallmarks of the YTD evaluation is that it is based on a rigorous random assignment design. Youth identified as eligible for the evaluation are randomly assigned to the treatment or the control group; the treatment group is eligible to receive YTD services, while the control group has no access to YTD services but may use other services available in the community. Random assignment may lead to the creation of two groups with virtually identical pre-intervention experiences and characteristics. As a result, any observed differences in outcomes for the two groups after random assignment may be attributed with a known degree of certainty to the effects of the program.
It should be noted that participation by youth in the YTD evaluation was voluntary. Therefore, we expect that youth particularly interested in receiving employment-related services were more likely to have volunteered to participate. As a result, youth assigned to the control group and not eligible for YTD services might have been likely to seek similar types of services elsewhere in the community. Hence, the impacts of interest to the evaluation are the effects of the YTD interventions relative to other services in the community that youth may have used, not a counterfactual environment that lacked any services. The impact analysis in this interim report examines whether Youth WINS was effective in improving the short-term outcomes of the youth who were offered project services, covering the period up to one year following random assignment.
1. Outcome Measures
As described in the conceptual framework in Chapter I, by providing expanded services and waiving certain disability program rules, Youth WINS was expected to promote work and improve other outcomes for youth. If the project succeeded in implementing YTD services and work incentives, we would expect to observe greater use of employment-related services and better outcomes among youth randomly assigned to the treatment group versus those in the control group. If Youth WINS proved effective, the most immediate impacts of the interventions should be reflected by treatment group youth through increased use of employment-focused services and more work-related experiences, more paid employment, greater income resulting from increased employment, more use of SSA work incentives as a consequence of the waivers, greater educational progress, and more positive attitudes and expectations about the future.10
10 In the intermediate and longer terms, we would expect treatment group youth to increase their employment and earnings, have higher income, reduce risky behaviors, demonstrate greater self-determination and self-efficacy, and move toward independent living. The longer-term outcomes will cover three to four years following random assignment for youth in the study and will be based on data from the 36-month follow-up survey and administrative records.
9
Interim Report on Colorado Youth WINS Chapter II: Study Design, Methods, and Data Sources
Information on these short-term impacts is based on data from the YTD evaluation’s 12-month follow-up survey as well as administrative data on benefit receipt and use of SSA work incentives. In the 12-month survey, we gathered a large volume of information on outcomes for different aspects of youths’ lives, particularly participation in a variety of services, educational progress, work-related experiences, understanding of work incentives, and expectations about the future.
While all of the above outcomes are important and it is useful to assess the intervention’s impacts on each one, we must be mindful of the statistical problem of “multiple comparisons.”11
This problem arises when we estimate impacts on a large number of outcomes such that at least a few of the estimates will likely be statistically significant by chance, even if no true impacts occurred. We addressed the problem by specifying, a priori, a small number of domains or areas in which we expected to see program impacts and identifying a primary outcome to be tested in each domain.12
Our goal was to be as parsimonious as possible in defining the domains and primary outcomes while capturing the major areas in which the intervention might produce impacts. The primary outcomes were the basis for the tests of our main hypotheses. In addition, we examined several supplementary outcomes to help explain impacts on the primary outcomes. We highlighted the findings for the supplementary outcomes only if we found statistically significant impacts on the primary outcomes.
Guided by the conceptual framework in Figure I.1, our evaluation design report identified the primary domains and outcomes to be examined in our impact analyses (Rangarajan et al. 2009a). In Table II.1, we show the domains for which we expected Youth WINS to have short-term impacts and describe the primary outcomes examined as part of each domain. Also in this table, we describe the supplementary outcomes related to these domains.
Employment-Promoting Services. Through individualized employment-related services and case management support, Youth WINS was expected to improve youths’ employability. The primary outcome measure in the domain of employment-promoting services is whether a youth received any such services. This composite measure indicates whether the youth received career counseling, support for resume writing and job search activities, job shadowing and apprenticeships, other employment services, and counseling on SSA benefits and work incentives during the year following random assignment.
Paid Employment. One of the core components of the YTD initiative was to help youth find paid employment in the short term and put them on a path to consistent paid employment in the longer term. Hence, paid employment was an important domain for the evaluation. The primary outcome in the domain is whether a youth was ever employed in a paid job in the year following random assignment. Paid employment in the year following random assignment is, in part, a measure of receipt of services, as the YTD interventions are intended to emphasize experiences in paid employment.
11 This discussion and our approach to addressing the multiple comparisons problem are summarized from Schochet (2008).
12 We specified all outcomes a priori in an analysis plan (Rangarajan et al. 2009b). However, we determined the specific measures for some outcomes after examining distributions in the data and the extent of missing information (with treatment and control groups combined). For example, we specified in the analysis plan that we would examine the degree of employment. Subsequently, based on preliminary data analysis of the full sample (treatment and control cases combined), we determined that ever employed in a paid job in the year following random assignment was the best measure of the degree of employment.
10
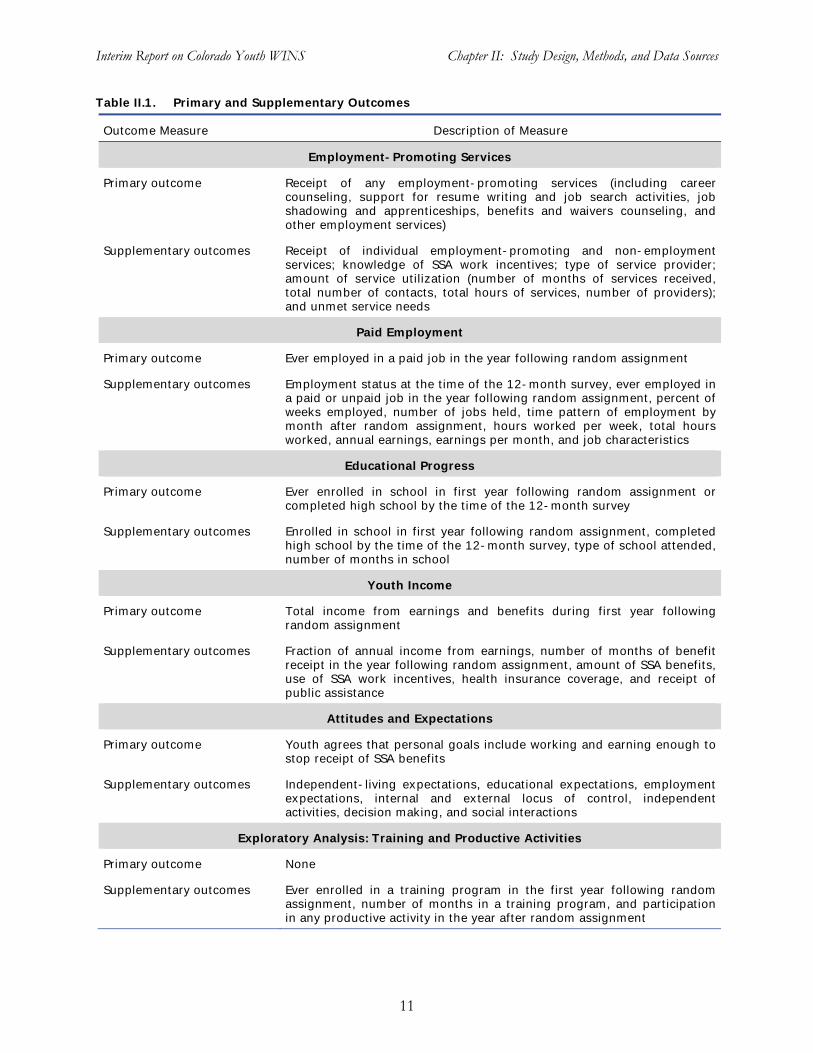
Interim Report on Colorado Youth WINS Chapter II: Study Design, Methods, and Data Sources
Table II.1. Primary and Supplementary Outcomes
Outcome Measure Description of Measure
Employment-Promoting Services
Primary outcome Receipt of any employment-promoting services (including career counseling, support for resume writing and job search activities, job shadowing and apprenticeships, benefits and waivers counseling, and other employment services)
Supplementary outcomes Receipt of individual employment-promoting and non-employment services; knowledge of SSA work incentives; type of service provider;amount of service utilization (number of months of services received, total number of contacts, total hours of services, number of providers);and unmet service needs
Paid Employment
Primary outcome Ever employed in a paid job in the year following random assignment
Supplementary outcomes Employment status at the time of the 12-month survey, ever employed in a paid or unpaid job in the year following random assignment, percent ofweeks employed, number of jobs held, time pattern of employment by month after random assignment, hours worked per week, total hoursworked, annual earnings, earnings per month, and job characteristics
Educational Progress
Primary outcome Ever enrolled in school in first year following random assignment or completed high school by the time of the 12-month survey
Supplementary outcomes Enrolled in school in first year following random assignment, completedhigh school by the time of the 12-month survey, type of school attended, number of months in school
Youth Income
Primary outcome Total income from earnings and benefits during first year following random assignment
Supplementary outcomes Fraction of annual income from earnings, number of months of benefitreceipt in the year following random assignment, amount of SSA benefits,use of SSA work incentives, health insurance coverage, and receipt ofpublic assistance
Attitudes and Expectations
Primary outcome Youth agrees that personal goals include working and earning enough to stop receipt of SSA benefits
Supplementary outcomes Independent-living expectations, educational expectations, employment expectations, internal and external locus of control, independent activities, decision making, and social interactions
Exploratory Analysis: Training and Productive Activities
Primary outcome None
Supplementary outcomes Ever enrolled in a training program in the first year following random assignment, number of months in a training program, and participationin any productive activity in the year after random assignment
11
Interim Report on Colorado Youth WINS Chapter II: Study Design, Methods, and Data Sources
Educational Progress. Although Youth WINS did not provide direct educational services, the project sought to maximize self-sufficiency through a person-centered case management approach. Youth WINS may have helped youth achieve educational goals as part of progressing in their life goals and as an important step toward self-sufficiency. For these reasons, we examine the short-term impact of Youth WINS on educational progress. The primary outcome in this domain is a composite measure of enrollment in school at any time during the year following random assignment or completion of high school by the time of the 12-month survey.
Youth Income. The YTD initiative was expected to improve the income of participants by increasing earnings and offering work incentives that permitted youth to retain more of their benefits as their earnings increased. Thus, one of the important outcomes for examination is total income received by youth from earnings and SSA disability benefits in the first year following random assignment.
Attitudes and Expectations. A key component of Youth WINS was youth empowerment. Project staff developed a person-centered plan for each youth, in which the youth’s interests and preferences played a role in determining his or her transition plan. Thus, Youth WINS was expected to improve outcomes related to youths’ attitudes and beliefs about themselves. The primary outcome for the attitudes and expectations domain was whether youth agreed with the statement that their “personal goals include working and earning enough to stop receiving SSA benefits.”
Exploratory Analysis: Training and Any Productive Activity. As a supplementary analysis, we explored whether Youth WINS had an impact on job training activities. We also estimated the impact on a composite measure of productive activities, including enrollment in school, job training, paid employment, and unpaid employment.
2. Sample Selection and Recruitment
Youth WINS targeted youth ages 14 through 25 who received SSI, DI, or CDB. The sampling frame for the YTD evaluation was Social Security disability beneficiaries who were in the target age range and lived in one of the four counties served by the project.13 All youth in the sampling frame (and in the research sample that we drew from the sampling frame) were on the SSA benefit rolls at the time of data extraction; however, a small percentage of them were not in “current pay” status. Subsequent analysis of benefit records showed that three percent of youth in the research sample did not receive benefits in the year prior to random assignment. These youth were considered to be at high risk of returning to “current pay” status in the future. With this caveat, we refer to the members of the research sample as “beneficiaries.”
Mathematica conducted outreach and recruited eligible youth into the study. During a recruitment period from August 2006 to March 2008, Mathematica randomly selected 2,968 eligible
13 We classified each youth as a resident of one of the four target counties based on ZIP codes provided in the SSA data files that constituted the study’s sampling frame. If a youth’s residential or mailing address had a ZIP code that, either in whole or in part, was in a target county, then that youth satisfied the geographic criterion for inclusion in the study. Youth who had moved to ZIP codes wholly outside of the target counties by the time of the baseline survey were not included in the study. However, youth who moved after the baseline survey were retained in the study. Initially, Youth WINS did not attempt to enroll in project services treatment group youth who were residing outside of the four target counties. However, as the enrollment period drew to a close, the project opted to enroll a small number of youth living in Broomfield and Weld counties (bordering on Boulder and/or Larimer counties) to facilitate the attainment of its goal of enrolling 400 treatment group youth in project services.
12
Interim Report on Colorado Youth WINS Chapter II: Study Design, Methods, and Data Sources
youth from beneficiary rolls provided by SSA.14 Mathematica attempted to contact these youth for baseline interviewing and gathering of written informed consent until 880 youth completed these steps and were enrolled in the evaluation (see Figure II.1). After receiving informed consent orally, we conducted baseline interviews with 45 percent of the youth (1,332). Of the 1,636 youth with whom we could not conduct interviews, about 25 percent refused to participate in the survey. The rest were “unlocatable” (28 percent; we were unable to reach them by using the information in SSA files or additional contact information drawn from publicly available sources); found to be ineligible (26 percent; they had moved out of the target counties, were no longer age-eligible, or were deceased); or still in a stage of contact attempts when the survey concluded (21 percent). Of the youth who completed the baseline interview, 76 percent returned completed consent forms (guardian consent was required for minor youth). Among youth with signed consent forms, 87 percent agreed to participate in the evaluation, for a total enrollment of 880 youth in the evaluation.
Overall, we were able to enroll a broad group of disability beneficiaries who were similar on several baseline characteristics to those who did not enroll (based on data from administrative records; Appendix A, Table A.1).15 In particular, although we anticipated that Youth WINS would be most attractive to youth expecting to work, we observed no substantial differences in employment and earnings in the year before random assignment for the evaluation enrollees compared with non-enrollees. However, not unexpectedly, we did observe some differences between the two groups.16 In particular, compared with youth who did not enroll in the evaluation, a greater share of those who did enroll were in the middle age range (ages 18 through 21) and received their SSA benefits through their parent(s) as representative payees rather than directly or through other representative payees. Enrollees had a somewhat shorter duration of benefit receipt and were less likely to have a mental illness and more likely to have a cognitive/developmental disability. In addition, enrollees were more likely to be from Boulder and Larimer Counties and less likely to be from El Paso and Pueblo Counties. While these differences are small and do not suggest a strong pattern of self-selection into the study, we hypothesize that youth who chose to enroll in the evaluation may have self-selected based on unobserved characteristics, such as motivation to work in the future.
Of the 880 youth recruited into the evaluation, 855 were randomly assigned: 468 to a treatment group whose members were eligible to enroll in Youth WINS; 387 to a control group. The remaining 25 youth who provided written consent and had siblings already in the evaluation intentionally were assigned to the groups (20 treatment and 5 control) that matched the status of their siblings and were not part of the research sample for the Youth WINS evaluation.
Following random assignment, Youth WINS staff were responsible for enrolling treatment group members in the project and providing them with services. The enrollment target was 83
14 SSA provided Mathematica with lists of youth who were disability beneficiaries in the program catchment areas. The lists, which constituted the sampling frame for the evaluation, were updated periodically to capture new entrants. Mathematica randomly sorted the lists into survey replicates containing 10 eligible beneficiaries each. Each replicate was a random sample of the frame. We gradually released the replicates for purposes of baseline interviewing and gathering written informed consent to participate in the evaluation.
15 Youth were considered “enrolled” in the evaluation once they completed the baseline survey and signed a consent form agreeing to participate in the evaluation.
16 Baseline differences between youth who enrolled in the evaluation and non-enrollees do not lead to bias in the impact estimates, as both treatment and control group youth enrolled in the evaluation.
13
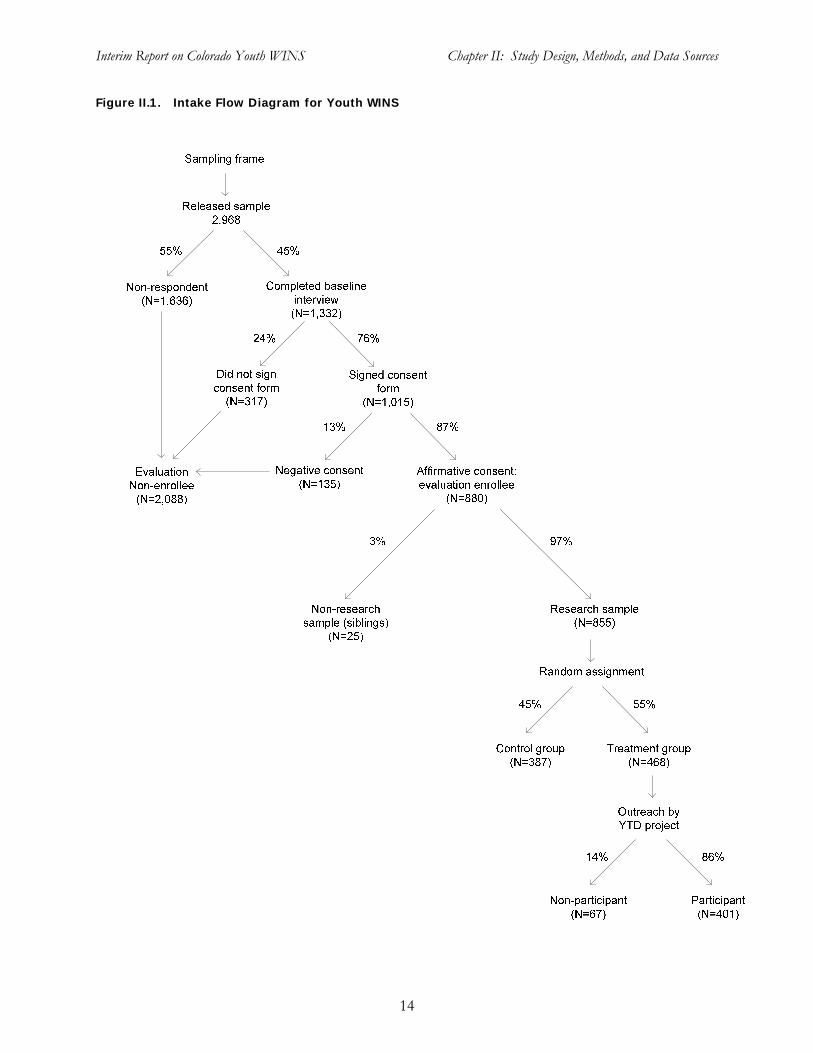
Interim Report on Colorado Youth WINS Chapter II: Study Design, Methods, and Data Sources
Figure II.1. Intake Flow Diagram for Youth WINS
14
Interim Report on Colorado Youth WINS Chapter II: Study Design, Methods, and Data Sources
percent, or 388 of the 468 youth randomly assigned to the treatment group. As described more fully in Chapter III, Youth WINS ultimately enrolled 401 of these youth.17
3. Data Sources and Analytic Sample
Data Sources. The impact analysis relied on both survey and administrative data from SSA records. We collected survey data at baseline (just before random assignment and the receipt of written consent for enrollment in the evaluation) and at 12 months following random assignment. We collected the data primarily through interviews with the youth, although we obtained some information from both the youth and the parent or guardian (satisfaction with YTD services and future expectations).18 In addition, for youth under age 18, we obtained some information only from the parent or guardian (school enrollment, service utilization, knowledge of SSA waivers). If the youth was unable to respond to questions, we asked the parent or guardian for the relevant information. Below, we briefly discuss the various data sources used in this interim impact report; we provide a more detailed discussion of these sources in the evaluation’s data collection and survey plan (Rangarajan et al. 2007).
The baseline survey was conducted as part of the evaluation’s sample intake process over the period August 2006 through March 2008. The survey consistently collected data on demographic characteristics and personal and family background for all youth enrolled in the evaluation (treatment and control groups). The baseline survey was the principal source of the control variables in the regression models used to improve the precision of impact estimates and control for any observable pre-existing differences between the two groups. It also was a source for variables that identified subgroups of youth for examination.
The first of two follow-up surveys of evaluation enrollees began in December 2007.19 We collected follow-up data through July 2009 for 413 of the 468 youth in the treatment group and 337 of the 387 youth in the control group (response rates of 88 percent and 87 percent, respectively).20
The follow-up survey gathered information on outcomes for the year following random assignment that may have been affected by participation in Youth WINS, such as receipt of work-related services, understanding of SSA work incentives, employment, education, and measures reflecting youth attitudes and expectations. For some outcomes, such as employment and receipt of services, the survey information covers the entire period following random assignment. For other outcomes, such as living arrangements and educational attainment, the survey information is specific to the time of the follow-up interview.
In addition to survey data, we relied on data from SSA administrative files for the impact analysis. SSA benefits and use of work incentives are of particular interest to the agency for
17 Youth WINS also enrolled 17 of the 20 non-research treatment group youth, for a total enrollment of 418.
18 In the impact analysis chapters, we provide details on the sources of information for outcome variables.
19 The first follow-up survey was planned to begin in August 2007, 12 months after the first evaluation enrollee was randomly assigned. However, the survey did not begin until December 2007, due to a delay in approval from the U.S. Office of Management and Budget.
20 As discussed in Section 6 of this chapter, we found that follow-up survey non-respondents differed from respondents to some extent. However, given high overall response rates, we found no differences in conclusions based on impact estimates for the respondent sample relative to the full sample when we examined impacts on benefits and work incentive outcomes for these groups based on administrative sources, which are available for all youth (Appendix A, Table A.9).
15
Interim Report on Colorado Youth WINS Chapter II: Study Design, Methods, and Data Sources
understanding program implementation and assessing program savings. We obtained benefit information from the Ticket Research File (TRF) (Hildebrand et al. 2010),21 which includes information on receipt of any disability benefits, type of benefits received, and monthly dollar amount of benefits received. We also used information from SSA records on work participation and use of SSA work incentives. In addition, we used data from the SSA Master Earnings File (MEF) to assess earnings of various sample groups in the year before random assignment.22 Finally, for all evaluation enrollees, we used administrative information on gender, age, language, primary disabling conditions, and representative payee type.
Analytic Sample. We treated as our main analytic sample for the interim impact analysis the 750 evaluation enrollees who completed the 12-month follow-up survey, which provided information on many of our primary outcomes. However, we have a larger sample of randomly assigned evaluation enrollees for whom we have data on benefits and use of SSA work incentives from administrative records. To make use of the best available sample, we report impact analysis results for the full sample of all randomly assigned youth for the benefits and work incentive use outcomes measured in administrative records.23 For these outcomes, we found no meaningful differences in the impact analysis results when we limited the analysis to the sample of 12-month survey completers (Appendix A, Table A.9).
We compared the baseline characteristics of treatment and control group members in the analytic sample to assess their equivalence at the time of random assignment. In all, we examined 50 characteristics. (We report 29 characteristics in Table II.2 and the rest in Appendix A, Table A.2.24) Overall, we found that the two groups were highly similar, but we did observe some differences. These were small and not statistically significant for most characteristics, including school attendance, living arrangements, family socioeconomic status, expectations for the future, age, and duration of benefit entitlement. The most notable difference between the two groups was that the treatment group was just over 60 percent male, whereas the control group was less than 53 percent male. This difference of almost eight percentage points is statistically significant at the five percent level. In addition, the treatment group was somewhat less likely to make snacks or sandwiches independently. However, for other measures of independent activities and decision making, there were no statistically significant differences between the groups: riding public transportation alone (Table II.2), picking clothes to wear, deciding how to spend own money, and deciding how to spend free time (Table A.2).
21 For disability benefit information from SSA records, we used an enhanced version of the TRF 2008, which includes benefit data through November 2009 (one year following the last random assignment for Youth WINS). From October 2004 onward, the TRF was expanded to include SSI beneficiaries as young as 10 years old. Previously, the minimum age for inclusion in the file was 18.
22 Post-random assignment data from the MEF were not available for the research sample in time to be analyzed for this interim report. We will present estimates of impacts on earnings as measured in the MEF in the comprehensive final report on all of the random assignment YTD projects.
23 The full research sample for the impact analysis of outcomes measured in administrative records consisted of the 855 youth who enrolled in the evaluation and were randomly assigned to treatment or control status, less five youth who had died as of the one-year anniversary of their random assignment, for a total of 850 youth (465 treatment and 385 control cases).
24 Table II.2 reports all key baseline characteristics, plus any characteristics we examined that showed a statistically significant difference between the treatment and control group at baseline. Table A.2 in Appendix A reports no statistically significant difference between treatment and control group members in the total amount of disability benefits received in the year before random assignment. Section F of Appendix A provides additional details on benefit amounts before random assignment.
16
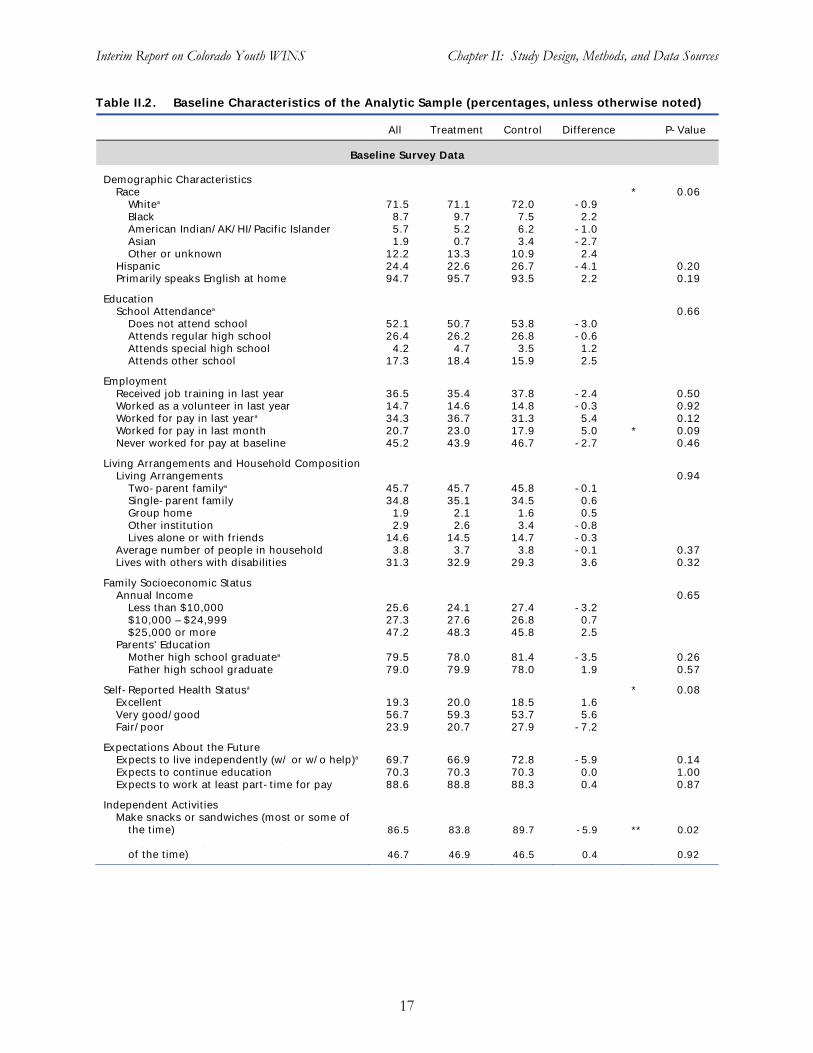
Interim Report on Colorado Youth WINS Chapter II: Study Design, Methods, and Data Sources
Table II.2. Baseline Characteristics of the Analytic Sample (percentages, unless otherwise noted)
All Treatment Control Difference P-Value
Baseline Survey Data
Demographic CharacteristicsRace * 0.06
Whitea 71.5 71.1 72.0 -0.9 Black 8.7 9.7 7.5 2.2 American Indian/AK/HI/Pacific Islander 5.7 5.2 6.2 -1.0 Asian 1.9 0.7 3.4 -2.7 Other or unknown 12.2 13.3 10.9 2.4
Hispanic 24.4 22.6 26.7 -4.1 0.20 Primarily speaks English at home 94.7 95.7 93.5 2.2 0.19
Education School Attendancea 0.66
Does not attend school 52.1 50.7 53.8 -3.0 Attends regular high school 26.4 26.2 26.8 -0.6 Attends special high school 4.2 4.7 3.5 1.2 Attends other school 17.3 18.4 15.9 2.5
Employment Received job training in last year 36.5 35.4 37.8 -2.4 0.50 Worked as a volunteer in last year 14.7 14.6 14.8 -0.3 0.92 Worked for pay in last yeara 34.3 36.7 31.3 5.4 0.12 Worked for pay in last month 20.7 23.0 17.9 5.0 * 0.09 Never worked for pay at baseline 45.2 43.9 46.7 -2.7 0.46
Living Arrangements and Household CompositionLiving Arrangements 0.94
Two-parent familya 45.7 45.7 45.8 -0.1 Single-parent family 34.8 35.1 34.5 0.6 Group home 1.9 2.1 1.6 0.5 Other institution 2.9 2.6 3.4 -0.8 Lives alone or with friends 14.6 14.5 14.7 -0.3
Average number of people in household 3.8 3.7 3.8 -0.1 0.37 Lives with others with disabilities 31.3 32.9 29.3 3.6 0.32
Family Socioeconomic StatusAnnual Income 0.65
Less than $10,000 25.6 24.1 27.4 -3.2 $10,000 – $24,999 27.3 27.6 26.8 0.7 $25,000 or more 47.2 48.3 45.8 2.5
Parents' Education Mother high school graduatea 79.5 78.0 81.4 -3.5 0.26 Father high school graduate 79.0 79.9 78.0 1.9 0.57
Self-Reported Health Statusa * 0.08 Excellent 19.3 20.0 18.5 1.6 Very good/good 56.7 59.3 53.7 5.6 Fair/poor 23.9 20.7 27.9 -7.2
Expectations About the FutureExpects to live independently (w/ or w/o help)a 69.7 66.9 72.8 -5.9 0.14 Expects to continue education 70.3 70.3 70.3 0.0 1.00 Expects to work at least part-time for pay 88.6 88.8 88.3 0.4 0.87
Independent ActivitiesMake snacks or sandwiches (most or some of
the time) 86.5 83.8 89.7 -5.9 ** 0.02 Ride public transportation alone (most or some
of the time) 46.7 46.9 46.5 0.4 0.92
17
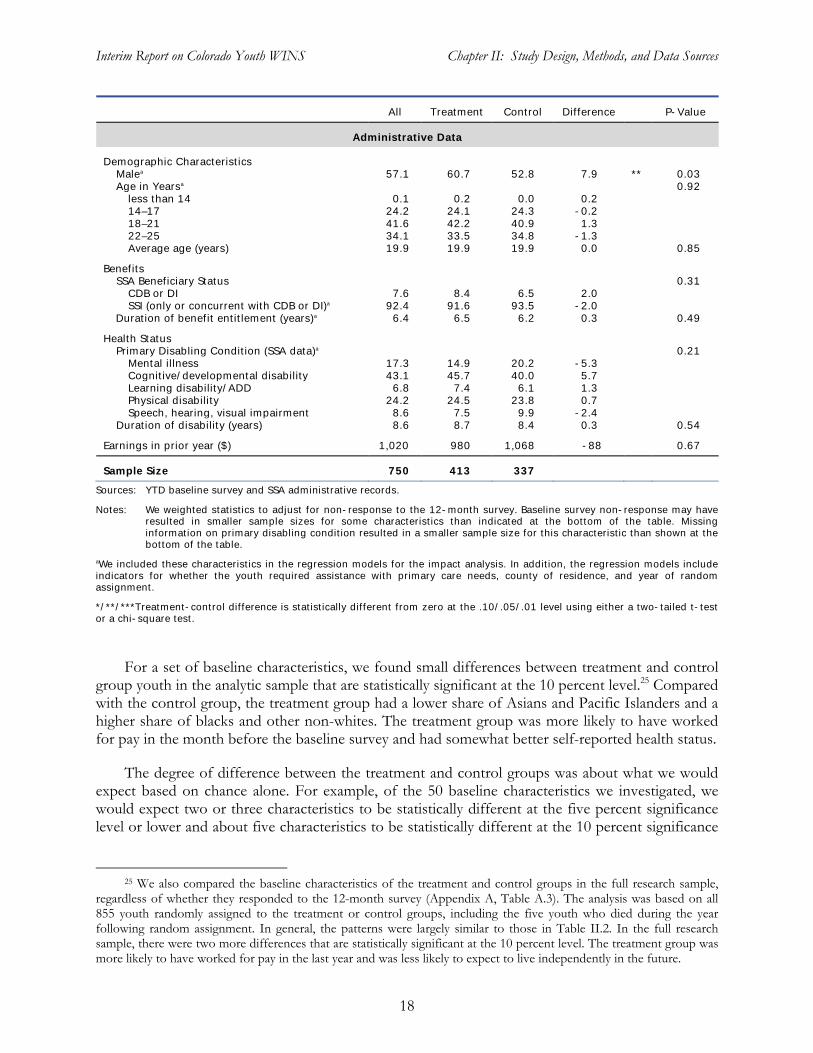
Interim Report on Colorado Youth WINS Chapter II: Study Design, Methods, and Data Sources
All Treatment Control Difference P-Value
Administrative Data
Demographic CharacteristicsMalea 57.1 60.7 52.8 7.9 ** 0.03 Age in Yearsa 0.92
less than 14 0.1 0.2 0.0 0.2 14–17 24.2 24.1 24.3 -0.2 18–21 41.6 42.2 40.9 1.3 22–25 34.1 33.5 34.8 -1.3 Average age (years) 19.9 19.9 19.9 0.0 0.85
Benefits SSA Beneficiary Status 0.31
CDB or DI 7.6 8.4 6.5 2.0 SSI (only or concurrent with CDB or DI)a 92.4 91.6 93.5 -2.0
Duration of benefit entitlement (years)a 6.4 6.5 6.2 0.3 0.49
Health Status Primary Disabling Condition (SSA data)a 0.21
Mental illness 17.3 14.9 20.2 -5.3 Cognitive/developmental disability 43.1 45.7 40.0 5.7 Learning disability/ADD 6.8 7.4 6.1 1.3 Physical disability 24.2 24.5 23.8 0.7 Speech, hearing, visual impairment 8.6 7.5 9.9 -2.4
Duration of disability (years) 8.6 8.7 8.4 0.3 0.54
Earnings in prior year ($) 1,020 980 1,068 -88 0.67
Sample Size 750 413 337
Sources: YTD baseline survey and SSA administrative records.
Notes: We weighted statistics to adjust for non-response to the 12-month survey. Baseline survey non-response may haveresulted in smaller sample sizes for some characteristics than indicated at the bottom of the table. Missing information on primary disabling condition resulted in a smaller sample size for this characteristic than shown at the bottom of the table.
aWe included these characteristics in the regression models for the impact analysis. In addition, the regression models include indicators for whether the youth required assistance with primary care needs, county of residence, and year of randomassignment.
*/**/***Treatment-control difference is statistically different from zero at the .10/.05/.01 level using either a two-tailed t-testor a chi-square test.
For a set of baseline characteristics, we found small differences between treatment and control group youth in the analytic sample that are statistically significant at the 10 percent level.25 Compared with the control group, the treatment group had a lower share of Asians and Pacific Islanders and a higher share of blacks and other non-whites. The treatment group was more likely to have worked for pay in the month before the baseline survey and had somewhat better self-reported health status.
The degree of difference between the treatment and control groups was about what we would expect based on chance alone. For example, of the 50 baseline characteristics we investigated, we would expect two or three characteristics to be statistically different at the five percent significance level or lower and about five characteristics to be statistically different at the 10 percent significance
25 We also compared the baseline characteristics of the treatment and control groups in the full research sample, regardless of whether they responded to the 12-month survey (Appendix A, Table A.3). The analysis was based on all 855 youth randomly assigned to the treatment or control groups, including the five youth who died during the year following random assignment. In general, the patterns were largely similar to those in Table II.2. In the full research sample, there were two more differences that are statistically significant at the 10 percent level. The treatment group was more likely to have worked for pay in the last year and was less likely to expect to live independently in the future.
18
Interim Report on Colorado Youth WINS Chapter II: Study Design, Methods, and Data Sources
level or lower. We found statistically significant differences for two characteristics at the five percent level and five characteristics at the 10 percent level.
4. Estimating Overall Impacts
Although random assignment ensures that a simple comparison of mean values of outcomes will yield unbiased estimates of program impacts, we estimated regression-adjusted impacts to increase the precision of the estimates. In addition, the regression-adjustment approach controls for the few chance differences in characteristics between treatment and control group members observed at baseline, which may be correlated with outcome measures. We estimated ordinary least squares regression models for continuous outcome measures, logistic regressions for binary outcomes, and multinomial logit models for categorical outcomes. We estimated impacts for all youth in the analytic sample. In particular, we included all treatment group members in the analytic sample, regardless of whether they enrolled in Youth WINS. The evaluation literature refers to the resulting estimates as the intent to treat (ITT) impact estimates.
Estimates of ITT impacts address the policy question: “What are the effects of a YTD project on eligible youth who were interested and consented to participate in YTD, and subsequently were offered the opportunity to do so?” The ITT impacts reflect both the decisions of those who declined to participate in project services and the effects of the YTD intervention on those who accepted the offer of services. Youth in the treatment group who declined to participate are a self-selected subset of treatment group youth likely to have different baseline characteristics, on average, than YTD participants. If these youth were excluded from the analysis, the control group would no longer provide a valid basis for comparison with the participant subsample.26
Our regression models used 15 distinct variables or sets of related variables to control for baseline characteristics believed to be correlated with the outcomes of interest.27 An important consideration in selecting the control variables was the need to adjust for any pre-existing differences at baseline between the treatment and control groups. We also used as controls (1) variables believed or known to have strong behavioral relationships with the outcome measures (for example, work experience or education); (2) variables that could be used to target intervention services to youth for whom they would have the greatest impacts (for example, age and school enrollment); and (3) variables related to the enrollment cohort or timing of random assignment (for example, year of random assignment).28
26 Bloom (1984) shows that, under some additional assumptions, ITT estimates can be adjusted to estimate the impact of an intervention on those who actually participated. These estimates are known as the impact of the treatment on the treated (TOT).
27 We list the control variables in the impact regression models in Table A.4 of Appendix A. Most of the variables also appear in Table II.2, where they are designated by an “a” superscript. In addition to the control variables in Table II.2, the regression models include indicators for whether the youth required assistance with primary care needs, county of residence, and year of random assignment. To keep Table II.2 brief, we present these and additional baseline characteristics in Table A.2 of Appendix A.
28 We excluded from the regression model two variables with statistically significant treatment-control differences in Table II.2. We excluded “worked for pay in the last month” because we believed that work experiences were better captured by the included variable “worked for pay in last year.” We excluded “make snacks or sandwiches” independently because we concluded that there was no systematic difference between the treatment and control groups in the area of independent activities and decision making due to the lack of any differences for the four other measures: ride public transportation alone (Table II.2), pick clothes to wear, decide how to spend own money, and decide how to spend free time (Table A.2). As a robustness check, we verified that inclusion of “worked for pay in the last month” and
(continued)
19
Interim Report on Colorado Youth WINS Chapter II: Study Design, Methods, and Data Sources
To provide context for interpreting the impact estimates, we report the estimates and observed means for the treatment group. We decided to report the treatment group means (rather than the observed control group means) because we judged them to be of greater interest to readers; furthermore, our discussions of findings begin with them.29 To illustrate the expected treatment group experience in the absence of Youth WINS, we show the observed treatment group means less the regression-adjusted impact estimates and refer to these as the “estimated treatment group means in the absence of Youth WINS.” Where we observe significant program impacts and want to describe their magnitudes in proportional terms, we use the estimated treatment group means in the absence of Youth WINS as our base; however, if these means differ by a meaningful amount from the observed control group means, we also report the proportional impacts using the observed control group means as our base (Appendix A, Section C).
We tested the sensitivity of the estimated impact on the primary outcome in each domain to the use of either the regression adjustment or a comparison of simple means (Appendix A, Table A.6) and found that the impact estimates were robust with respect to the particular estimation approach. The absolute sizes and proportional magnitudes of statistically significant impact estimates were very similar when we estimated using regression adjustment or simple means. In some instances, the signs or magnitudes of the estimated impacts varied with the estimation method, but in all of those instances, the estimated impacts are not statistically significant. Hence, the choice of estimation methodology did not affect our conclusions about the impacts of Youth WINS.
5. Estimating Subgroup Impacts
In addition to the impacts of Youth WINS on outcomes for all eligible youth, we were interested in estimating whether the project had different impacts on different types of youth. The subgroup analysis examined whether the intervention worked better for some youth versus others. Subgroup analysis can inform decisions about targeting scarce resources to specific groups. However, the limited size of the analytic sample (750 youth) meant that, for some subgroups, the sample sizes were insufficient to test for meaningful differences between them. Further, to be responsive to the multiple comparisons problem, we had to minimize the number of subgroups for which we would estimate impacts on primary outcomes and identify them upfront.
In our design report, which we prepared before conducting the impact analysis, we identified several baseline characteristics that define the subgroups that might be expected to experience different impacts of YTD: youth under age 18, youth enrolled in school, and youth experienced in working for pay (Rangarajan et al. 2009a). For example, we might expect to see larger employment impacts on older or out-of-school youth—as opposed to younger or in-school youth—and youth with at least some paid work experience. In addition, the expectations of youth who did not work for pay in the year before random assignment might have been more malleable than those of older youth and those with work experience. In Section G of Appendix A, we discuss impact estimates for additional, exploratory subgroups.
(continued) “make snacks or sandwiches” in the regression model did not alter any findings related to the statistical significance of impact estimates for primary outcomes. We also verified that the magnitudes of the estimates were essentially unchanged for primary outcomes with statistically significant impact estimates.
29 We show the observed control group means for all outcomes in each domain in Table A.5 of Appendix A, along with the observed treatment group means.
20
Interim Report on Colorado Youth WINS Chapter II: Study Design, Methods, and Data Sources
In Table II.3, we describe the sample sizes of the subgroups selected for analysis. To estimate subgroup impacts, we modified the regression models to include the interaction of the treatment status indicator with specific subgroup indicator variables. For each subgroup, we conducted tests to determine the statistical significance of the subgroup impact estimates and whether the impact estimates across the subgroups differed significantly from each other.30
6. Other Analytic Considerations
As noted, the response rate to the 12-month follow-up survey was quite high and fairly similar for the treatment and control groups (88 and 87 percent, respectively). Even with relatively high response rates, if respondents differed systematically from non-respondents and we did not account for the differences, the estimated impacts could be biased in the sense that they would not represent all youth enrolled in the evaluation.
We found that respondents did differ from non-respondents on several baseline characteristics. For example, respondents had somewhat higher educational attainment, were more likely to have received job training, were more likely to have health insurance, were more likely to live with their parent(s), were less likely to expect to live independently or continue their educations, and were more likely to receive benefits through CDB or DI rather than SSI (Appendix A, Table A.7). To account for the differences between the respondent and non-respondent samples, we used survey weights that adjusted the estimated impacts for survey non-response in all of our impact analyses for outcomes measured in survey data. The weights made the respondent cases more representative of the original sample of youth enrolled in the evaluation and reduced the potential for non-response bias. To calculate the weights, we used logistic models to estimate the propensity for a sample member to respond. In Section D of Appendix A, we describe the calculation of survey weights.
In addition, the availability of administrative data on some important outcomes for all evaluation enrollees during the year following random assignment allowed us to assess whether non-respondents experienced any changes since random assignment that may have led them to become non-respondents (Appendix A, Table A.8). Using administrative data on SSA disability benefit receipt and benefit amount, we estimated impacts for both the 12-month survey respondents and the full evaluation sample (Appendix A, Table A.9).31 We found little difference in the estimated impacts for the two samples; all statistically significant impact estimates were roughly the same in magnitude for both samples. Overall, the results suggest that use of non-response weights eliminated any potential bias in the estimated impacts attributable to non-response to the 12-month follow-up survey.32
For most of the control variables in our regression models, few observations had missing information, and we replaced any missing information with the mean value from the non-missing
30 In our design report (Rangarajan et al. 2009a), we noted that the estimates would have sufficient power to detect impact differences between subgroup pairs for pairs balanced in sample size (that is, with at least 40 percent of youth in the smaller group of the pair). We decided to report impact estimates for subgroup pairs that were not balanced because the estimates are of interest and may be statistically significant, particularly for the larger group of the subgroup pair.
31 We were not able to estimate impacts on earnings using the MEF administrative data because the data are not yet available for the follow-up period. We will examine this issue in future reports.
32 We did find a higher average benefit amount in the year following random assignment among respondents relative to non-respondents (Appendix A, Table A.8). The difference did not affect the impact estimates when we weighted the analysis to adjust for survey non-response (Appendix A, Table A.9).
21
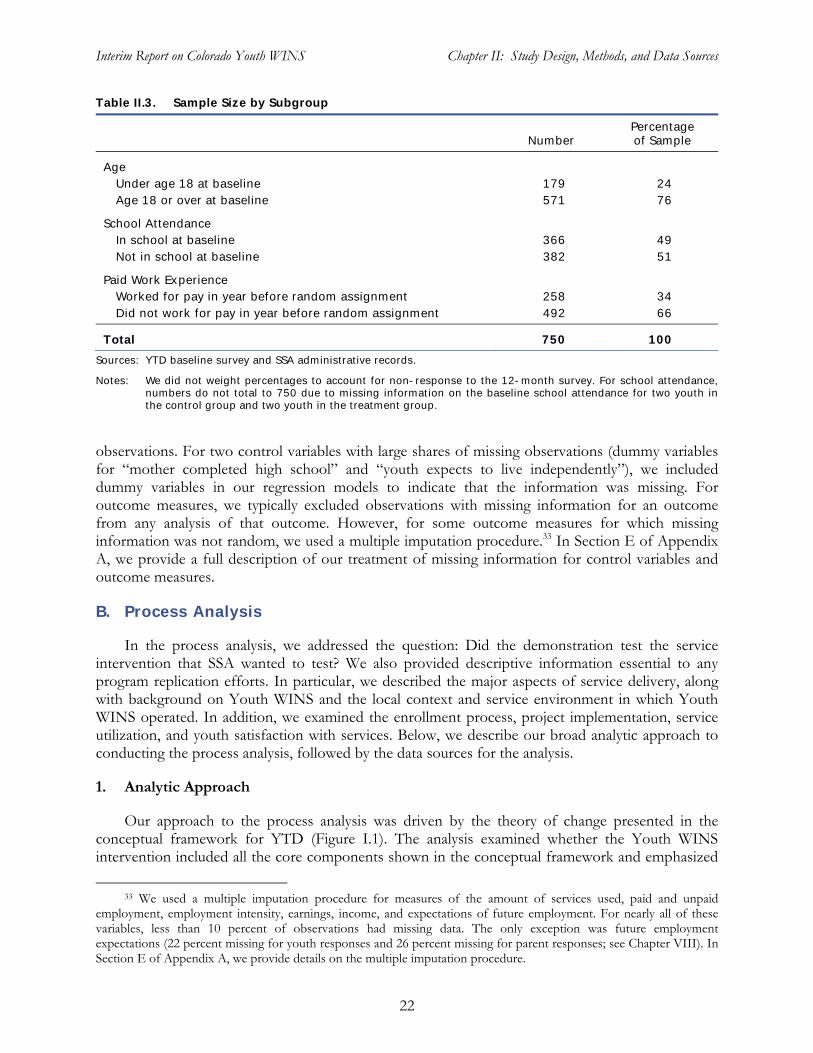
Interim Report on Colorado Youth WINS Chapter II: Study Design, Methods, and Data Sources
Table II.3. Sample Size by Subgroup
Number Percentageof Sample
AgeUnder age 18 at baseline Age 18 or over at baseline
179 571
24 76
School Attendance In school at baseline 366 49 Not in school at baseline 382 51
Paid Work ExperienceWorked for pay in year before random assignment Did not work for pay in year before random assignment
258 492
34 66
Total 750 100
Sources: YTD baseline survey and SSA administrative records.
Notes: We did not weight percentages to account for non-response to the 12-month survey. For school attendance,numbers do not total to 750 due to missing information on the baseline school attendance for two youth in the control group and two youth in the treatment group.
observations. For two control variables with large shares of missing observations (dummy variables for “mother completed high school” and “youth expects to live independently”), we included dummy variables in our regression models to indicate that the information was missing. For outcome measures, we typically excluded observations with missing information for an outcome from any analysis of that outcome. However, for some outcome measures for which missing information was not random, we used a multiple imputation procedure.33 In Section E of Appendix A, we provide a full description of our treatment of missing information for control variables and outcome measures.
B. Process Analysis
In the process analysis, we addressed the question: Did the demonstration test the service intervention that SSA wanted to test? We also provided descriptive information essential to any program replication efforts. In particular, we described the major aspects of service delivery, along with background on Youth WINS and the local context and service environment in which Youth WINS operated. In addition, we examined the enrollment process, project implementation, service utilization, and youth satisfaction with services. Below, we describe our broad analytic approach to conducting the process analysis, followed by the data sources for the analysis.
1. Analytic Approach
Our approach to the process analysis was driven by the theory of change presented in the conceptual framework for YTD (Figure I.1). The analysis examined whether the Youth WINS intervention included all the core components shown in the conceptual framework and emphasized
33 We used a multiple imputation procedure for measures of the amount of services used, paid and unpaid employment, employment intensity, earnings, income, and expectations of future employment. For nearly all of these variables, less than 10 percent of observations had missing data. The only exception was future employment expectations (22 percent missing for youth responses and 26 percent missing for parent responses; see Chapter VIII). In Section E of Appendix A, we provide details on the multiple imputation procedure.
22
Interim Report on Colorado Youth WINS Chapter II: Study Design, Methods, and Data Sources
particular components of the design. We examined the extent to which Youth WINS staff members were able to deliver services related to the core components and the successes and challenges they faced in doing so. We considered whether the barriers to successful transition in the four Colorado counties in which Youth WINS operated differed from those in the conceptual framework and how the intervention interacted with the environment and community service providers to shape youth transitions.
To ensure that we captured several perspectives on key issues, we used a systematic approach to gather information from a variety of sources. We started by identifying the key domains or areas in which we wanted to obtain information and the types of information we needed for each domain. We then developed a source grid that identified the sources that could provide reliable information for each domain of interest. The sources included interviews with program operators, direct service staff, program managers, and staff at other related community organizations. They also encompassed published statistics about the local environment (such as the unemployment rate) and administrative data from the Youth WINS management information system (Efforts-to-Outcomes, or ETO), program observations, and case file reviews. In addition, we gathered information from youth via focus group discussions. We developed a set of standard protocols to ensure that we covered all key items, collected data in a uniform fashion, and collected consistent information. The protocols included open-ended sections to capture information about unexpected challenges or successes. (For a detailed description of our analytic approach to conducting the process analysis, see Rangarajan et al. 2009a.)
The use of more than one perspective on key domains was a central element of our process analysis. To verify and analyze key questions, we assessed the extent to which multiple respondents suggested the same types of input and insights and how often they reported different experiences. The different perspectives might reflect information obtained from (1) different sources by the same informants (information provided by staff during site visit interviews versus information staff entered into ETO while delivering services); (2) staff in different agencies (for example, project versus school district staff); or (3) staff at different levels within an organization. The different perspectives provided a fuller understanding of implementation issues.
2. Data Sources and Sample
We tapped a wide range of qualitative and quantitative data sources to inform the process analysis, gathering qualitative data from interviews and focus groups during site visits to the project and obtaining quantitative data primarily from ETO. Project document reviews and ongoing communications with project management also informed the analysis.
The analysis of Youth WINS implementation relied primarily on qualitative data collected during site visits. The evaluation team assigned to Youth WINS made three research-related site visits to Colorado to study the project and interview staff and partners. The first visit, in April 2007, supported an early assessment of Youth WINS enrollment activities and the implementation of services (Baird et al. 2008). The team made subsequent visits in April 2008 and May 2009. During all visits, we conducted interviews with I-Team members, either individually or in groups, the Workforce Center managers who supervised the I-Teams, and the CWP management team in Denver. The evaluation team also systematically reviewed more than 25 Youth WINS cases with the I-Teams. In 2009, the evaluation team interviewed key community partners and conducted focus group discussions with youth who had participated in Youth WINS services. In addition, the analysis used information gathered during regular ongoing communication with the CWP
23
Interim Report on Colorado Youth WINS Chapter II: Study Design, Methods, and Data Sources
management team via telephone and email and a review of project documents, such as quarterly progress reports and a CWP process evaluation of Youth WINS (Pike et al. 2010).
As mentioned in Chapter I, given that SSA wanted to ensure that all YTD projects delivered strong services, it provided funding through the evaluation contract for a technical assistance provider, TransCen, Inc., to help the projects design and implement services and make certain that all recommended components were included in the projects’ service approaches. As an integral part of the evaluation, TransCen helped Youth WINS implement the core employment-focused components and integrate them into the project’s intervention; it delivered other technical assistance as needed. The evaluation team met regularly with the TransCen team to learn about project-specific issues and challenges. Information obtained from TransCen through regular team meetings also fed into the process analysis and helped the evaluation team understand the project’s successes and challenges.
The process analysis relied heavily on quantitative data from the Youth WINS management information system. As part of the YTD evaluation, each project was provided with ETO, which served as a case management tool for project line staff and a management tool for project managers, and provided information for the evaluation on services delivered. Data on enrollment activities and service utilization for the process analysis came from ETO. Staff members used ETO to record outreach efforts related to enrolling youth in Youth WINS and information related to the provision of services to or on behalf of enrolled youth. Services included direct services, such as developing a person-centered plan, and services provided on behalf of youth, such as contacting a community partner to arrange services for a specific youth.
Our analysis of ETO data suggests that, in some cases, some direct and indirect services were improperly omitted from ETO by YTD project staff (for Youth WINS and other sites).34 In addition, staff time on the project not directed to helping specific youth was omitted from ETO by design (for example, meeting with One Stop staff to discuss partnering arrangements). Finally, staff time on behalf of youth not related to service provision was intentionally omitted from ETO (for example, time spent travelling to meet with a youth).
We used the ETO data to address critical questions related to enrollment efforts, participant take-up of project services, type and level of services, and other service delivery issues. The sample for analysis of enrollment included all youth randomly assigned to receive an offer of Youth WINS services (that is, all treatment group members), while the sample for the analysis of service utilization included just those treatment group youth who enrolled in Youth WINS (about 86 percent of all treatment group youth). We had 15 months of ETO data available (through June 2009). As part of the process analysis, we also assessed the use of ETO by project staff and addressed its strengths and limitations for tracking services.
34 The entry of data on YTD services into ETO was a problem to some degree at all six of the random assignment sites. Problems occurred despite the evaluation team’s delivery of substantial technical assistance to site staff on the use of ETO. That technical assistance took the form of (1) an initial in-person training on ETO for the staff of each site; (2) occasional refresher trainings conducted either in person or through the Internet, combined with telephone conferencing; (3) a bi-monthly meeting of selected evaluation staff with the ETO administrators from the project sites (each site was required to designate an ETO administrator); and (4) formal feedback to project managers approximately one year after the start of random assignment on the quality of ETO data entry through site-specific early assessment reports.
24
Interim Report on Colorado Youth WINS Chapter II: Study Design, Methods, and Data Sources
The process analysis relied on ETO to describe service utilization among youth in the treatment group who had participated in Youth WINS. In contrast, the impact analysis of service utilization used data from the 12-month follow-up survey to compare service utilization among treatment and control group youth. For several reasons, data from the survey are not directly comparable to ETO data. For example, the latter are entered by program staff at the time of service delivery, whereas the follow-up data rely on youths’ recall of services used. Furthermore, ETO data reflect staff time spent on services with or on behalf of a specific youth. In contrast, youth reports in the survey data do not include efforts on behalf of youth when the efforts did not directly involve them (such as calls to other service providers to arrange for services). Perhaps most important, youth reports of service receipt include services provided by organizations or programs other than Youth WINS, whereas ETO data capture Youth WINS services only.
We used data from the baseline survey to provide information on the characteristics of the youth the project intended to serve, allowing us to develop useful descriptions of the target population and of those who enrolled in project services. We compared the baseline characteristics of treatment group youth who participated in Youth WINS with the baseline characteristics of treatment group youth who did not, using the baseline survey and SSA administrative data on earnings and benefits. Finally, data from the 12-month follow-up survey provided information on participants’ satisfaction with project services.
25

Interim Report on Colorado Youth WINS Chapter III: Implementation of Youth WINS
III. IMPLEMENTATION OF YOUTH WINS
The Youth WINS YTD project provided system navigation, benefits planning, case management,35 and employment services to youth receiving SSA disability benefits. By the project’s completion, it had served 401 youth in four geographically dispersed counties. While Colorado had an array of transition services for youth with disabilities, many of these had waiting lists and were not specifically designed to meet the needs of youth with significant disabilities. In general, these services were difficult to navigate and poorly coordinated. Youth WINS sought to maximize independence and self-sufficiency for youth on SSA disability benefits through a person-centered approach. The project’s emphasis was on coordinating with and filling gaps in local services as well as providing employment services, benefits planning, and comprehensive program navigation. Youth WINS services were delivered by I-Teams. In three of the counties, the I-Teams consisted of three staff members and in the fourth county, El Paso, the I-Team had five members due to a larger caseload. The I-Teams were based in the local One-Stop Workforce Centers, which was unique among YTD projects nationwide.
Youth WINS was designed to facilitate the provision of services that covered all core intervention components specified in the YTD conceptual framework (see Figure I.1), primarily through the provision of intensive case management. The I-Team members brokered existing resources and services so that youth could have individualized work-based experiences—including career exploration, vocational assessments, and connections to employment opportunities—when they expressed interest in them. Through individualized person-centered planning and benefits planning, youth were empowered to take charge of their own transitions. The project also invited the participants’ families to be included in the transition planning process. In addition, disability program navigation connected participants with other services for which they were eligible, including referrals to social and health services. Finally, benefits counselors worked with youth and their families to provide individualized information on SSA benefits, waivers, and other sources of public assistance; they also provided advice on how paid employment may impact SSA benefits.
We begin this chapter with an overview of the sponsoring and partner organizations for Youth WINS and continue with a description of both the service environment in which the project operated and details on specific Youth WINS services. We then present key findings from field analyses and review statistics from the project management information system, ETO, to assess program implementation. We end the chapter with conclusions and lessons that may be applicable to other projects providing employment-related services to youth with disabilities.
In summary, the original design of Youth WINS was intended to address fragmentation and lack of service coordination. As such, staffing was structured primarily around the provision of case management and brokering services; the provision of direct services was planned only when service gaps existed. This approach deviated from SSA’s and the evaluation team’s vision for YTD, in which direct service delivery was viewed as a core component of the approach. Youth WINS was strongly encouraged to adhere more closely to the core model; this was reinforced consistently through the provision of technical assistance and ongoing verbal and written recommendations. In principle,
35 In this report, “case management” refers to any type of service that helps youth address life issues or navigate systems. Youth often have an array of personal and social needs that they may require assistance in addressing. In general, services not directly linked to employment, education, or benefits are considered to be case management.
27
Interim Report on Colorado Youth WINS Chapter III: Implementation of Youth WINS
Youth WINS management agreed but, in practice, changes were made slowly, making it unlikely that Youth WINS would fully conform to the YTD program model during the evaluation timeframe.
Over time, it became apparent through discussions with Youth WINS staff and observations of project operations that the existing service system could not deliver adequate job placement and employment services—key features of YTD—to Youth WINS participants. The gaps in these services resulted both from significant agency budget cuts and because the existing service system was not capable of meeting the needs of a significant proportion of the project’s target population of youth with severe disabilities. In response to these challenges, Youth WINS needed to realign its priorities and shift to delivering more employment services directly. While some staff and training resources were adjusted to begin addressing these new realities late in the project’s period of performance, there were impediments to implementing this revised service delivery approach fully. Such impediments included conflicts with the original mission and philosophy of the project, inconsistent communication about the evolving goals and staff roles, inadequate management support for external technical assistance to the I-Teams on the delivery of employment services, and other operational challenges inherent in moving staff from a case management focus to a job placement role.
Given the funding shortfalls for employment and social welfare programs in Colorado and the overall scarcity of employment services for youth with disabilities, Youth WINS was positioned to be an innovative leader in the delivery of those services. However, the project’s original design may ultimately have limited its capacity to make a difference in employment outcomes for participating youth.
A. Overview of the Sponsoring Organization and Partners
Youth WINS was administered by Colorado WIN Partners (CWP), which is housed at the University of Colorado Denver.36 CWP came into being through the Project WIN (Work Incentives Network) program, which was funded in 1998 by a five-year systems change grant from the U.S. Department of Education’s Rehabilitation Services Administration. Project WIN was designed to expand employment opportunities for people with disabilities. For much of its history, Project WIN focused on the development of disability program navigators in Workforce Centers across the state. They provided training to Center staff on working effectively with people with disabilities and helped establish Center-specific policies on programmatic and physical accessibility. This work contributed to the development of a national model for disability program navigation later implemented by the U.S. Department of Labor.37
In September 2003, SSA selected CWP to operate a YTD project. The project got underway on a pilot basis in 2004-2005, when three sites in the state enrolled a small number of youth in project services. The pilot phase yielded important information on recruiting, obtaining informed consent from youth and guardians, marketing, and working with partner agencies. At the conclusion of the pilot in 2006, SSA and the YTD evaluation team selected Youth WINS to participate in the YTD national random assignment evaluation. CWP expanded the project to a fourth site to meet the sample size requirements of the national evaluation. In addition, the project was required to shore up its job development, job placement, and general employment services; this requirement was
36 CWP was able to take advantage of infrastructure and administrative support provided by the university, and the senior managers of Youth WINS were members of the faculty of the university.
37 See, for example, Emery et al. (2005) and Emery and Bryan (2006).
28
Interim Report on Colorado Youth WINS Chapter III: Implementation of Youth WINS
detailed in the memorandum of understanding (MOU) between CWP and Mathematica. Service delivery began in August 2006 (when the first youth were randomly assigned) and the project ended services in November 2009.38
CWP built on its strong historical relationship with the One-Stop Workforce Centers to implement Youth WINS.39 The I-Teams were located in Workforce Centers to leverage various resources there to support employment for youth. The Workforce Centers also provided an institutional structure that facilitated the I-Teams’ contact with various Workforce Investment Act partners, such as the Division of Vocational Rehabilitation, Colorado’s Community Centered Boards, community rehabilitation providers and mental health centers, and local school districts. (We describe these organizations in more detail in the next section of this chapter.)
CWP established a three-person management team for Youth WINS. The project director was responsible for overall program implementation and management. The project manager worked directly with the I-Teams and Workforce Centers to coordinate day-to-day project activities. The management information system (MIS) administrator, who also functioned as the local evaluator, oversaw the project’s MIS, which entailed ensuring the quality of the database, and managed the local data collection and related evaluation activities.
Significant efforts were made to integrate the I-Teams into the Workforce Centers; this integration was a unique aspect of the Youth WINS project. While the mission of Workforce Centers nationwide is to provide employment services to all U.S. citizens who may need them, Elinson and Frey (2005) and the Office of Disability Employment Policy (ODEP) at the U.S. Department of Labor found that they often lack the services, expertise, and programmatic accessibility necessary to serve individuals with disabilities effectively.40 CWP hoped that the location of the I-Teams in the Workforce Centers would help the Centers reduce their programmatic and physical barriers to serving youth with disabilities. A goal of CWP for Youth WINS was that the project would serve as a model for Workforce Centers across the state.
Each I-Team had a local supervisor who worked with the CWP project manager to implement Youth WINS, which operated under a dual management structure. The local Workforce Center managers provided direct supervision to the I-Teams and assisted their integration into the Centers and work with community services. The Youth WINS project manager at CWP provided guidance to the I-Teams on policy as well as training on the project’s requirements.
B. Local Context and Infrastructure
The I-Teams were based in Workforce Centers in four counties: Larimer and Boulder counties located north of Denver and El Paso and Pueblo counties located south of the city.41 The four
38 For further details, please refer to Martinez et al. (2008).
39 One-Stop Workforce Centers are located throughout the country and serve as a generic workforce system through which job seekers can get employment information, find out about career development training opportunities, and connect to various job-related social services. They are overseen by Workforce Investment Boards (WIBs), which are regional entities created to implement the Workforce Investment Act of 1998. The WIBs administer federal, state, and local funding for workforce development in their communities.
40 The Elinson and Frey report on ODEP demonstration programs, along with a related ODEP research brief, are available at: http://www.dol.gov/odep/categories/research/policy_programs.htm
41 After the initial pilot, Boulder was added as a fourth site to ensure that sample size goals could be met.
29
Interim Report on Colorado Youth WINS Chapter III: Implementation of Youth WINS
counties differ considerably across several socioeconomic characteristics; these differences are described in more detail in the next section.
1. County Socioeconomic Characteristics
While all four Youth WINS sites operated within the same state service context, they differed considerably in their socioeconomic characteristics. As shown in Table III.1, El Paso County has roughly twice the population of Larimer and Boulder counties and nearly four times that of Pueblo County. Because it had a larger population from which to draw, the Youth WINS project in El Paso County enrolled the largest number of youth. The counties also differ considerably in median household income. While the median incomes in El Paso and Larimer counties are close to that of the state, the median income in Boulder County is nearly $10,000 higher than the state median. In contrast, Pueblo County’s median income is nearly $15,000 lower than the state median. These economic differences also are reflected in other data, with Pueblo County having a higher rate of poverty (nearly 17 percent, versus 10 to 12 percent in the other counties); lower percentages of high school and college graduates; and a higher unemployment rate. Taken together, these statistics indicate that two of the counties (El Paso and Larimer) in which Youth WINS operated are fairly typical of Colorado counties in terms of socioeconomic characteristics, while Pueblo County is less affluent than most counties in the state, and Boulder County is more affluent.
SSA data provide additional evidence of differences among the Youth WINS counties. The percentage of youth under 18 years of age on SSI is more than twice as high for Pueblo County as it is for the entire state (1.5 percent vs. 0.6 percent) and higher than for El Paso (0.7 percent), Larimer (0.5 percent), and Boulder (0.3 percent) counties. A similar pattern holds for the percentage of SSI beneficiaries 18 years of age and older. Pueblo also has a substantially higher rate of concurrent (SSI and DI) beneficiaries of all ages. Since SSI is a means-tested program, the higher rates of receipt of SSI and concurrent benefits in Pueblo County are further evidence of greater economic hardship there. These data suggest that Pueblo County’s poverty-related social service needs are likely to be substantially greater than those of the other counties where Youth WINS operated.
2. Existing Services for People with Disabilities
While Colorado has a variety of agencies and programs whose missions include serving youth with disabilities, transition services for such youth generally are underdeveloped throughout the state. CWP believed that the Workforce Centers could serve as the platform for youth transition services through Youth WINS and also recognized the need to develop relationships with other agencies outside of the Workforce Centers. These included the state vocational rehabilitation agency, developmental disability service and mental health providers, and the school systems. Together, these agencies are responsible for most of the services available to Colorado youth with disabilities and are of primary importance for understanding the service context for Youth WINS. In practice, there were significant limitations to the services these agencies provided to Youth WINS participants. These limitations substantially restricted the capacity of Youth WINS to help participants access employment supports. Each of these agencies or programs is discussed below.
Colorado’s One-Stop Workforce Centers provide career assessments, skills and job training, and job search assistance to all job seekers, including those with disabilities, although the scope and reach of these services are limited by both funding and federal regulations. While Workforce Center services can be invaluable for job seekers with and without disabilities, these services are designed to be largely self-directed, are usually discrete, and typically are not provided under a comprehensive and coordinated plan. These features make the services challenging to access for many people with
30
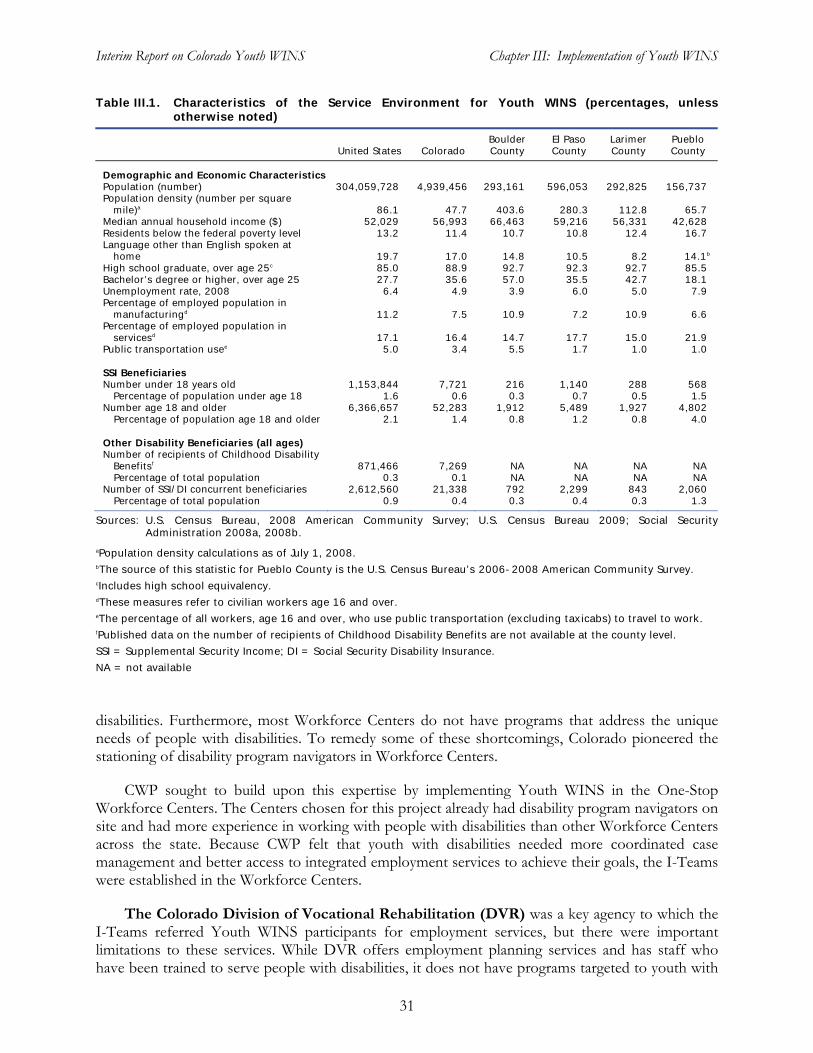
Interim Report on Colorado Youth WINS Chapter III: Implementation of Youth WINS
Table III.1. Characteristics of the Service Environment for Youth WINS (percentages, unless otherwise noted)
Boulder El Paso Larimer Pueblo United States Colorado County County County County
Demographic and Economic Characteristics Population (number) 304,059,728 4,939,456 293,161 596,053 292,825 156,737Population density (number per square
mile)a 86.1 47.7 403.6 280.3 112.8 65.7 Median annual household income ($) 52,029 56,993 66,463 59,216 56,331 42,628Residents below the federal poverty level 13.2 11.4 10.7 10.8 12.4 16.7 Language other than English spoken at
home 19.7 17.0 14.8 10.5 8.2 14.1b
High school graduate, over age 25c 85.0 88.9 92.7 92.3 92.7 85.5 Bachelor’s degree or higher, over age 25 27.7 35.6 57.0 35.5 42.7 18.1 Unemployment rate, 2008 6.4 4.9 3.9 6.0 5.0 7.9 Percentage of employed population in
manufacturingd 11.2 7.5 10.9 7.2 10.9 6.6 Percentage of employed population in
servicesd 17.1 16.4 14.7 17.7 15.0 21.9 Public transportation usee 5.0 3.4 5.5 1.7 1.0 1.0
SSI Beneficiaries Number under 18 years old 1,153,844 7,721 216 1,140 288 568
Percentage of population under age 18 1.6 0.6 0.3 0.7 0.5 1.5 Number age 18 and older 6,366,657 52,283 1,912 5,489 1,927 4,802
Percentage of population age 18 and older 2.1 1.4 0.8 1.2 0.8 4.0
Other Disability Beneficiaries (all ages) Number of recipients of Childhood Disability
Benefitsf 871,466 7,269 NA NA NA NA Percentage of total population 0.3 0.1 NA NA NA NA
Number of SSI/DI concurrent beneficiaries 2,612,560 21,338 792 2,299 843 2,060Percentage of total population 0.9 0.4 0.3 0.4 0.3 1.3
Sources: U.S. Census Bureau, 2008 American Community Survey; U.S. Census Bureau 2009; Social Security Administration 2008a, 2008b.
aPopulation density calculations as of July 1, 2008. bThe source of this statistic for Pueblo County is the U.S. Census Bureau’s 2006-2008 American Community Survey. cIncludes high school equivalency. dThese measures refer to civilian workers age 16 and over. eThe percentage of all workers, age 16 and over, who use public transportation (excluding taxicabs) to travel to work. fPublished data on the number of recipients of Childhood Disability Benefits are not available at the county level.
SSI = Supplemental Security Income; DI = Social Security Disability Insurance.
NA = not available
disabilities. Furthermore, most Workforce Centers do not have programs that address the unique needs of people with disabilities. To remedy some of these shortcomings, Colorado pioneered the stationing of disability program navigators in Workforce Centers.
CWP sought to build upon this expertise by implementing Youth WINS in the One-Stop Workforce Centers. The Centers chosen for this project already had disability program navigators on site and had more experience in working with people with disabilities than other Workforce Centers across the state. Because CWP felt that youth with disabilities needed more coordinated case management and better access to integrated employment services to achieve their goals, the I-Teams were established in the Workforce Centers.
The Colorado Division of Vocational Rehabilitation (DVR) was a key agency to which the I-Teams referred Youth WINS participants for employment services, but there were important limitations to these services. While DVR offers employment planning services and has staff who have been trained to serve people with disabilities, it does not have programs targeted to youth with
31
Interim Report on Colorado Youth WINS Chapter III: Implementation of Youth WINS
significant disabilities. For example, while DVR operates a School-to-Work-Alliance Program for youth with mild-to-moderate disabilities, this program generally does not serve youth with more significant disabilities, such as those who were eligible for Youth WINS. Furthermore, DVR does not have state-wide youth specialty counselors, and does not have different enrollment criteria for youth, as do some state vocational rehabilitation programs.
DVR experienced dramatic shortfalls in funding over the life of the Youth WINS project. At the commencement of Youth WINS, DVR had no waiting list for services but, in response to budgetary pressures, in early 2008 it implemented such a list, known as an “order of selection.” This meant that only individuals with the most significant disabilities could receive vocational rehabilitation services in a timely manner.42 The agency’s funding problems grew worse over the life of the YTD project. Based on interviews with DVR staff, the research team learned that in January 2009, DVR closed its doors completely to all new would-be consumers, regardless of their disability status, although the agency was still accepting applications and placing the applicants on a waiting list. From that date forward, while they could help the youth submit an application, I-Teams were unable to assist Youth WINS participants enroll in and receive vocational rehabilitation services.
Due to the lack of services oriented toward youth with severe disabilities, the slow intake and case development process, and the ongoing funding problems, the I-Teams and the management team at CWP came to view DVR as a limited referral resource for Youth WINS participants. The relationship with DVR was particularly unproductive in the two southern Youth WINS counties (El Paso and Pueblo).
Colorado’s Community Centered Boards (CCBs) provide comprehensive Medicaid and other state-funded services to youth and adults with developmental disabilities. Interviews with I-Team members and CWP managers revealed that they generally regarded the CCB services as more useful for Youth WINS participants than those of DVR. However, there were access and funding issues that severely limited the ability of the CCBs to work with youth. Most notably, in Colorado there is a nearly 10-year waiting list for CCB services, meaning that youth with disabilities are unlikely to receive any services unless they apply for them at a very young age. Consequently, over the course of the Youth WINS project, few participants received CCB services. The I-Teams assisted those who did become eligible for these services to access them to the fullest extent possible and coordinate them with other available community services. In addition, the I-Teams identified several Youth WINS participants who were in need of but had not applied previously for CCB services and assisted those youth in completing applications.43
During the last year of the Youth WINS project, the ability of the CCBs to provide employment services was even further reduced as a consequence of dramatic reductions in state funding and constraints on the use of Medicaid to fund rehabilitation services. According to interviews with both the I-Teams and CCB staff, by early 2009 state rules required CCBs to deliver employment services to consumers only if no other providers could do so, and only if the consumers had been denied services by DVR. During that same timeframe, however, DVR had not been rejecting any applicants but instead was placing them on a waiting list. Youth WINS
42 As SSA disability benefit recipients, participants of Youth WINS met the order of selection.
43 Despite the 10-year waiting list, I-Teams felt it was important for eligible youth to apply for CCB services, since doing so would allow them to eventually receive those services.
32
Interim Report on Colorado Youth WINS Chapter III: Implementation of Youth WINS
participants and others with developmental disabilities who sought employment services thus were in a “Catch 22” situation in which they could not receive services from either the CCBs or DVR.
Colorado’s public mental health system provides comprehensive Medicaid and other state-funded services to youth and adults with mental illnesses through 6 specialty clinics and 17 community mental health centers.44 The comprehensive services provided by the community centers differ somewhat by geographic service area but generally include therapeutic supports, clinical counseling, family counseling, and a variety of assessments. The community mental health centers focus on clinical services. They also provide limited employment, education, and community living services and supports, often in concert with other service providers. Similar to DVR and the CCBs, Colorado’s community mental health centers experienced reductions in funding over the course of the Youth WINS project but they neither closed their doors to new referrals nor had lengthy waiting lists for services.
Generally, the I-Teams did not work as closely with the community mental health centers as they did with DVR and the CCBs. The El Paso I-Team had the closest relationship with its local community mental health center. Interviews with members of that I-Team, and with another service provider in the community, suggest that services and family supports were not as well developed for the mentally ill population, compared with services for youth and adults with developmental disabilities or mental retardation. Furthermore, the lack of focus on employment in the mental health centers made them less useful referral resources for employment-related services.
The public school systems in the four counties where Youth WINS operated provide transition services to in-school youth with disabilities. However, budget cuts during the period of the Youth WINS project forced many school districts in Colorado to eliminate their full-time transition counselor positions, leaving guidance counselors responsible for providing transition services to students with disabilities. These counselors typically served large numbers of students and did not necessarily have a strong knowledge of work incentives and community resources for young people with disabilities. Neither school-based services nor educational services were central to the Youth WINS intervention; however, the project did support its participants in pursuing educational goals when they specifically requested such assistance.
The I-Teams and CWP management did not believe it was within the scope of the Youth WINS project to attempt to bring about change in the structure or services of the local school systems or the other community service providers noted above. The fiscal problems of several of the providers tended to reinforce that position. Instead, Youth WINS focused on (a) facilitating access by project participants to the services offered by these organizations to make them more effective for those youth and (b) filling gaps in those services by providing direct supports to Youth WINS participants.
C. Youth WINS Services
In response to a condition for being selected into the YTD national random assignment evaluation in 2006, the management of Youth WINS planned to sharpen the project’s focus on employment. It did this initially by expanding the duties of the career counselor position to focus more upon job development and by providing limited training on employment services to all team members in partnership with TransCen, the YTD technical assistance provider. Otherwise, Youth
44 All four counties where Youth WINS operated have local mental health service providers.
33
Interim Report on Colorado Youth WINS Chapter III: Implementation of Youth WINS
WINS adhered largely to its original program model (described below) rather than the YTD model as described earlier in the conceptual framework. Only in the last year of the project did Youth WINS provide more intensive training on employment services to staff, and more fully embrace the technical assistance that TransCen could provide. Figure III.1 is a schematic diagram of the flow of project participants through Youth WINS services.
Youth WINS served SSI, DI, and CDB beneficiaries ages 14 through 25 who resided in the four target counties. It was a person-centered, case management intervention that focused on gaining an understanding of each participant’s unique goals and service needs, and on meeting those needs, primarily by connecting them with resources available in the service system. Under Youth WINS, case management was defined broadly to include goal setting, problem identification, crisis intervention, and meeting identified service needs. The I-Teams worked with local providers to identify appropriate services for Youth WINS participants, helped participating youth engage in those services, and filled service gaps when necessary. Participants were encouraged to take charge of their own transition planning through a person-centered planning process that guided subsequent Youth WINS services. Youth WINS also sought to engage families in transition planning and provided limited funding of various supports for both participants and their families.
Each I-Team consisted of a Youth WINS disability program navigator (DPN), a benefits counselor and at least one career counselors. Three of the I-Teams each had one career counselor, but the team in El Paso County had three, to accommodate the larger number of Youth WINS participants at that site. The I-Team members had well-defined roles in working with project participants, based on their assigned positions:45
The DPNs helped participants access a range of supports and services from various government agencies and non-profit service providers.46
The benefits counselors worked with participants on issues specifically related to SSA benefits, the SSA waivers for YTD, and other work incentives.
The career counselors assisted participants with all employment-related activities.
I-Teams were responsible for enrolling youth randomly assigned to the treatment group into program services. DPNs often took the lead in this initial engagement effort, although all I-Team members would assist when necessary. A more detailed discussion of the Youth WINS enrollment approach is presented in Section D.1.
Through individual case management and the development of a person-centered plan (PCP), the unique needs and goals of each Youth WINS participant were documented and a framework for future services was developed. During initial meetings with I-Team members, a participant and his or her family engaged in discussions of hobbies; interests; significant relationships; disabling conditions; family supports; goals for education, employment, and independent living; and other topics deemed relevant to determining the services the youth might require. These discussions informed the development of an individual marketing profile (IMP),
45 A more detailed description of the three I-Team positions can be found in Appendix B.
46 The DPN position in Youth WINS was modeled after, but was not formally part of, the Disability Program Navigator Initiative that was implemented in selected One-Stop Workforce Centers in Colorado and other states and was funded jointly by the U.S. Department of Labor and SSA.
34
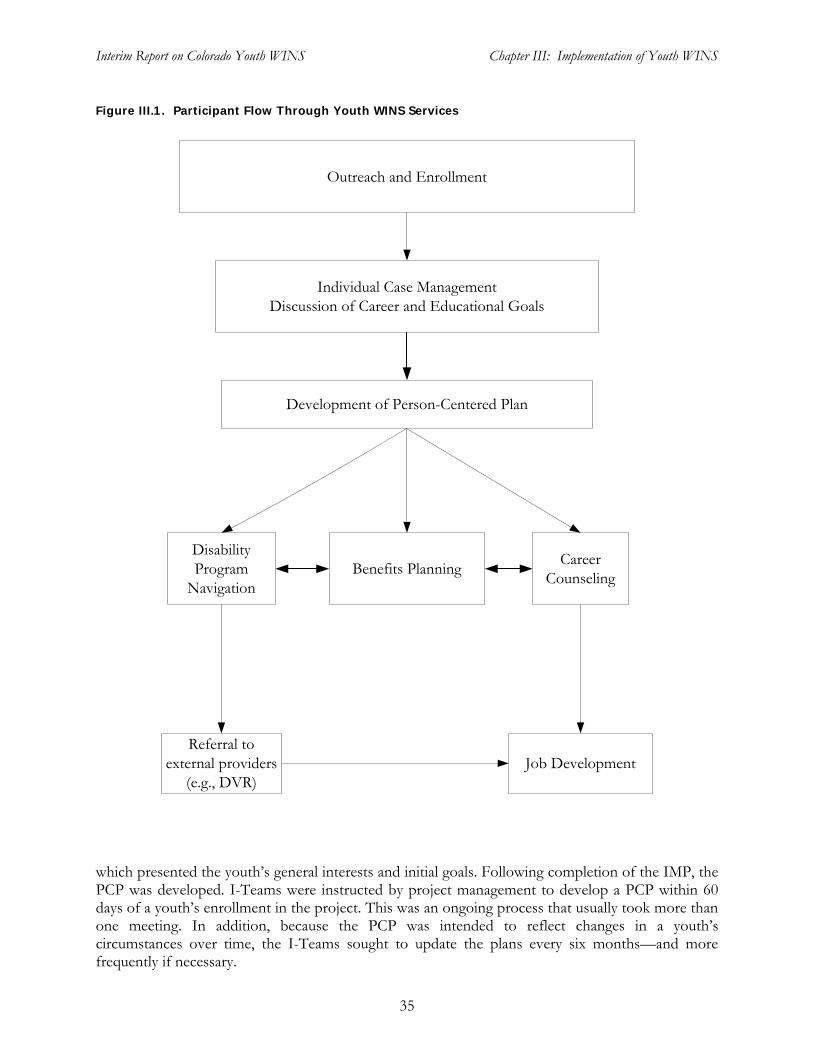
Interim Report on Colorado Youth WINS Chapter III: Implementation of Youth WINS
Figure III.1. Participant Flow Through Youth WINS Services
Outreach and Enrollment
Individual Case Management Discussion of Career and Educational Goals
Development of Person-Centered Plan
Disability Program
Navigation Benefits Planning
Career Counseling
Referral to external providers
(e.g., DVR) Job Development
which presented the youth’s general interests and initial goals. Following completion of the IMP, the PCP was developed. I-Teams were instructed by project management to develop a PCP within 60 days of a youth’s enrollment in the project. This was an ongoing process that usually took more than one meeting. In addition, because the PCP was intended to reflect changes in a youth’s circumstances over time, the I-Teams sought to update the plans every six months—and more frequently if necessary.
35
Interim Report on Colorado Youth WINS Chapter III: Implementation of Youth WINS
The PCP was a formal Youth WINS document in which the I-Teams recorded participants’ short- and long-term goals, as well as their subsequent service needs as they worked to achieve these goals.47 The document served as a guide for successful transition, helping to provide a clear focus on each youth’s unique circumstances. In the PCP development process, participants rather than project staff drove the establishment of goals. For this reason, although employment was a central objective of YTD, the I-Teams did not try to persuade a participant to take on such a goal unless the youth expressed an interest in doing so. The I-Teams believed that advocating for unwanted goals and associated services would have negative effects on the relationships required to manage their cases successfully.
The PCP consisted of six sections: (1) a personal profile, (2) education goals, (3) employment goals, (4) training/support goals, (5) benefits goals, and (6) documentation of time spent developing the PCP. The I-Teams used their discretion in providing Youth WINS participants with copies of their PCPs. They frequently referred to these documents in meetings with participants and sought their input in updating them.
There were minor variations across the four Youth WINS sites in how the I-Teams carried out their work; however, they all developed PCPs that led to a common set of services. Below, we describe those services, which corresponded closely to the I-Team positions.
Disability program navigation services were designed to help Youth WINS participants to access available services for young people with or without disabilities. The I-Teams filled gaps in existing services, in part, by working around system shortcomings. For example, if DVR was unable to open a case for a YTD participant, the I-Teams would provide youth with services similar to those that DVR would offer. The I-Teams also ensured that various state agencies and non-profit organizations served Youth WINS participants as intended, and in a holistic manner. Disability program navigation typically entailed the I-Teams developing effective working relationships with local service providers, making referrals to those organizations, advocating for Youth WINS participants, and ensuring that the existing service system worked in a coordinated fashion to serve participants effectively.
Disability program navigation services typically were among the first received by Youth WINS participants and were central to the project’s case management approach. All members of an I-Team participated in case management, but our field research for this report (including interviews with I-Team members, case reviews, and focus group discussions with Youth WINS participants) revealed that the DPN provided more case management services than the other team members.
Benefits planning services were provided by the I-Teams to Youth WINS participants, their families, and their representative payees. They were modeled after the Work Incentive Planning and Assistance (WIPA) supports provided in every state through contracts with SSA. These services were designed to clarify the implications of work, earnings, and resources for disability-related SSA benefits. They informed participants about the standard work incentives available under SSI and DI rules and also described the work incentives provided by the special YTD waivers. Due to the intricacies of the rules governing SSA disability benefits, responsibility for providing benefits
47 While the PCP provided a generally defined path for youth and the I-Teams, it did not detail or authorize any specific services, and service delivery was not contingent upon or specifically driven by the PCP. The PCP was more of an overall road map to help organize the evolving goals of the youth and I-Teams.
36
Interim Report on Colorado Youth WINS Chapter III: Implementation of Youth WINS
planning services was concentrated in the benefits counselor position on the I-Teams.48 The benefits counselors helped participants access the work incentives and waivers and served as liaisons to the SSA field offices to ensure that the youth reported their earnings appropriately and received the benefits to which they were entitled. At project closeout, the I-Teams referred youth to the local WIPA project for ongoing benefits counseling.49
The SSA waivers for YTD were a key component of the Youth WINS project. Because the waivers were complex, most youth required counseling to understand them. Youth WINS was designed to provide new participants with a basic introduction to the waivers. Participants who subsequently decided to seek employment had more focused and personalized discussions with Youth WINS benefits counselors about the waivers for which they were eligible and how to utilize them. Ian’s story, presented on page 38, illustrates how benefits planning was integrated into overall service delivery.50
Employment-related services included career counseling and job development. Career counseling services for Youth WINS participants consisted primarily of vocational assessments and career exploration activities. The career exploration activities were individualized and driven by a participant’s interests and abilities. Career exploration could include discussing possible jobs, visiting job sites, exploring want ads and other job-finding services, and completing assessments designed to evaluate the participant’s suitability for various job settings. These services were primarily the responsibility of the career counselors, although all I-Team members could provide them.
Job development services helped Youth WINS participants obtain and maintain work-based experiences, such as unpaid internships and paid employment. These services included referrals to and coordination with employment service providers. Such assistance also provided referrals to vocational assessments and job development and placement services. Because Youth WINS had a programmatic philosophy of not duplicating services available elsewhere, referrals to employment service providers usually took priority over the direct provision of employment supports. Furthermore, I-Team members consistently told us that job development services, whenever possible, were provided in collaboration with other employment service providers, with the I-Teams playing supporting and case management roles. These partners often set the pace for and determined the quality of the job development services provided to participants. Youth WINS career counselors sometimes were written into participants’ DVR employment plans as job developers or providers of other key employment supports. Job development was primarily the responsibility of the Youth WINS career counselors, although the other I-Team members might help participants obtain jobs if they knew of employment opportunities that fit the youths’ goals and abilities.
48 Youth WINS benefits counselors generally were not trained on non-SSA benefits. In some instances, most notably in El Paso County, the DPN was able to provide counseling on non-SSA benefits due to training or experience acquired prior to employment with Youth WINS.
49 We did not meet with staff from the WIPA during our field visits and so cannot speak to the nature of those services.
50 We present Ian’s story (and Ashley’s story, on page 40) to illustrate the various services provided by Youth WINS. To ensure that we would have enough information to provide rich pictures of Youth WINS services, we chose to profile youth who were active participants in the project. For this reason, these vignettes are not representative of the typical participants experiences or outcomes.
37
Interim Report on Colorado Youth WINS Chapter III: Implementation of Youth WINS
Ian’s Story
In the three years between his high school graduation and enrollment in Youth WINS, Ian already had been making strong progress toward his transition into adulthood. Since childhood, he had struggled with severe attention deficit/hyperactivity disorder that prevented him from learning to read or write fluently and made focusing in class extremely challenging. When he entered high school, he was diagnosed with paranoid schizophrenia; the combination of these two disabilities made the school environment daunting to him. On top of his academic challenges, Ian’s erratic and impulsive behavior made it difficult for him to enjoy a healthy social life.
However, by 2007, when he enrolled in Youth WINS services, Ian was proud of the progress he’d already made and optimistic about his prospects in the areas where he still needed help. When the staff met him, he had been involved with a clubhouse program (a drop-in day program operated by a community mental health agency) that had set him up with a job as a custodian at a government technological agency. He was working 20 hours a week and was happy to be earning his own money and potentially beginning to save money toward retirement. He was especially excited to be working around so many engineers, since one of his long-term goals was to go to college to study engineering. The priorities he discussed with the I-Team, however, were more immediate than attending college; he wanted to be able to move out of his family’s house, improve his independent living skills, and learn how to manage his disability benefits.
The I-Team quickly engaged Ian in benefits planning, helping him to understand the YTD waivers, how his income affected his benefits, and more generally how to manage his finances. Ian was careful and deliberate about his financial planning, and this service turned out to be among the most important and consistent the I-Team offered him. According to the I-Team benefits specialist, he had “constant benefit questions” for her and called the staff regularly to check in and give them updates about his work and financial status. As of spring 2009, he seemed to have a good understanding of what he had learned through the benefits and financial counseling. Ian could articulate the details of his waivers and benefits rules clearly and accurately and was eager to speak about his medical benefits and the savings he was putting away toward retirement.
To help Ian achieve his goal of moving out of his family’s house, the I-Team found a local landlord, a retired special education teacher, who offered moderately supported living arrangements to young adults with disabilities. Both Ian and his family were happy to find this service, and by all accounts, Ian’s relationship with his parents had gotten stronger since moving out. He was living with several roommates and, although the group played video games together and got along well, Ian said, “it’s almost like living alone,” since the roommates spent a lot of their time upstairs.
Along with the ongoing benefits planning and assistance with moving out on his own, Ian sought out the I-Team regularly for assistance with organization and for feedback as he thought through his progress and future goals. Ian was enthusiastic when he talked about his job, benefits management, and the life he wants to build, but he was also realistic about the challenges he still faced. In his words, “I want to get an engineering degree. I’m around engineers all day at work. I talk to them; I know what kinds of things they do. The big problem I have with going back to school is that I’m really bad with reading, so it takes me a long time to get through books. I’m going to have to work on that.” Although he had not enlisted the I-Team’s help with reading, he was grateful to them for their information and advice on benefits and their help with setting up an apartment. He still checked in, but “I’m feeling pretty independent right now; I don’t need as much help.”
38
Interim Report on Colorado Youth WINS Chapter III: Implementation of Youth WINS
The most common partners for Youth WINS in providing job development services were the Workforce Centers where the projects were based. Other key partners were DVR, the CCBs, and the community rehabilitation providers affiliated with DVR or the CCBs. As noted above in Section B, Workforce Center services rarely encompassed disability-specific supports, and the capacity of DVR and the CCBs to provide employment services to Youth WINS participants diminished over the life of the project, due to financial constraints. These limitations of the key partner organizations suggest the importance of the direct provision of job development services and related employment supports by Youth WINS. When job development services were not readily available from partner organizations, I-Team members worked directly with Youth WINS participants and local employers to identify appropriate jobs. They also supported employed participants by arranging for workplace accommodations and job coaching. However, the CWP management team and the I-Teams did not adopt as a primary focus the direct provision of job development services―a key component of the YTD program model―until the last year of the project.
Over time, Youth WINS did make some adjustments to its job development services. The most notable change, which occurred in the last year of the project, was a willingness among CWP management and I-Teams to participate in more comprehensive training on job development. During the second round of field visits, the I-Teams demonstrated a better understanding of the requirements associated with job development. Additionally, Youth WINS provided employment workshops for participants in two counties, also in the last year of the project. The workshops, which lasted 60 to 90 minutes, were attended by approximately 100 youth.51 Topics included interview skills, mock interviewing, resume preparation, and summer volunteer opportunities. Another notable adjustment was that, as rising caseloads necessitated expansion of the I-Team in El Paso County, two additional staff members were hired as career counselors.
Generally, I-Teams viewed career counseling and job development as important in assisting youth with disabilities develop career goals and obtain employment for those who expressed an interest. Although employment was a targeted outcome of the YTD initiative, and the large majority of PCPs identified employment goals Youth WINS had a philosophy of addressing participants’ needs for job development services primarily through referrals to other service providers. This feature of Youth WINS created the likelihood that some participants would not receive strong job development services.
Education services were not a prominent feature of Youth WINS. When requested by participants, however, the I-Teams provided a variety of such services, including help with applying to postsecondary education programs and completing forms for financial aid. Interviews with the I-Teams revealed that the DPNs most often provided these services, although other team members would attend individualized education program (IEP) meetings and other education-related meetings when requested by participants.
Ashley’s story on page 40 highlights some of the education services provided by Youth WINS.
D. Enrollment in Youth WINS
Mathematica was responsible for recruiting youth into the evaluation and randomly assigning them either to the study’s treatment or control group, while the I-Teams were responsible for
51 The approach that the two sites used to enter data into ETO on workshop attendance made it difficult to calculate the precise number of participants.
39
Interim Report on Colorado Youth WINS Chapter III: Implementation of Youth WINS
Ashley’s Story
Ashley came to the I-Team in late 2006 with a history of challenges well beyond her struggles with a learning disorder and organic mental disorders. Estranged from her mother since birth due to her mother’s drug and mental health problems, Ashley was raised by her grandmother in a home setting marked by very little money and a constant struggle to provide stable education and housing for Ashley, her sister—who lives with a similar set of disabilities—and her cousin. The family’s personal stress and financial burden had been heightened several years earlier when Ashley’s grandfather was murdered in a still-unsolved case and, because of the unsolved status of the case, the family has not been able to collect any death-related benefits for added support.
Fifteen years old when she enrolled in the program, Ashley quickly identified a set of goals to work on with the I-Team. Before anything else, she wanted to be legally adopted by her grandmother and reenter the school system after spending the majority of her life being homeschooled by her grandmother. Very quickly, the program navigator found an attorney for the family who took on the adoption case pro bono. After several meetings with the program navigator and the family, the attorney was able to finalize the adoption for both Ashley and her sister in August 2008.
At the same time the adoption process was underway, the I-Team arranged for Ashley to enter the local high school. While she was eager to reintegrate into the school system, Ashley and the group decided it would make for a smoother transition if she enrolled in one class at the beginning and then completed her transition after testing the waters. In January 2007, Ashley enrolled in a computer class for an hour and a half a day. As it turned out, the decision to start slow was the right one because Ashley quickly ran into problems getting along and maintaining focus in the class. Her shyness and nervousness made the social setting daunting to her. The school determined that it would be more appropriate for her to develop an IEP and find a class that offered more support with her transition into the school environment. After this difficult start, Ashley’s school experience improved. She enrolled in classes full-time and, by early 2009, was earning almost all As and was planning to stay in school through age 21.
In addition to working with Ashley on problems stemming from her disability, the I-Team also assisted with a problem related to the family’s economic disadvantage. Early on, the Youth WINS staff noticed that Ashley’s wardrobe was not appropriate to her age. One I-Team member summed it up by saying, “You can’t have a 17-year-old girl wearing Care Bear sweatshirts to high school.” To address this problem, the I-Team used about $100 of supportive services funds to take Ashley to a bargain clothing department store to shop for a new wardrobe. The family was overjoyed by the assistance and the staff said it went a long way toward establishing trust with the family.
By spring 2009, Ashley had accomplished the two initial goals she had set with the I-Team. She had also gone further, working with the career counselor to connect with a youth employment program called “Summer Count$,” which payed youth to attend workshops and job skills training. According to Youth WINS staff, Ashley “exceeded expectations” in that program and went on to work part-time in the high school supply store and campus bistro. Although she continued to struggle with some shyness and still fatigued easily, she was optimistic about her education and was looking forward to trying for college, a family, and a possible career with children or computers.
40
Interim Report on Colorado Youth WINS Chapter III: Implementation of Youth WINS
enrolling treatment group members in Youth WINS services (see Figure III.1). Recruitment and enrollment for Youth WINS began in August 2006 and was completed in May 2008. As described earlier, 468 youth were randomly assigned to the treatment group and 401 youth, or 86 percent, were enrolled.52 Initially, the enrollment results achieved by the I-Teams fell short of established targets, but eventually each team devoted substantial staff resources to conducting outreach to treatment group members, and the project as a whole exceeded its objective of enrolling 83 percent of these youth. At some of the project sites, the DPNs organized the enrollment effort and conducted a large portion of the outreach to youth while, at other sites, all of the I-Team members shared enrollment duties more or less equally.
1. Enrolling Youth in Project Services
As described above, the I-Teams reached out to youth assigned to the study’s treatment group so as to enroll them in Youth WINS services. The I-Team members recorded their enrollment efforts in ETO. Analysis of the resultant data, presented in Table III.2, shed light on the effort required to engage youth in project services, and supported findings from our field research that the I-Teams devoted considerable effort to the enrollment of treatment group youth, including those who ultimately declined to participate in Youth WINS. The I-Teams made more than 3,700 enrollment contacts in total.53 On average, they made nearly 7 contacts with youth who eventually enrolled in services (“participants”) and more than 14 contacts with youth who never enrolled (“non-participants”). These statistics indicate that the I-Teams persevered in their efforts to engage youth who were difficult to reach or disinclined to enroll. On average, they spent more than two hours per youth attempting to enroll treatment group members in Youth WINS. Their enrollment efforts exceeded three hours for 24 percent of participants and 30 percent of non-participants. The average duration of an enrollment contact was about twice as long for participants as for non-participants (20 minutes versus 10 minutes).
The I-Teams reached out to youth in a timely manner after they were assigned to the treatment group. On average, their initial contact with treatment group youth occurred slightly more than 11 days after random assignment, with the median elapsed time being 7 days (Table III.2). The teams contacted 56 percent of treatment group youth within 7 days of random assignment and only 6 percent after the passage of more than 30 days. The ETO data provide no evidence that the I-Teams were slower to reach out to eventual non-participants than participants. There was variation across the project sites in how quickly the teams made initial contact with youth. The average elapsed time between random assignment and initial contact was 6 days for the Larimer site, 9 days for the El Paso site, and approximately 15 days for the Pueblo and Boulder sites (results not shown).
It took the I-Teams an average of 43 days to enroll youth in services, calculated from the date of initial contact. However, nearly one-quarter of participants took longer than 60 days to enroll, suggesting that the majority of participants were enrolled relatively quickly. The median duration of successful enrollment efforts (that is, efforts that resulted in treatment group youth agreeing to participate in Youth WINS) was 20 days. When calculated from the date of random assignment, the
52 In addition, 20 youth intentionally were assigned to the treatment group for various reasons, but most typically because they were siblings of treatment group members. Such youth were not part of the research sample and were not included in this analysis. Youth WINS enrolled 17 of these 20 youth in services.
53 I-Team members were expected to enter all enrollment-related contacts into ETO, whether these were attempted or successful contacts. For the purposes of the analysis presented here, we include all enrollment-related contacts entered into ETO.
41
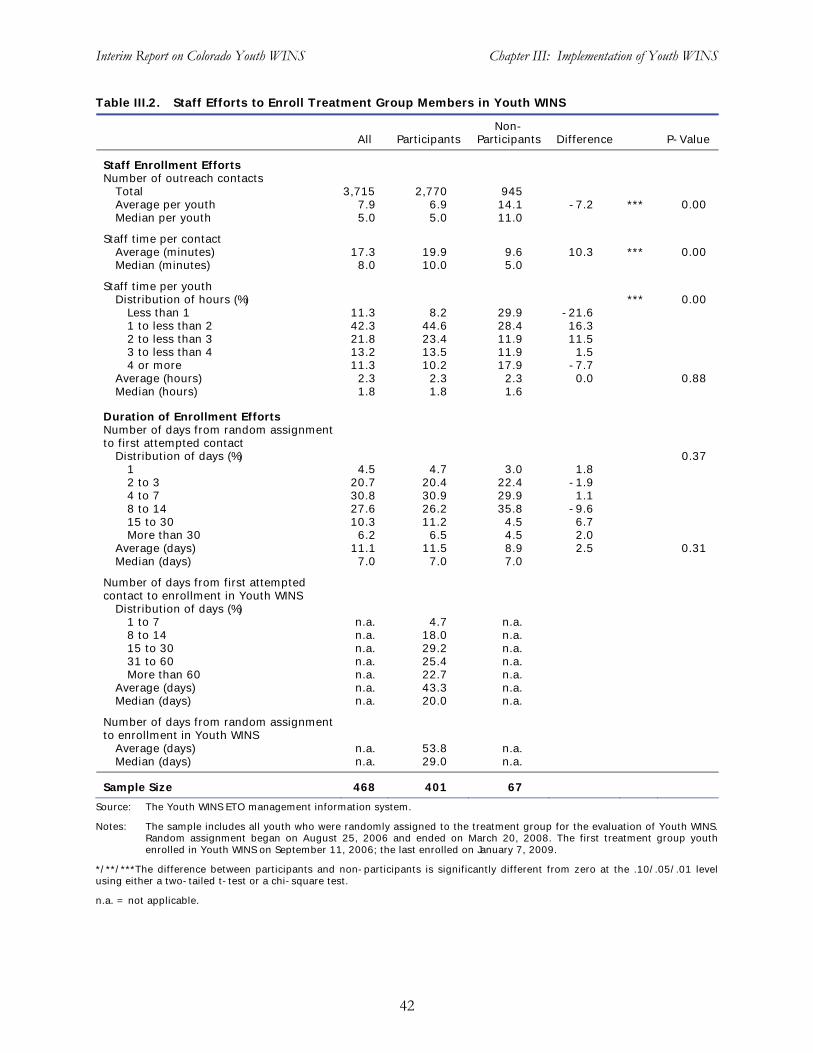
Interim Report on Colorado Youth WINS Chapter III: Implementation of Youth WINS
Table III.2. Staff Efforts to Enroll Treatment Group Members in Youth WINS
NonAll Participants Participants Difference P-Value
Staff Enrollment Efforts Number of outreach contacts
Total 3,715 2,770 945 Average per youth 7.9 6.9 14.1 -7.2 *** 0.00 Median per youth 5.0 5.0 11.0
Staff time per contactAverage (minutes) 17.3 19.9 9.6 10.3 *** 0.00 Median (minutes) 8.0 10.0 5.0
Staff time per youth Distribution of hours (%) *** 0.00
Less than 1 11.3 8.2 29.9 -21.6 1 to less than 2 42.3 44.6 28.4 16.3 2 to less than 3 21.8 23.4 11.9 11.5 3 to less than 4 13.2 13.5 11.9 1.5 4 or more 11.3 10.2 17.9 -7.7
Average (hours) 2.3 2.3 2.3 0.0 0.88 Median (hours) 1.8 1.8 1.6
Duration of Enrollment Efforts Number of days from random assignment to first attempted contact
Distribution of days (%) 0.37 1 4.5 4.7 3.0 1.8 2 to 3 20.7 20.4 22.4 -1.9 4 to 7 30.8 30.9 29.9 1.1 8 to 14 27.6 26.2 35.8 -9.6 15 to 30 10.3 11.2 4.5 6.7 More than 30 6.2 6.5 4.5 2.0
Average (days) 11.1 11.5 8.9 2.5 0.31 Median (days) 7.0 7.0 7.0
Number of days from first attempted contact to enrollment in Youth WINS
Distribution of days (%)1 to 7 n.a. 4.7 n.a. 8 to 14 n.a. 18.0 n.a. 15 to 30 n.a. 29.2 n.a. 31 to 60 n.a. 25.4 n.a. More than 60 n.a. 22.7 n.a.
Average (days) n.a. 43.3 n.a. Median (days) n.a. 20.0 n.a.
Number of days from random assignment to enrollment in Youth WINS
Average (days) n.a. 53.8 n.a. Median (days) n.a. 29.0 n.a.
Sample Size 468 401 67
Source: The Youth WINS ETO management information system.
Notes: The sample includes all youth who were randomly assigned to the treatment group for the evaluation of Youth WINS.Random assignment began on August 25, 2006 and ended on March 20, 2008. The first treatment group youth enrolled in Youth WINS on September 11, 2006; the last enrolled on January 7, 2009.
*/**/***The difference between participants and non-participants is significantly different from zero at the .10/.05/.01 level using either a two-tailed t-test or a chi-square test.
n.a. = not applicable.
42
Interim Report on Colorado Youth WINS Chapter III: Implementation of Youth WINS
duration of successful enrollment efforts was approximately 54 days, on average, with a median of 29 days.
There was considerable variation among the I-Teams in their approaches to enrollment and the duration of successful enrollment efforts. The Boulder, El Paso, and Pueblo I-Teams attempted to complete the enrollment process as quickly as possible following the initial contact with each treatment group youth. In contrast, it was the stated philosophy of the Larimer I-Team to get to know treatment group members gradually and develop their interest in Youth WINS to the point where they were eager to enroll in services. The Larimer team believed that this “soft sell” approach would result in a higher enrollment rate and greater persistence in services among the youth who did enroll. Analysis of the ETO data on enrollment efforts (results not shown) reveals that the average duration from initial contact to successful enrollment in services was 66 days at the Larimer site, in sharp contrast to 27 days at the El Paso site. The Pueblo and Boulder I-Teams also enrolled youth more quickly than the Larimer team, but the differences were not as dramatic (57 and 45 days, respectively). Based on our understanding of staffing patterns at the latter two sites, we attribute the Pueblo and Boulder results to staff shortages due to turnover rather than a purposeful strategy to engage youth more slowly and deliberately. Site-specific enrollment rates do not support the Larimer I-Team’s contention that its unique approach would result in a higher enrollment rate. At 77 percent, Larimer was the only site that fell short of the 83 percent overall enrollment rate target for Youth WINS.
Through the labor-intensive efforts documented here, the Youth WINS project ultimately met its overall enrollment goal, but this may have been at the expense of project services. Our field research revealed frustration among some I-Team members regarding the challenge of adequately serving existing Youth WINS participants during periods of intense enrollment activity. This issue is investigated more fully in a cohort analysis of services that appears later in this chapter.
2. Characteristics of Participants and Non-Participants
An analysis of differences between participants and non-participants may suggest lessons on targeting enrollment efforts to maximize participation in program services. Treatment group members who enrolled in Youth WINS were similar to non-participants in many respects, although there were some differences that generally confirm our assumptions regarding the types of youth who would choose to participate or not participate in such an intervention. Table III.3 compares participants and non-participants on a number of socioeconomic and programmatic characteristics. These descriptive statistics are based on data from the evaluation’s baseline survey and SSA administrative files. The table shows no statistically significant difference between participants and non-participants with respect to race, language spoken, school attendance, paid employment, living arrangements, gender, age, benefit amount and earnings in the year preceding random assignment, and primary disabling condition.
There are several notable, but not surprising, areas in which the two groups did differ. Perhaps most important, participants appear to have had a stronger work orientation than non-participants, as evidenced by a higher rate of receipt of job training in the preceding year (38 percent versus 18 percent) and a higher rate of expectation of working at least part-time for pay in the future (90 percent versus 78 percent). Participants had a lower rate of expectation of living independently than non-participants (66 percent versus 80 percent). The baseline data also suggest that youth with a higher socioeconomic status were more likely to participate. For example, the mothers of participants were more likely to have graduated from high school than the mothers of non-participants (80 percent versus 63 percent). In addition, 50 percent of participants, but only
43
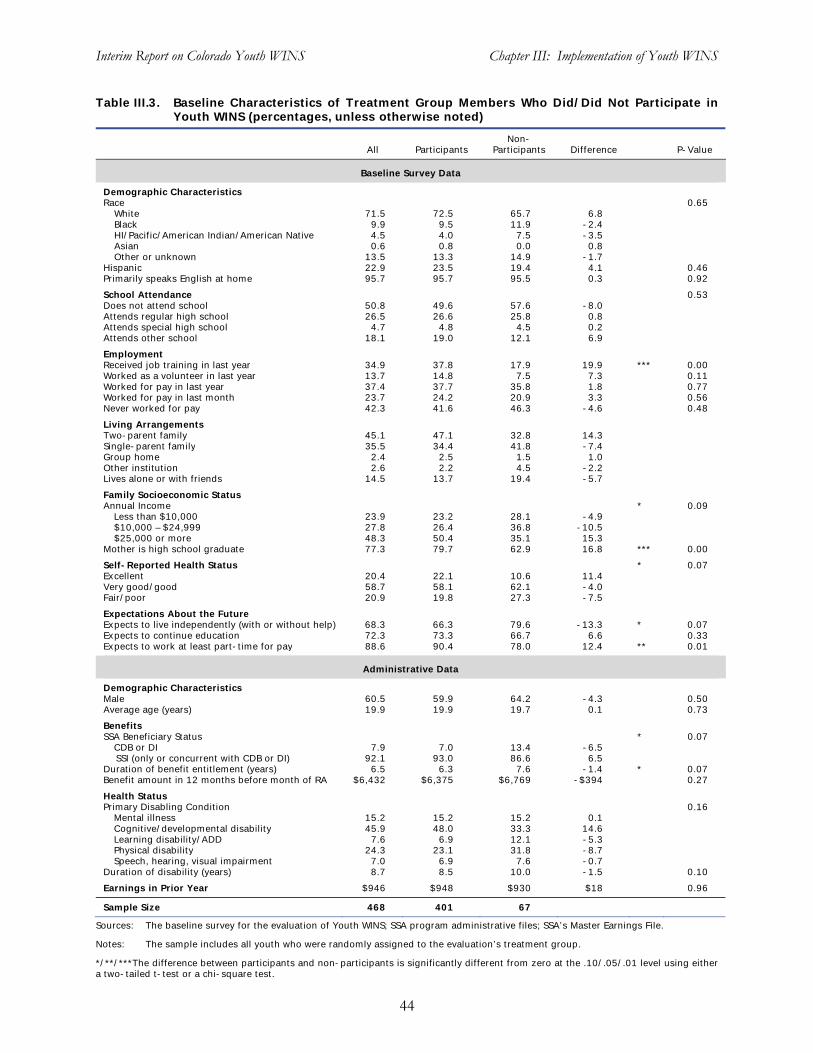
Interim Report on Colorado Youth WINS Chapter III: Implementation of Youth WINS
Table III.3. Baseline Characteristics of Treatment Group Members Who Did/Did Not Participate inYouth WINS (percentages, unless otherwise noted)
All Participants Non-
Participants Difference P-Value
Baseline Survey Data
Demographic CharacteristicsRace 0.65
White 71.5 72.5 65.7 6.8 Black 9.9 9.5 11.9 -2.4 HI/Pacific/American Indian/American Native 4.5 4.0 7.5 -3.5 Asian 0.6 0.8 0.0 0.8 Other or unknown 13.5 13.3 14.9 -1.7
Hispanic 22.9 23.5 19.4 4.1 0.46 Primarily speaks English at home 95.7 95.7 95.5 0.3 0.92
School Attendance 0.53 Does not attend school 50.8 49.6 57.6 -8.0 Attends regular high school 26.5 26.6 25.8 0.8 Attends special high school 4.7 4.8 4.5 0.2 Attends other school 18.1 19.0 12.1 6.9
EmploymentReceived job training in last year 34.9 37.8 17.9 19.9 *** 0.00 Worked as a volunteer in last year 13.7 14.8 7.5 7.3 0.11 Worked for pay in last year 37.4 37.7 35.8 1.8 0.77 Worked for pay in last month 23.7 24.2 20.9 3.3 0.56 Never worked for pay 42.3 41.6 46.3 -4.6 0.48
Living ArrangementsTwo-parent family 45.1 47.1 32.8 14.3 Single-parent family 35.5 34.4 41.8 -7.4 Group home 2.4 2.5 1.5 1.0 Other institution 2.6 2.2 4.5 -2.2 Lives alone or with friends 14.5 13.7 19.4 -5.7
Family Socioeconomic StatusAnnual Income * 0.09
Less than $10,000 23.9 23.2 28.1 -4.9 $10,000 – $24,999 27.8 26.4 36.8 -10.5 $25,000 or more 48.3 50.4 35.1 15.3
Mother is high school graduate 77.3 79.7 62.9 16.8 *** 0.00
Self-Reported Health Status * 0.07 Excellent 20.4 22.1 10.6 11.4 Very good/good 58.7 58.1 62.1 -4.0 Fair/poor 20.9 19.8 27.3 -7.5
Expectations About the FutureExpects to live independently (with or without help) 68.3 66.3 79.6 -13.3 * 0.07 Expects to continue education 72.3 73.3 66.7 6.6 0.33 Expects to work at least part-time for pay 88.6 90.4 78.0 12.4 ** 0.01
Administrative Data
Demographic CharacteristicsMale 60.5 59.9 64.2 -4.3 0.50 Average age (years) 19.9 19.9 19.7 0.1 0.73
Benefits SSA Beneficiary Status * 0.07
CDB or DI 7.9 7.0 13.4 -6.5 SSI (only or concurrent with CDB or DI) 92.1 93.0 86.6 6.5
Duration of benefit entitlement (years) 6.5 6.3 7.6 -1.4 * 0.07 Benefit amount in 12 months before month of RA $6,432 $6,375 $6,769 -$394 0.27
Health Status Primary Disabling Condition 0.16
Mental illness 15.2 15.2 15.2 0.1 Cognitive/developmental disability 45.9 48.0 33.3 14.6 Learning disability/ADD 7.6 6.9 12.1 -5.3 Physical disability 24.3 23.1 31.8 -8.7 Speech, hearing, visual impairment 7.0 6.9 7.6 -0.7
Duration of disability (years) 8.7 8.5 10.0 -1.5 0.10
Earnings in Prior Year $946 $948 $930 $18 0.96
Sample Size 468 401 67
Sources: The baseline survey for the evaluation of Youth WINS; SSA program administrative files; SSA’s Master Earnings File.
Notes: The sample includes all youth who were randomly assigned to the evaluation’s treatment group.
*/**/***The difference between participants and non-participants is significantly different from zero at the .10/.05/.01 level using eithera two-tailed t-test or a chi-square test.
44
Interim Report on Colorado Youth WINS Chapter III: Implementation of Youth WINS
35 percent of non-participants, reported that their family’s annual income exceeded $25,000. Finally, compared with non-participants, participants were more likely to consider themselves to be in good to excellent health (80 percent versus 73 percent) and to have received disability benefits for a shorter time (6.3 years versus 7.6 years).
In summary, while Youth WINS participants and non-participants were similar in many respects, the significant differences that did exist between the two groups suggest that treatment group members who had a stronger work orientation, were in better health, and of a higher socioeconomic status were more likely to enroll in the Colorado YTD project.
E. Project Implementation
The results of our field research, presented in this section, indicate that the implementation of Youth WINS in the four project sites was broadly consistent with the original model for the intervention, which emphasized goal identification, person-centered case management, problem solving, and filling gaps in the existing service system. It should be noted that the Youth WINS model did deviate from the YTD model described in Chapter I, most notably in the degree of emphasis on employment services. As discussed in the previous section, the project achieved its overall numeric target for enrolling treatment group youth. The I-Teams delivered services to nearly all of the youth who had agreed to participate. Those services commenced fairly quickly after enrollment, with a focus on the development of a PCP, benefits assessment, understanding the SSA waivers, and case management. Moreover, the CWP management team and I-Teams refined the program model to some degree by sharpening the focus of the career counselor position on employment and improving training for staff on both benefits planning and employment supports.
Several areas of concern regarding the implementation of Youth WINS were identified, however, especially regarding project management, fidelity to the YTD program model, and staff turnover and training. Below we detail findings on these and other topics from our field research on the implementation of Youth WINS.
1. Integration into the Workforce Centers
Youth WINS was successful in integrating the I-Teams into the One-Stop Workforce Centers that housed them. A key objective of the project was for the I-Teams and the services they provided to be viewed by Workforce Center staff as integral to the operation of the broader organization. Our field research findings indicate that this objective was attained. Interviews with I-Team members and their local supervisors made it clear that other staff in the Workforce Centers valued the I-Teams and regarded Youth WINS as an integral component of the services offered by the Centers. The I-Teams participated in all Workforce Center staff meetings, frequently made presentations on Youth WINS to Center staff, and were valued resources for Center staff on issues concerning services for youth. The I-Teams leveraged this integration and good will to access a variety of resources in the Workforce Centers for Youth WINS participants, such as resume writing classes, GED courses, job listings, and connections with employers.
2. Project Management
The use of dual lines of management under Youth WINS was a mixed success. I-Team members understood the different functions of the dual lines of management: (1) the Workforce Center managers were responsible for supervising the I-Teams; (2) the Youth WINS project manager at CWP, along with other CWP staff, provided technical assistance, monitored
45
Interim Report on Colorado Youth WINS Chapter III: Implementation of Youth WINS
implementation in relation to the Youth WINS model, and kept the I-Teams informed of the requirements of the broader YTD initiative. These two lines of management were designed to facilitate the integration of the I-Teams into the Workforce Centers while still allowing CWP to provide direction on broader issues. Having centralized management only most likely would have made integration of the I-Teams into the Centers far more difficult. Nevertheless, the dual lines of management under Youth WINS limited CWP’s effectiveness in directing the delivery of project services and ensuring timely hiring in response to staff turnover.54 Some Workforce Center managers and I-Team members told us of their perceptions that CWP management did not effectively set or articulate key project goals, milestones, and expectations for the I-Teams and their local supervisors. I-Team members reported that they worked among themselves and with their local supervisors to establish clear and specific goals and milestones within the broad guidelines provided by CWP. This led to diversity across the project sites in certain aspects of project implementation and a lack of consensus regarding the importance of key project outcomes, most notably employment.55
3. Fidelity to the YTD Program Model
As noted earlier, a condition for Youth WINS’ selection into the YTD random assignment evaluation was to strengthen its employment-related services. The MOU between CWP and Mathematica specified that Youth WINS services would include a focus on the provision of job development, job placement, and other employment-related services. In principle, CWP agreed to make such changes but, in practice, the focus on employment was an evolution. Early on, the evaluation team realized that the approach to employment service delivery in Youth WINS was not consistent with the YTD program model and this was identified as an issue in the evaluation team’s early assessment report (Baird et al. 2008). A recommendation was made to CWP that TransCen provide the project staff with intensive technical assistance to align services with the conceptual framework; however, this effort was never fully realized due to challenges with scheduling site visits to Youth WINS. In addition, there was not widespread participation by I-Team members in ongoing technical assistance efforts, such as monthly webinars hosted by TransCen.56 Youth WINS management did consistently attend the webinars and disseminated materials and information from them to the I-Teams; however, the webinars were designed for direct participation by line staff.
4. Staff Turnover
The hiring and training of new I-Team members in response to staff turnover was a persistent weakness in the implementation of Youth WINS. All of the I-Teams, with the exception of the one in Larimer County, experienced significant staff turnover, and the Pueblo and Boulder I-Teams were short-staffed for long periods of time.57 For example, the career counselor position on the Pueblo I-
54 Since the Workforce Centers were responsible for hiring the I-Teams, CWP was unable to ensure the quality and timing of hires.
55 Due to sample size constraints, it was not possible to generate reliable estimates of the site-specific impacts of Youth WINS. Impact estimates for the combined sites are presented in Chapters IV through IX of this report.
56 TransCen conducted a roll call prior to the start of each webinar, but did not systematically record attendance. The TransCen staff members who ran the webinars recalled that one member of Youth WINS management and one I-Team member attended most of the webinars, but that it was unusual for staff from all four I-Teams to attend.
57 Implementation research and quarterly reports submitted by Youth WINS show that, across the four sites, vacancies in staff positions ranged from just over one month to six consecutive months. In addition, some positions
(continued)
46
Interim Report on Colorado Youth WINS Chapter III: Implementation of Youth WINS
Team was vacant for more than seven months over the course of the project; interviews with staff members made clear that this vacancy became a serious hindrance to productivity and morale. Several I-Team members told us that even after new staff were hired, they often did their jobs for months with little formal training in their job duties.58 Only in the final year of the project did Youth WINS achieve fully staffed and trained I-Teams.
Staff turnover on the I-Teams may have affected the timeliness of project services. I-Teams that were short-staffed or had new staff during the heaviest enrollment periods reported that they devoted most of their time to recruitment, meaning that fewer services were provided to existing participants. Findings from our focus group discussions with Youth WINS participants support this perception, as several participants stated that I-Team members could be hard to contact, often did not answer their telephones, and were slow to return calls in response to voicemail messages.
5. Staff Training
There was a general perception among I-Team members that their training for Youth WINS was insufficient during the first two years of the project’s participation in the random assignment evaluation but improved in the third and final year. In particular, the DPNs reported that, unlike the benefits and career counselors, they had not received formal training on their job duties and had not engaged in periodic, scheduled conference calls with the Youth WINS project manager at CWP. In addition, training for all I-Team members on job development was not addressed fully until late in the project. TransCen provided initial training on job development in the winter of 2007 and made frequent attempts to schedule additional follow-up training; however, as noted above, CWP management did not support follow-up training and technical assistance that would have reinforced and expanded on the initial training. For example, staff were not aware of periodic technical assistance webinars offered by TransCen and targeted to direct service staff, although management regularly participated; management reported that any useful information was disseminated to staff. Furthermore, several of the career counselors did not receive the initial training because of staff turnover. While the career counselors participated in periodic conference calls with the project manager to review cases and discuss job development strategies, more intensive training based upon best practices in job development was not provided until the final year of the project. At that time, CWP management was amenable to TransCen reengaging with the I-Teams to provide training on job development. This receptivity to training by TransCen may have been partly in response to recommendations made by the evaluation team in its early assessment report on Youth WINS (Baird et al. 2008).
Finally, while all Youth WINS benefits counselors received formal SSA-led training on SSA benefits and work incentives at the outset of the project, staff turnover resulted in significant periods of time during which the benefits counselors on two of the I-Teams had not been formally trained.59
(continued) became vacant multiple times over the course of the evaluation. In Pueblo County, for instance, the DPN position was vacant for varying lengths of time on three separate occasions between January 2006 and December 2008.
58 While the project managers at CWP have told us that they provided an I-Team manual to each new staff member, as well as a four week orientation and training outline within one month of hire, our interviews with the I-Teams suggests a disconnect. The Youth WINS line staff did not mention the manual or training during the interviews and the majority of those who had been hired to replace original I-Team members who had departed told us that they had either received inadequate training or had not been trained at all.
59 “Formal SSA-led training on benefits and work incentives” refers to the training currently provided by subcontractors of SSA to WIPA counselors and previously provided to Benefits, Planning, Assistance, and Outreach
(continued)
47
Interim Report on Colorado Youth WINS Chapter III: Implementation of Youth WINS
The new counselors received training from the CWP project manager for Youth WINS but did not receive the more comprehensive, formal SSA-led benefits counseling training. Field interviews conducted in 2008 indicated that some of the benefits counselors did not have a good command of best practices in benefits planning. This finding led CWP to arrange for all of the Youth WINS benefits counselors to receive early in 2009 the same training that is provided to WIPA benefits counselors.
Over the course of Youth WINS’ participation in the YTD national random assignment evaluation, particularly in the final year of the project, the CWP management team improved staffing and training for the I-Teams. TransCen was brought in to provide formal training on job development and all of the benefits counselors were trained according to WIPA standards. While these improvements in staffing and training are noteworthy, it is possible that they were not made early enough to improve services significantly for most Youth WINS participants.
F. Service Use
Virtually all participants in Youth WINS received some project services, which commenced soon after enrollment. Those services were individualized and consumer-directed, as the I-Teams were committed to getting to know the participants and addressing their specific interests and needs. The participants most often received case management and benefits planning services; services that were sharply focused on employment and education were less common.
This section uses quantitative data from the Youth WINS management information system, ETO, to explore the services received by participating youth. We first examine the development of PCPs and then document the specific types of services received, the timing of those services relative to project enrollment, and the intensity of the services. For purpose of this analysis, we refer to the first 15 months after random assignment as the period of service receipt.60 To limit the analysis to substantial service contacts only, we exclude contacts with participants lasting two minutes or less.61
The tables presented in this section summarize the findings from the analysis of the ETO data; please see the tables in Appendix C for more detailed results.
Project staff were expected to enter into ETO any service provided to or on behalf of a youth, as well as the time spent during the service contact. The staff were trained to record separately each type of service addressed during one contact. For example, if the DPN discussed education options for 20 minutes and provided general case management to a youth for 30 minutes, the staff member would record each of these services and the associated time in its own category. ETO was not
(continued) (BPAO) counselors. While Youth WINS staff had regular and ongoing contact with SSA area work incentives coordinators (AWICs) and SSA regional office staff throughout the project, this did not include the type of formal training necessary for comprehensive benefits counseling until early in 2009.
60 When we conducted the analysis of service use, 15 months of post-random assignment service data were available for the last treatment group member to enroll in Youth WINS. To ensure a uniform follow-up period for all participants, we limited our analysis of service use to the first 15 months following random assignment.
61 In our analysis, service-related contacts were limited to those provided by Youth WINS and lasting longer than two minutes (“substantial” contacts), thereby excluding attempted contacts (i.e., unsuccessful attempts to reach youth). In addition, all letter, text, and e-mail contacts were excluded, with the exception of benefits planning-related contacts. Benefits-related mailings were included because staff used them to provide important information and advisement on benefits. It is possible that youth received services outside of Youth WINS; we discuss referrals to other service providers below, in the section describing case management provided by the project (Section F.2.a).
48
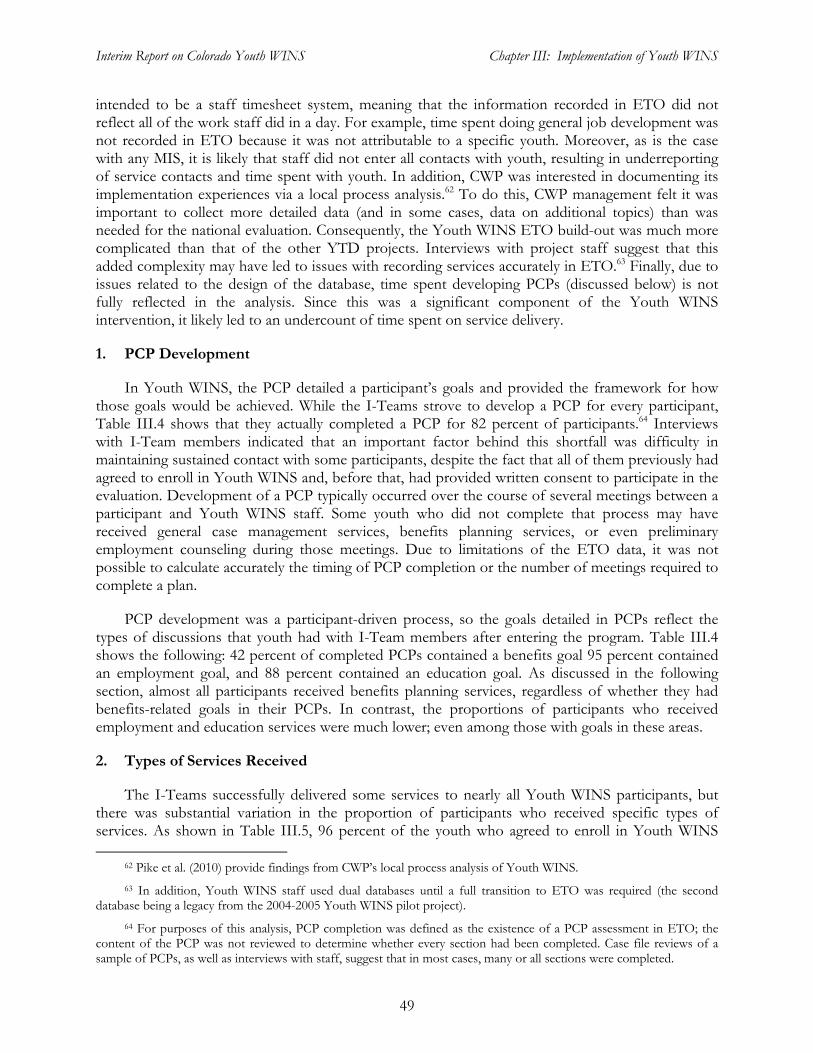
Interim Report on Colorado Youth WINS Chapter III: Implementation of Youth WINS
intended to be a staff timesheet system, meaning that the information recorded in ETO did not reflect all of the work staff did in a day. For example, time spent doing general job development was not recorded in ETO because it was not attributable to a specific youth. Moreover, as is the case with any MIS, it is likely that staff did not enter all contacts with youth, resulting in underreporting of service contacts and time spent with youth. In addition, CWP was interested in documenting its implementation experiences via a local process analysis.62 To do this, CWP management felt it was important to collect more detailed data (and in some cases, data on additional topics) than was needed for the national evaluation. Consequently, the Youth WINS ETO build-out was much more complicated than that of the other YTD projects. Interviews with project staff suggest that this added complexity may have led to issues with recording services accurately in ETO.63 Finally, due to issues related to the design of the database, time spent developing PCPs (discussed below) is not fully reflected in the analysis. Since this was a significant component of the Youth WINS intervention, it likely led to an undercount of time spent on service delivery.
1. PCP Development
In Youth WINS, the PCP detailed a participant’s goals and provided the framework for how those goals would be achieved. While the I-Teams strove to develop a PCP for every participant, Table III.4 shows that they actually completed a PCP for 82 percent of participants.64 Interviews with I-Team members indicated that an important factor behind this shortfall was difficulty in maintaining sustained contact with some participants, despite the fact that all of them previously had agreed to enroll in Youth WINS and, before that, had provided written consent to participate in the evaluation. Development of a PCP typically occurred over the course of several meetings between a participant and Youth WINS staff. Some youth who did not complete that process may have received general case management services, benefits planning services, or even preliminary employment counseling during those meetings. Due to limitations of the ETO data, it was not possible to calculate accurately the timing of PCP completion or the number of meetings required to complete a plan.
PCP development was a participant-driven process, so the goals detailed in PCPs reflect the types of discussions that youth had with I-Team members after entering the program. Table III.4 shows the following: 42 percent of completed PCPs contained a benefits goal 95 percent contained an employment goal, and 88 percent contained an education goal. As discussed in the following section, almost all participants received benefits planning services, regardless of whether they had benefits-related goals in their PCPs. In contrast, the proportions of participants who received employment and education services were much lower; even among those with goals in these areas.
2. Types of Services Received
The I-Teams successfully delivered some services to nearly all Youth WINS participants, but there was substantial variation in the proportion of participants who received specific types of services. As shown in Table III.5, 96 percent of the youth who agreed to enroll in Youth WINS
62 Pike et al. (2010) provide findings from CWP’s local process analysis of Youth WINS.
63 In addition, Youth WINS staff used dual databases until a full transition to ETO was required (the second database being a legacy from the 2004-2005 Youth WINS pilot project).
64 For purposes of this analysis, PCP completion was defined as the existence of a PCP assessment in ETO; the content of the PCP was not reviewed to determine whether every section had been completed. Case file reviews of a sample of PCPs, as well as interviews with staff, suggest that in most cases, many or all sections were completed.
49
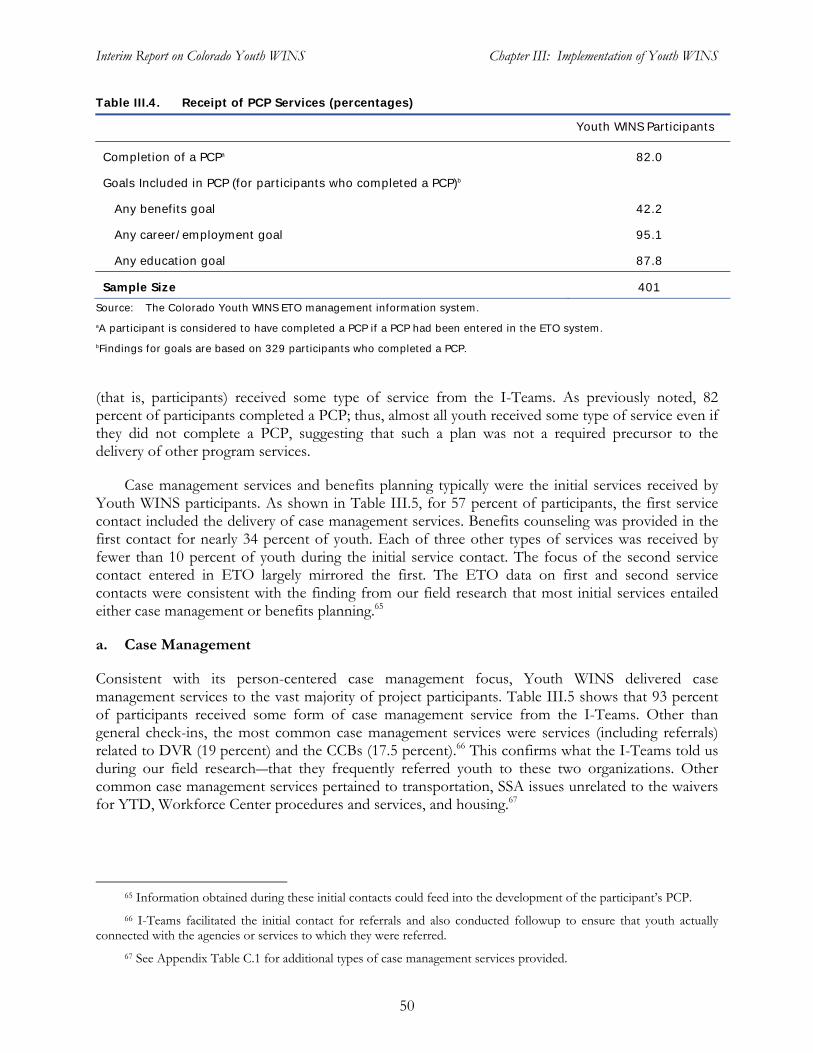
Interim Report on Colorado Youth WINS Chapter III: Implementation of Youth WINS
Table III.4. Receipt of PCP Services (percentages)
Youth WINS Participants
Completion of a PCPa 82.0
Goals Included in PCP (for participants who completed a PCP)b
Any benefits goal 42.2
Any career/employment goal 95.1
Any education goal 87.8
Sample Size 401
Source: The Colorado Youth WINS ETO management information system.
aA participant is considered to have completed a PCP if a PCP had been entered in the ETO system.
bFindings for goals are based on 329 participants who completed a PCP.
(that is, participants) received some type of service from the I-Teams. As previously noted, 82 percent of participants completed a PCP; thus, almost all youth received some type of service even if they did not complete a PCP, suggesting that such a plan was not a required precursor to the delivery of other program services.
Case management services and benefits planning typically were the initial services received by Youth WINS participants. As shown in Table III.5, for 57 percent of participants, the first service contact included the delivery of case management services. Benefits counseling was provided in the first contact for nearly 34 percent of youth. Each of three other types of services was received by fewer than 10 percent of youth during the initial service contact. The focus of the second service contact entered in ETO largely mirrored the first. The ETO data on first and second service contacts were consistent with the finding from our field research that most initial services entailed either case management or benefits planning.65
a. Case Management
Consistent with its person-centered case management focus, Youth WINS delivered case management services to the vast majority of project participants. Table III.5 shows that 93 percent of participants received some form of case management service from the I-Teams. Other than general check-ins, the most common case management services were services (including referrals) related to DVR (19 percent) and the CCBs (17.5 percent).66 This confirms what the I-Teams told us during our field research―that they frequently referred youth to these two organizations. Other common case management services pertained to transportation, SSA issues unrelated to the waivers for YTD, Workforce Center procedures and services, and housing.67
65 Information obtained during these initial contacts could feed into the development of the participant’s PCP.
66 I-Teams facilitated the initial contact for referrals and also conducted followup to ensure that youth actually connected with the agencies or services to which they were referred.
67 See Appendix Table C.1 for additional types of case management services provided.
50
Interim Report on Colorado Youth WINS Chapter III: Implementation of Youth WINS
Table III.5. Receipt of Youth WINS Services (percentages, unless otherwise noted)
Youth WINS Participants
Any Youth WINS Service 96.3
First Service Contact Case management 57.4 Benefits planning 33.7 Employment-related 8.0 Additional discussions of YTD waivers (beyond general overview)a 3.5 Education-related 2.2
Second Service Contact Case management 55.6 Benefits planning 28.2 Employment-related 7.5 Additional discussions of YTD waivers (beyond general overview)a 3.7 Education-related 4.2
Any Case Management Service 92.8 General check-in 89.0 Vocational rehabilitation 18.7 Community Centered Board services 17.5 Transportation 13.5 Resolving problems with SSA (not related to YTD waivers) 12.7 Workforce Center services 10.2 Financial services 8.7 Housing 5.0 Family support 3.0 Mental health 2.2 Life skills 2.0 Medical/dental/vision 2.0 Community access 1.5 Guardianship/legal assistance 1.0 Juvenile justice 0.7 Other 46.4
Any Benefits Planning Service 88.0 Any waiver or work incentive discussion 88.0 Benefits assessment 87.8 Discussions of non-SSA benefits and work incentives (e.g., TANF and SNAP) 81.8 Benefits analysis and advisement 77.6 Benefits overview 48.9 Additional discussions of YTD waivers (beyond general overview)a 22.4 Additional discussions of non-YTD SSA work incentives (beyond general overview) 9.7 Other 7.0
Any Employment-Related Service 54.4 Career exploration and job search 30.4 Direct employment servicesb 29.4 Discussion and goal setting 24.9 Employment skills trainingc 9.5
Any Employment Goal in PCP 78.1
Any Employment-Related Service for Those with Employment Goal 61.7
Any Education-Related Service 25.4 Assistance with accommodations or student support services 8.2 Preparing for or attending IEP or transition meetings 7.0 Registration or enrollment assistance 4.2 Accessing financial aid 3.7 Other 16.7
Any Education Goal in PCP 72.1
Any Education-Related Service for Those with Education Goal 30.8
Sample Size 401
Source: The Youth WINS ETO management information system.
Notes: We excluded service contacts of less than two minutes from this analysis. Within each service group, more than one type of service may have been recorded in ETO for the same service contact. The service types displayed within a group may not be exhaustive. All percentages are based on 401 participants.
a“Additional discussions of YTD waivers” includes only focused discussions of specific individual waivers or all five waivers. It does not include general discussions that may have taken place during an enrollment meeting or a benefits assessment. b“Direct employment services” includes development of work experiences, job coaching, job placement, and followup. c“Employment skills training” includes soft skills, pre-employment training, and occupationally specific skills training.
51
Interim Report on Colorado Youth WINS Chapter III: Implementation of Youth WINS
b. Benefits Planning
Benefits planning was a primary focus of Youth WINS, so it is not surprising that most participants received those services. As shown in Table III.5, 88 percent of participants received some type of benefits planning service. This was driven largely by the completion of a formal benefits assessment, which was a comprehensive review and analysis of the benefits received by a youth, with a strong focus on SSI and DI benefits. The assessment included an overview of standard SSA work incentives and an introduction to the waivers for YTD. The high proportion of youth who received benefits assessments (nearly all of the youth who received any benefits planning) is an important finding, given that the assessments were viewed as being essential to the benefits planning component of Youth WINS and could be an important vehicle for helping youth to understand the financial advantages of employment. Most participants (82 percent) also discussed other (non-SSA) benefits and work incentives with the I-Teams. Those discussions may have covered Medicaid, subsidized housing, SNAP (food stamps), and other non-SSA benefits.
However, less than one-quarter of participants engaged in explicit, in-depth discussions with I-Team members about the SSA waivers for YTD beyond the general overview provided in the benefits assessment. Furthermore, only 10 percent engaged in discussions of specific standard (non-YTD) SSA work incentives, such as the exclusion of impairment-related work expenses from countable income, plans to achieve self-support, and 1619(b) extended Medicaid coverage for employed people on SSI.
The low percentages of youth who engaged in discussions related to the SSA waivers for YTD and standard SSA work incentives could be problematic, given that understanding of these topics was important for any Youth WINS participant who was working or had specific plans to work. There are several possible reasons for why these percentages were not higher. The I-Teams simply may have underreported their in-depth benefits discussions in ETO. Another possibility is that inadequate training for benefits counselors during certain phases of the project (discussed in Section E, above) may have left them without the full set of skills needed to provide in-depth benefits analysis and planning. Observations made during field visits support this latter possibility. These ETO-based findings notwithstanding, our focus group discussions with participants suggested general satisfaction with the benefits planning they had received from Youth WINS and a basic understanding of the benefits they were receiving and how work might affect those benefits.68
Another important aspect related to benefits planning was implementation of SSA work incentives and YTD waivers for Youth WINS participants. Table III.6 presents participant usage rates of SSA waivers and work incentives (see Appendix D for a description of the waivers). Overall, 31 percent of Youth WINS participants reported any earnings to SSA over the course of the intervention (many of the SSA work incentives and YTD waivers were triggered by earned income). A smaller proportion, 26 percent, used any SSA work incentive in the same period. The most frequently used work incentive was the EIE, used by 20 percent of participants. All participants who used the EIE automatically received the waiver version of that incentive. Nearly 10 percent of participants used any SEIE (standard or waiver), with 6 percent using the standard SEIE incentive only. There was little to no usage of any of the PASS, IDA, and Section 301 work incentives and waivers.
68 During focus group discussions, several youth, when prompted, were able to recognize some SSA work incentives and waivers for YTD. Focus group participants were selected based on their characteristics and so were not representative of all participants in Youth WINS.
52
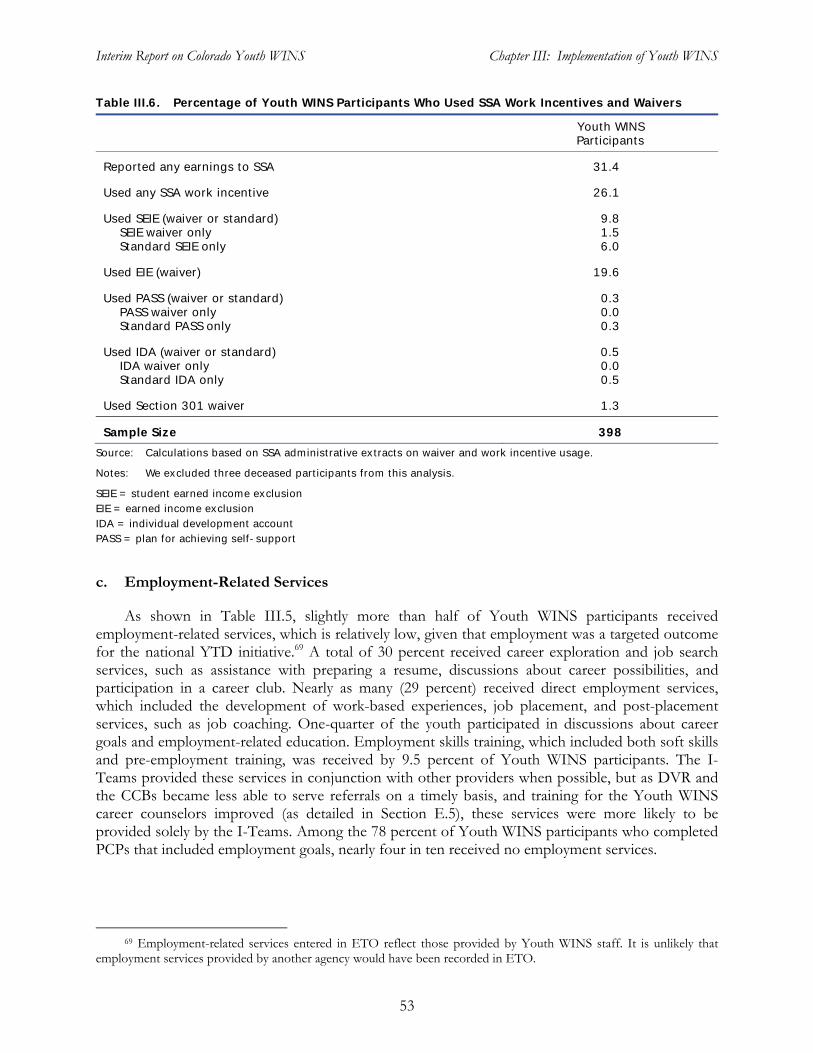
Interim Report on Colorado Youth WINS Chapter III: Implementation of Youth WINS
Table III.6. Percentage of Youth WINS Participants Who Used SSA Work Incentives and Waivers
Youth WINS Participants
Reported any earnings to SSA 31.4
Used any SSA work incentive 26.1
Used SEIE (waiver or standard) SEIE waiver only Standard SEIE only
9.8 1.5 6.0
Used EIE (waiver) 19.6
Used PASS (waiver or standard) PASS waiver only Standard PASS only
0.3 0.0 0.3
Used IDA (waiver or standard)IDA waiver only Standard IDA only
0.5 0.0 0.5
Used Section 301 waiver 1.3
Sample Size 398
Source: Calculations based on SSA administrative extracts on waiver and work incentive usage.
Notes: We excluded three deceased participants from this analysis.
SEIE = student earned income exclusion EIE = earned income exclusion IDA = individual development account PASS = plan for achieving self-support
c. Employment-Related Services
As shown in Table III.5, slightly more than half of Youth WINS participants received employment-related services, which is relatively low, given that employment was a targeted outcome for the national YTD initiative.69 A total of 30 percent received career exploration and job search services, such as assistance with preparing a resume, discussions about career possibilities, and participation in a career club. Nearly as many (29 percent) received direct employment services, which included the development of work-based experiences, job placement, and post-placement services, such as job coaching. One-quarter of the youth participated in discussions about career goals and employment-related education. Employment skills training, which included both soft skills and pre-employment training, was received by 9.5 percent of Youth WINS participants. The I-Teams provided these services in conjunction with other providers when possible, but as DVR and the CCBs became less able to serve referrals on a timely basis, and training for the Youth WINS career counselors improved (as detailed in Section E.5), these services were more likely to be provided solely by the I-Teams. Among the 78 percent of Youth WINS participants who completed PCPs that included employment goals, nearly four in ten received no employment services.
69 Employment-related services entered in ETO reflect those provided by Youth WINS staff. It is unlikely that employment services provided by another agency would have been recorded in ETO.
53
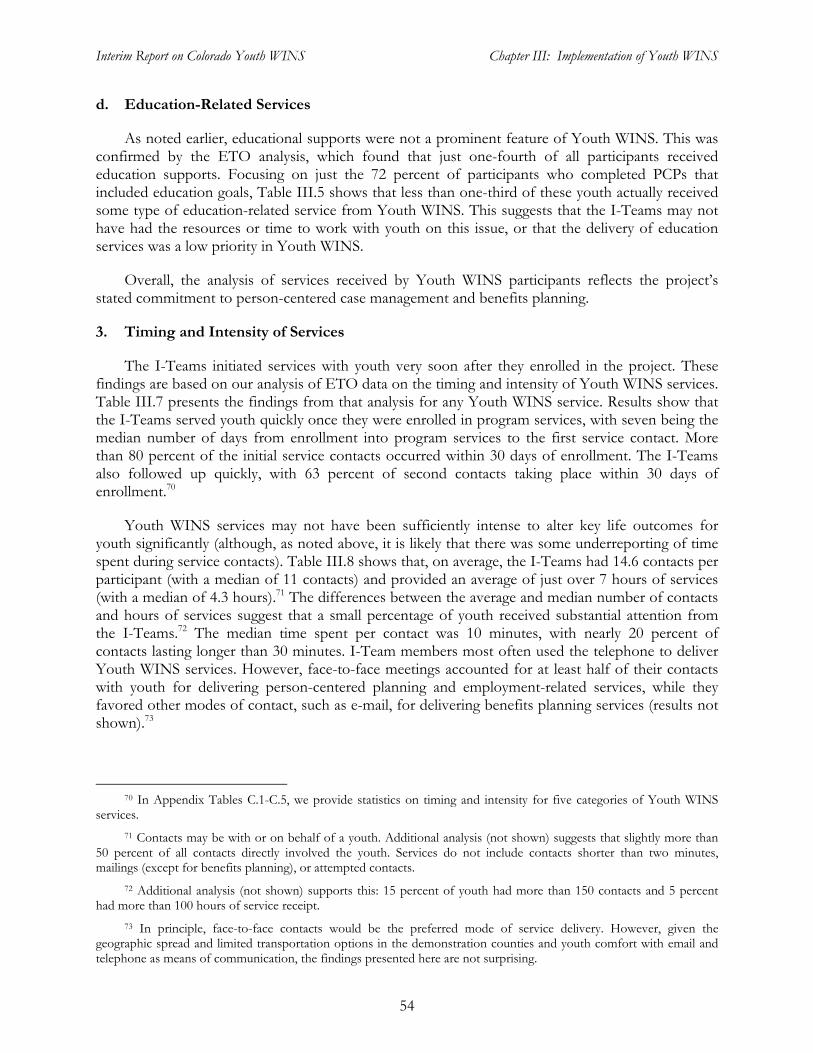
Interim Report on Colorado Youth WINS Chapter III: Implementation of Youth WINS
d. Education-Related Services
As noted earlier, educational supports were not a prominent feature of Youth WINS. This was confirmed by the ETO analysis, which found that just one-fourth of all participants received education supports. Focusing on just the 72 percent of participants who completed PCPs that included education goals, Table III.5 shows that less than one-third of these youth actually received some type of education-related service from Youth WINS. This suggests that the I-Teams may not have had the resources or time to work with youth on this issue, or that the delivery of education services was a low priority in Youth WINS.
Overall, the analysis of services received by Youth WINS participants reflects the project’s stated commitment to person-centered case management and benefits planning.
3. Timing and Intensity of Services
The I-Teams initiated services with youth very soon after they enrolled in the project. These findings are based on our analysis of ETO data on the timing and intensity of Youth WINS services. Table III.7 presents the findings from that analysis for any Youth WINS service. Results show that the I-Teams served youth quickly once they were enrolled in program services, with seven being the median number of days from enrollment into program services to the first service contact. More than 80 percent of the initial service contacts occurred within 30 days of enrollment. The I-Teams also followed up quickly, with 63 percent of second contacts taking place within 30 days of enrollment.70
Youth WINS services may not have been sufficiently intense to alter key life outcomes for youth significantly (although, as noted above, it is likely that there was some underreporting of time spent during service contacts). Table III.8 shows that, on average, the I-Teams had 14.6 contacts per participant (with a median of 11 contacts) and provided an average of just over 7 hours of services (with a median of 4.3 hours).71 The differences between the average and median number of contacts and hours of services suggest that a small percentage of youth received substantial attention from the I-Teams.72 The median time spent per contact was 10 minutes, with nearly 20 percent of contacts lasting longer than 30 minutes. I-Team members most often used the telephone to deliver Youth WINS services. However, face-to-face meetings accounted for at least half of their contacts with youth for delivering person-centered planning and employment-related services, while they favored other modes of contact, such as e-mail, for delivering benefits planning services (results not shown).73
70 In Appendix Tables C.1-C.5, we provide statistics on timing and intensity for five categories of Youth WINS services.
71 Contacts may be with or on behalf of a youth. Additional analysis (not shown) suggests that slightly more than 50 percent of all contacts directly involved the youth. Services do not include contacts shorter than two minutes, mailings (except for benefits planning), or attempted contacts.
72 Additional analysis (not shown) supports this: 15 percent of youth had more than 150 contacts and 5 percent had more than 100 hours of service receipt.
73 In principle, face-to-face contacts would be the preferred mode of service delivery. However, given the geographic spread and limited transportation options in the demonstration counties and youth comfort with email and telephone as means of communication, the findings presented here are not surprising.
54
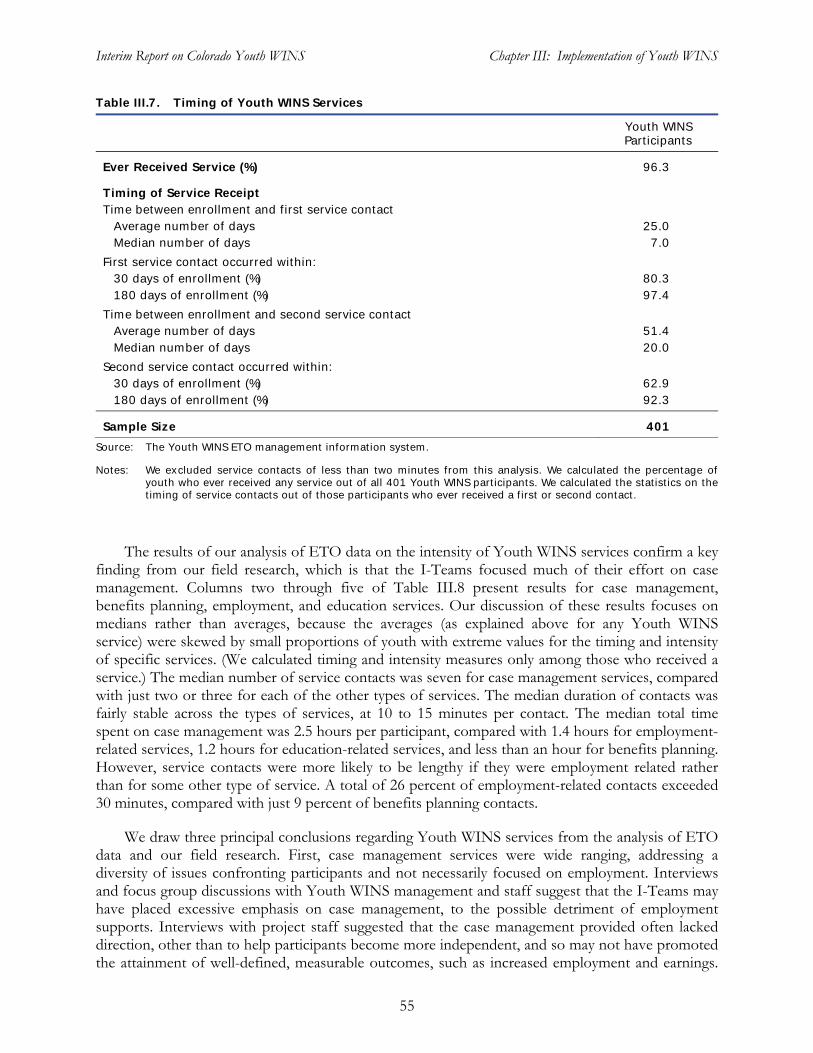
Interim Report on Colorado Youth WINS Chapter III: Implementation of Youth WINS
Table III.7. Timing of Youth WINS Services
Youth WINS Participants
Ever Received Service (%) 96.3
Timing of Service Receipt Time between enrollment and first service contact
Average number of days 25.0 Median number of days 7.0
First service contact occurred within: 30 days of enrollment (%) 80.3 180 days of enrollment (%) 97.4
Time between enrollment and second service contact Average number of days 51.4 Median number of days 20.0
Second service contact occurred within: 30 days of enrollment (%) 62.9 180 days of enrollment (%) 92.3
Sample Size 401
Source: The Youth WINS ETO management information system.
Notes: We excluded service contacts of less than two minutes from this analysis. We calculated the percentage ofyouth who ever received any service out of all 401 Youth WINS participants. We calculated the statistics on the timing of service contacts out of those participants who ever received a first or second contact.
The results of our analysis of ETO data on the intensity of Youth WINS services confirm a key finding from our field research, which is that the I-Teams focused much of their effort on case management. Columns two through five of Table III.8 present results for case management, benefits planning, employment, and education services. Our discussion of these results focuses on medians rather than averages, because the averages (as explained above for any Youth WINS service) were skewed by small proportions of youth with extreme values for the timing and intensity of specific services. (We calculated timing and intensity measures only among those who received a service.) The median number of service contacts was seven for case management services, compared with just two or three for each of the other types of services. The median duration of contacts was fairly stable across the types of services, at 10 to 15 minutes per contact. The median total time spent on case management was 2.5 hours per participant, compared with 1.4 hours for employment-related services, 1.2 hours for education-related services, and less than an hour for benefits planning. However, service contacts were more likely to be lengthy if they were employment related rather than for some other type of service. A total of 26 percent of employment-related contacts exceeded 30 minutes, compared with just 9 percent of benefits planning contacts.
We draw three principal conclusions regarding Youth WINS services from the analysis of ETO data and our field research. First, case management services were wide ranging, addressing a diversity of issues confronting participants and not necessarily focused on employment. Interviews and focus group discussions with Youth WINS management and staff suggest that the I-Teams may have placed excessive emphasis on case management, to the possible detriment of employment supports. Interviews with project staff suggested that the case management provided often lacked direction, other than to help participants become more independent, and so may not have promoted the attainment of well-defined, measurable outcomes, such as increased employment and earnings.
55
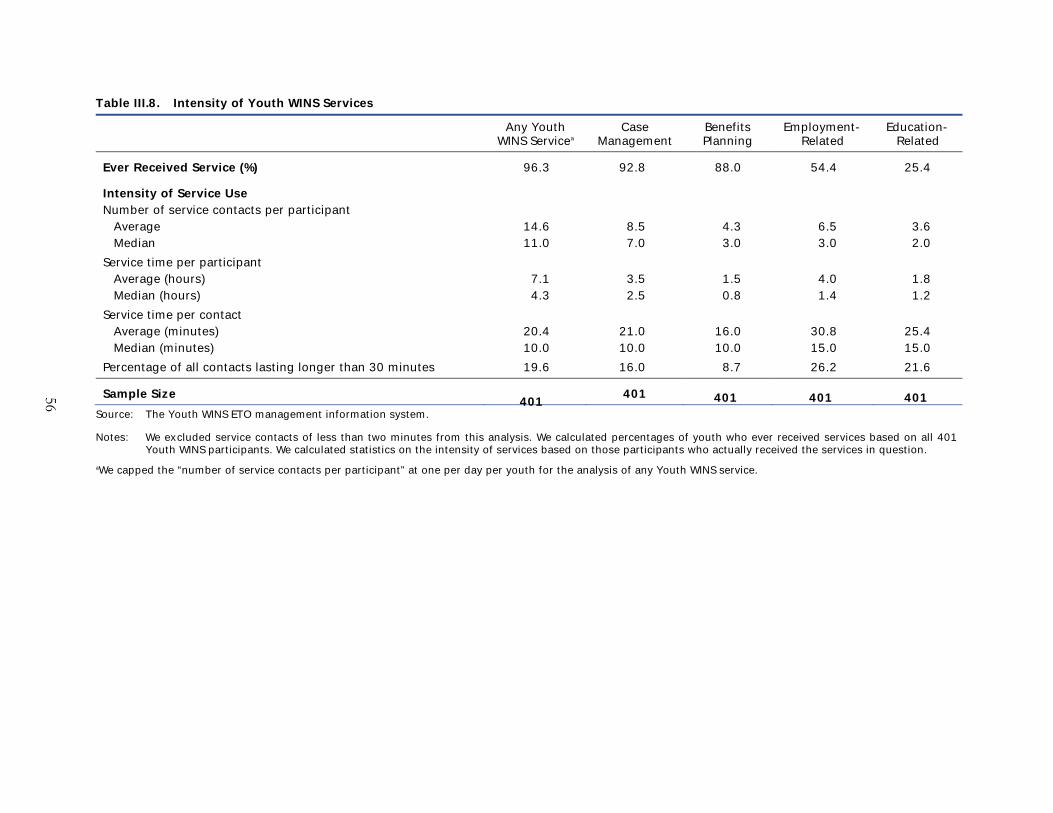
Table III.8. Intensity of Youth WINS Services
Any Youth Case Benefits Employment- Education-WINS Servicea Management Planning Related Related
56
Ever Received Service (%) 96.3 92.8 88.0 54.4 25.4
Intensity of Service Use Number of service contacts per participant
Average 14.6 8.5 4.3 6.5 3.6
Median 11.0 7.0 3.0 3.0 2.0
Service time per participant
Average (hours) 7.1 3.5 1.5 4.0 1.8
Median (hours) 4.3 2.5 0.8 1.4 1.2
Service time per contact
Average (minutes) 20.4 21.0 16.0 30.8 25.4
Median (minutes) 10.0 10.0 10.0 15.0 15.0
Percentage of all contacts lasting longer than 30 minutes 19.6 16.0 8.7 26.2 21.6
Sample Size
401 401 401 401 401
Source: The Youth WINS ETO management information system.
Notes: We excluded service contacts of less than two minutes from this analysis. We calculated percentages of youth who ever received services based on all 401Youth WINS participants. We calculated statistics on the intensity of services based on those participants who actually received the services in question.
aWe capped the “number of service contacts per participant” at one per day per youth for the analysis of any Youth WINS service.
Interim Report on Colorado Youth WINS Chapter III: Implementation of Youth WINS
This was despite the fact that the PCPs for almost all Youth WINS participants included an employment goal.
Second, while most participants received benefits planning, the service contacts for that purpose were not as intensive as those for case management. Both our field research and the ETO data suggest that much of the counseling was to convey general benefits information and resolve particular benefit problems, rather than to provide in-depth counseling on how specific jobs and activities would affect benefits in the context of the SSA waivers for YTD. Despite the fact that several focus group participants demonstrated a basic understanding of how work and the YTD waivers would affect their benefits, the lack of intensive benefits planning services in Youth WINS may have meant that a number of participants did not have the information necessary to make informed decisions regarding employment.
Third and finally, the relatively low intensity of direct employment-related services (and services more generally) may have been problematic. The statistics presented earlier on the low percentage of participants who received employment services and the small amount of time spent on employment service delivery are consistent with field observations that the I-Teams provided employment supports only when participants requested them and after the teams already had delivered case management and benefits planning services. The location of Youth WINS in Workforce Centers, along with the use of referrals to DVR and the CCBs, may have allowed participants to gain access to employment services so that the I-Teams did not have to provide them directly and so did not record them in ETO.74 While Workforce Center services can be valuable resources for job seekers, more comprehensive, coordinated, and disability-specific services are, in principle, available through DVR and the CCBs. As noted previously, however, both DVR and the CCBs struggled with funding cuts over the course of the Youth WINS project, so their services may not have been readily accessible by participants.75 Youth WINS did leverage its co-location in the One-Stop Workforce Centers, but this generally focused on some of the basic services offered, such as self-directed job search, job listings and basic connections to employers, and some skills training. Given the challenges of the existing service system in Colorado described earlier, Youth WINS may have missed some key opportunities to provide rapid, focused employment services directly to youth— services generally not available in Colorado to youth with disabilities.
G. Participation Patterns over Time
Our field research on Youth WINS, including interviews with I-Team members, revealed a deliberate, sequential approach to service delivery. To summarize, the I-Teams typically initiated services for a new participant by working with the youth to develop a PCP and delivering case management services based on the emerging information regarding his or her abilities, needs, and interests. Those services were followed closely by, or provided in conjunction with, benefits planning. If a youth expressed interest in employment or, to a lesser degree, education, the I-Teams would introduce services keyed to those interests. Staff generally did not actively engage youth in discussions about employment, particularly early in the youth’s tenure with the program, since staff
74 An analysis of ETO referral data (Appendix Table C.1) did not reveal large numbers of referrals to employment service providers; however, interviews with the I-Teams suggested that their coordination with those providers might have been more frequent and intense than the ETO data indicate.
75 About 19 percent of Youth WINS participants were referred to DVR and 18 percent to CCBs (Appendix Table C.1).
57
Interim Report on Colorado Youth WINS Chapter III: Implementation of Youth WINS
felt that such goal setting should be self directed.76 As described in Section F.2, Youth WINS participants were more likely to receive case management and benefits planning services—and to receive them earlier—than employment- and education-related services. In this section, we present additional findings from analyses of ETO data that confirm and expand upon this sequence of project services.
Table III.9 presents the percentage of participants who received services in the quarter in which they enrolled (referred to as Quarter 0) and in the subsequent five quarters.77 It also compares participation during this same time period for two cohorts of youth, defined by whether they had been randomly assigned early or in the later stages of the evaluation. We present statistics for receipt of any benefits planning, employment, or education service (combined) during the follow-up period and for receipt of each of these three types of services individually. Although case management was often the first service provided, it also was provided consistently throughout a youth’s tenure with the program. Given this, we did not include case management services in this analysis.
Among youth who received any of the three types of services during the six quarters following their enrollment in Youth WINS, service receipt rates were highest in the quarters closest to enrollment (Quarters 0 and 1). The rates dipped in Quarters 2 and 3 and then increased slightly in Quarters 4 and 5. These findings are consistent with descriptions of their service delivery approach provided by the I-Teams: they provided intensive benefits planning services soon after enrollment and generally provided employment services after the youth had been involved in the program for some time. A more in-depth analysis of the ETO data supports these conclusions. Slightly more than 51 percent of youth who ever received benefits planning services during the follow-up period received at least some of those services in the quarter they enrolled. The rate of receipt of benefits planning services declined in the following quarter, then leveled out at between 31 and 37 percent for the remainder of the follow-up period.
Employment services, on the other hand, were not provided as quickly as benefits planning services, with slightly more than one-quarter of youth receiving such services in Quarter 0. Peak rates of participation in employment services were achieved early, in the quarter following the quarter of enrollment, and then later in Quarters 4 and 5. The rate of participation in employment services was about 45 percent in Quarter 1. It dipped to about 35 percent in the next two quarters before increasing in Quarters 4 and 5, with nearly the same proportion of youth (43.7 percent) receiving employment services in Quarter 5 as in Quarter 1. The increase in participation in employment services in the final two quarters of the follow-up period was driven largely by the late cohort (as discussed below).
There were no clear patterns in participation in education services, except that the rate of participation was relatively low throughout the follow-up period, and especially in the quarter of enrollment. This is not surprising, given that the delivery of education services was driven largely by youth interest rather than a fixed sequencing of services in the Youth WINS program model.
76 During interviews, the I-Team members consistently noted that they usually provided employment services to youth only after resolving various social service, case management, and benefits needs, and at the youth's request. Focus group discussions with Youth WINS participants confirmed this finding.
77 Quarter 0 includes the month the youth enrolled in services and the subsequent two months. Each subsequent quarter refers to the corresponding quarter after enrollment.
58
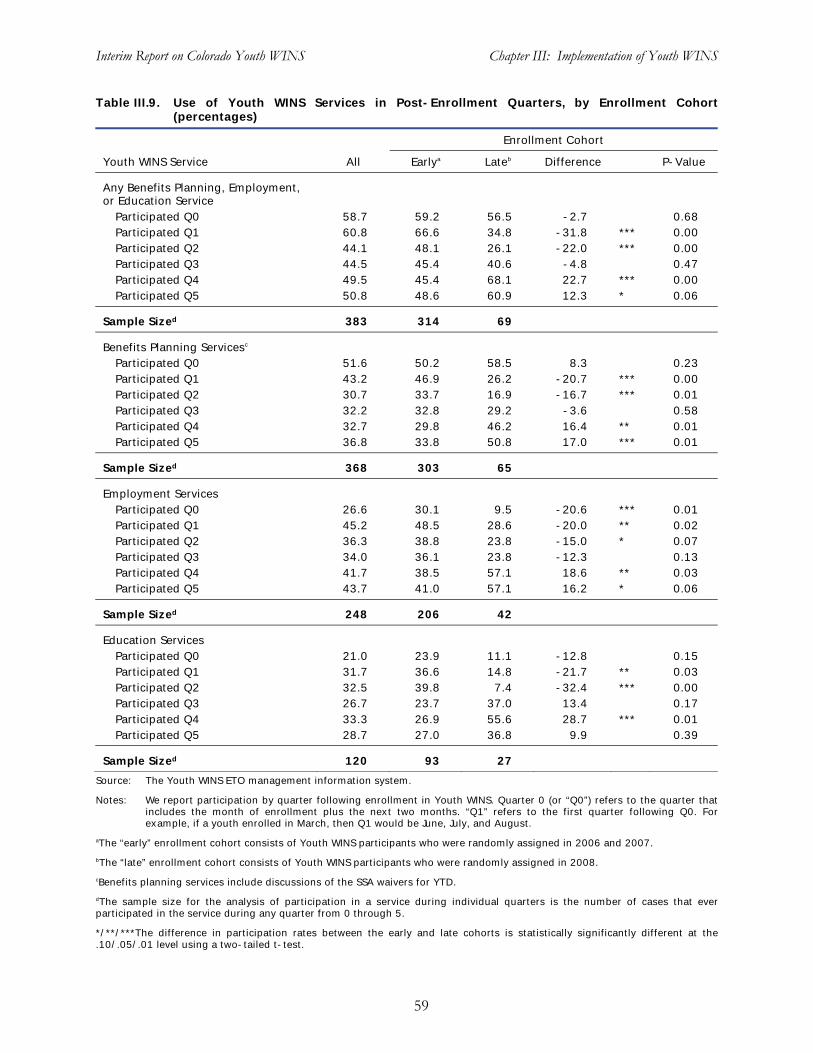
Interim Report on Colorado Youth WINS Chapter III: Implementation of Youth WINS
Table III.9. Use of Youth WINS Services in Post-Enrollment Quarters, by Enrollment Cohort(percentages)
Enrollment Cohort
Youth WINS Service All Earlya Lateb Difference P-Value
Any Benefits Planning, Employment, or Education Service
Participated Q0 58.7 59.2 56.5 -2.7 0.68 Participated Q1 60.8 66.6 34.8 -31.8 *** 0.00 Participated Q2 44.1 48.1 26.1 -22.0 *** 0.00 Participated Q3 44.5 45.4 40.6 -4.8 0.47 Participated Q4 49.5 45.4 68.1 22.7 *** 0.00
Participated Q5 50.8 48.6 60.9 12.3 * 0.06
Sample Sized 383 314 69
Benefits Planning Servicesc
Participated Q0 51.6 50.2 58.5 8.3 0.23 Participated Q1 43.2 46.9 26.2 -20.7 *** 0.00 Participated Q2 30.7 33.7 16.9 -16.7 *** 0.01
Participated Q3 32.2 32.8 29.2 -3.6 0.58 Participated Q4 32.7 29.8 46.2 16.4 ** 0.01 Participated Q5 36.8 33.8 50.8 17.0 *** 0.01
Sample Sized 368 303 65
Employment Services Participated Q0 26.6 30.1 9.5 -20.6 *** 0.01 Participated Q1 45.2 48.5 28.6 -20.0 ** 0.02 Participated Q2 36.3 38.8 23.8 -15.0 * 0.07 Participated Q3 34.0 36.1 23.8 -12.3 0.13 Participated Q4 41.7 38.5 57.1 18.6 ** 0.03 Participated Q5 43.7 41.0 57.1 16.2 * 0.06
Sample Sized 248 206 42
Education Services Participated Q0 21.0 23.9 11.1 -12.8 0.15 Participated Q1 31.7 36.6 14.8 -21.7 ** 0.03 Participated Q2 32.5 39.8 7.4 -32.4 *** 0.00 Participated Q3 26.7 23.7 37.0 13.4 0.17
Participated Q4 33.3 26.9 55.6 28.7 *** 0.01 Participated Q5 28.7 27.0 36.8 9.9 0.39
Sample Sized 120 93 27
Source: The Youth WINS ETO management information system.
Notes: We report participation by quarter following enrollment in Youth WINS. Quarter 0 (or “Q0”) refers to the quarter that includes the month of enrollment plus the next two months. “Q1” refers to the first quarter following Q0. For example, if a youth enrolled in March, then Q1 would be June, July, and August.
aThe “early” enrollment cohort consists of Youth WINS participants who were randomly assigned in 2006 and 2007.
bThe “late” enrollment cohort consists of Youth WINS participants who were randomly assigned in 2008.
cBenefits planning services include discussions of the SSA waivers for YTD.
dThe sample size for the analysis of participation in a service during individual quarters is the number of cases that everparticipated in the service during any quarter from 0 through 5.
*/**/***The difference in participation rates between the early and late cohorts is statistically significantly different at the .10/.05/.01 level using a two-tailed t-test.
59
Interim Report on Colorado Youth WINS Chapter III: Implementation of Youth WINS
Field visits in April of 2007 and 2008 revealed concern among I-Team members that the intensive focus on enrollment activities was affecting their ability to provide services to participants in a timely manner―particularly employment services. This concern was expressed most strongly by members of the Pueblo I-Team, which was short-staffed for a significant portion of 2007, but members of the El Paso and Boulder I-Teams also expressed the same concern.78 Pressure to enroll youth was especially intense in early 2008 as the I-Teams worked to achieve enrollment goals and complete the enrollment process by May of that year. A May 2009 field visit found the I-Teams to be staffed more fully and able to devote more time to service delivery.
To understand how enrollment activities may have affected service delivery, we conducted a cohort analysis of participation in Youth WINS services. An analysis of ETO data was conducted that compared two cohorts: youth randomly assigned into the treatment group in 2006 and 2007 (an early cohort) and youth randomly assigned in 2008 (a late cohort). The second and third columns of Table III.9 present rates of participation in services, by quarter following enrollment, for the two enrollment cohorts. Based on findings from our field research, we hypothesized that enrollment negatively impacted service delivery, especially as the enrollment effort drew to a close. The service participation patterns of the early and late cohorts strongly support this hypothesis, but also suggest a more nuanced interpretation of what occurred.
Across the three types of services considered, participation rates for the early cohort were higher in the quarters closest to enrollment, compared with the rates for the late cohort. Conversely, participation rates were lower for the early cohort than for the late cohort in the quarters near the end of the follow-up period. These cohort differences are particularly striking for employment services. Youth in the early cohort who received any employment services during the follow-up period were about 20 percentage points more likely than their counterparts in the late cohort to have received those services in Quarters 0 and 1. This pattern reversed by Quarters 4 and 5, however, when youth in the late cohort were about 17 percentage points more likely than their early cohort counterparts to have received employment services. With respect to benefits planning services, participation rates by members of the early cohort were substantially larger in Quarters 1 and 2 and substantially smaller in Quarters 4 and 5, compared with the rates for members of the late cohort.
Three factors may have been responsible for the time pattern of cohort differences in participation in services. First, as members of the early cohort moved into the later quarters of their participation in Youth WINS, project staff were focused on enrolling the last group of youth who had been randomly assigned to the treatment group (that is, the members of the late cohort). This likely diverted staff attention away from delivering services to the early cohort, resulting in lower rates of service receipt in the later quarters for those youth, relative to their peers in the late cohort. Second, as the youth in the late cohort were being enrolled in services in the first five months of 2008, the extreme focus on completing the enrollment process likely resulted in lower rates of service receipt for this group during the early quarters, compared with the early cohort. As the enrollment push ended, staff were able to focus more fully on service delivery, resulting in higher rates of service receipt in the later quarters for the late cohort, relative to the early cohort. Third, training efforts may have influenced these statistics. Toward the end of 2008 and into 2009, TransCen provided substantial encouragement and training to the I-Teams to provide more services, particularly those related to employment and comprehensive benefits planning. This emphasis may
78 The Larimer I-Team did not express this concern during interviews. In general, the Larimer I-Team was staffed fully and stably throughout the operational stage of the project, and most enrollment duties were assigned to the DPN.
60
Interim Report on Colorado Youth WINS Chapter III: Implementation of Youth WINS
have contributed to the sharp increases in the receipt of these services by members of the late cohort in Quarters 4 and 5, relative to Quarters 2 and 3.
H. Youth Satisfaction with Services
Many participants in Youth WINS who recalled receiving services were satisfied with the project as a whole and regarded their specific program experiences as having been helpful. Table III.10 presents findings from the evaluation’s 12-month follow-up survey on satisfaction with Youth WINS. These corroborate findings from our focus group discussions with participants, which suggested that, while some youth felt that the project did not do much for them, many believed that the I-Teams had assisted them in a variety of ways, particularly in the areas of benefits counseling, navigating social services, referrals, and crisis intervention. A substantial proportion of participants, more than 40 percent, did not recall receiving services from Youth WINS. It is possible that some of these youth did not recognize Youth WINS as their service provider, since the project was housed in the One-Stop Workforce Centers.
Approximately one-third of Youth WINS participants felt that each of six specific experiences or services that they may have had or received in the project had been somewhat or very helpful. The values range from 34.2 percent feeling that the project had been somewhat or very helpful in developing confidence in their abilities and developing career goals to 28.2 percent feeling that the project had helped them work effectively with others. For this analysis, the youth who did not recall receiving Youth WINS services were classified together with those who did recall the services but did not consider them to have been somewhat or very helpful.
Approximately 42 percent of Youth WINS participants reported that their overall experience with the project had been either good or excellent. Only 3.5 percent rated their experience in the project as poor. A slightly higher proportion of participants, nearly 45 percent, believed that the project services had been somewhat or very useful. About 10 percent had a negative opinion of the project, telling us that its services had been not very useful or not at all useful. A large proportion (nearly 43 percent) of the participants did not recall having received services from Youth WINS.79
I. Implementation Lessons and Challenges
The implementation analysis of Youth WINS has documented that the project succeeded in enrolling a large number of youth with significant disabilities and in delivering individualized case management services to this group. Those services lacked a strong and clear focus on employment, however. The Youth WINS line staff, organized into I-Teams, were well integrated in the Workforce Centers where they were based and also had good relationships with other agencies in their communities, such as DVR and the CCBs. In addition to providing case management services early and often, the I-Teams delivered significant amounts of benefits planning, which they regarded as a key Youth WINS service not readily available to participants through other sources. Participants appeared to be satisfied with the services they had received through Youth WINS and judged them to have been helpful.
79 Additional analysis, not shown, indicates that the vast majority (98 percent) of participants who recalled receiving services from Youth WINS had services entered in ETO. On the other hand, most participants who did not recall receiving services from Youth WINS (93 percent) also had services recorded in ETO. Furthermore, 60 percent of these participants received at least five contacts from Youth WINS.
61
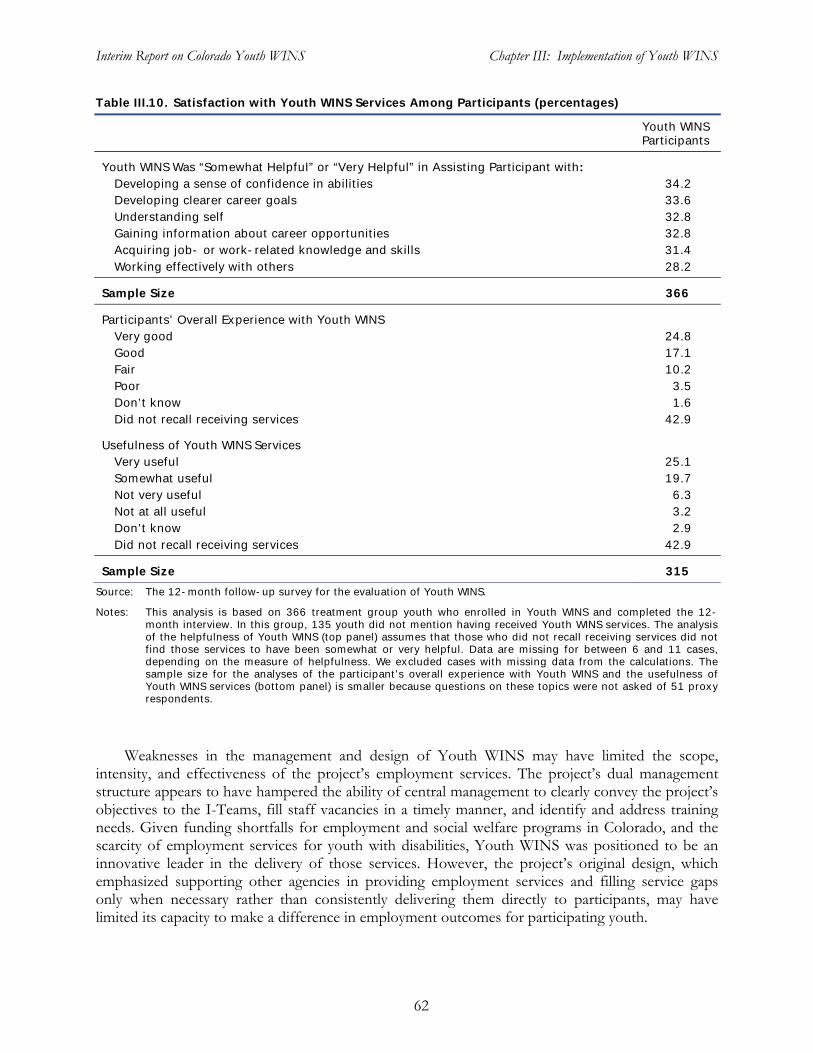
Interim Report on Colorado Youth WINS Chapter III: Implementation of Youth WINS
Table III.10. Satisfaction with Youth WINS Services Among Participants (percentages)
Youth WINS Participants
Youth WINS Was “Somewhat Helpful” or “Very Helpful” in Assisting Participant with: Developing a sense of confidence in abilities 34.2 Developing clearer career goals 33.6 Understanding self 32.8 Gaining information about career opportunities 32.8 Acquiring job- or work-related knowledge and skills 31.4 Working effectively with others 28.2
Sample Size 366
Participants’ Overall Experience with Youth WINSVery good 24.8 Good 17.1 Fair 10.2 Poor 3.5 Don’t know 1.6 Did not recall receiving services 42.9
Usefulness of Youth WINS Services Very useful 25.1 Somewhat useful 19.7 Not very useful 6.3 Not at all useful 3.2 Don’t know 2.9 Did not recall receiving services 42.9
Sample Size 315
Source: The 12-month follow-up survey for the evaluation of Youth WINS.
Notes: This analysis is based on 366 treatment group youth who enrolled in Youth WINS and completed the 12month interview. In this group, 135 youth did not mention having received Youth WINS services. The analysisof the helpfulness of Youth WINS (top panel) assumes that those who did not recall receiving services did not find those services to have been somewhat or very helpful. Data are missing for between 6 and 11 cases, depending on the measure of helpfulness. We excluded cases with missing data from the calculations. The sample size for the analyses of the participant’s overall experience with Youth WINS and the usefulness of Youth WINS services (bottom panel) is smaller because questions on these topics were not asked of 51 proxyrespondents.
Weaknesses in the management and design of Youth WINS may have limited the scope, intensity, and effectiveness of the project’s employment services. The project’s dual management structure appears to have hampered the ability of central management to clearly convey the project’s objectives to the I-Teams, fill staff vacancies in a timely manner, and identify and address training needs. Given funding shortfalls for employment and social welfare programs in Colorado, and the scarcity of employment services for youth with disabilities, Youth WINS was positioned to be an innovative leader in the delivery of those services. However, the project’s original design, which emphasized supporting other agencies in providing employment services and filling service gaps only when necessary rather than consistently delivering them directly to participants, may have limited its capacity to make a difference in employment outcomes for participating youth.
62
Interim Report on Colorado Youth WINS Chapter III: Implementation of Youth WINS
We conclude this chapter by discussing nine key implementation lessons and challenges that we identified through the process analysis of Youth WINS.
1. Socioeconomic characteristics may be a factor in determining which youth access transition services. Members of the treatment group for the Youth WINS evaluation who had a stronger work orientation, better health, and higher socioeconomic status (as evidenced by greater maternal education and higher family income) were more likely to respond positively to efforts by I-Team members to enroll them in project services. Conversely, treatment group members who were worse off were less likely to enroll in services. This finding suggests that transition programs should design and implement alternative strategies to conduct outreach to youth with significant socioeconomic challenges.
2. One-Stop Workforce Centers are an interesting but often overlooked potential partner in transition programs for youth with disabilities. Workforce Centers provide an array of employment services, but rarely are designed to provide services that fully meet the needs of youth and individuals with disabilities. Given their location in the Centers and their full integration into Center operations, the I-Teams were uniquely positioned to help Youth WINS participants access and make the most of those services. They also were able to leverage Center connections to gain access to a range of external services for their participants. The success of Youth WINS in this area may be a useful template for other Workforce Centers in integrating services for youth with disabilities into their operations.
3. When scaling up programs that require a shift in focus to adhere to a conceptual framework, having strong management buy-in is an important factor in successful implementation. When SSA and the evaluation team developed the conceptual framework for YTD, the expectation was that organizations and projects selected to participate would adhere to the principles of the conceptual framework. MOUs clearly described expectations related to service delivery. Frequent check-ins with management and staff assessed fidelity to the model. In the case of Youth WINS, CWP management was reluctant to adjust its program model but agreed to do so. However, it never fully embraced the underlying conceptual framework for YTD, believing that its case management approach to service delivery sufficiently adhered to the principles of YTD. When fundamental shifts in program philosophy and culture are requirements for scaling up a program, it is important to consider whether program management has truly bought into those changes and, if not, to develop strategies for achieving such buy-in.
4. Quick engagement could increase participation in program services. The Larimer I-Team adopted a slow and deliberate approach to enrollment in the belief that this would ultimately lead to a higher enrollment rate and greater engagement in services by those who did enroll. The findings from our analysis of enrollment statistics across the four Youth WINS sites provide no support for this belief; Larimer was the only site that did not meet the project-wide goal of enrolling 83 percent of treatment youth in services.
5. Project management should establish clear objectives for staff, arrange for provision of all necessary training in a timely manner, and reinforce that training throughout the project. The dual management structure of Youth WINS provided strong local supervision of the I-Teams by Center managers, but deficiencies in central management by CWP resulted in inconsistent service delivery. Training for benefits counselors and career counselors was inadequate during much of the life of the project. A lack of clear objectives for the project as a whole, as well as for specific I-Team
63
Interim Report on Colorado Youth WINS Chapter III: Implementation of Youth WINS
positions, led staff to focus on crisis intervention and case management rather than delivering coordinated services designed to improve employment and education outcomes. A geographically dispersed intervention, such as Youth WINS, requires both centralized and local management, with each having well-delineated responsibilities. Centralized management should establish clear program guidelines and develop and implement timely training programs, while local management should focus on implementing the program in a manner consistent with those guidelines, while remaining sensitive to local conditions. Centralized management should consider seeking out technical assistance providers with expertise in these areas, particularly if it is starting new programs.
6. Project management should have an effective plan for dealing with staff departures, which are inevitable for social service agencies. Neither CWP nor the local supervisors of the I-Teams had strong plans for dealing with staff departures. This resulted in months of vacancies on three of the four I-Teams. The protracted vacancies overburdened the remaining staff and likely resulted in some degradation in the quality or quantity of services. This situation also made the timely delivery of training more challenging, as frequent staff turnover and long-vacant positions created a greater need for ongoing training. The managers of transition programs for youth with disabilities should assume that staff will leave and develop a strategy for the timely hiring and training of replacements before the commencement of services.
7. Project management should communicate clearly to staff how success will be measured. CWP did not establish employment as a key outcome for the I-Teams, despite (a) its understanding that employment is a primary outcome in the YTD national evaluation, and (b) the fact that job development/placement was highlighted in CWP’s MOU with Mathematica. In fact, the I-Teams generally did not have a clear sense of the project’s goals beyond the achievement of greater independence for participants as defined by the youth in their PCPs. Case management and benefits planning are essential services. But without an understanding of how program success would be measured, Youth WINS staff could not deliver those services in a focused way that complemented job development/placement services to achieve employment goals. The managers of transition programs should provide clear information to staff regarding how success will be measured and also should establish routine reporting and managerial structures to facilitate the achievement of those outcomes.
8. An intervention’s MIS design should be as simple and straightforward as possible, designed to maximize relevance for program service delivery rather than the nuances of evaluation. An important philosophy embraced by the evaluation team was maximizing the utility of ETO as a service delivery tool. Although it would serve as a mechanism for the evaluation to measure service delivery and intensity, there was a recognition that data quality would correlate with its utility and ease of use for project staff. However, CWP wanted to conduct an extensive local process evaluation and felt that it was important to incorporate all of the associated data collection into ETO. This led to an extremely complicated MIS design, relative to the other YTD projects. In interviews, staff indicated that the complexity of the ETO build-out for Youth WINS affected their ability to enter service delivery data efficiently and accurately. Recognizing this as an important lesson, subsequent ETO build-outs for the remaining evaluation sites primarily conformed to a core design with minimal customization.
64
Interim Report on Colorado Youth WINS Chapter III: Implementation of Youth WINS
9. Absent extremely strong external partners with stable funding, it is risky to rely on the existing service system for such key services as employment supports. CWP expected DVR, the CCBs, and the Workforce Centers to be the primary providers of employment supports under Youth WINS. However, shortfalls in funding for DVR and the CCBs during the project period reduced their capacity to fulfill that assignment. Consequently, Youth WINS relied heavily on the Workforce Centers for employment services and supports; but, in general, Workforce Centers are not organized to meet the specialized needs of youth with disabilities. As a consequence of its lack of clear focus on employment and reliance on external partners to provide employment services, Youth WINS may have missed an opportunity to fill a truly large gap in the existing service system. Although youth-serving programs may be inclined to leverage existing services, given the lack of stability in the service system and the limitations of existing employment supports for youth with disabilities, projects serving youth in transition should directly deliver key program services, such as employment supports, rather than relying on partner organizations to provide them.
As described in the conceptual framework presented in Chapter I, YTD was conceived as a program to empower youth and their families, test the efficacy of various SSA waivers, provide system linkages to social and health services, and help youth achieve employment. Ultimately, employment was a primary outcome of interest under YTD. While Youth WINS staff made efforts to empower their clients and provide system linkages, as well as provide benefits planning and information on the YTD waivers, employment never became a specific or primary goal of the project. Moreover, the original design of the Youth WINS intervention, which emphasized case management and referral over direct service provision, required Youth WINS to access other service providers to meet the broader service delivery goals of YTD. However, the existing service system in Colorado was unable to provide quality employment supports to youth in the target population. Youth WINS struggled to adjust to this reality. Ultimately, a combination of factors, including conflicts between the original program philosophy and the YTD conceptual framework, lack of clarity about evolving staff goals and roles, management shortfalls, and other inherent challenges in moving staff from a case management to a job placement role hindered the ability of Youth WINS to provide direct employment services to its clients.
CWP prepared a report summarizing its process analysis of Youth WINS (Pike et al. 2010). That report discusses the implementation of Youth WINS from the perspective of those who developed and implemented the program.
65

Interim Report on Colorado Youth WINS Chapter IV: Impacts on Employment Services
IV. IMPACTS ON THE USE OF EMPLOYMENT SERVICES AND OTHER SERVICES
The YTD initiative was designed to help youth with disabilities maximize their economic self-sufficiency as they transition from school to work. Given that paid employment is critical to the achievement of economic self-sufficiency, employment-promoting services are a core component of the initiative, as described in the conceptual framework (Figure I.1), and participation in those services constitutes one of the five outcome domains for the impact analysis. Employment-promoting services are intended to increase work-related experiences in the short term, and short-term participation in employment, an outcome examined in the next chapter, is pivotal to improving the potential for long-term employment.
As discussed in Chapter III, Youth WINS never fully embraced employment as the central focus of project services; rather, it followed an intensive case management model. Nevertheless, Youth WINS did agree to an increased emphasis on employment-related services as a condition for being selected into the YTD national random assignment evaluation. Under the Youth WINS service model, the project provided referrals to employment service providers (particularly to the Workforce Centers) and, when appropriate employment services were not readily available, the I-Teams were expected to work directly with youth and employers to identify appropriate jobs and arrange for workplace accommodations and job coaching. The I-Teams also were expected to provide program navigation services, benefits counseling, and career counseling.
In this chapter, we begin with a discussion of the findings pertaining to the primary outcome measure in the domain of employment-promoting services―the use of any such service. Based on our analysis of this measure, we answer the following question: During the year following random assignment, did Youth WINS lead to treatment group youths’ use of more employment-promoting services than if the project had not been initiated? In Chapter III, we used data from the project’s management information system to show that 54 percent of treatment group youth participating in the project indeed received employment-promoting services from the I-Teams. However, in this chapter, to answer the above question we use information from survey data collected from both treatment and control group youth about 12 months after random assignment.80 It is important to note that this analysis captures the use of services delivered by Youth WINS and other providers. Because the project provided referrals to local service providers, it could have increased the use of services beyond those provided directly by Youth WINS. On the other hand, Youth WINS services could have displaced some services that other organizations otherwise would have provided.
We found that Youth WINS increased the proportion of youth who used employment-promoting services, primarily career and benefits counseling, rather than direct work experiences. The project also increased the proportion of youth who used non-employment services, particularly those related to person-centered planning. However, Youth WINS had only a modest impact on the number of months of overall service use and no impact on other measures of the amount of services used. Consistent with the emphasis of Youth WINS on benefits counseling, we found that it increased the knowledge of SSA requirements and work incentives and also improved understanding of the relationship between work and the receipt of SSA benefits. Finally, despite its reliance on referrals, Youth WINS had very little impact on the types of service providers used by youth. All of
80 For youth under age 18 at the time of the 12-month survey, we gathered information on service utilization from a parent or guardian. For ease of reference, we term the responses “youth reports.”
67
Interim Report on Colorado Youth WINS Chapter IV: Impacts on Employment Services
these measures of service use cover the period between random assignment and the evaluation’s 12-month follow-up survey; we may find additional impacts based on data for later periods.
A. Youth WINS Increased the Use of Employment Services
Consistent with the intent of the YTD program model, Youth WINS increased the use of any employment-promoting service by youth with disabilities. Nearly 62 percent of treatment group youth reported using any employment-promoting service in the year following random assignment (Table IV.1). We estimated that, in the absence of Youth WINS, only about 49 percent of these youth would have used any such service. The project thus had a positive impact of 12 percentage points on the primary outcome measure in the domain of employment-promoting services (reflecting a relative impact of 25 percent).81
The YTD 12-month follow-up survey asked about the use of specific employment-promoting services, including career counseling, support for resume writing and job search activities, job shadowing and apprenticeships/internships, and other employment-focused services (such as basic skills training, computer classes, problem solving, and social skills training). Given that SSA benefits-related work incentives are integral to the YTD initiative, counseling on SSA benefits also is considered an employment-promoting service. The Youth WINS service model emphasized the direct provision of career and benefits counseling, with each I-Team consisting of at least one career counselor and a benefits counselor, in addition to a disability program navigator. Consistent with this service model, we found that Youth WINS increased the use of career counseling services (by 7 percentage points, an increase of 26 percent) and benefits counseling (by 15 percentage points, an increase of 91 percent).82
The Youth WINS service philosophy was to address job development needs primarily through referrals to other service providers. When job development services were not readily available from partner organizations, it was the responsibility of the I-Team to work directly with participants and local employers to identify appropriate jobs and arrange for workplace accommodations and job coaching. As reported in the previous chapter, our process analysis found that the partner organizations suffered serious capacity limitations in responding to the needs of Youth WINS participants, yet the I-Teams never fully embraced the role of direct provision of job-development services and related employment supports. Consistent with the findings of our process analysis, we found that Youth WINS had no significant impact on the use of direct employment services, such as
81 As noted in Chapter II, Section A.4, the estimated impacts we present in this and subsequent chapters are regression adjusted. To provide context, in Table IV.1 and subsequent tables we report observed mean values for the treatment group, estimates of what the treatment group means would have been in the absence of Youth WINS, and regression-adjusted impact estimates. A regression-adjusted impact estimate is the difference between the treatment and control group means after adjusting for differences in baseline characteristics. The “estimated mean without Youth WINS” is calculated as the observed treatment group mean less the regression-adjusted impact estimate. We report unadjusted mean impacts in Appendix Table A.5 for all outcomes.
82 In Chapter III, Section F, we reported that our analysis of ETO data revealed that the I-Teams delivered benefits planning services to 88 percent of the treatment group youth who had enrolled in Youth WINS. The rate of enrollment in the project was 86 percent, so it follows that the I-Teams delivered benefits planning services to 76 percent of all treatment group members (.88 x .86 = .76). The difference between this rate, computed from ETO data, and the 30 percent rate of use of benefits planning services computed for treatment group members from the 12-month survey data (Table IV.1) can be explained by two factors: (1) Per instructions given by the YTD evaluation team, I-Team members recorded in ETO even very brief discussions with youth about SSA benefits at the time they occurred. (2) The survey respondents were asked to recall benefits planning services that they may have used over the entire preceding 12 months. Especially if those services consisted of a single brief discussion, the youth may have forgotten about them.
68
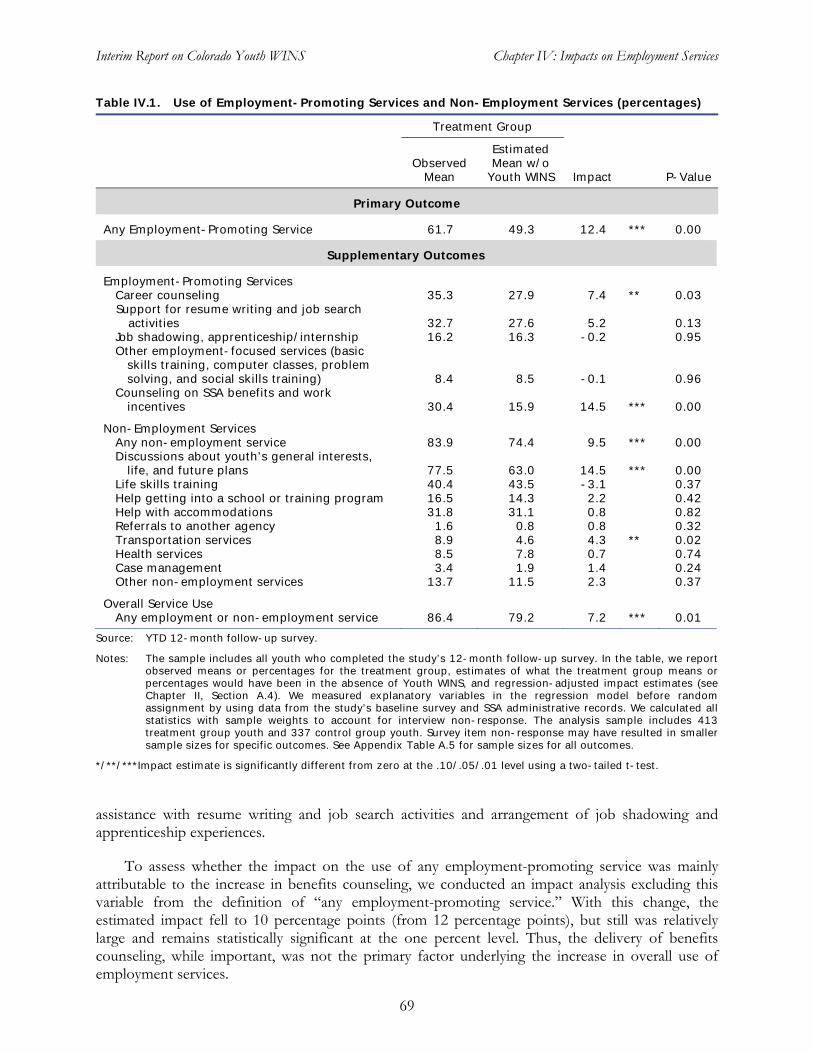
Interim Report on Colorado Youth WINS Chapter IV: Impacts on Employment Services
Table IV.1. Use of Employment-Promoting Services and Non-Employment Services (percentages)
Treatment Group
Estimated Observed Mean w/o
Mean Youth WINS Impact P-Value
Primary Outcome
Any Employment-Promoting Service 61.7 49.3 12.4 *** 0.00
Supplementary Outcomes
Employment-Promoting Services Career counseling 35.3 27.9 7.4 ** 0.03 Support for resume writing and job search
activities 32.7 27.6 5.2 0.13 Job shadowing, apprenticeship/internship 16.2 16.3 -0.2 0.95 Other employment-focused services (basic
skills training, computer classes, problem solving, and social skills training) 8.4 8.5 -0.1 0.96
Counseling on SSA benefits and workincentives 30.4 15.9 14.5 *** 0.00
Non-Employment ServicesAny non-employment service 83.9 74.4 9.5 *** 0.00 Discussions about youth’s general interests,
life, and future plans 77.5 63.0 14.5 *** 0.00 Life skills training 40.4 43.5 -3.1 0.37 Help getting into a school or training program 16.5 14.3 2.2 0.42 Help with accommodations 31.8 31.1 0.8 0.82 Referrals to another agency 1.6 0.8 0.8 0.32 Transportation services 8.9 4.6 4.3 ** 0.02 Health services 8.5 7.8 0.7 0.74 Case management 3.4 1.9 1.4 0.24 Other non-employment services 13.7 11.5 2.3 0.37
Overall Service Use Any employment or non-employment service 86.4 79.2 7.2 *** 0.01
Source: YTD 12-month follow-up survey.
Notes: The sample includes all youth who completed the study’s 12-month follow-up survey. In the table, we report observed means or percentages for the treatment group, estimates of what the treatment group means or percentages would have been in the absence of Youth WINS, and regression-adjusted impact estimates (see Chapter II, Section A.4). We measured explanatory variables in the regression model before random assignment by using data from the study’s baseline survey and SSA administrative records. We calculated all statistics with sample weights to account for interview non-response. The analysis sample includes 413treatment group youth and 337 control group youth. Survey item non-response may have resulted in smaller sample sizes for specific outcomes. See Appendix Table A.5 for sample sizes for all outcomes.
*/**/***Impact estimate is significantly different from zero at the .10/.05/.01 level using a two-tailed t-test.
assistance with resume writing and job search activities and arrangement of job shadowing and apprenticeship experiences.
To assess whether the impact on the use of any employment-promoting service was mainly attributable to the increase in benefits counseling, we conducted an impact analysis excluding this variable from the definition of “any employment-promoting service.” With this change, the estimated impact fell to 10 percentage points (from 12 percentage points), but still was relatively large and remains statistically significant at the one percent level. Thus, the delivery of benefits counseling, while important, was not the primary factor underlying the increase in overall use of employment services.
69
Interim Report on Colorado Youth WINS Chapter IV: Impacts on Employment Services
We also examined whether Youth WINS led to more youth using non-employment services. It is likely that general case management services were more readily available than employment-related services in the communities served by Youth WINS, such that control group youth also would have had access to such services. In fact, we found higher levels of use of non-employment services relative to employment-promoting services among members of both the treatment and control groups. Our estimates show that Youth WINS increased the use of these services by 10 percentage points (84 percent of treatment group youth reported using any non-employment service, compared with the 74 percent who would have used any such service in the absence of the program). Furthermore, consistent with the Youth WINS service model and its focus on person-centered planning, we found the largest impact on the percentage of youth who reported that someone had talked with them about their general interests, life, and future plans. Nearly 78 percent of the treatment group reported having had such discussions, compared with only 63 percent who would have had them in the absence of the program, resulting in an impact of 15 percentage points (a relative increase of 23 percent). We found no significant impacts on the use of other non-employment services, with the exception of transportation services, which increased by a significant four percentage points, reflecting an proportional increase of about 93 percent.83
Finally, we found that Youth WINS increased the share of youth using any service. Looking at overall service use (employment-promoting or non-employment), we found that just over 86 percent of treatment group members used any service at all. In the absence of Youth WINS, 79 percent of them would have used services. The seven percentage point difference is statistically significant. The project thus led to an increase in the combined use of employment and non-employment services.
In sum, we found that Youth WINS resulted in greater use of both employment-promoting services and non-employment services. However, the impacts on service use were concentrated in the areas that the process analysis showed to be the focus of the I-Teams—career counseling, benefits counseling, and discussions with youth of their general interests and plans—as opposed to work-based experiences such as job shadowing and internships. In the next chapter, we examine whether the increased services under Youth WINS, combined with the other aspects of the intervention, were sufficient to produce a significant impact on employment. However, an impact on employment also depends on the amount of services used. In the next section, we address the impact of Youth WINS on the amount of services.
B. Youth WINS Led to Increases in the Amount of All Services Used
In addition to examining the proportion of youth who used services, we investigated the amount of all (employment and non-employment) services used.84 If control group youth were able to access services from other providers, they may have used a similar amount of services as did members of the treatment group. On the other hand, if Youth WINS succeeded in helping treatment group youth access services from other local providers, its overall impact on the amount of services could have been greater than just the amount provided by the project itself.
83 For the use of transportation services, the estimated proportional impact is even larger when compared with the unadjusted observed mean for the control group rather than the estimated mean for the treatment group in the absence of Youth WINS. Relative to the observed mean for control group of 3.7 percent, the estimated impact represents an increase of about 115 percent (not shown in table).
84 Our data from the 12-month survey did not allow us to analyze the amount of employment services separately from the amount of all services.
70
Interim Report on Colorado Youth WINS Chapter IV: Impacts on Employment Services
Our measures of the amount of all services used are subject to considerable error because they are based on recall over a one-year period. However, there is no reason to believe that the measurement error differs between treatment and control group members. This means that, while the measurement error may reduce the precision of our impact estimates, it does not cause them to be biased. The 12-month survey asked each youth about the starting and ending dates for services from each provider that the youth reported using. Our principal measure of the amount of services is the number of months during which a youth reported using services from any provider. We estimated that treatment group members used services for 8.5 months, which is nearly a month more than the duration of services they would have used in the absence of the intervention (Table IV.2). This estimate is statistically significant and represents a relative impact of 11 percent. Further analysis suggests that the positive impact on months of service use was driven largely by the fact that more treatment group youth used any service, and not by additional months of services among those who used any service. Among youth who used any service, the average number of months of services was just under 10 months for both the treatment and control groups (not shown in table). In addition, based on information about the typical frequency of visits (for example, weekly or monthly), we estimated that Youth WINS had no impact on the number of contacts that youth had with providers.
The survey-based measure of hours of services is especially problematic. For each service provider reported by a youth, we used information on the starting and ending dates of service, the frequency of visits, and the typical length of each visit (in minutes). We multiplied these components together to calculate the total hours of services for each provider and then summed across the providers to calculate the grand total of service hours. We thus constructed our measure of service hours from three measures that are themselves difficult to measure accurately, based on recall over an entire year.
We estimated that Youth WINS did not increase the total hours of services used. Treatment group members used a total of 356 hours of services, on average, and we estimated that they would have used a similar amount of services in the absence of Youth WINS. To better understand these findings, we also examined average hours of service use among youth who used any services. The average total hours of services was higher for control group youth (443 hours) than treatment group youth (395 hours), but the difference is not statistically significant (not shown in table).85 Thus, even though more treatment group youth used services, some used relatively few hours of service. Nevertheless, their average number of hours of service use was quite high. This reflects services provided by Youth WINS as well as other organizations. In addition, the average includes very high values for youth who used services on a daily basis.86
85 Because this analysis was conducted on a self-selected subsample (youth who used any services) rather than the full research sample, the finding should not be interpreted as a formal impact estimate.
86 To understand the hours of services measure better, we examined hours of services for youth who used fewer than 1,000 hours over the one-year recall period. The 1,000-hour level is roughly equivalent to four hours of services every weekday over the year. The same fraction, 80 percent, of treatment and control group members used fewer than 1,000 hours of services. Among these youth, the average amount of services used was 157 hours for those in the treatment group and 144 hours for those in the control group youth (the difference is not statistically significant). Because this analysis was conducted on a self-selected subsample rather than the full research sample, the finding should not be interpreted as a formal impact estimate.
71
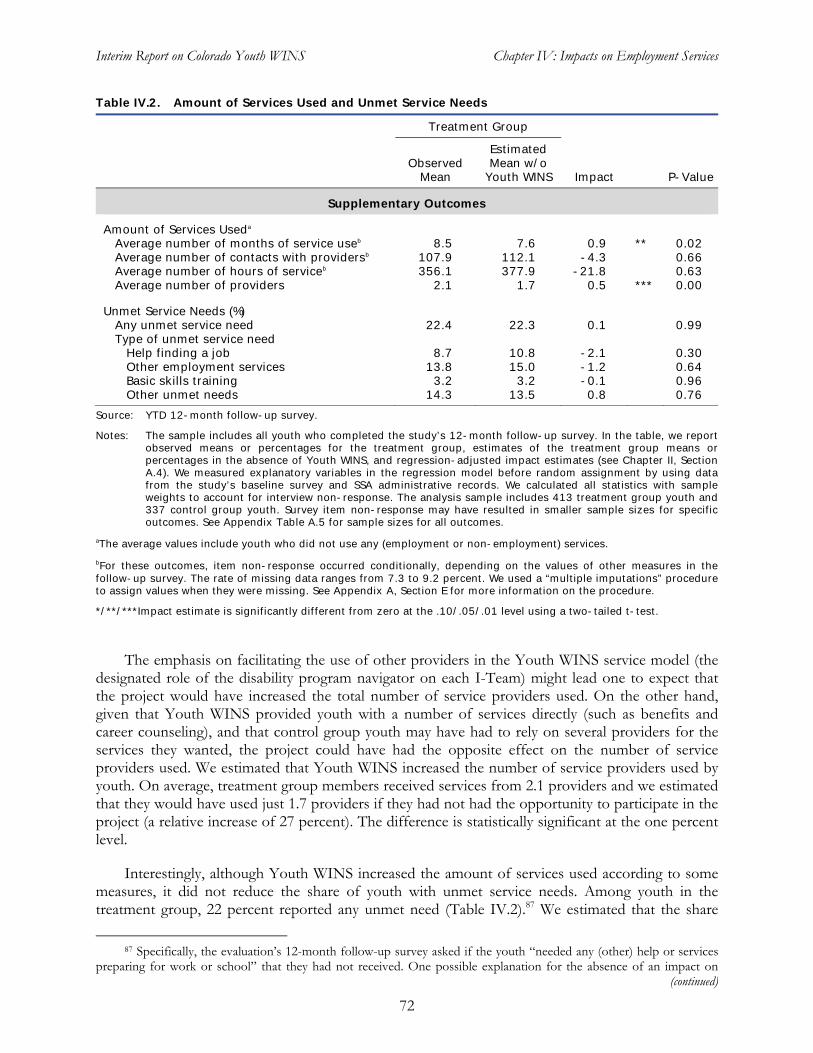
Interim Report on Colorado Youth WINS Chapter IV: Impacts on Employment Services
Table IV.2. Amount of Services Used and Unmet Service Needs
Treatment Group
Estimated Observed Mean w/o
Mean Youth WINS Impact P-Value
Supplementary Outcomes
Amount of Services Useda
Average number of months of service useb
Average number of contacts with providersb
Average number of hours of serviceb
Average number of providers
8.5 107.9 356.1
2.1
7.6 112.1 377.9
1.7
0.9 -4.3
-21.8 0.5
**
***
0.02 0.66 0.63 0.00
Unmet Service Needs (%) Any unmet service need Type of unmet service need
Help finding a job Other employment servicesBasic skills training Other unmet needs
22.4
8.7 13.8
3.2 14.3
22.3
10.8 15.0
3.2 13.5
0.1
-2.1 -1.2 -0.1 0.8
0.99
0.30 0.64 0.96 0.76
Source: YTD 12-month follow-up survey.
Notes: The sample includes all youth who completed the study’s 12-month follow-up survey. In the table, we report observed means or percentages for the treatment group, estimates of the treatment group means orpercentages in the absence of Youth WINS, and regression-adjusted impact estimates (see Chapter II, SectionA.4). We measured explanatory variables in the regression model before random assignment by using datafrom the study’s baseline survey and SSA administrative records. We calculated all statistics with sampleweights to account for interview non-response. The analysis sample includes 413 treatment group youth and 337 control group youth. Survey item non-response may have resulted in smaller sample sizes for specificoutcomes. See Appendix Table A.5 for sample sizes for all outcomes.
aThe average values include youth who did not use any (employment or non-employment) services.
bFor these outcomes, item non-response occurred conditionally, depending on the values of other measures in thefollow-up survey. The rate of missing data ranges from 7.3 to 9.2 percent. We used a “multiple imputations” procedure to assign values when they were missing. See Appendix A, Section E for more information on the procedure.
*/**/***Impact estimate is significantly different from zero at the .10/.05/.01 level using a two-tailed t-test.
The emphasis on facilitating the use of other providers in the Youth WINS service model (the designated role of the disability program navigator on each I-Team) might lead one to expect that the project would have increased the total number of service providers used. On the other hand, given that Youth WINS provided youth with a number of services directly (such as benefits and career counseling), and that control group youth may have had to rely on several providers for the services they wanted, the project could have had the opposite effect on the number of service providers used. We estimated that Youth WINS increased the number of service providers used by youth. On average, treatment group members received services from 2.1 providers and we estimated that they would have used just 1.7 providers if they had not had the opportunity to participate in the project (a relative increase of 27 percent). The difference is statistically significant at the one percent level.
Interestingly, although Youth WINS increased the amount of services used according to some measures, it did not reduce the share of youth with unmet service needs. Among youth in the treatment group, 22 percent reported any unmet need (Table IV.2).87 We estimated that the share
87 Specifically, the evaluation’s 12-month follow-up survey asked if the youth “needed any (other) help or services preparing for work or school” that they had not received. One possible explanation for the absence of an impact on
(continued)
72
Interim Report on Colorado Youth WINS Chapter IV: Impacts on Employment Services
would have been the same in the absence of the project. We also found no impacts of Youth WINS on unmet service needs by type.
C. Youth WINS Increased Understanding of the Relationship Between Benefits and Employment
Our process analysis found that Youth WINS offered participants an opportunity to receive individualized benefits counseling. This focus of the project was borne out by the finding reported in Section A that it increased the proportion of youth who received benefits counseling by 15 percentage points (Table IV.1). Given these results, it is not surprising that we found that Youth WINS increased understanding of the relationship between benefits and employment and increased knowledge of SSA requirements and work incentives.
We analyzed two measures that capture whether youth understood that, when they started working, they would not lose (1) all of their SSA benefits or (2) their related medical insurance.88, 89
Approximately three-fourths of treatment group youth understood both of these aspects of their benefits (Table IV.3). In the absence of Youth WINS, we estimated that roughly the same proportion would have understood that medical insurance is not lost as soon as work commences, but a significantly smaller proportion, just two-thirds, would have understood that cash benefits are not lost once work begins. We concluded that Youth WINS increased understanding of the relationship between work and benefit receipt but not the relationship between work and medical insurance coverage.90 Even within the treatment group, however, there was room for improvement in the understanding of these basic benefits issues, despite the availability of benefits counseling from Youth WINS.
In addition to determining whether youth understood the basic principle that all benefits are not lost when they start working, we examined whether Youth WINS increased their awareness of specific SSA requirements and work incentives. Awareness of work incentives among treatment group youth was not as great as might have been expected, given the project’s emphasis on benefits counseling; however, it was significantly greater than it would have been in the absence of the
(continued) unmet service needs is that Youth WINS may have increased youth awareness of needs. The increased awareness of needs could have offset any potential reduction in unmet service needs due to the intervention.
88 We collected information on knowledge of SSA benefits from a parent (or guardian) for youth under age 18 for most of the measures reported in this section. For ease of reference, we refer to the measures as “youth reports.” For knowledge of the continuing disability review or age-18 medical redetermination, for which we collected information from both the youth and a parent, we used the parent report because the information was more complete: about 87 percent of records were missing youth responses, whereas about 31 percent were missing parent responses. For knowledge of IDAs, for which we collected information from both the youth and a parent, we report both measures: 24 percent of records were missing youth responses, and about 31 percent were missing parent responses.
89 These measures report the share of youth who (correctly) disagreed with the statements, “As soon as people start working, they stop getting their Social Security benefits” and “As soon as people start working, they lose their medical coverage.”
90 Understanding of these relationships was slightly higher among treatment group youth who had worked for pay during the year following random assignment. Of these youth, 80 percent understood the relationship between work and SSA benefits and a similar share understood the relationship between work and medical coverage.
73
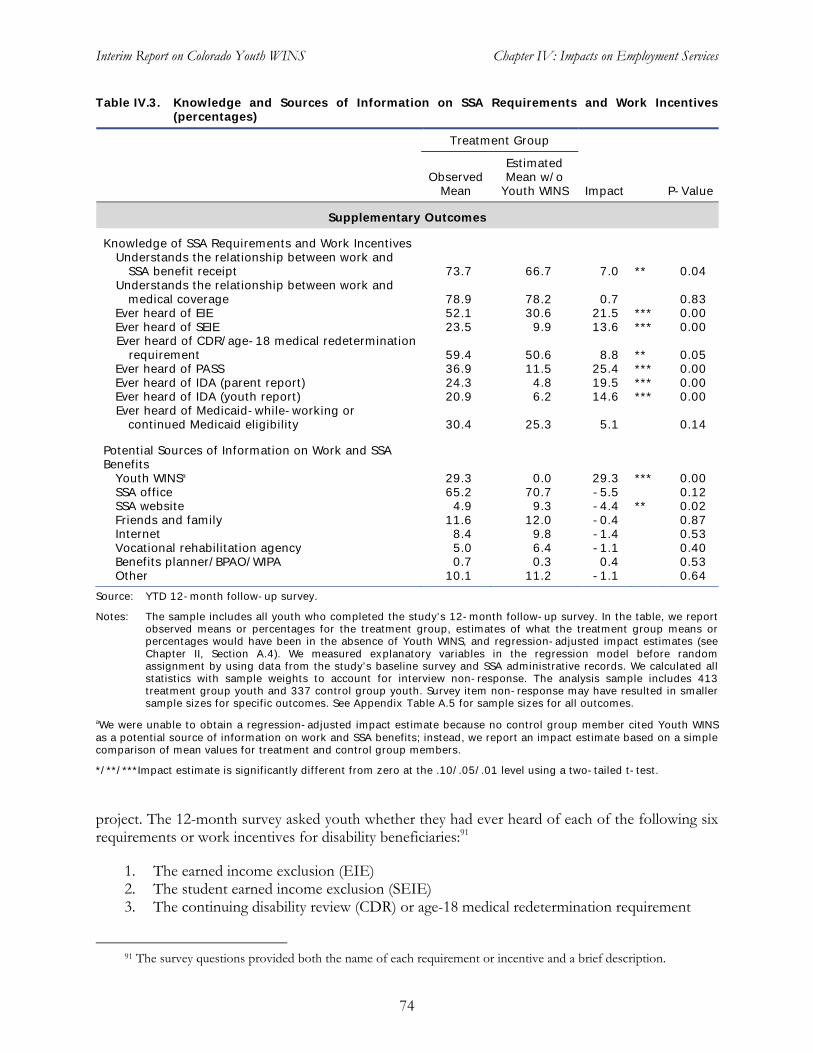
Interim Report on Colorado Youth WINS Chapter IV: Impacts on Employment Services
Table IV.3. Knowledge and Sources of Information on SSA Requirements and Work Incentives (percentages)
Treatment Group
Estimated Observed Mean w/o
Mean Youth WINS Impact P-Value
Supplementary Outcomes
Knowledge of SSA Requirements and Work Incentives Understands the relationship between work and
SSA benefit receipt 73.7 66.7 7.0 ** 0.04 Understands the relationship between work and
medical coverage 78.9 78.2 0.7 0.83 Ever heard of EIE 52.1 30.6 21.5 *** 0.00 Ever heard of SEIE 23.5 9.9 13.6 *** 0.00 Ever heard of CDR/age-18 medical redetermination
requirement 59.4 50.6 8.8 ** 0.05 Ever heard of PASS 36.9 11.5 25.4 *** 0.00 Ever heard of IDA (parent report) 24.3 4.8 19.5 *** 0.00 Ever heard of IDA (youth report) 20.9 6.2 14.6 *** 0.00 Ever heard of Medicaid-while-working or
continued Medicaid eligibility 30.4 25.3 5.1 0.14
Potential Sources of Information on Work and SSA Benefits
Youth WINSa 29.3 0.0 29.3 *** 0.00 SSA office 65.2 70.7 -5.5 0.12 SSA website 4.9 9.3 -4.4 ** 0.02 Friends and family 11.6 12.0 -0.4 0.87 Internet 8.4 9.8 -1.4 0.53 Vocational rehabilitation agency 5.0 6.4 -1.1 0.40 Benefits planner/BPAO/WIPA 0.7 0.3 0.4 0.53 Other 10.1 11.2 -1.1 0.64
Source: YTD 12-month follow-up survey.
Notes: The sample includes all youth who completed the study’s 12-month follow-up survey. In the table, we report observed means or percentages for the treatment group, estimates of what the treatment group means or percentages would have been in the absence of Youth WINS, and regression-adjusted impact estimates (see Chapter II, Section A.4). We measured explanatory variables in the regression model before random assignment by using data from the study’s baseline survey and SSA administrative records. We calculated all statistics with sample weights to account for interview non-response. The analysis sample includes 413treatment group youth and 337 control group youth. Survey item non-response may have resulted in smaller sample sizes for specific outcomes. See Appendix Table A.5 for sample sizes for all outcomes.
aWe were unable to obtain a regression-adjusted impact estimate because no control group member cited Youth WINSas a potential source of information on work and SSA benefits; instead, we report an impact estimate based on a simplecomparison of mean values for treatment and control group members.
*/**/***Impact estimate is significantly different from zero at the .10/.05/.01 level using a two-tailed t-test.
project. The 12-month survey asked youth whether they had ever heard of each of the following six requirements or work incentives for disability beneficiaries:91
1. The earned income exclusion (EIE) 2. The student earned income exclusion (SEIE) 3. The continuing disability review (CDR) or age-18 medical redetermination requirement
91 The survey questions provided both the name of each requirement or incentive and a brief description.
74
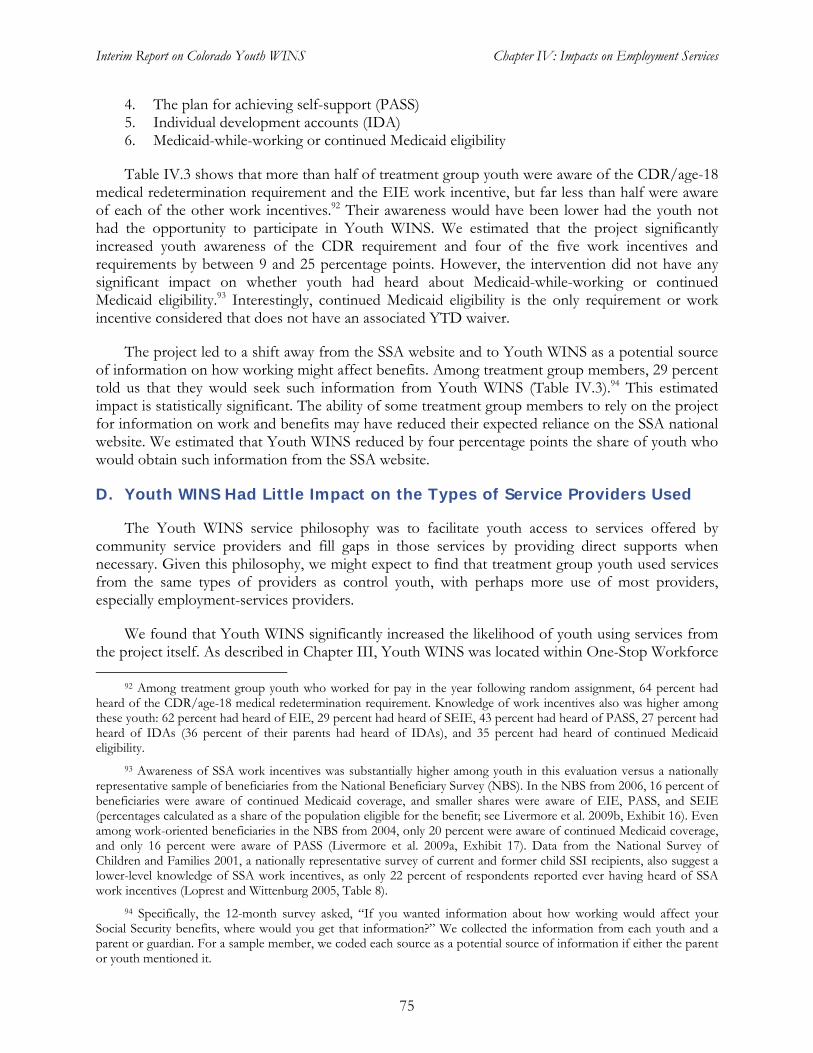
Interim Report on Colorado Youth WINS Chapter IV: Impacts on Employment Services
4. The plan for achieving self-support (PASS) 5. Individual development accounts (IDA) 6. Medicaid-while-working or continued Medicaid eligibility
Table IV.3 shows that more than half of treatment group youth were aware of the CDR/age-18 medical redetermination requirement and the EIE work incentive, but far less than half were aware of each of the other work incentives.92 Their awareness would have been lower had the youth not had the opportunity to participate in Youth WINS. We estimated that the project significantly increased youth awareness of the CDR requirement and four of the five work incentives and requirements by between 9 and 25 percentage points. However, the intervention did not have any significant impact on whether youth had heard about Medicaid-while-working or continued Medicaid eligibility.93 Interestingly, continued Medicaid eligibility is the only requirement or work incentive considered that does not have an associated YTD waiver.
The project led to a shift away from the SSA website and to Youth WINS as a potential source of information on how working might affect benefits. Among treatment group members, 29 percent told us that they would seek such information from Youth WINS (Table IV.3).94 This estimated impact is statistically significant. The ability of some treatment group members to rely on the project for information on work and benefits may have reduced their expected reliance on the SSA national website. We estimated that Youth WINS reduced by four percentage points the share of youth who would obtain such information from the SSA website.
D. Youth WINS Had Little Impact on the Types of Service Providers Used
The Youth WINS service philosophy was to facilitate youth access to services offered by community service providers and fill gaps in those services by providing direct supports when necessary. Given this philosophy, we might expect to find that treatment group youth used services from the same types of providers as control youth, with perhaps more use of most providers, especially employment-services providers.
We found that Youth WINS significantly increased the likelihood of youth using services from the project itself. As described in Chapter III, Youth WINS was located within One-Stop Workforce
92 Among treatment group youth who worked for pay in the year following random assignment, 64 percent had heard of the CDR/age-18 medical redetermination requirement. Knowledge of work incentives also was higher among these youth: 62 percent had heard of EIE, 29 percent had heard of SEIE, 43 percent had heard of PASS, 27 percent had heard of IDAs (36 percent of their parents had heard of IDAs), and 35 percent had heard of continued Medicaid eligibility.
93 Awareness of SSA work incentives was substantially higher among youth in this evaluation versus a nationally representative sample of beneficiaries from the National Beneficiary Survey (NBS). In the NBS from 2006, 16 percent of beneficiaries were aware of continued Medicaid coverage, and smaller shares were aware of EIE, PASS, and SEIE (percentages calculated as a share of the population eligible for the benefit; see Livermore et al. 2009b, Exhibit 16). Even among work-oriented beneficiaries in the NBS from 2004, only 20 percent were aware of continued Medicaid coverage, and only 16 percent were aware of PASS (Livermore et al. 2009a, Exhibit 17). Data from the National Survey of Children and Families 2001, a nationally representative survey of current and former child SSI recipients, also suggest a lower-level knowledge of SSA work incentives, as only 22 percent of respondents reported ever having heard of SSA work incentives (Loprest and Wittenburg 2005, Table 8).
94 Specifically, the 12-month survey asked, “If you wanted information about how working would affect your Social Security benefits, where would you get that information?” We collected the information from each youth and a parent or guardian. For a sample member, we coded each source as a potential source of information if either the parent or youth mentioned it.
75
Interim Report on Colorado Youth WINS Chapter IV: Impacts on Employment Services
Centers. Hence, we combined reports of the use of services from Youth WINS with those of services provided by One-Stops. We found that 41 percent of the treatment group youth reported using services from Youth WINS or One-Stops (Table IV.4). We estimated that, in the absence of the project, less than five percent of them would have used services from these sources. The 37 percentage point impact is statistically significant at the one percent level.
It is not surprising that the 41 percent of treatment group youth who reported that they had used services from Youth WINS or One-Stops is smaller than the share receiving services as recorded by project staff in ETO: 86 percent of treatment youth enrolled in Youth WINS, of whom 96 percent received project services (Chapter III, Sections D and F). These rates imply that 83 percent of treatment group youth received project services. That the share of treatment group members reporting project services in the follow-up survey is smaller than the share derived from ETO data probably is attributable to the youths’ inability to recall either (1) the services they used or (2) that Youth WINS was the provider.
Aside from One-Stops, we found small and mostly insignificant impacts of Youth WINS on the types of service providers used, such as schools or school districts, the state vocational rehabilitation agency, and other work-related service providers other than the One-Stop Workforce Centers. To some extent, this may have reflected the limited capacity of Youth WINS’ partner organizations to provide services, as was found by our process analysis. Interestingly, the only other significant impact on service use by provider type was a reduction in the use of services from SSA field offices. Less than three percent of treatment group youth reported using the services of an SSA office. We estimated that, in the absence of Youth WINS, the use of services from this source would have been modestly higher, at just over six percent. The direction of this impact most likely is a reflection of the availability of counseling on Social Security benefits for treatment group members through Youth WINS.
Many treatment and control group members reported using services from providers not categorized explicitly in Table IV.4 (that is, “all other providers”). These included such entities as churches, group homes, and community centers. Although the combined share of youth using services from these other providers was relatively high—about 20 percent for those in the treatment group—no more than 5 percent of them used services from any single provider type within this residual category. Due to the small share of youths using services from each type of other provider, we did not examine service use separately for each of them. There was no significant impact on the use of services from all other providers combined.
E. Impacts on the Use of Employment Services Did Not Vary Across Subgroups
Reasonable arguments can be advanced for why the impacts of Youth WINS on the use of employment-promoting services might have been different for some subgroups of youth than others. For example, youth age 18 or older at baseline might have been more interested in employment and so more receptive to employment services than younger youth. Similarly, youth not enrolled in school at baseline might have had more interest and time available to participate in employment services than their in-school peers. Alternatively, youth enrolled in school might have been more likely to receive school-based employment services and so less inclined to participate in employment services provided by Youth WINS. To investigate whether such differences in impacts on service use actually occurred, we estimated impacts on the primary outcome measure in the domain of employment-promoting services—use of any employment-promoting service—for subgroups of youth defined by age, school attendance, and work experience at baseline.
76
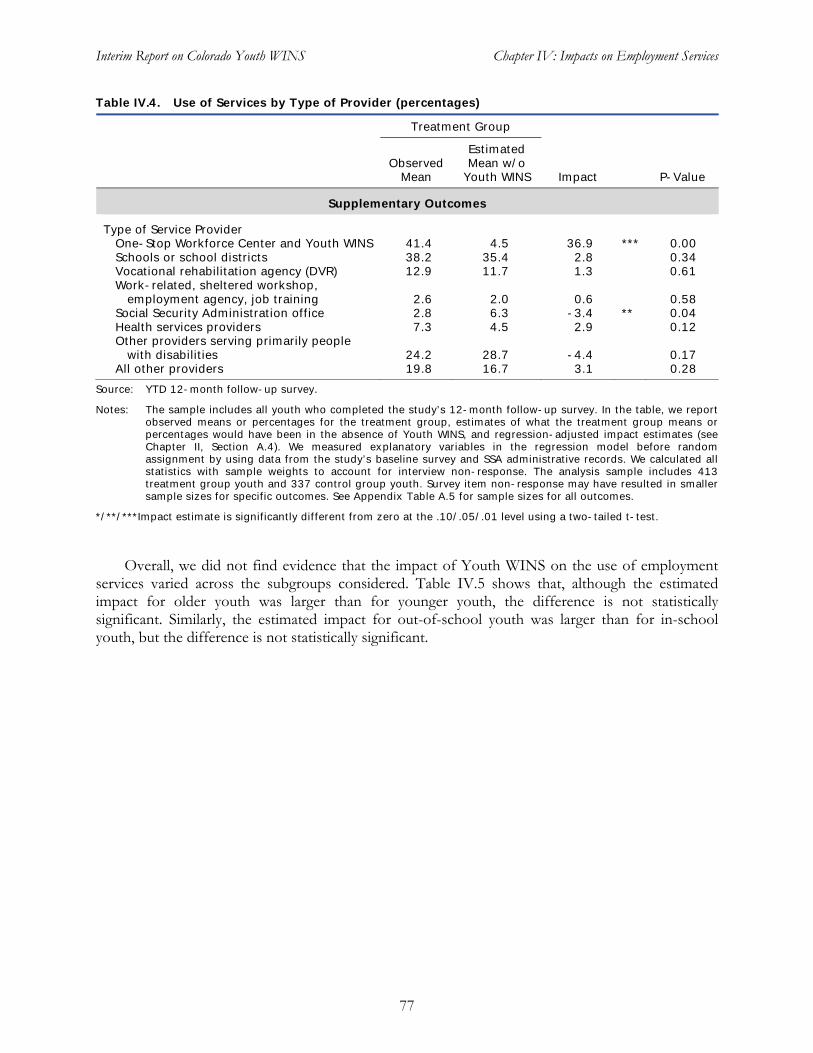
Interim Report on Colorado Youth WINS Chapter IV: Impacts on Employment Services
Table IV.4. Use of Services by Type of Provider (percentages)
Treatment Group
Estimated Observed Mean w/o
Mean Youth WINS Impact P-Value
Supplementary Outcomes
Type of Service ProviderOne-Stop Workforce Center and Youth WINS 41.4 4.5 36.9 *** 0.00 Schools or school districts 38.2 35.4 2.8 0.34 Vocational rehabilitation agency (DVR) 12.9 11.7 1.3 0.61 Work-related, sheltered workshop,
employment agency, job training 2.6 2.0 0.6 0.58 Social Security Administration office 2.8 6.3 -3.4 ** 0.04 Health services providers 7.3 4.5 2.9 0.12 Other providers serving primarily people
with disabilities 24.2 28.7 -4.4 0.17 All other providers 19.8 16.7 3.1 0.28
Source: YTD 12-month follow-up survey.
Notes: The sample includes all youth who completed the study’s 12-month follow-up survey. In the table, we report observed means or percentages for the treatment group, estimates of what the treatment group means or percentages would have been in the absence of Youth WINS, and regression-adjusted impact estimates (see Chapter II, Section A.4). We measured explanatory variables in the regression model before random assignment by using data from the study’s baseline survey and SSA administrative records. We calculated all statistics with sample weights to account for interview non-response. The analysis sample includes 413treatment group youth and 337 control group youth. Survey item non-response may have resulted in smaller sample sizes for specific outcomes. See Appendix Table A.5 for sample sizes for all outcomes.
*/**/***Impact estimate is significantly different from zero at the .10/.05/.01 level using a two-tailed t-test.
Overall, we did not find evidence that the impact of Youth WINS on the use of employment services varied across the subgroups considered. Table IV.5 shows that, although the estimated impact for older youth was larger than for younger youth, the difference is not statistically significant. Similarly, the estimated impact for out-of-school youth was larger than for in-school youth, but the difference is not statistically significant.
77
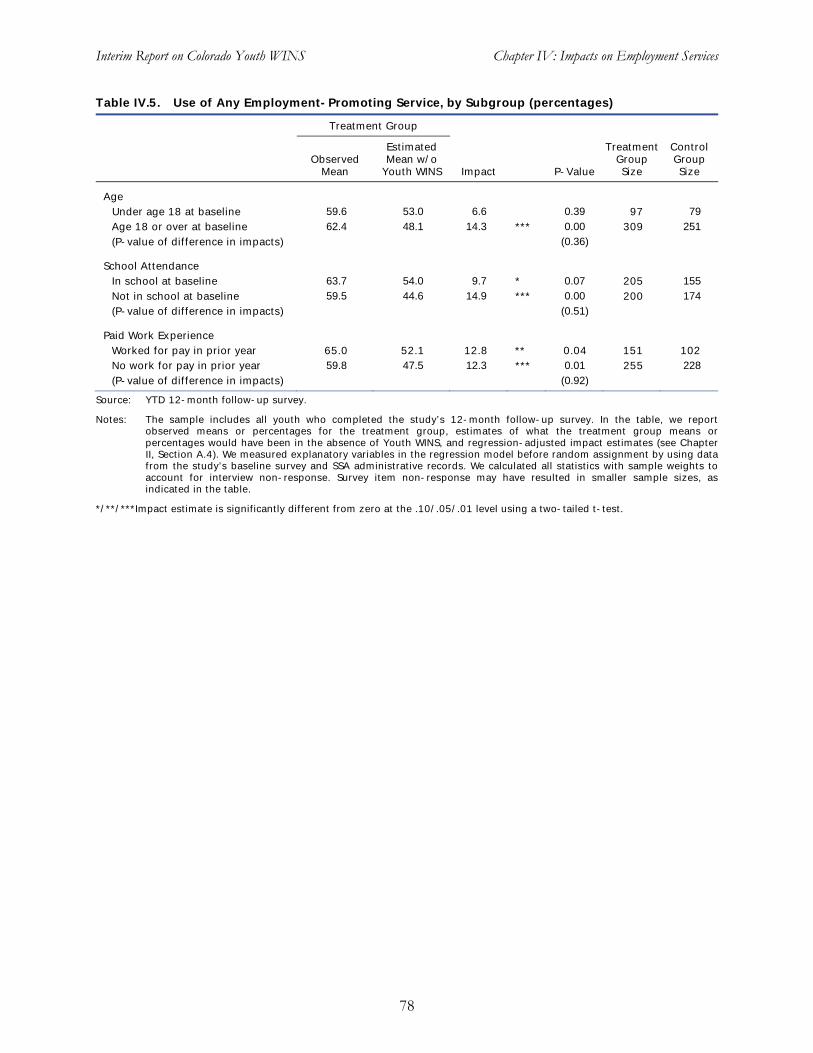
Interim Report on Colorado Youth WINS Chapter IV: Impacts on Employment Services
Table IV.5. Use of Any Employment-Promoting Service, by Subgroup (percentages)
Treatment Group
Estimated Treatment Control Observed
Mean Mean w/o
Youth WINS Impact P-Value GroupSize
GroupSize
Age
Under age 18 at baseline 59.6 53.0 6.6 0.39 97 79
Age 18 or over at baseline 62.4 48.1 14.3 *** 0.00 309 251
(P-value of difference in impacts) (0.36)
School Attendance In school at baseline 63.7 54.0 9.7 * 0.07 205 155
Not in school at baseline 59.5 44.6 14.9 *** 0.00 200 174
(P-value of difference in impacts) (0.51)
Paid Work Experience
Worked for pay in prior year 65.0 52.1 12.8 ** 0.04 151 102
No work for pay in prior year 59.8 47.5 12.3 *** 0.01 255 228
(P-value of difference in impacts) (0.92)
Source: YTD 12-month follow-up survey.
Notes: The sample includes all youth who completed the study’s 12-month follow-up survey. In the table, we report observed means or percentages for the treatment group, estimates of what the treatment group means or percentages would have been in the absence of Youth WINS, and regression-adjusted impact estimates (see ChapterII, Section A.4). We measured explanatory variables in the regression model before random assignment by using data from the study’s baseline survey and SSA administrative records. We calculated all statistics with sample weights toaccount for interview non-response. Survey item non-response may have resulted in smaller sample sizes, as indicated in the table.
*/**/***Impact estimate is significantly different from zero at the .10/.05/.01 level using a two-tailed t-test.
78
Interim Report on Colorado Youth WINS Chapter V: Impacts on Employment and Earnings
V. IMPACTS ON EMPLOYMENT AND EARNINGS
The YTD initiative sought to improve independence and self-sufficiency among youth receiving, or at risk of receiving, SSA disability benefits by providing intensive services, including employment services, and waiving certain disability program rules. Although employment services were a core component of the initiative, the Youth WINS project followed an intensive case management model, with limited emphasis on employment. Nevertheless, Youth WINS still sought to achieve improvements in the same set of outcomes conceptualized for the YTD initiative, including increased work-related experiences, more paid employment, and greater earnings from employment for youth. In this chapter, we examine the short-term impacts of Youth WINS on employment, earnings, and job characteristics.
We found that Youth WINS did not have impacts on employment (either paid or unpaid) or earnings during the year after youth enrolled in the evaluation. These results may have been due to the lack of emphasis on employment by Youth WINS, as documented by the process analysis (Chapter III). Furthermore, as we reported in the previous chapter, while Youth WINS did increase participation in employment services, broadly defined, it had no impacts on services most directly related to employment, such as assistance with resume writing and job search activities. In light of Youth WINS’ limited emphasis on direct employment services, the lack of impacts on employment and earnings in the year following random assignment is not surprising. Future analyses under this evaluation may find employment-related impacts of the project that emerge in later years.
A. No Impact of Youth WINS on Employment
Maximizing self-sufficiency through work was a central goal of the YTD interventions; consequently, we identified employment as a key domain for the analysis of the short-term impacts of Youth WINS and the other YTD projects. The primary outcome in this domain is the share of youth who were ever employed in a paid job during the year after random assignment. This measure is preferred to a measure of the intensity of employment, such as the number of weeks worked during the year, because approximately two-thirds of the youth in the evaluation were ages 21 and younger and would not have been expected to work intensely over the course of the year. We constructed the primary outcome measure based on youth reports of paid employment during the period between random assignment and the 12-month follow-up interview.
Youth WINS had no significant impact on the share of youth with paid employment during the year following random assignment. About 34 percent of the treatment group youth were ever employed in a paid job during the follow-up period (Table V.1). In the absence of Youth WINS, we estimated that 33 percent of the youth would have ever been employed in a paid job. The estimated impact of about one percentage point is not statistically significant.
To enhance our understanding of the finding of no impact on the primary employment outcome, we conducted supplementary analysis of other employment-related outcomes. Table V.1 presents the estimated impacts on these outcomes, including the prevalence of employment in any (paid or unpaid) job and in solely unpaid jobs. Similar to what we found for paid jobs, Youth WINS had no impact on the share of youth employed in any job. Although 40 percent of treatment group youth were ever employed in any job during the year following random assignment, about two percentage points more than they would have been in the absence of the intervention, the difference is not statistically significant. The prevalence of employment in unpaid jobs was low; only six
79
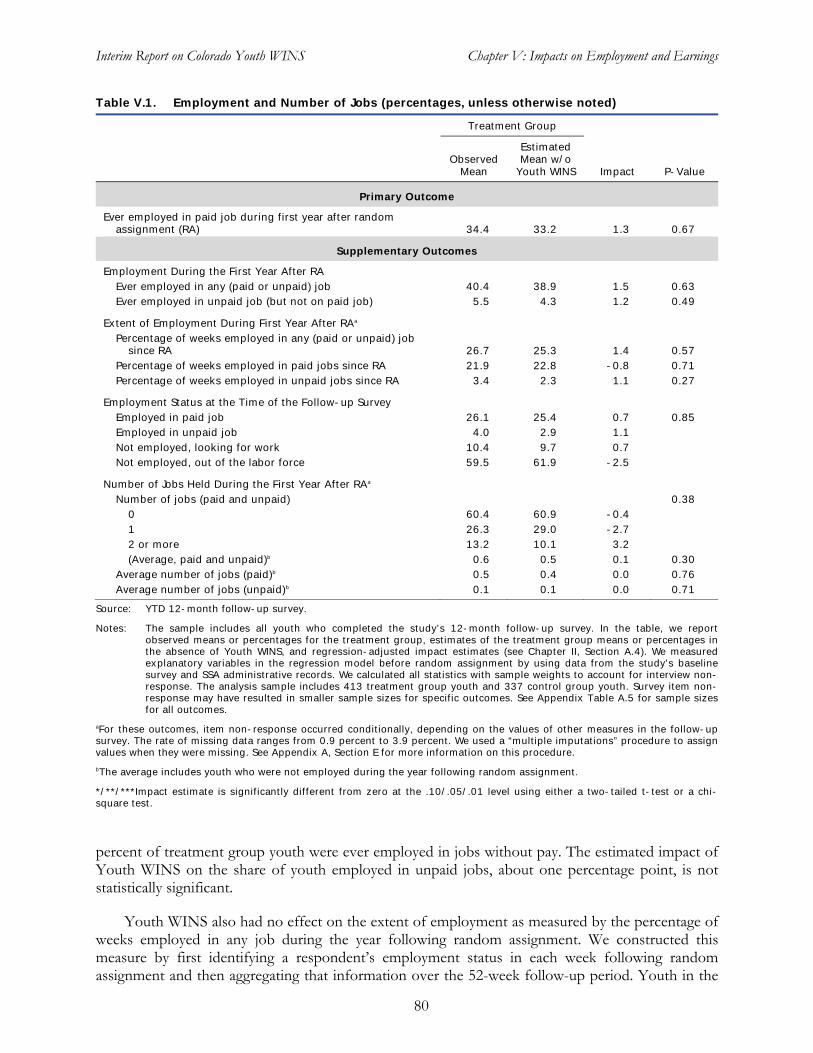
Interim Report on Colorado Youth WINS Chapter V: Impacts on Employment and Earnings
Table V.1. Employment and Number of Jobs (percentages, unless otherwise noted)
Treatment Group
Estimated Observed Mean w/o
Mean Youth WINS Impact P-Value
Primary Outcome
Ever employed in paid job during first year after randomassignment (RA) 34.4 33.2 1.3 0.67
Supplementary Outcomes
Employment During the First Year After RA
Ever employed in any (paid or unpaid) job 40.4 38.9 1.5 0.63
Ever employed in unpaid job (but not on paid job) 5.5 4.3 1.2 0.49
Extent of Employment During First Year After RAa
Percentage of weeks employed in any (paid or unpaid) jobsince RA 26.7 25.3 1.4 0.57
Percentage of weeks employed in paid jobs since RA 21.9 22.8 -0.8 0.71 Percentage of weeks employed in unpaid jobs since RA 3.4 2.3 1.1 0.27
Employment Status at the Time of the Follow-up Survey Employed in paid job 26.1 25.4 0.7 0.85
Employed in unpaid job 4.0 2.9 1.1
Not employed, looking for work 10.4 9.7 0.7
Not employed, out of the labor force 59.5 61.9 -2.5
Number of Jobs Held During the First Year After RAa
Number of jobs (paid and unpaid) 0.38 0 60.4 60.9 -0.4 1 26.3 29.0 -2.7 2 or more 13.2 10.1 3.2 (Average, paid and unpaid)b 0.6 0.5 0.1 0.30
Average number of jobs (paid)b 0.5 0.4 0.0 0.76
Average number of jobs (unpaid)b 0.1 0.1 0.0 0.71
Source: YTD 12-month follow-up survey.
Notes: The sample includes all youth who completed the study’s 12-month follow-up survey. In the table, we report observed means or percentages for the treatment group, estimates of the treatment group means or percentages in the absence of Youth WINS, and regression-adjusted impact estimates (see Chapter II, Section A.4). We measuredexplanatory variables in the regression model before random assignment by using data from the study’s baselinesurvey and SSA administrative records. We calculated all statistics with sample weights to account for interview non-response. The analysis sample includes 413 treatment group youth and 337 control group youth. Survey item non-response may have resulted in smaller sample sizes for specific outcomes. See Appendix Table A.5 for sample sizesfor all outcomes.
aFor these outcomes, item non-response occurred conditionally, depending on the values of other measures in the follow-upsurvey. The rate of missing data ranges from 0.9 percent to 3.9 percent. We used a “multiple imputations” procedure to assignvalues when they were missing. See Appendix A, Section E for more information on this procedure.
bThe average includes youth who were not employed during the year following random assignment.
*/**/***Impact estimate is significantly different from zero at the .10/.05/.01 level using either a two-tailed t-test or a chi-square test.
percent of treatment group youth were ever employed in jobs without pay. The estimated impact of Youth WINS on the share of youth employed in unpaid jobs, about one percentage point, is not statistically significant.
Youth WINS also had no effect on the extent of employment as measured by the percentage of weeks employed in any job during the year following random assignment. We constructed this measure by first identifying a respondent’s employment status in each week following random assignment and then aggregating that information over the 52-week follow-up period. Youth in the
80
Interim Report on Colorado Youth WINS Chapter V: Impacts on Employment and Earnings
treatment group were employed in any job (paid or unpaid) for about 27 percent (about three months) of the 52 weeks following random assignment. In the absence of Youth WINS, they would have been employed for 25 percent of the follow-up period. The estimated impact of about one percentage point is not statistically significant. The project also had no significant impact on the extent of either paid employment only or unpaid employment only.
In addition, Youth WINS had no effects on employment status at the time of the follow-up survey or on the number of jobs held since random assignment. Youth could have been in any one of four employment statuses when they completed the survey: employed in a paid job; employed in an unpaid job only (no paid employment); not employed but in the labor force (that is, actively looking for work); and not employed and out of the labor force. To identify the impact of the project, we conducted a test of the difference between the observed distribution of treatment group youth across these employment statuses and our estimate of what that distribution would have been in the absence of the project. The results in Table V.1 show no significant evidence that the project had an effect on employment status at the time of the follow-up survey. The results in the table also show that Youth WINS had no statistically significant impacts on the number of jobs held by youth during the follow-up period.
Youth WINS also had no impacts on monthly employment outcomes following random assignment. We used youth reports from the 12-month follow-up survey on the starting and ending dates of each job to construct monthly measures of employment. Figure V.1 presents the rates of employment for youth in any job and in paid jobs only for each month during the year following random assignment.95 The figure shows the observed employment rates for treatment group members and our estimates of what the rates would have been if they had not had the opportunity to participate in the project. In the figure, the vertical difference between the two plotted employment rates for any month is a graphical representation of the estimated impact. Although the monthly rates of employment in paid or unpaid jobs and in paid jobs only for treatment group youth increased over time, the estimated impacts are not significant for any of the months following random assignment. This means that the treatment group youth would have experienced similar employment rates even in the absence of Youth WINS.
Figure V.2 displays the proportion of youth who had ever been employed since random assignment for each month during the year following random assignment.96 Similar to employment status by month, the cumulative employment rate in paid and unpaid jobs combined and in paid jobs only increased over time for treatment group youth, but the impacts of Youth WINS were not significant for any of the months, suggesting that the intervention did not succeed in changing the trajectory of employment for treatment group youth during the follow-up period.
95 We interviewed a small proportion of the analysis sample before the end of the 12th month following random assignment; consequently, employment outcomes measured for month 12 may reflect some underlying censoring in the data. Because there are no significant treatment-control differences in the timing of responses to the 12-month follow-up survey, we do not anticipate any bias in the estimated impacts for month 12.
96 The cumulative employment rate for paid or unpaid jobs in the 12th month following random assignment for treatment group members in Figure V.2 (39.6 percent) does not equal the percentage of those youth employed on any paid or unpaid job during the year following random assignment in Table V.1 (40.4 percent). This deviation is a result of our use of the “multiple imputations” procedure in Stata to assign employment status by month to youth who reported in the follow-up survey that they had worked but did not report the start and/or end dates for their jobs. This procedure imputed a status of not employed to a handful of these youth.
81
0.0
5.0
10.0
15.0
20.0
25.0
30.0
35.0
1 2 3 4 5 6 7 8 9 10 11 12
Percentage Employed
Month After Random Assignment
Employment in Paid or Unpaid Jobs
0.0
5.0
10.0
15.0
20.0
25.0
30.0
35.0
1 2 3 4 5 6 7 8 9 10 11 12
Percentage Employed
Month After Random Assignment
Employment in Paid Jobs Only
Interim Report on Colorado Youth WINS Chapter V: Impacts on Employment and Earnings
Figure V.1. Employment Rate by Month Following Random Assignment
Treatment Group Treatment Group w/o Youth WINS
Source: YTD 12-month follow-up survey.
Notes: The sample includes all youth who completed the study’s 12-month follow-up survey. In these figures, we present observed percentages for the treatment group and estimates of what the treatment group percentages would have been in the absence of Youth WINS. We measured explanatory variables in the regression model prior to random assignment by using data from the study’s baseline survey and SSA administrative records. We calculated all statistics with sample weights to account for interview non-response.
For all outcomes in this figure, item non-response occurred conditionally, depending on the values of other measures in the follow-up survey. The rate of missing data ranges from 2.3 percent to 3.2 percent. We used a “multiple imputations” procedure to assign values when they were missing. See Appendix A, Section E for more information on this procedure.
None of the impact estimates shown in the figures are significantly different from zero at the .10 level.
B. No Impacts of Youth WINS on Hours of Work or Earnings
Given the absence of impacts of Youth WINS on employment during the year following random assignment, it is not surprising that the intervention also had no impacts on hours of work or earnings. To support supplementary analyses in the employment domain, we constructed a number of different measures of hours of work and earned income. As discussed in this section, we found no impacts on any of these measures.
We estimated the impact of the project on total hours of work in any (paid and unpaid) job and paid jobs only during the year following random assignment. On average, youth in the treatment group were employed for a total of 248 hours in paid or unpaid jobs and 218 hours in paid jobs only (Table V.2). We found no significant impact of Youth WINS on these measures of average hours, indicating that those youth would have worked about the same number of hours even if they had not had the opportunity to participate in the project. To better understand this finding, we investigated the impact on the distribution of total hours. We found that Youth WINS had no statistically significant impact on the distribution of total hours of work in paid and unpaid jobs (combined). Our estimates show similar results for the distribution of total hours of work in paid jobs only.
82
0.0
5.0
10.0
15.0
20.0
25.0
30.0
35.0
40.0
45.0
1 2 3 4 5 6 7 8 9 10 11 12
Percentage Ever Employed
Month After Random Assignment
Employment in Paid or Unpaid Jobs
0.0
5.0
10.0
15.0
20.0
25.0
30.0
35.0
40.0
45.0
1 2 3 4 5 6 7 8 9 10 11 12
Percentage Ever Employed
Month After Random Assignment
Employment in Paid Jobs Only
Interim Report on Colorado Youth WINS Chapter V: Impacts on Employment and Earnings
Figure V.2. Cumulative Employment Rate by Month Following Random Assignment
Treatment Group Treatment Group w/o Youth WINS
Source: YTD 12-month follow-up survey.
Notes: The sample includes all youth who completed the study’s 12-month follow-up survey. In these figures, we present observed percentages for the treatment group and estimates of what the treatment group percentages would have been in the absence of Youth WINS. We measured explanatory variables in the regression model prior to random assignment by using data from the study’s baseline survey and SSA administrative records. We calculated all statistics with sample weights to account for interview non-response.
For all outcomes in this figure, item non-response occurred conditionally, depending on the values of other measures in the follow-up survey. The rate of missing data ranges from 1.9 percent to 2.8 percent. We used a “multiple imputations” procedure to assign values when they were missing. See Appendix A, Section E for more information on this procedure.
None of the impact estimates shown in the figures are significantly different from zero at the .10 level.
We also estimated the impacts of the intervention on average hours worked per week for each month during the year following random assignment. Among treatment group youth, the average hours worked per week in paid and unpaid jobs combined ranged between 4.1 and 5.2 hours during the year (Figure V.3). The average is low because we include non-workers (with zero hours) and most youth were not working during these months (Figure V.1). We estimated that in the absence of Youth WINS, the average hours worked per week in each of the months would not have been significantly different. In light of the small amount of unpaid employment (discussed in the previous section), it is not surprising that the monthly pattern of average hours worked per week is essentially the same for paid jobs only as for paid and unpaid jobs combined, and Youth WINS also had no statistically significant impact on the average hours worked in paid jobs only for any of the months during the years following random assignment.
83
Interim Report on Colorado Youth WINS Chapter V: Impacts on Employment and Earnings
Table V.2. Total Hours Worked (percentages, unless otherwise noted)
Treatment Group
Estimated Observed Mean w/o
Mean Youth WINS Impact P-Value
Supplementary Outcomes
Total Hours Worked in All Jobs During First Year After Random Assignment
Total Hours Worked in Paid or Unpaid Jobs 0.92 Not employed 59.6 61.6 -2.0 >0 to 260 hours 13.9 13.2 0.6 >260 to 1,040 hours 16.7 16.3 0.5 >1,040 hours 9.8 8.9 0.9 (Average total hours all jobs)a 247.5 246.0 1.5 0.96
Total Hours Worked in Paid Jobs 0.89 No paid employment 65.1 66.5 -1.4 >0 to 260 hours 11.4 9.7 1.7 >260 to 1,040 hours 15.0 14.9 0.1 >1,040 hours 8.6 8.8 -0.3 (Average total hours in paid jobs)a 217.7 235.0 -17.3 0.57
Source: YTD 12-month follow-up survey.
Notes: The sample includes all youth who completed the study’s 12-month follow-up survey. In the table, we report observed means or percentages for the treatment group, estimates of the treatment group means orpercentages in the absence of Youth WINS, and regression-adjusted impact estimates. We measured explanatory variables in the regression model before random assignment by using data from the study’sbaseline survey and SSA administrative records. We calculated all statistics with sample weights to account forinterview non-response. The analysis sample includes 413 treatment group youth and 337 control group youth. Survey item non-response may have resulted in smaller sample sizes for specific outcomes. See Appendix Table A.5 for sample sizes for all outcomes.
260 and 1,040 hours per year correspond, respectively, to 5 and 20 hours per week for 52 weeks.
For all outcomes in this table, item non-response occurred conditionally, depending on the values of other measures in the follow-up survey. The rate of missing data ranges from 3.9 percent to 4.0 percent. We used a “multiple imputations” procedure to assign values when they were missing. See Appendix A, Section E formore information on this procedure.
aThe average includes youth who were not employed during the year following random assignment.
*/**/***Impact estimate is significantly different from zero at the .10/.05/.01 level using either a two-tailed t-test or achi-square test.
We estimated that Youth WINS had no impact on annual earnings from employment during the year following random assignment (Table V.3). Combining youth reports of their hours and wage rates on each paid job during the follow-up period, we calculated their earnings for the entire year.97 On average, youth in the treatment group had earnings of $1,574 during the year following random assignment, which was $274 less than our estimate of what their earnings would have been absent the intervention; however, the impact is not statistically significant. Furthermore, there is no statistically significant impact on the distribution of yearly earnings.
97 We adjusted the earnings measures for inflation using the consumer price index for urban wage earners and clerical workers (CPI-W) created by the U.S. Bureau of Labor Statistics (BLS). We chose this index because SSA uses it to adjust benefits. The earnings measures thus represent real earnings in 2008 dollars. For the yearly measure of earnings, we used the annual average of the CPI-W (as is the convention for SSA and BLS). For the monthly measures of earnings, we used the monthly CPI-W (not seasonally adjusted).
84
0.0
1.0
2.0
3.0
4.0
5.0
6.0
1 2 3 4 5 6 7 8 9 10 11 12
Avg. H
ours Employed per W
eek
Month After Random Assignment
Weekly Hours in Paid or Unpaid Jobs
0.0
1.0
2.0
3.0
4.0
5.0
6.0
1 2 3 4 5 6 7 8 9 10 11 12
Avg. H
ours Em
ployed per W
eek
Month After Random Assignment
Weekly Hours in Paid Jobs Only
Interim Report on Colorado Youth WINS Chapter V: Impacts on Employment and Earnings
Figure V.3. Average Hours Worked per Week by Month Following Random Assignment
Treatment Group Treatment Group w/o Youth WINS
Source: YTD 12-month follow-up survey.
Notes: The sample includes all youth who completed the study’s 12-month follow-up survey. In these figures, we present observed means for the treatment group and estimates of what the treatment group means would have been in the absence of Youth WINS. We measured explanatory variables in the regression model prior to random assignment by using data from the study’s baseline survey and SSA administrative records. We calculated all statistics using sample weights to account for interview non-response.
For all outcomes in this figure, item non-response occurred conditionally, depending on the values of other measures in the follow-up survey. The rate of missing data ranges from 3.9 percent to 4.0 percent. We used a “multiple imputations” procedure to assign values when they were missing. See Appendix A, Section E for more information on this procedure.
None of the impact estimates shown in the figures are significantly different from zero at the .10 level.
Youth WINS also had no impact on earnings per month worked. We estimated that the average earnings per month worked by treatment group members ($196) was not statistically significantly different than it would have been without Youth WINS (Table V.3). The intervention thus had no impact on this outcome measure.98 The intervention also had no impact on the distribution of earnings per month worked.
Figure V.4 presents the estimated average monthly earnings and average cumulative earnings for each month during the year following random assignment. We found that Youth WINS had no impacts on these measures in any month. The timelines in Figure V.4 show that the average monthly earnings and cumulative earnings by month for treatment group members were similar to what they would have been in the absence of the intervention.
98 Youth not employed in a paid job during the one-year period following random assignment had zero earnings per month worked. On average, treatment group youth employed in a paid job during the follow-up period worked slightly more than seven months and earned $573 per month worked.
85
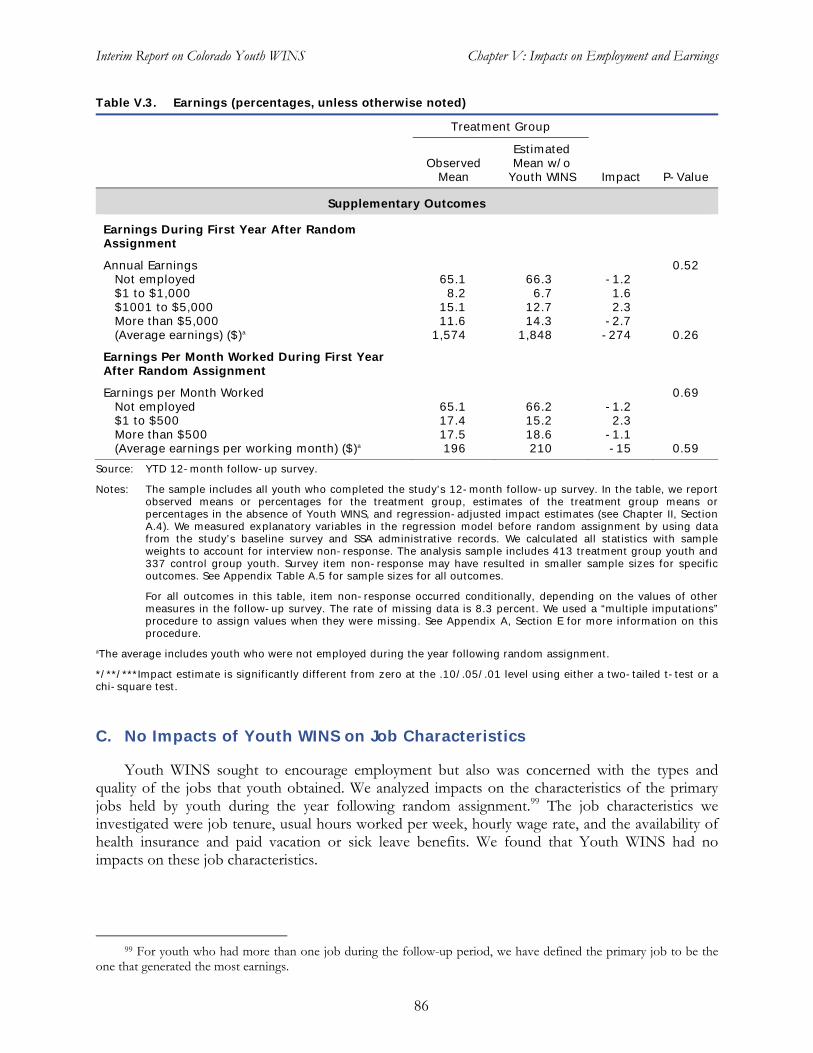
Interim Report on Colorado Youth WINS Chapter V: Impacts on Employment and Earnings
Table V.3. Earnings (percentages, unless otherwise noted)
Treatment Group
Estimated Observed Mean w/o
Supplementary Outcomes
Mean Youth WINS Impact P-Value
Earnings During First Year After Random Assignment
Annual Earnings 0.52 Not employed 65.1 66.3 -1.2 $1 to $1,000 8.2 6.7 1.6 $1001 to $5,000 15.1 12.7 2.3 More than $5,000 11.6 14.3 -2.7 (Average earnings) ($)a 1,574 1,848 -274 0.26
Earnings Per Month Worked During First YearAfter Random Assignment
Earnings per Month Worked 0.69 Not employed 65.1 66.2 -1.2 $1 to $500 17.4 15.2 2.3 More than $500 17.5 18.6 -1.1 (Average earnings per working month) ($)a 196 210 -15 0.59
Source: YTD 12-month follow-up survey.
Notes: The sample includes all youth who completed the study’s 12-month follow-up survey. In the table, we report observed means or percentages for the treatment group, estimates of the treatment group means orpercentages in the absence of Youth WINS, and regression-adjusted impact estimates (see Chapter II, SectionA.4). We measured explanatory variables in the regression model before random assignment by using datafrom the study’s baseline survey and SSA administrative records. We calculated all statistics with sampleweights to account for interview non-response. The analysis sample includes 413 treatment group youth and 337 control group youth. Survey item non-response may have resulted in smaller sample sizes for specificoutcomes. See Appendix Table A.5 for sample sizes for all outcomes.
For all outcomes in this table, item non-response occurred conditionally, depending on the values of other measures in the follow-up survey. The rate of missing data is 8.3 percent. We used a “multiple imputations”procedure to assign values when they were missing. See Appendix A, Section E for more information on thisprocedure.
aThe average includes youth who were not employed during the year following random assignment.
*/**/***Impact estimate is significantly different from zero at the .10/.05/.01 level using either a two-tailed t-test or achi-square test.
C. No Impacts of Youth WINS on Job Characteristics
Youth WINS sought to encourage employment but also was concerned with the types and quality of the jobs that youth obtained. We analyzed impacts on the characteristics of the primary jobs held by youth during the year following random assignment.99 The job characteristics we investigated were job tenure, usual hours worked per week, hourly wage rate, and the availability of health insurance and paid vacation or sick leave benefits. We found that Youth WINS had no impacts on these job characteristics.
99 For youth who had more than one job during the follow-up period, we have defined the primary job to be the one that generated the most earnings.
86
0
25
50
75
100
125
150
175
1 2 3 4 5 6 7 8 9 10 11 12
Dollars
Month After Random Assignment
Average Monthly Earnings
0
200
400
600
800
1000
1200
1400
1600
1800
1 2 3 4 5 6 7 8 9 10 11 12
Dollars
Month After Random Assignment
Average Cumulative Earnings
Interim Report on Colorado Youth WINS Chapter V: Impacts on Employment and Earnings
Figure V.4. Earnings by Month Following Random Assignment
Treatment Group Treatment Group w/o Youth WINS
Source: YTD 12-month follow-up survey.
Notes: The sample includes all youth who completed the study’s 12-month follow-up survey. In these figures, we present observed means for the treatment group and estimates of what the treatment group means would have been in the absence of Youth WINS. We measured explanatory variables in the regression model prior to random assignment by using data from the study’s baseline survey and SSA administrative records. We calculated all statistics using sample weights to account for interview non-response.
For all outcomes in this figure, item non-response occurred conditionally, depending on the values of other measures in the follow-up survey. The rate of missing data ranges from 6.1 percent to 7.5 percent. We used a “multiple imputations” procedure to assign values when they were missing. See Appendix A, Section E for more information on this procedure.
Earnings are measured in 2008 dollars.
None of the impact estimates shown in the figure are significantly different from zero at the 10 percent level.
We defined the measures of job characteristics in a manner that allowed us to retain all sample members in the analysis, regardless of whether they had been employed during the follow-up period.100 This maintained the integrity of the evaluation’s experimental design and allowed us to generate reliable estimates of whether the intervention resulted in better jobs for treatment group youth.
We found no impacts of Youth WINS on any of the job characteristics we examined. As shown in Table V.4, the average tenure in the primary job for youth in the treatment group was 2.5 months (all averages include values of zero for youth who did not work). We estimated that the average tenure would have been the same even if the youth had not had the opportunity to participate in the project; likewise for the distribution of tenure. Our estimates also show that Youth WINS had no significant impacts on usual hours worked per week, the hourly wage rate, or the availability of health insurance and paid vacation or sick leave benefits on the primary job.
100 Job characteristics are observed only for youth who were ever employed during the year following random assignment. Since employed youth are a self-selected group, comparing the job characteristics of employed treatment group youth with those of employed control group youth would not provide an unbiased estimate of impacts of Youth WINS on job characteristics. Hence, to estimate impacts on job characteristics reliably, the analysis must maintain the experimental nature of the evaluation sample by using measures of job characteristics defined to include youth who were never employed as well as those who were ever employed.
87
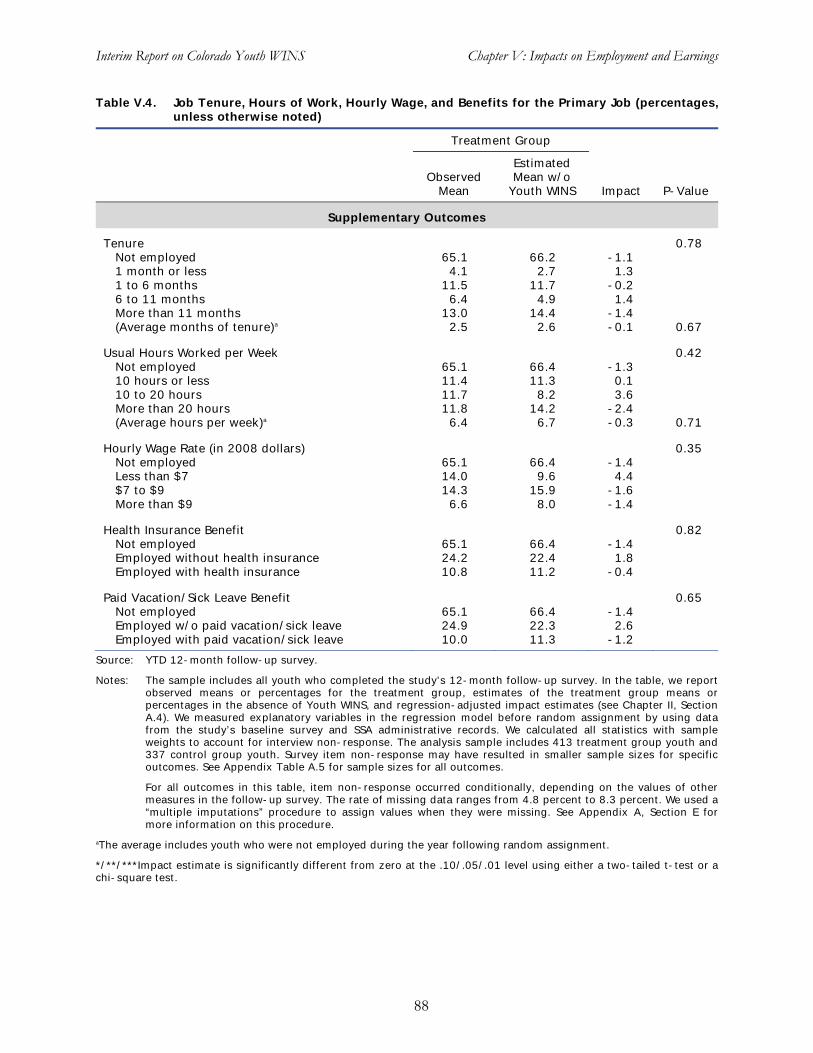
Interim Report on Colorado Youth WINS Chapter V: Impacts on Employment and Earnings
Table V.4. Job Tenure, Hours of Work, Hourly Wage, and Benefits for the Primary Job (percentages, unless otherwise noted)
Treatment Group
Estimated Observed Mean w/o
Mean Youth WINS Impact P-Value
Supplementary Outcomes
Tenure 0.78 Not employed 65.1 66.2 -1.1 1 month or less 4.1 2.7 1.3 1 to 6 months 11.5 11.7 -0.2 6 to 11 months 6.4 4.9 1.4 More than 11 months 13.0 14.4 -1.4 (Average months of tenure)a 2.5 2.6 -0.1 0.67
Usual Hours Worked per Week 0.42 Not employed 65.1 66.4 -1.3 10 hours or less 11.4 11.3 0.1 10 to 20 hours 11.7 8.2 3.6 More than 20 hours 11.8 14.2 -2.4 (Average hours per week)a 6.4 6.7 -0.3 0.71
Hourly Wage Rate (in 2008 dollars) 0.35 Not employed 65.1 66.4 -1.4 Less than $7 14.0 9.6 4.4 $7 to $9 14.3 15.9 -1.6 More than $9 6.6 8.0 -1.4
Health Insurance Benefit 0.82 Not employed 65.1 66.4 -1.4 Employed without health insurance 24.2 22.4 1.8 Employed with health insurance 10.8 11.2 -0.4
Paid Vacation/Sick Leave Benefit 0.65 Not employed 65.1 66.4 -1.4 Employed w/o paid vacation/sick leave 24.9 22.3 2.6 Employed with paid vacation/sick leave 10.0 11.3 -1.2
Source: YTD 12-month follow-up survey.
Notes: The sample includes all youth who completed the study’s 12-month follow-up survey. In the table, we report observed means or percentages for the treatment group, estimates of the treatment group means orpercentages in the absence of Youth WINS, and regression-adjusted impact estimates (see Chapter II, SectionA.4). We measured explanatory variables in the regression model before random assignment by using datafrom the study’s baseline survey and SSA administrative records. We calculated all statistics with sampleweights to account for interview non-response. The analysis sample includes 413 treatment group youth and 337 control group youth. Survey item non-response may have resulted in smaller sample sizes for specificoutcomes. See Appendix Table A.5 for sample sizes for all outcomes.
For all outcomes in this table, item non-response occurred conditionally, depending on the values of other measures in the follow-up survey. The rate of missing data ranges from 4.8 percent to 8.3 percent. We used a “multiple imputations” procedure to assign values when they were missing. See Appendix A, Section E formore information on this procedure.
aThe average includes youth who were not employed during the year following random assignment.
*/**/***Impact estimate is significantly different from zero at the .10/.05/.01 level using either a two-tailed t-test or achi-square test.
88
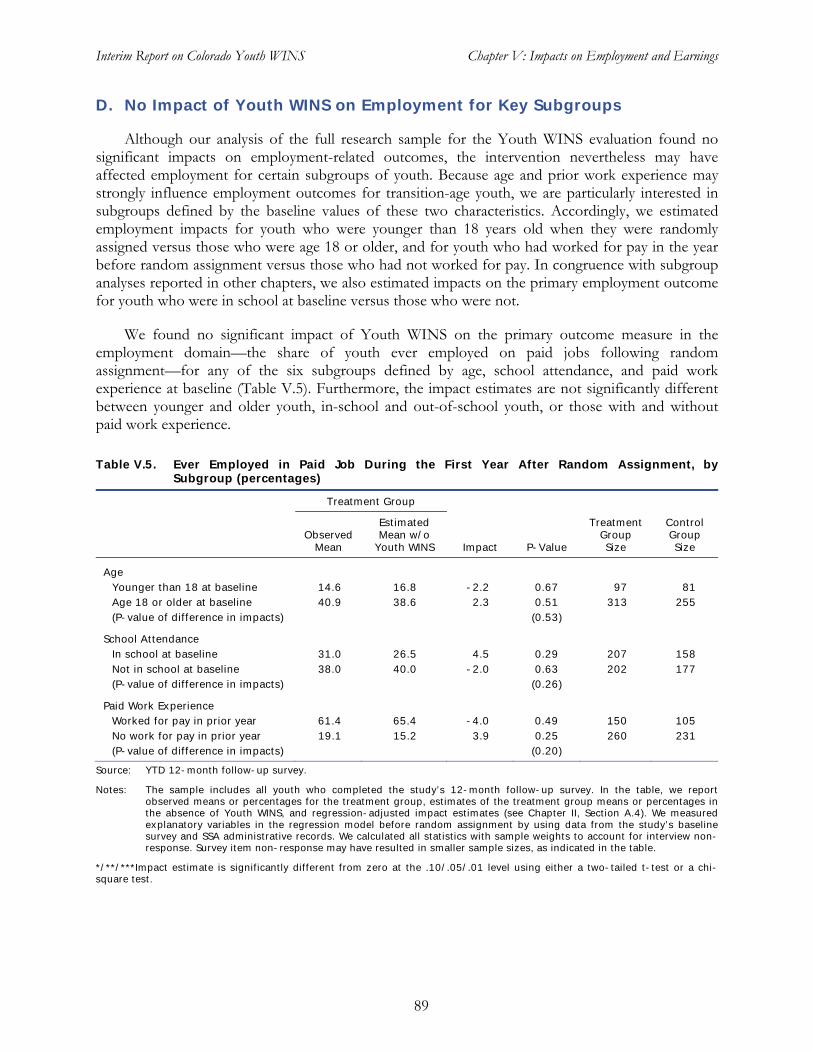
Interim Report on Colorado Youth WINS Chapter V: Impacts on Employment and Earnings
D. No Impact of Youth WINS on Employment for Key Subgroups
Although our analysis of the full research sample for the Youth WINS evaluation found no significant impacts on employment-related outcomes, the intervention nevertheless may have affected employment for certain subgroups of youth. Because age and prior work experience may strongly influence employment outcomes for transition-age youth, we are particularly interested in subgroups defined by the baseline values of these two characteristics. Accordingly, we estimated employment impacts for youth who were younger than 18 years old when they were randomly assigned versus those who were age 18 or older, and for youth who had worked for pay in the year before random assignment versus those who had not worked for pay. In congruence with subgroup analyses reported in other chapters, we also estimated impacts on the primary employment outcome for youth who were in school at baseline versus those who were not.
We found no significant impact of Youth WINS on the primary outcome measure in the employment domain—the share of youth ever employed on paid jobs following random assignment—for any of the six subgroups defined by age, school attendance, and paid work experience at baseline (Table V.5). Furthermore, the impact estimates are not significantly different between younger and older youth, in-school and out-of-school youth, or those with and without paid work experience.
Table V.5. Ever Employed in Paid Job During the First Year After Random Assignment, bySubgroup (percentages)
Treatment Group
Estimated Treatment Control Observed
Mean Mean w/o
Youth WINS Impact P-Value GroupSize
GroupSize
Age
Younger than 18 at baseline 14.6 16.8 -2.2 0.67 97 81
Age 18 or older at baseline 40.9 38.6 2.3 0.51 313 255
(P-value of difference in impacts) (0.53)
School Attendance In school at baseline 31.0 26.5 4.5 0.29 207 158
Not in school at baseline 38.0 40.0 -2.0 0.63 202 177
(P-value of difference in impacts) (0.26)
Paid Work Experience
Worked for pay in prior year 61.4 65.4 -4.0 0.49 150 105
No work for pay in prior year 19.1 15.2 3.9 0.25 260 231
(P-value of difference in impacts) (0.20)
Source: YTD 12-month follow-up survey.
Notes: The sample includes all youth who completed the study’s 12-month follow-up survey. In the table, we report observed means or percentages for the treatment group, estimates of the treatment group means or percentages in the absence of Youth WINS, and regression-adjusted impact estimates (see Chapter II, Section A.4). We measuredexplanatory variables in the regression model before random assignment by using data from the study’s baselinesurvey and SSA administrative records. We calculated all statistics with sample weights to account for interview non-response. Survey item non-response may have resulted in smaller sample sizes, as indicated in the table.
*/**/***Impact estimate is significantly different from zero at the .10/.05/.01 level using either a two-tailed t-test or a chi-square test.
89
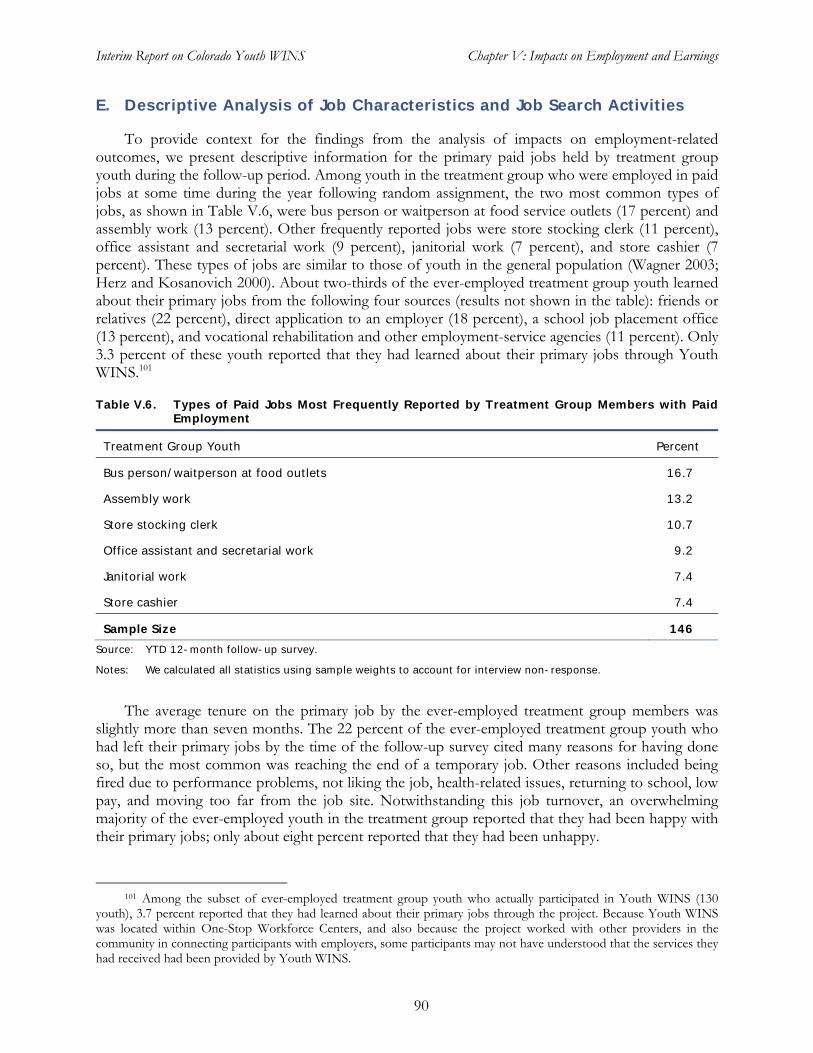
Interim Report on Colorado Youth WINS Chapter V: Impacts on Employment and Earnings
E. Descriptive Analysis of Job Characteristics and Job Search Activities
To provide context for the findings from the analysis of impacts on employment-related outcomes, we present descriptive information for the primary paid jobs held by treatment group youth during the follow-up period. Among youth in the treatment group who were employed in paid jobs at some time during the year following random assignment, the two most common types of jobs, as shown in Table V.6, were bus person or waitperson at food service outlets (17 percent) and assembly work (13 percent). Other frequently reported jobs were store stocking clerk (11 percent), office assistant and secretarial work (9 percent), janitorial work (7 percent), and store cashier (7 percent). These types of jobs are similar to those of youth in the general population (Wagner 2003; Herz and Kosanovich 2000). About two-thirds of the ever-employed treatment group youth learned about their primary jobs from the following four sources (results not shown in the table): friends or relatives (22 percent), direct application to an employer (18 percent), a school job placement office (13 percent), and vocational rehabilitation and other employment-service agencies (11 percent). Only 3.3 percent of these youth reported that they had learned about their primary jobs through Youth WINS.101
Table V.6. Types of Paid Jobs Most Frequently Reported by Treatment Group Members with Paid Employment
Treatment Group Youth Percent
Bus person/waitperson at food outlets 16.7
Assembly work 13.2
Store stocking clerk 10.7
Office assistant and secretarial work 9.2
Janitorial work 7.4
Store cashier 7.4
Sample Size 146
Source: YTD 12-month follow-up survey.
Notes: We calculated all statistics using sample weights to account for interview non-response.
The average tenure on the primary job by the ever-employed treatment group members was slightly more than seven months. The 22 percent of the ever-employed treatment group youth who had left their primary jobs by the time of the follow-up survey cited many reasons for having done so, but the most common was reaching the end of a temporary job. Other reasons included being fired due to performance problems, not liking the job, health-related issues, returning to school, low pay, and moving too far from the job site. Notwithstanding this job turnover, an overwhelming majority of the ever-employed youth in the treatment group reported that they had been happy with their primary jobs; only about eight percent reported that they had been unhappy.
101 Among the subset of ever-employed treatment group youth who actually participated in Youth WINS (130 youth), 3.7 percent reported that they had learned about their primary jobs through the project. Because Youth WINS was located within One-Stop Workforce Centers, and also because the project worked with other providers in the community in connecting participants with employers, some participants may not have understood that the services they had received had been provided by Youth WINS.
90
Interim Report on Colorado Youth WINS Chapter V: Impacts on Employment and Earnings
Among the treatment group members who did not work for pay during the year following random assignment, the three most common reasons given were health problems, inability to find the jobs they wanted, and lack of accessibility at potential workplaces. Other reasons included having had discouraging experiences when attempting to work previously, lack of reliable transportation, lack of confidence by others in their ability to work, and apprehension about losing disability benefits. These reasons for not working are very similar to those mentioned by a national cross-section of all SSA disability program beneficiaries in the 2006 National Beneficiary Survey (Livermore et al. 2009c). Among youth in the treatment group, 27 percent had not been involved in either paid employment or education/training in the year following random assignment and, of those, about 13 percent reported that they had looked for work during the four weeks preceding the interview. Those who had looked for work indicated that their search typically involved checking job advertisements in a newspaper or on the Internet, asking friends or relatives about jobs, contacting employers directly, and contacting the state vocational rehabilitation agency.
91

Interim Report on Colorado Youth WINS Chapter VI: Impacts on Education
VI. IMPACTS ON EDUCATION
Education is an investment that can improve employment opportunities and increase the potential for self-sufficiency. It is a key short-term outcome in the YTD evaluation conceptual framework (Figure I.1), and some YTD projects provided education services. Although Youth WINS did not focus on education, the project may have improved education outcomes through its support for developing and pursuing life goals and its emphasis on self-sufficiency. Some youth may have been motivated to invest in education as an important first step on the path to those objectives. Indeed, about half of youth in the Youth WINS research sample were attending school at baseline (Table II.2). Because of the importance of education for future employment and earnings and the potential for Youth WINS to have influenced education investments, we explore the intervention’s impacts on education outcomes in this chapter.
In light of the age of youth in Youth WINS and the importance of completing high school, the primary outcome in this domain is either that the youth (1) was enrolled in an educational institution at any time during the year following random assignment, or (2) had completed high school by the time of the 12-month follow-up survey (including youth who had completed high school at baseline). High school completion includes attainment of a high school diploma, GED, or certificate. We found that treatment group members were no more likely to have enrolled in school or completed high school than they would have been in the absence of Youth WINS. Examining these two outcomes separately, we found that Youth WINS did not have an impact on enrollment or completion of high school in the year following random assignment.
A. Youth WINS Did Not Improve Education Outcomes
The Youth WINS service model did not include education outcomes as explicit goals of the project. Consistent with this, Youth WINS had no impact on education outcomes. Among treatment group youth, 87 percent either were enrolled in school during the year after random assignment or had completed high school by the time of the 12-month follow-up survey (Table VI.1).102 We estimated that the share either enrolled in school or with high school complete would have been about the same in the absence of Youth WINS.
Similarly, examining these two outcomes separately, we found no impacts of Youth WINS. Among treatment group members, about half were enrolled in school at the time of the baseline survey and slightly fewer, 45 percent, were enrolled during the year following random assignment. We estimated that the share enrolled during the year would have been about the same in the absence of Youth WINS. In addition, about 45 percent of the treatment group had completed high school
102 For youth under the age of 18, education information was collected from the parent or guardian. Respondents were asked to report any education or training activity and, for youth with such an activity, the type of school or training program. We coded youth as enrolled in an education program if the type of program was school, college, GED, adult education, or home schooling. Among treatment group youth in the analytic sample, about 49 percent, were reported to be enrolled in school at the time of the baseline survey (conducted prior to random assignment). In this same sample, about 45 percent of treatment group youth were reported to be enrolled in the year following random assignment. Enrollment statistics from the baseline and follow-up surveys are not directly comparable. The baseline survey asked about enrollment at the time of the survey or, if the interview was conducted during a summer month, asked if the youth would be returning to school in the fall (if affirmative, the youth was considered to be enrolled). The follow-up survey asked about enrollment during the year since random assignment; if the interview was conducted during a summer month, it did not probe about fall enrollment.
93
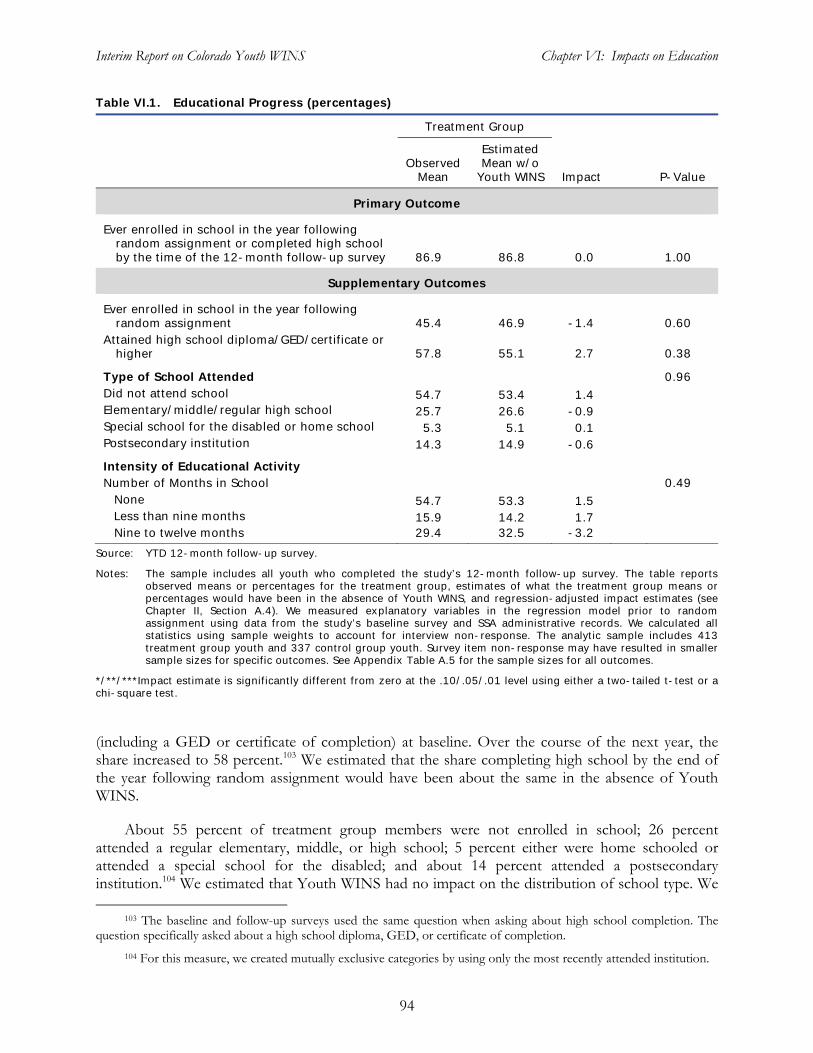
Interim Report on Colorado Youth WINS Chapter VI: Impacts on Education
Table VI.1. Educational Progress (percentages)
Treatment Group
Estimated Observed Mean w/o
Mean Youth WINS Impact P-Value
Primary Outcome
Ever enrolled in school in the year followingrandom assignment or completed high school by the time of the 12-month follow-up survey 86.9 86.8 0.0 1.00
Supplementary Outcomes
Ever enrolled in school in the year followingrandom assignment 45.4 46.9 -1.4 0.60
Attained high school diploma/GED/certificate or higher 57.8 55.1 2.7 0.38
Type of School Attended 0.96 Did not attend school 54.7 53.4 1.4 Elementary/middle/regular high school 25.7 26.6 -0.9 Special school for the disabled or home school 5.3 5.1 0.1 Postsecondary institution 14.3 14.9 -0.6
Intensity of Educational ActivityNumber of Months in School 0.49
None 54.7 53.3 1.5 Less than nine months 15.9 14.2 1.7 Nine to twelve months 29.4 32.5 -3.2
Source: YTD 12-month follow-up survey.
Notes: The sample includes all youth who completed the study’s 12-month follow-up survey. The table reportsobserved means or percentages for the treatment group, estimates of what the treatment group means or percentages would have been in the absence of Youth WINS, and regression-adjusted impact estimates (see Chapter II, Section A.4). We measured explanatory variables in the regression model prior to random assignment using data from the study’s baseline survey and SSA administrative records. We calculated allstatistics using sample weights to account for interview non-response. The analytic sample includes 413 treatment group youth and 337 control group youth. Survey item non-response may have resulted in smaller sample sizes for specific outcomes. See Appendix Table A.5 for the sample sizes for all outcomes.
*/**/***Impact estimate is significantly different from zero at the .10/.05/.01 level using either a two-tailed t-test or achi-square test.
(including a GED or certificate of completion) at baseline. Over the course of the next year, the share increased to 58 percent.103 We estimated that the share completing high school by the end of the year following random assignment would have been about the same in the absence of Youth WINS.
About 55 percent of treatment group members were not enrolled in school; 26 percent attended a regular elementary, middle, or high school; 5 percent either were home schooled or attended a special school for the disabled; and about 14 percent attended a postsecondary institution.104 We estimated that Youth WINS had no impact on the distribution of school type. We
103 The baseline and follow-up surveys used the same question when asking about high school completion. The question specifically asked about a high school diploma, GED, or certificate of completion.
104 For this measure, we created mutually exclusive categories by using only the most recently attended institution.
94
Interim Report on Colorado Youth WINS Chapter VI: Impacts on Education
also found that Youth WINS had no impact on the distribution of the number of months enrolled.105
B. Youth WINS Had No Impact on Education for Any Subgroup
The impact of Youth WINS on enrollment or completion of high school might be expected to vary across subgroups of youth. For example, the intervention might be expected to have had a greater impact on enrollment for youth who were younger because they may not have formed educational attainment goals previously. Similarly, any impact on high school completion within a year of random assignment may have been less likely for youth who were not enrolled in school at baseline. In addition, decisions and goals related to high school completion may be different for youth who worked in the year prior to baseline. We investigated whether the intervention had significant impacts on enrollment or high school completion for groups of youth defined by baseline characteristics: under age 18, attended school at baseline, and worked for pay in prior year.
We found no impacts of Youth WINS on the composite measure of school enrollment or completion of high school for any subgroup (Table VI.2). Furthermore, the estimated impact of Youth WINS on the composite measure did not vary by age, school attendance at baseline, or paid work experience.
105 We calculated months of enrollment in school based on information in the follow-up survey on the start and end dates for attendance in each school attended during the year following random assignment. For the start and end dates, the survey gave no special instructions regarding how to report extended breaks in attendance, such as any summer break. For this reason, we do not separately measure the months of enrollment beyond nine months or calculate the average months of enrollment.
95

Interim Report on Colorado Youth WINS Chapter VI: Impacts on Education
Table VI.2. School Enrollment or Completion of High School, by Subgroup (percentages)
Treatment Group
Estimated Control Observed
Mean Mean w/o
Youth WINS Impact P-Value Treatment Group Size
GroupSize
Age
Under age 18 at baseline 90.7 95.7 -5.0 0.18 97 82
Age 18 or over at baseline 85.6 83.9 1.7 0.59 312 254
(P-value of difference in impacts) (0.15)
School Attendance In school at baseline 92.4 91.7 0.7 0.81 204 159
Not in school at baseline 81.5 82.2 -0.8 0.85 204 176
(P-value of difference in impacts) (0.77)
Paid Work Experience
Worked for pay in prior year 87.6 92.7 -5.1 0.20 151 105
No work for pay in prior year 86.4 83.8 2.6 0.40 258 231
(P-value of difference in impacts) (0.12)
Source: YTD 12-month follow-up survey.
Notes: The sample includes all youth who completed the study’s 12-month follow-up survey. The table reports observed means or percentages for the treatment group, estimates of what the treatment group means or percentages would have been in the absence of Youth WINS, and regression-adjusted impact estimates (see Chapter II, Section A.4). Wemeasured explanatory variables in the regression model prior to random assignment using data from the study’sbaseline survey and SSA administrative records. We calculated all statistics using sample weights to account for interview non-response. Survey item non-response may have resulted in smaller sample sizes, as indicated in the table.
*/**/***Impact estimate is significantly different from zero at the .10/.05/.01 level using either a two-tailed t-test or a chi-square test.
96
Interim Report on Colorado Youth WINS Chapter VII: Impacts on Youth Income
VII. IMPACTS ON YOUTH INCOME, SSA BENEFITS, AND RELATED OUTCOMES
Greater income for youth with disabilities is a critical indicator of success for the YTD initiative, as described in the conceptual framework (Figure I.1). This initiative is expected to increase income through greater earnings and, in the short run, greater benefits as a result of the special SSA waivers for YTD participants. Although Youth WINS had no impact on earnings in the short term (as discussed in the Chapter V), in principle, the waivers would have allowed the project participants to retain more of their benefits at most levels of earnings. Through greater benefits, Youth WINS thus could have increased participants’ income during the year following random assignment.
The estimates presented in this chapter show that, for youth in the treatment group, the project did not have any impact on SSA benefits or total income during the year following random assignment. We also found that Youth WINS had little impact on the use of SSA work incentives. In addition, we estimated that the project had no impact on broader measures of the economic status of the youth—namely, their health insurance coverage and receipt of public assistance.
A. Youth WINS Had No Impact on Youth Income
Youth WINS had no impact on the primary outcome measure in the domain of youth income—total income from earnings and SSA disability benefits during the year following random assignment. We constructed this measure by combining earnings information from the 12-month follow-up survey with information on benefit amounts from SSA administrative records.106 The first row of Table VII.1 shows that, on average, youth in the treatment group had total income of $8,314 in the year following random assignment. On average, about 88 percent of this income came from SSA disability benefits. We estimated that Youth WINS had no impact on youth’s total annual income. In other words, we estimated that the average total annual income of treatment group youth would have been similar even in the absence of the project.
To enhance our understanding of the estimated impact on total annual income, we conducted supplementary analyses of the distribution of total annual income and the share of income from earnings. The results in Table VII.1 provide no evidence that Youth WINS had an impact on the distribution of total income, which is consistent with our finding of no impact on average total income. We found that the share of total income from earnings among treatment group members was 12 percent and estimated that this share would have been nearly the same in the absence of the project.
106 We used monthly data on SSA benefits in an enhanced version of the TRF 2008. For a detailed description of the TRF data, see Hildebrand et al. (2010).
97
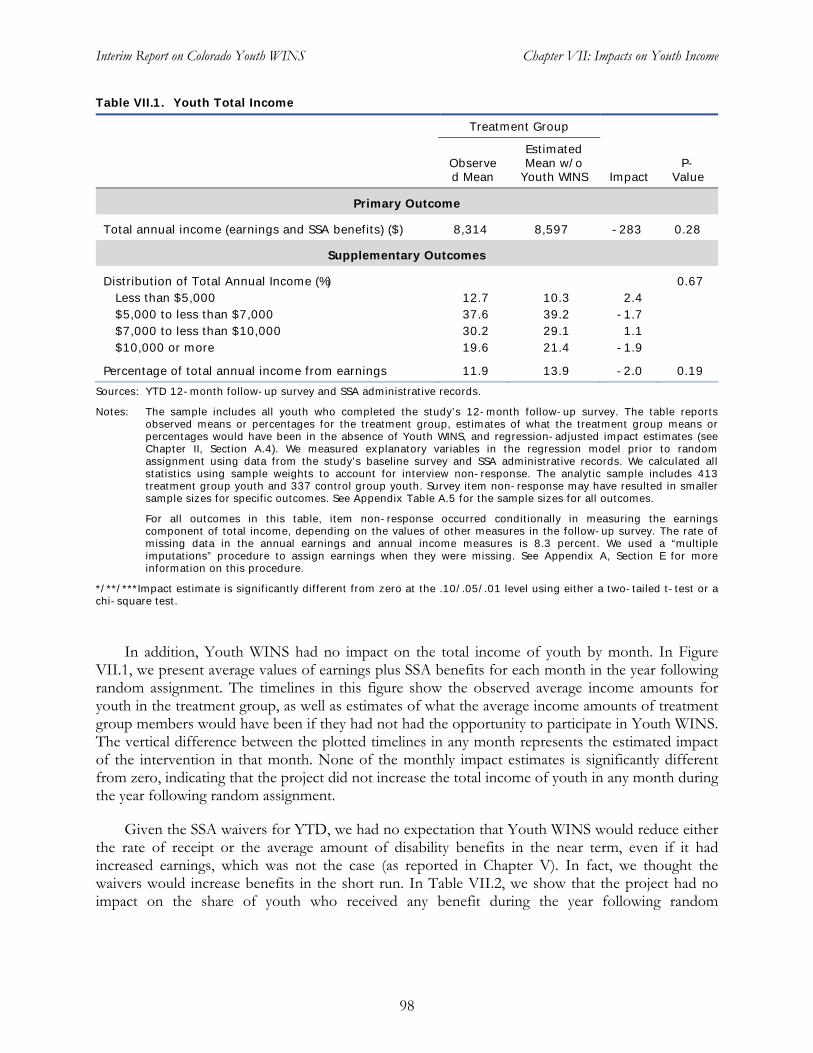
Interim Report on Colorado Youth WINS Chapter VII: Impacts on Youth Income
Table VII.1. Youth Total Income
Treatment Group
Estimated Observe Mean w/o P-d Mean Youth WINS Impact Value
Primary Outcome
Total annual income (earnings and SSA benefits) ($) 8,314 8,597 -283 0.28
Supplementary Outcomes
Distribution of Total Annual Income (%) Less than $5,000 12.7 10.3 2.4 $5,000 to less than $7,000 37.6 39.2 -1.7 $7,000 to less than $10,000 30.2 29.1 1.1 $10,000 or more 19.6 21.4 -1.9
Percentage of total annual income from earnings 11.9 13.9 -2.0 0.19
Sources: YTD 12-month follow-up survey and SSA administrative records.
Notes: The sample includes all youth who completed the study’s 12-month follow-up survey. The table reportsobserved means or percentages for the treatment group, estimates of what the treatment group means or percentages would have been in the absence of Youth WINS, and regression-adjusted impact estimates (see Chapter II, Section A.4). We measured explanatory variables in the regression model prior to random assignment using data from the study’s baseline survey and SSA administrative records. We calculated allstatistics using sample weights to account for interview non-response. The analytic sample includes 413 treatment group youth and 337 control group youth. Survey item non-response may have resulted in smaller sample sizes for specific outcomes. See Appendix Table A.5 for the sample sizes for all outcomes.
For all outcomes in this table, item non-response occurred conditionally in measuring the earnings component of total income, depending on the values of other measures in the follow-up survey. The rate of missing data in the annual earnings and annual income measures is 8.3 percent. We used a “multiple imputations” procedure to assign earnings when they were missing. See Appendix A, Section E for moreinformation on this procedure.
*/**/***Impact estimate is significantly different from zero at the .10/.05/.01 level using either a two-tailed t-test or achi-square test.
In addition, Youth WINS had no impact on the total income of youth by month. In Figure VII.1, we present average values of earnings plus SSA benefits for each month in the year following random assignment. The timelines in this figure show the observed average income amounts for youth in the treatment group, as well as estimates of what the average income amounts of treatment group members would have been if they had not had the opportunity to participate in Youth WINS. The vertical difference between the plotted timelines in any month represents the estimated impact of the intervention in that month. None of the monthly impact estimates is significantly different from zero, indicating that the project did not increase the total income of youth in any month during the year following random assignment.
Given the SSA waivers for YTD, we had no expectation that Youth WINS would reduce either the rate of receipt or the average amount of disability benefits in the near term, even if it had increased earnings, which was not the case (as reported in Chapter V). In fact, we thought the waivers would increase benefits in the short run. In Table VII.2, we show that the project had no impact on the share of youth who received any benefit during the year following random
98
0.67
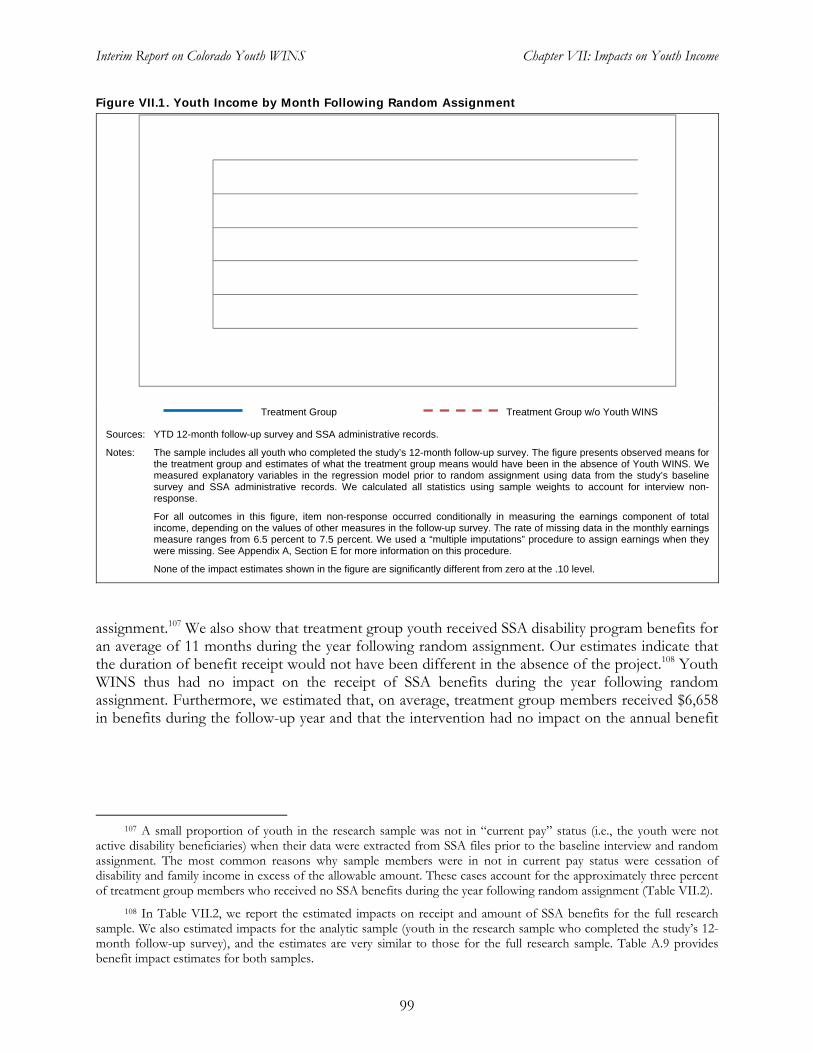
650
670
690
710
730
750
1 2 3 4 5 6 7 8 9 10 11 12
Dollars
Month After Random Assignment
Average Total Income (Earnings Plus SSA Benefits)
Interim Report on Colorado Youth WINS Chapter VII: Impacts on Youth Income
Figure VII.1. Youth Income by Month Following Random Assignment
Treatment Group Treatment Group w/o Youth WINS
Sources: YTD 12-month follow-up survey and SSA administrative records.
Notes: The sample includes all youth who completed the study’s 12-month follow-up survey. The figure presents observed means for the treatment group and estimates of what the treatment group means would have been in the absence of Youth WINS. We measured explanatory variables in the regression model prior to random assignment using data from the study’s baseline survey and SSA administrative records. We calculated all statistics using sample weights to account for interview non-response.
For all outcomes in this figure, item non-response occurred conditionally in measuring the earnings component of total income, depending on the values of other measures in the follow-up survey. The rate of missing data in the monthly earnings measure ranges from 6.5 percent to 7.5 percent. We used a “multiple imputations” procedure to assign earnings when they were missing. See Appendix A, Section E for more information on this procedure.
None of the impact estimates shown in the figure are significantly different from zero at the .10 level.
assignment.107 We also show that treatment group youth received SSA disability program benefits for an average of 11 months during the year following random assignment. Our estimates indicate that the duration of benefit receipt would not have been different in the absence of the project.108 Youth WINS thus had no impact on the receipt of SSA benefits during the year following random assignment. Furthermore, we estimated that, on average, treatment group members received $6,658 in benefits during the follow-up year and that the intervention had no impact on the annual benefit
107 A small proportion of youth in the research sample was not in “current pay” status (i.e., the youth were not active disability beneficiaries) when their data were extracted from SSA files prior to the baseline interview and random assignment. The most common reasons why sample members were in not in current pay status were cessation of disability and family income in excess of the allowable amount. These cases account for the approximately three percent of treatment group members who received no SSA benefits during the year following random assignment (Table VII.2).
108 In Table VII.2, we report the estimated impacts on receipt and amount of SSA benefits for the full research sample. We also estimated impacts for the analytic sample (youth in the research sample who completed the study’s 12-month follow-up survey), and the estimates are very similar to those for the full research sample. Table A.9 provides benefit impact estimates for both samples.
99
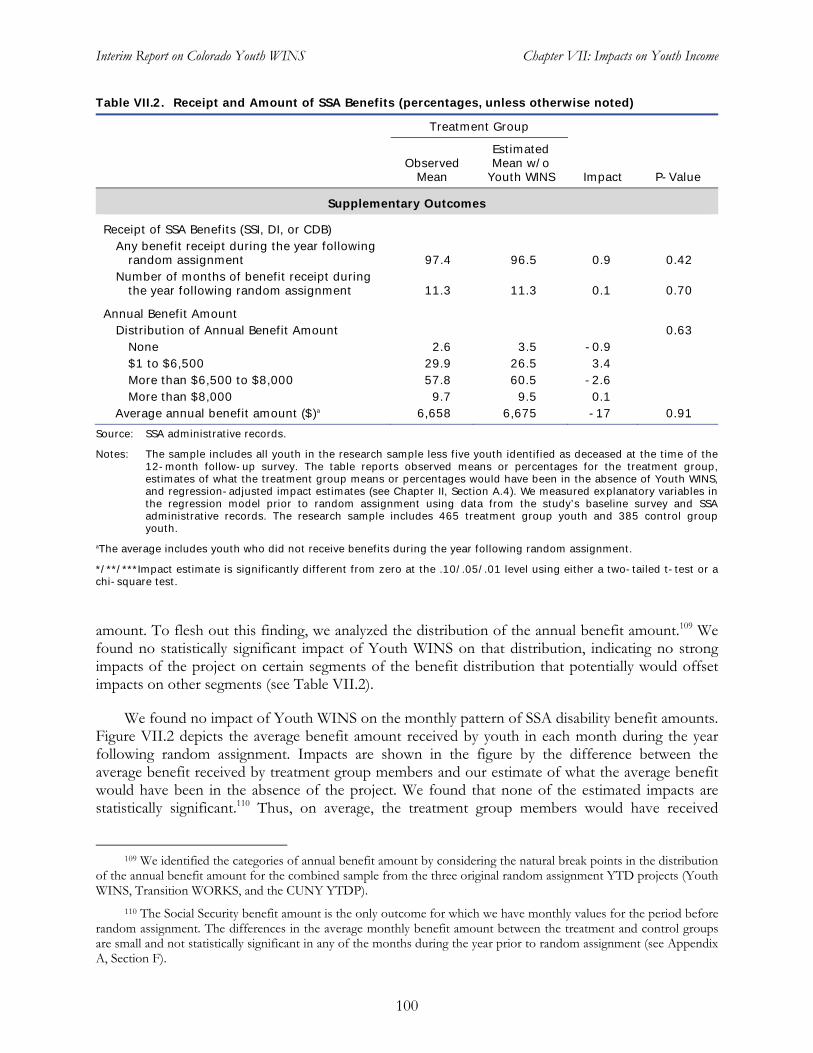
Interim Report on Colorado Youth WINS Chapter VII: Impacts on Youth Income
Table VII.2. Receipt and Amount of SSA Benefits (percentages, unless otherwise noted)
Treatment Group
Estimated Observed Mean w/o
Mean Youth WINS Impact P-Value
Supplementary Outcomes
Receipt of SSA Benefits (SSI, DI, or CDB)Any benefit receipt during the year following
random assignment 97.4 96.5 0.9 0.42 Number of months of benefit receipt during
the year following random assignment 11.3 11.3 0.1 0.70
Annual Benefit Amount Distribution of Annual Benefit Amount 0.63
None 2.6 3.5 -0.9 $1 to $6,500 29.9 26.5 3.4 More than $6,500 to $8,000 57.8 60.5 -2.6 More than $8,000 9.7 9.5 0.1
Average annual benefit amount ($)a 6,658 6,675 -17 0.91
Source: SSA administrative records.
Notes: The sample includes all youth in the research sample less five youth identified as deceased at the time of the12-month follow-up survey. The table reports observed means or percentages for the treatment group, estimates of what the treatment group means or percentages would have been in the absence of Youth WINS, and regression-adjusted impact estimates (see Chapter II, Section A.4). We measured explanatory variables inthe regression model prior to random assignment using data from the study’s baseline survey and SSA administrative records. The research sample includes 465 treatment group youth and 385 control groupyouth.
aThe average includes youth who did not receive benefits during the year following random assignment.
*/**/***Impact estimate is significantly different from zero at the .10/.05/.01 level using either a two-tailed t-test or achi-square test.
amount. To flesh out this finding, we analyzed the distribution of the annual benefit amount.109 We found no statistically significant impact of Youth WINS on that distribution, indicating no strong impacts of the project on certain segments of the benefit distribution that potentially would offset impacts on other segments (see Table VII.2).
We found no impact of Youth WINS on the monthly pattern of SSA disability benefit amounts. Figure VII.2 depicts the average benefit amount received by youth in each month during the year following random assignment. Impacts are shown in the figure by the difference between the average benefit received by treatment group members and our estimate of what the average benefit would have been in the absence of the project. We found that none of the estimated impacts are statistically significant.110 Thus, on average, the treatment group members would have received
109 We identified the categories of annual benefit amount by considering the natural break points in the distribution of the annual benefit amount for the combined sample from the three original random assignment YTD projects (Youth WINS, Transition WORKS, and the CUNY YTDP).
110 The Social Security benefit amount is the only outcome for which we have monthly values for the period before random assignment. The differences in the average monthly benefit amount between the treatment and control groups are small and not statistically significant in any of the months during the year prior to random assignment (see Appendix A, Section F).
100
535
540
545
550
555
560
565
570
1 2 3 4 5 6 7 8 9 10 11 12
Dollars
Month After Random Assignment
Average Amount of SSA Benefit
Interim Report on Colorado Youth WINS Chapter VII: Impacts on Youth Income
Figure VII.2. SSA Benefit Amount by Month Following Random Assignment
Treatment Group Treatment Group w/o Youth WINS
Source: SSA administrative records.
Notes: The sample includes all youth in the research sample less five youth identified as deceased at the time of the 12-month follow-up survey. The figure presents observed means for the treatment group and estimates of what the treatment group means would have been in the absence of Youth WINS. We measured explanatory variables in the regression model prior to random assignment using data from the study’s baseline survey and SSA administrative records.
None of the impact estimates shown in the figure are significantly different from zero at the .10-level.
similar monthly amounts of SSA disability program benefits even if they had not been given the opportunity to participate in Youth WINS.
B. Youth WINS Had Little Impact on the Use of SSA Work Incentives
Treatment group youth who enrolled in Youth WINS services had the opportunity to use the five SSA waivers for YTD (see Appendix D for a description of the waivers).111 Since each of these waivers enhanced an SSA work incentive available to the control group, we were able to analyze the impact of Youth WINS on the use of specific incentives. For a number of reasons, the treatment group youth may have been more likely to use these work incentives as participants in Youth WINS than in its absence. First, the project provided intensive benefits counseling; second, it led to increased understanding of the SSA work incentives and the relationship between benefits and employment (as discussed in Chapter IV); and third, the waivers were more generous than the work incentives alone. Using data from SSA administrative records, we constructed five supplementary outcomes that captured the use of each incentive (namely, the EIE, SEIE, Section-301 waiver, PASS, and IDA, as described in Appendix D). We also constructed a composite outcome measure of the use of any of these work incentives.
111 Some of the SSA work incentives are applied automatically to disability program beneficiaries who meet the criteria for receiving the incentives: the EIE applies automatically to all SSI beneficiaries, and the Section-301 waiver applies automatically to youth participating in the Youth WINS project. For these work incentives, we apply the term "use" of SSA work incentives loosely to indicate that youth are benefitting from these incentives.
101
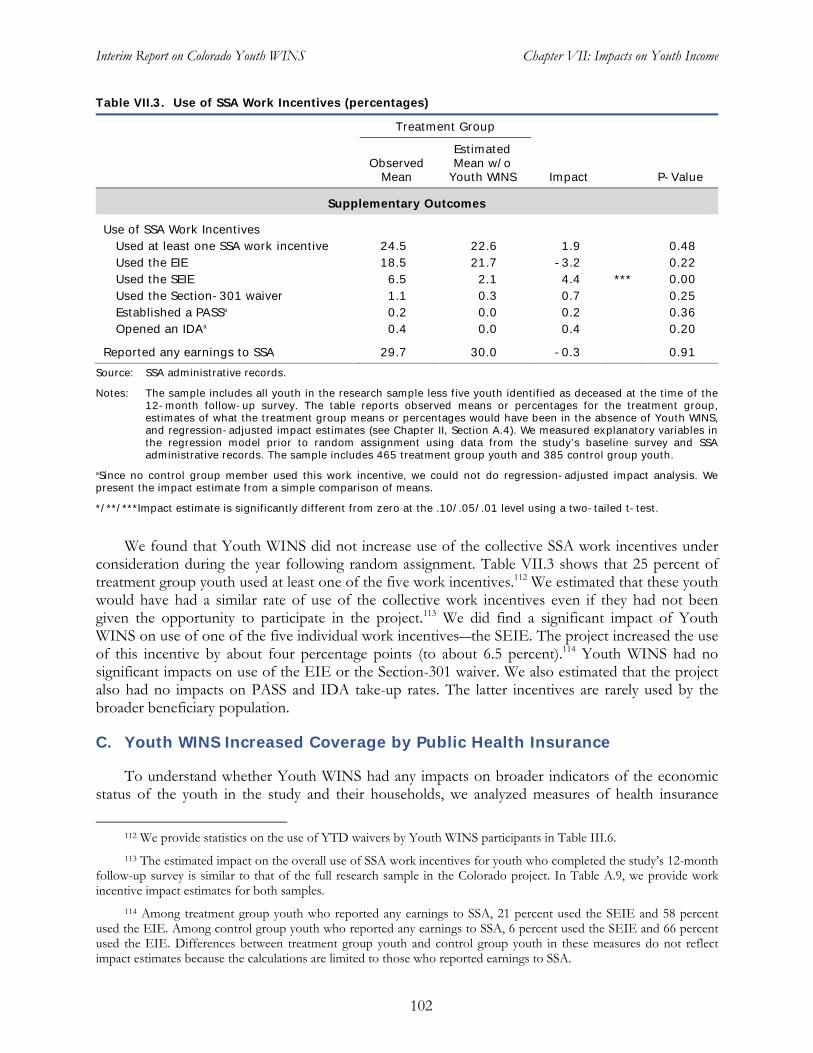
Interim Report on Colorado Youth WINS Chapter VII: Impacts on Youth Income
Table VII.3. Use of SSA Work Incentives (percentages)
Treatment Group
Estimated Observed Mean w/o
Supplementary Outcomes
Mean Youth WINS Impact P-Value
Use of SSA Work Incentives Used at least one SSA work incentive 24.5 22.6 1.9 0.48 Used the EIE 18.5 21.7 -3.2 0.22 Used the SEIE 6.5 2.1 4.4 *** 0.00 Used the Section-301 waiver 1.1 0.3 0.7 0.25 Established a PASSa 0.2 0.0 0.2 0.36 Opened an IDAa 0.4 0.0 0.4 0.20
Reported any earnings to SSA 29.7 30.0 -0.3 0.91
Source: SSA administrative records.
Notes: The sample includes all youth in the research sample less five youth identified as deceased at the time of the12-month follow-up survey. The table reports observed means or percentages for the treatment group, estimates of what the treatment group means or percentages would have been in the absence of Youth WINS, and regression-adjusted impact estimates (see Chapter II, Section A.4). We measured explanatory variables inthe regression model prior to random assignment using data from the study’s baseline survey and SSA administrative records. The sample includes 465 treatment group youth and 385 control group youth.
aSince no control group member used this work incentive, we could not do regression-adjusted impact analysis. Wepresent the impact estimate from a simple comparison of means.
*/**/***Impact estimate is significantly different from zero at the .10/.05/.01 level using a two-tailed t-test.
We found that Youth WINS did not increase use of the collective SSA work incentives under consideration during the year following random assignment. Table VII.3 shows that 25 percent of treatment group youth used at least one of the five work incentives.112 We estimated that these youth would have had a similar rate of use of the collective work incentives even if they had not been given the opportunity to participate in the project.113 We did find a significant impact of Youth WINS on use of one of the five individual work incentives―the SEIE. The project increased the use of this incentive by about four percentage points (to about 6.5 percent).114 Youth WINS had no significant impacts on use of the EIE or the Section-301 waiver. We also estimated that the project also had no impacts on PASS and IDA take-up rates. The latter incentives are rarely used by the broader beneficiary population.
C. Youth WINS Increased Coverage by Public Health Insurance
To understand whether Youth WINS had any impacts on broader indicators of the economic status of the youth in the study and their households, we analyzed measures of health insurance
112 We provide statistics on the use of YTD waivers by Youth WINS participants in Table III.6.
113 The estimated impact on the overall use of SSA work incentives for youth who completed the study’s 12-month follow-up survey is similar to that of the full research sample in the Colorado project. In Table A.9, we provide work incentive impact estimates for both samples.
114 Among treatment group youth who reported any earnings to SSA, 21 percent used the SEIE and 58 percent used the EIE. Among control group youth who reported any earnings to SSA, 6 percent used the SEIE and 66 percent used the EIE. Differences between treatment group youth and control group youth in these measures do not reflect impact estimates because the calculations are limited to those who reported earnings to SSA.
102
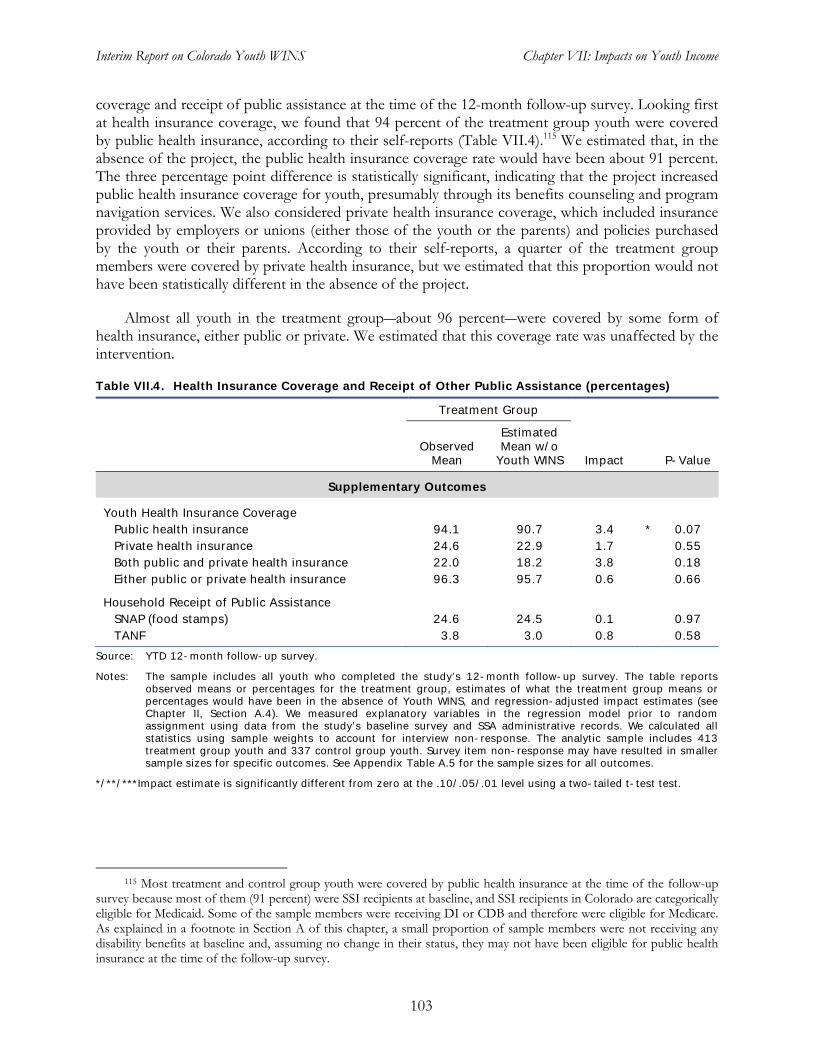
Interim Report on Colorado Youth WINS Chapter VII: Impacts on Youth Income
coverage and receipt of public assistance at the time of the 12-month follow-up survey. Looking first at health insurance coverage, we found that 94 percent of the treatment group youth were covered by public health insurance, according to their self-reports (Table VII.4).115 We estimated that, in the absence of the project, the public health insurance coverage rate would have been about 91 percent. The three percentage point difference is statistically significant, indicating that the project increased public health insurance coverage for youth, presumably through its benefits counseling and program navigation services. We also considered private health insurance coverage, which included insurance provided by employers or unions (either those of the youth or the parents) and policies purchased by the youth or their parents. According to their self-reports, a quarter of the treatment group members were covered by private health insurance, but we estimated that this proportion would not have been statistically different in the absence of the project.
Almost all youth in the treatment group―about 96 percent―were covered by some form of health insurance, either public or private. We estimated that this coverage rate was unaffected by the intervention.
Table VII.4. Health Insurance Coverage and Receipt of Other Public Assistance (percentages)
Treatment Group
Estimated Observed Mean w/o
Mean Youth WINS Impact P-Value
Supplementary Outcomes
Youth Health Insurance Coverage Public health insurance 94.1 90.7 3.4 * 0.07 Private health insurance 24.6 22.9 1.7 0.55 Both public and private health insurance 22.0 18.2 3.8 0.18 Either public or private health insurance 96.3 95.7 0.6 0.66
Household Receipt of Public AssistanceSNAP (food stamps) 24.6 24.5 0.1 0.97 TANF 3.8 3.0 0.8 0.58
Source: YTD 12-month follow-up survey.
Notes: The sample includes all youth who completed the study’s 12-month follow-up survey. The table reportsobserved means or percentages for the treatment group, estimates of what the treatment group means or percentages would have been in the absence of Youth WINS, and regression-adjusted impact estimates (see Chapter II, Section A.4). We measured explanatory variables in the regression model prior to random assignment using data from the study’s baseline survey and SSA administrative records. We calculated allstatistics using sample weights to account for interview non-response. The analytic sample includes 413 treatment group youth and 337 control group youth. Survey item non-response may have resulted in smaller sample sizes for specific outcomes. See Appendix Table A.5 for the sample sizes for all outcomes.
*/**/***Impact estimate is significantly different from zero at the .10/.05/.01 level using a two-tailed t-test test.
115 Most treatment and control group youth were covered by public health insurance at the time of the follow-up survey because most of them (91 percent) were SSI recipients at baseline, and SSI recipients in Colorado are categorically eligible for Medicaid. Some of the sample members were receiving DI or CDB and therefore were eligible for Medicare. As explained in a footnote in Section A of this chapter, a small proportion of sample members were not receiving any disability benefits at baseline and, assuming no change in their status, they may not have been eligible for public health insurance at the time of the follow-up survey.
103
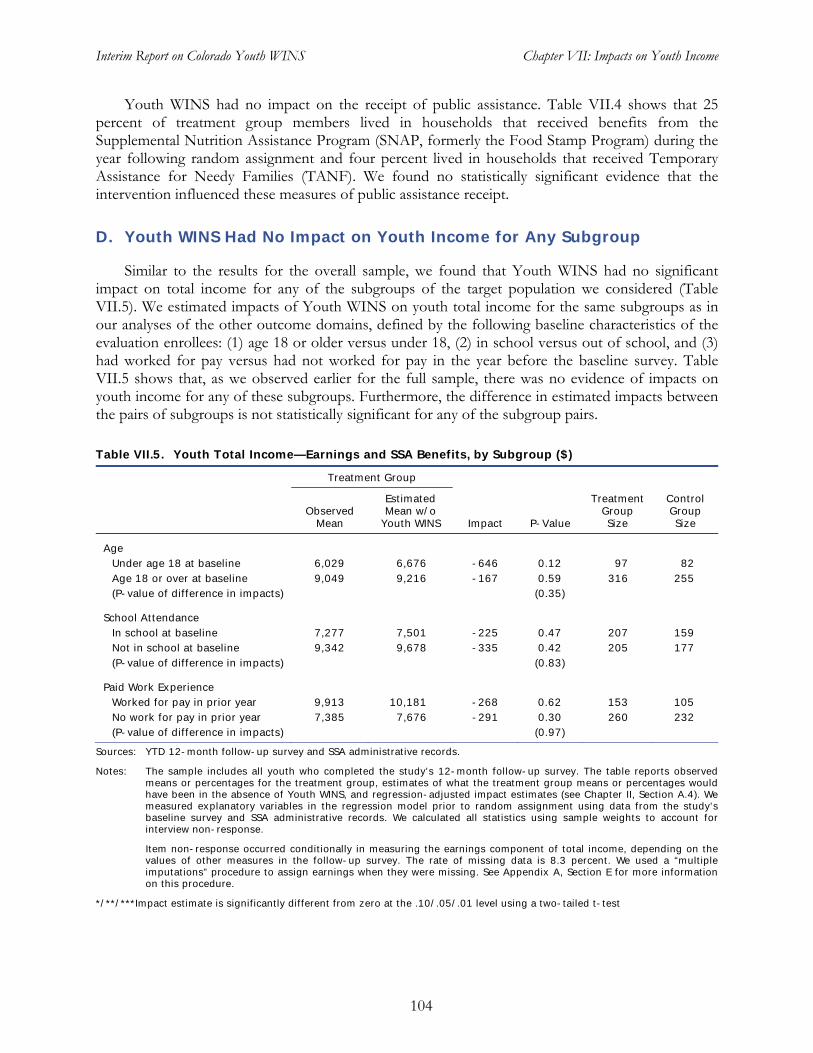
Interim Report on Colorado Youth WINS Chapter VII: Impacts on Youth Income
Youth WINS had no impact on the receipt of public assistance. Table VII.4 shows that 25 percent of treatment group members lived in households that received benefits from the Supplemental Nutrition Assistance Program (SNAP, formerly the Food Stamp Program) during the year following random assignment and four percent lived in households that received Temporary Assistance for Needy Families (TANF). We found no statistically significant evidence that the intervention influenced these measures of public assistance receipt.
D. Youth WINS Had No Impact on Youth Income for Any Subgroup
Similar to the results for the overall sample, we found that Youth WINS had no significant impact on total income for any of the subgroups of the target population we considered (Table VII.5). We estimated impacts of Youth WINS on youth total income for the same subgroups as in our analyses of the other outcome domains, defined by the following baseline characteristics of the evaluation enrollees: (1) age 18 or older versus under 18, (2) in school versus out of school, and (3) had worked for pay versus had not worked for pay in the year before the baseline survey. Table VII.5 shows that, as we observed earlier for the full sample, there was no evidence of impacts on youth income for any of these subgroups. Furthermore, the difference in estimated impacts between the pairs of subgroups is not statistically significant for any of the subgroup pairs.
Table VII.5. Youth Total Income—Earnings and SSA Benefits, by Subgroup ($)
Treatment Group
Estimated Treatment Control Observed
Mean Mean w/o
Youth WINS Impact P-Value GroupSize
GroupSize
Age
Under age 18 at baseline 6,029 6,676 -646 0.12 97 82
Age 18 or over at baseline 9,049 9,216 -167 0.59 316 255
(P-value of difference in impacts) (0.35)
School Attendance In school at baseline 7,277 7,501 -225 0.47 207 159
Not in school at baseline 9,342 9,678 -335 0.42 205 177
(P-value of difference in impacts) (0.83)
Paid Work Experience
Worked for pay in prior year 9,913 10,181 -268 0.62 153 105
No work for pay in prior year 7,385 7,676 -291 0.30 260 232
(P-value of difference in impacts) (0.97)
Sources: YTD 12-month follow-up survey and SSA administrative records.
Notes: The sample includes all youth who completed the study’s 12-month follow-up survey. The table reports observed means or percentages for the treatment group, estimates of what the treatment group means or percentages would have been in the absence of Youth WINS, and regression-adjusted impact estimates (see Chapter II, Section A.4). Wemeasured explanatory variables in the regression model prior to random assignment using data from the study’sbaseline survey and SSA administrative records. We calculated all statistics using sample weights to account for interview non-response.
Item non-response occurred conditionally in measuring the earnings component of total income, depending on the values of other measures in the follow-up survey. The rate of missing data is 8.3 percent. We used a “multipleimputations” procedure to assign earnings when they were missing. See Appendix A, Section E for more informationon this procedure.
*/**/***Impact estimate is significantly different from zero at the .10/.05/.01 level using a two-tailed t-test
104
Interim Report on Colorado Youth WINS Chapter VIII: Impacts on Attitudes and Expectations
VIII. IMPACTS ON ATTITUDES AND EXPECTATIONS
Youth WINS, like all of the YTD projects, sought to provide youth who had severe disabilities with services and experiences that would instill in them a belief in their ability to succeed in life. The conceptual framework for the YTD evaluation (Figure I.1) thus posits near-term improvements in youths’ expectations for their futures as well as their sense of self-efficacy. Youth WINS in particular sought to promote independence and self-sufficiency among participants through a person-centered approach. The project’s service model featured early discussions of a participant’s life goals, which then informed the development of a person-centered plan for services that would facilitate the youth’s progress toward those goals (Chapter III).
The overarching goal of the YTD initiative is to promote economic self-sufficiency and independence. Accordingly, we specified the primary outcome in the domain of “attitudes and expectations” as whether a youth’s goals included working and earning enough money to stop receiving disability benefits. The supplementary outcomes in this domain include additional measures of youth expectations and self-determination. If Youth WINS was successful in empowering youth and fostering positive expectations, we should anticipate that treatment group members would demonstrate greater independence in daily activities, decision making, and social interactions. The supplementary outcomes thus also include measures of independence and social interactions.
Attitudes and expectations might be expected to be more malleable and subject to influence by Youth WINS than many of the other outcome measures considered in this report. In particular, employment and income might be slow to respond to the intervention, given that about half of the youth in the research sample were attending school at baseline. On the other hand, finding positive impacts on attitudes and expectations could foreshadow positive impacts on these and perhaps other outcomes in the longer run.
Attitudes and expectations are difficult to measure, however. Responses to survey questions on these topics are clearly subjective and research on the stability of self-reports indicates that the same person answering on different days may respond differently.116 In addition, youth may feel pressure to respond in a way they feel is expected or socially accepted. Due to the difficulty in accurately measuring attitudes and expectations, some studies find no impacts on these measures, even when an objective outcome of interest (such as employment) shows an impact. The YTD follow-up survey was designed to include the best available measures used in other surveys. Nevertheless, even with widely used measures, the concepts of self-efficacy and future expectations are difficult to measure.
In addition, with respect to the primary outcome, it is possible for an intervention that successfully provides benefits counseling or paid work experience to have an unintentional adverse impact on whether a youth’s goals included working and earning enough money to stop receiving disability benefits. To the extent that a YTD project increases awareness that working and receiving earnings may not eliminate the entire cash benefit and eligibility for medical insurance, this awareness may result in fewer youth agreeing that their goals include working and earning enough to
116 Research finds evidence of low-to-moderate stability in self-reports of social skills (Gresham and Elliott 1990) and self-concept (Marsh 1983). Also, for youth with developmental disabilities, stability likely would be lower. Stability isrelated to cognitive rather than chronological age. Younger children have more difficulty in differentiating discrete areas of self-worth (Harper 1990).
105
Interim Report on Colorado Youth WINS Chapter VIII: Impacts on Attitudes and Expectations
stop receiving disability benefits. As we showed in Chapter IV, Youth WINS increased knowledge that the entire cash benefit would not be lost once work begins (Table IV.3).
Although our process analysis of Youth WINS found that the I-Team members almost universally described the program’s philosophy as one of "supporting independence," this analysis also found that Youth WINS did not place a strong focus on short-term employment (see Chapter III). Consistent with this latter observation, the results in this chapter show no impact of Youth WINS on goals for future work and earnings. In addition, we found no pattern of impacts on supplementary outcomes in this domain despite the project’s focus on self-sufficiency and achievement of life goals. We caution that the lack of estimated impacts may reflect the difficulty in measuring these outcomes precisely.
A. Youth WINS Had No Impact on Goals for Future Work and Earnings
Our primary outcome measure in this domain is goals for future work and earnings. This measure is based on youth responses to the statement in the follow-up survey, “Your personal goals include someday working and earning enough to stop receiving Social Security disability benefits.” 117
This is particularly relevant to the YTD evaluation because it measures whether youths’ goals align with the goal of the YTD initiative for youth to maximize their economic self-sufficiency.
We found no impact on goals for future work and earnings. Among youth in the treatment group, 66 percent agreed with the statement that their goals included working and earning enough to stop receiving disability benefits (Table VIII.1). In the absence of Youth WINS, we estimated that 65 percent of those youth would have agreed with the statement.118 As discussed in the introduction to this chapter, the lack of an impact of Youth WINS on this outcome may reflect a combination of a positive impact for some treatment youth and an unintended negative impact for others.
In contrast, we estimated a positive impact of Youth WINS on plans for further schooling. At baseline, about 70 percent of treatment youth reported that they planned to go further in school in the next five years (Table II.2).119 In the follow-up survey, a similar share, about 67 percent, reported
117 Youth were asked to respond to this statement in one of four categories: agree a lot, agree a little, disagree a little, and disagree a lot. We combined the first two categories to create a measure of whether the youth agreed with the statement. As a robustness check, we verified that there were no impacts of Youth WINS on the share of youth responding “agree a lot” or on the distribution of responses across all four categories. Information on most of the measures of attitudes and expectations reported in this chapter were collected from youth only. In particular, the primary measure and the locus of control measures were not asked of parents (or guardians). The three expectations measures (regarding independent living, employment, and education) were asked of both youth and parents. For these three measures, we report both youth and parent responses.
118 Information on plans for the future and self-efficacy was missing for a large share of cases—between 22 percent and 35 percent, depending on the measure. For youth responses, missing information for many cases occurred due to skip patterns in the survey for proxy respondents: 23 percent of youth had a proxy respondent for the follow-up survey; most of the proxy respondents were parents of the youth. Regarding plans for the future, proxy respondents who were parents provided information for the parent response only and proxy respondents who were not parents provided information for the youth response only. For self-efficacy, proxy respondents were not asked to provide any information. For parent responses, missing information mainly occurred when the parent (or guardian) was unavailable to respond to the survey.
119 For most outcome measures, we do not have similar measures at baseline. However, the baseline and follow-up survey used similar questions to ask about plans for the next five years for further schooling, working for pay, and living independently. The biggest difference between the surveys was that the follow-up survey did not ask youth who were working full time about plans for work.
106
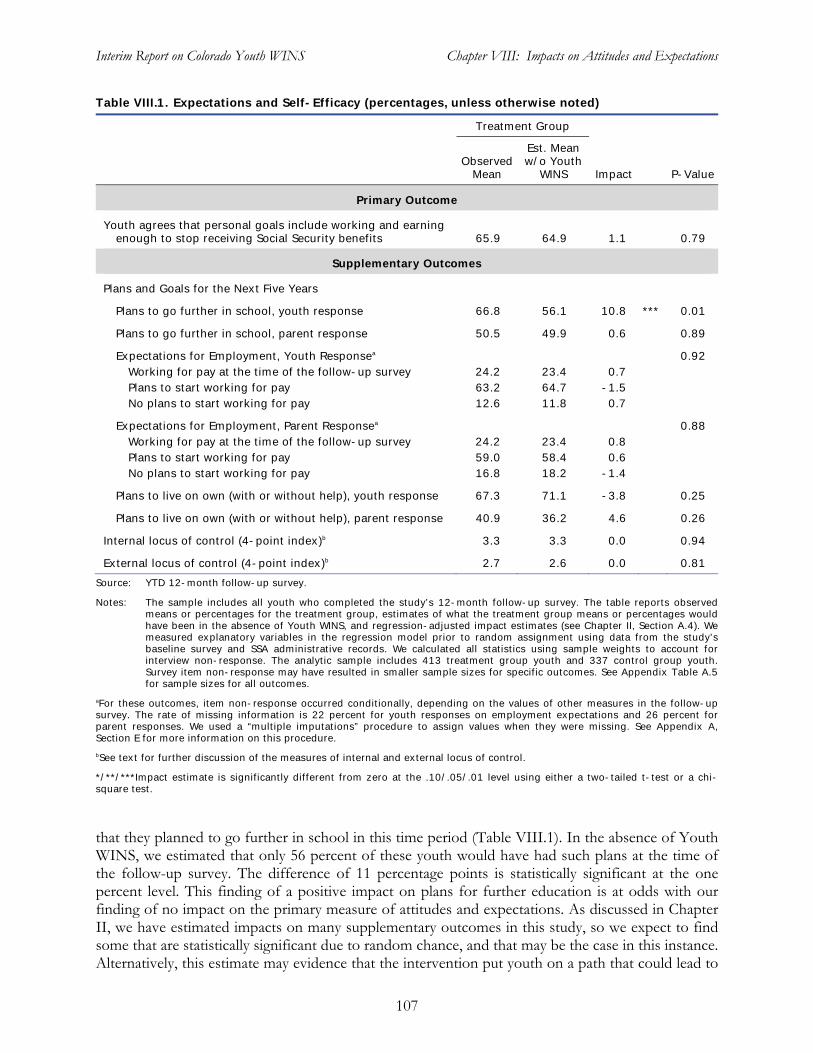
Interim Report on Colorado Youth WINS Chapter VIII: Impacts on Attitudes and Expectations
Table VIII.1. Expectations and Self-Efficacy (percentages, unless otherwise noted)
Treatment Group
Est. Mean Observed w/o Youth
Mean WINS Impact P-Value
Primary Outcome
Youth agrees that personal goals include working and earningenough to stop receiving Social Security benefits 65.9 64.9 1.1 0.79
Supplementary Outcomes
Plans and Goals for the Next Five Years
Plans to go further in school, youth response 66.8 56.1 10.8 *** 0.01
Plans to go further in school, parent response 50.5 49.9 0.6 0.89
Expectations for Employment, Youth Responsea 0.92 Working for pay at the time of the follow-up survey 24.2 23.4 0.7 Plans to start working for pay 63.2 64.7 -1.5 No plans to start working for pay 12.6 11.8 0.7
Expectations for Employment, Parent Responsea 0.88 Working for pay at the time of the follow-up survey 24.2 23.4 0.8 Plans to start working for pay 59.0 58.4 0.6 No plans to start working for pay 16.8 18.2 -1.4
Plans to live on own (with or without help), youth response 67.3 71.1 -3.8 0.25
Plans to live on own (with or without help), parent response 40.9 36.2 4.6 0.26
Internal locus of control (4-point index)b 3.3 3.3 0.0 0.94
External locus of control (4-point index)b 2.7 2.6 0.0 0.81
Source: YTD 12-month follow-up survey.
Notes: The sample includes all youth who completed the study’s 12-month follow-up survey. The table reports observed means or percentages for the treatment group, estimates of what the treatment group means or percentages would have been in the absence of Youth WINS, and regression-adjusted impact estimates (see Chapter II, Section A.4). Wemeasured explanatory variables in the regression model prior to random assignment using data from the study’sbaseline survey and SSA administrative records. We calculated all statistics using sample weights to account for interview non-response. The analytic sample includes 413 treatment group youth and 337 control group youth. Survey item non-response may have resulted in smaller sample sizes for specific outcomes. See Appendix Table A.5for sample sizes for all outcomes.
aFor these outcomes, item non-response occurred conditionally, depending on the values of other measures in the follow-upsurvey. The rate of missing information is 22 percent for youth responses on employment expectations and 26 percent forparent responses. We used a “multiple imputations” procedure to assign values when they were missing. See Appendix A,Section E for more information on this procedure.
bSee text for further discussion of the measures of internal and external locus of control.
*/**/***Impact estimate is significantly different from zero at the .10/.05/.01 level using either a two-tailed t-test or a chi-square test.
that they planned to go further in school in this time period (Table VIII.1). In the absence of Youth WINS, we estimated that only 56 percent of these youth would have had such plans at the time of the follow-up survey. The difference of 11 percentage points is statistically significant at the one percent level. This finding of a positive impact on plans for further education is at odds with our finding of no impact on the primary measure of attitudes and expectations. As discussed in Chapter II, we have estimated impacts on many supplementary outcomes in this study, so we expect to find some that are statistically significant due to random chance, and that may be the case in this instance. Alternatively, this estimate may evidence that the intervention put youth on a path that could lead to
107
Interim Report on Colorado Youth WINS Chapter VIII: Impacts on Attitudes and Expectations
greater educational attainment and, ultimately, higher employment and earnings. The three-year follow-up survey will provide further evidence on whether the estimated impact on youth plans for further schooling was due to random chance or instead was a precursor to improved education and employment outcomes.
We found no evidence of impacts of Youth WINS on other supplementary measures of plans for the future. At baseline and at the time of the follow-up survey, about 67 percent of treatment group youth reported that they planned to live on their own (with or without help) in the next five years (Table II.2 reports baseline measures; Table VIII.1 reports follow-up measures). We estimated that the percentage reporting plans to live on their own in the follow-up survey would not have been significantly different in the absence of the intervention. We also found no impact on plans for paid employment. About 13 percent of treatment group youth reported no plans to work for pay in the five years after the follow-up survey (this share is similar to what we found at baseline).120 We estimated that in the absence of Youth WINS, roughly the same share would have had no plans for future paid work at the time of the follow-up survey. We also found no impacts of Youth WINS on parent responses about youth plans for living independently or for paid employment.
To investigate the effects of the intervention on youths’ feelings of self-efficacy, we created composite measures from a series of questions in the follow-up survey. The self-efficacy measures are based on a battery of questions that includes the Pearlin Mastery Scale (Pearlin and Schooler 1978). After analyzing the degree of correlation between these measures and the concepts measured, we determined that the measures could be combined into an “internal locus of control” and an “external locus of control.” See Appendix A, Section H for further information on the creation of these measures.
In this evaluation, the internal locus of control reflects whether youth believe their life outcomes result primarily from their own behaviors and actions. The average value of this index for treatment group youth was 3.3, and we estimated that in the absence of Youth WINS, the average would have been the same. The external locus of control reflects the degree to which youth believe that others, fate, or chance primarily determine their life outcomes. The average value of this index for treatment group youth was 2.7. We estimated that these youth would have had essentially the same average value even if they had not been given the opportunity to participate in Youth WINS.121
The findings of no impact of Youth WINS on the primary outcome in this domain and no pattern of impacts on the supplementary outcomes suggest that the project did not affect the expectations, plans, or self-efficacy of youth in the treatment group. This conclusion is surprising, given that Youth WINS emphasized independence, self-sufficiency, and the achievement of life goals. Although it may be the case that Youth WINS indeed had no impact on expectations and self-efficacy, we caution that the findings may be due to the difficulty in measuring these outcomes.
120 In the follow-up survey, youth who already were working full time were not asked about their plans for paid employment. We included all youth who were working for pay (part time or full time) at the time of the follow-up survey in a separate category in the analysis reported in Table VIII.1.
121 Appendix A, Section H presents separate impact estimates for each of the 11 questions used to create the two indices. These additional impact estimates are consistent with the findings reported here that Youth WINS did not have an impact on youth self-efficacy.
108
Interim Report on Colorado Youth WINS Chapter VIII: Impacts on Attitudes and Expectations
B. Youth WINS Had No Impacts on Independence, Decision Making, and Social Interactions
In principle, feelings of greater self-efficacy for youth could lead them to display more independence in daily activities, play a bigger part in decision making, and engage in higher levels of social interaction. We examined measures of these outcomes as a supplementary analysis in the attitudes and expectations domain. However, the previous finding of no impact of Youth WINS on self-efficacy suggests that the project was unlikely to have had impacts on these additional measures, even though the intervention’s emphasis on independence was designed to influence these outcomes.
Consistent with our finding of no impact on self-efficacy, we also found no impacts of Youth WINS on independent activities, decision making, or social interactions (Table VIII.2).122 We found that 84 percent of treatment group youth made snacks on their own, 48 percent rode public transportation alone, and 92 percent picked the clothes they wore each day. About 80 percent of treatment group youth decided how to spend their own money and 91 percent decided how to spend their free time. About 70 percent of treatment group youth reported that they got together with friends “to have fun or hang out.” We estimated that none of these percentages would have been statistically different in the absence of Youth WINS.123
C. Youth WINS Had No Impact on Goals for Future Work and Earnings for Any Subgroup
Although Youth WINS had no impact on the primary outcome in the domain of attitudes and expectations—goals for future work and earnings—for the entire target population, it nevertheless could have had impacts for certain subgroups. For example, the goals for work and earnings of youth who had not worked for pay in the year prior to random assignment might have been more malleable than those with work experience. Accordingly, we estimated the impacts of Youth WINS on the primary outcome measure in this domain for the three pairs of subgroups of the target population defined by baseline age, school attendance, and paid work experience.
We found no statistically significant impacts of Youth WINS on goals for future work and earnings for any subgroup (Table VIII.3). Furthermore, the estimated impacts did not vary by prior work experience. We did, however, find variation by subgroup in the direction of the estimated impacts. Specifically, for youth under the age of 18 at baseline, the impact estimate would suggest that Youth WINS lowered the share of youth who had the goal of achieving independence through
122 We collected the measures of independence in daily activities, decision making, and social interaction from youth only. For the first five measures in Table VIII.2, we asked youth how often they do the activity by themselves. We combined “most of the time” and “some of the time” in a single category, which we interpreted as being indicative of the youth doing the activity on their own. The alternative response was “none of the time.” As a robustness check, we verified that there were no impacts of Youth WINS on the distribution of responses across all three categories for each activity. For social interaction, youth were asked how often they get together with friends “to have fun or hang out.” We combined “sometimes” and “often” in a single category to measure having social interaction. The alternative responses were “never,” “hardly ever,” and “does not have friends.” As a robustness check, we verified that there was no impact of Youth WINS on the distribution of responses across all five categories.
123 We asked the same battery of questions about independent activities and decision making in the baseline and follow-up surveys. The levels of independent activity and decision making reported in Table VIII.2 are very similar to baseline levels (Tables II.2 and A.2). For each activity or decision making area, the baseline level for the treatment group was within two percentage points of the follow-up level.
109
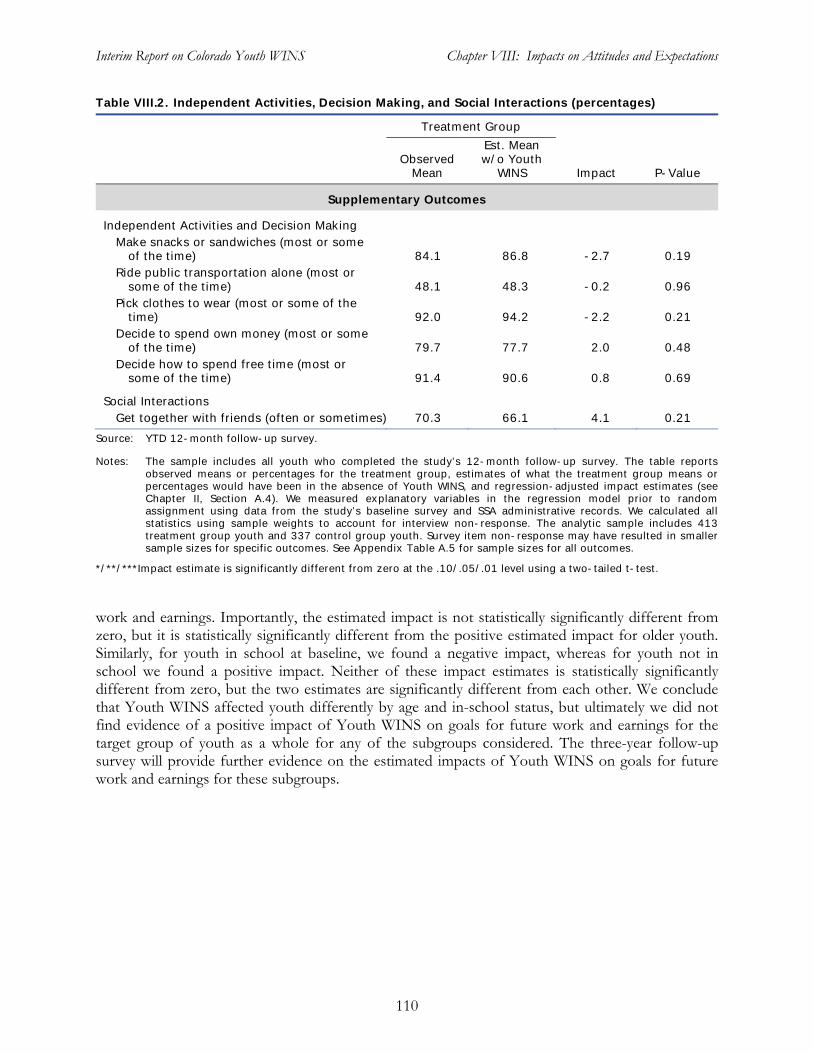
Interim Report on Colorado Youth WINS Chapter VIII: Impacts on Attitudes and Expectations
Table VIII.2. Independent Activities, Decision Making, and Social Interactions (percentages)
Treatment Group
Est. Mean Observed w/o Youth
Mean WINS Impact P-Value
Supplementary Outcomes
Independent Activities and Decision MakingMake snacks or sandwiches (most or some
of the time) 84.1 86.8 -2.7 0.19 Ride public transportation alone (most or
some of the time) 48.1 48.3 -0.2 0.96 Pick clothes to wear (most or some of the
time) 92.0 94.2 -2.2 0.21 Decide to spend own money (most or some
of the time) 79.7 77.7 2.0 0.48 Decide how to spend free time (most or
some of the time) 91.4 90.6 0.8 0.69
Social Interactions Get together with friends (often or sometimes) 70.3 66.1 4.1 0.21
Source: YTD 12-month follow-up survey.
Notes: The sample includes all youth who completed the study’s 12-month follow-up survey. The table reportsobserved means or percentages for the treatment group, estimates of what the treatment group means or percentages would have been in the absence of Youth WINS, and regression-adjusted impact estimates (see Chapter II, Section A.4). We measured explanatory variables in the regression model prior to random assignment using data from the study’s baseline survey and SSA administrative records. We calculated allstatistics using sample weights to account for interview non-response. The analytic sample includes 413 treatment group youth and 337 control group youth. Survey item non-response may have resulted in smaller sample sizes for specific outcomes. See Appendix Table A.5 for sample sizes for all outcomes.
*/**/***Impact estimate is significantly different from zero at the .10/.05/.01 level using a two-tailed t-test.
work and earnings. Importantly, the estimated impact is not statistically significantly different from zero, but it is statistically significantly different from the positive estimated impact for older youth. Similarly, for youth in school at baseline, we found a negative impact, whereas for youth not in school we found a positive impact. Neither of these impact estimates is statistically significantly different from zero, but the two estimates are significantly different from each other. We conclude that Youth WINS affected youth differently by age and in-school status, but ultimately we did not find evidence of a positive impact of Youth WINS on goals for future work and earnings for the target group of youth as a whole for any of the subgroups considered. The three-year follow-up survey will provide further evidence on the estimated impacts of Youth WINS on goals for future work and earnings for these subgroups.
110
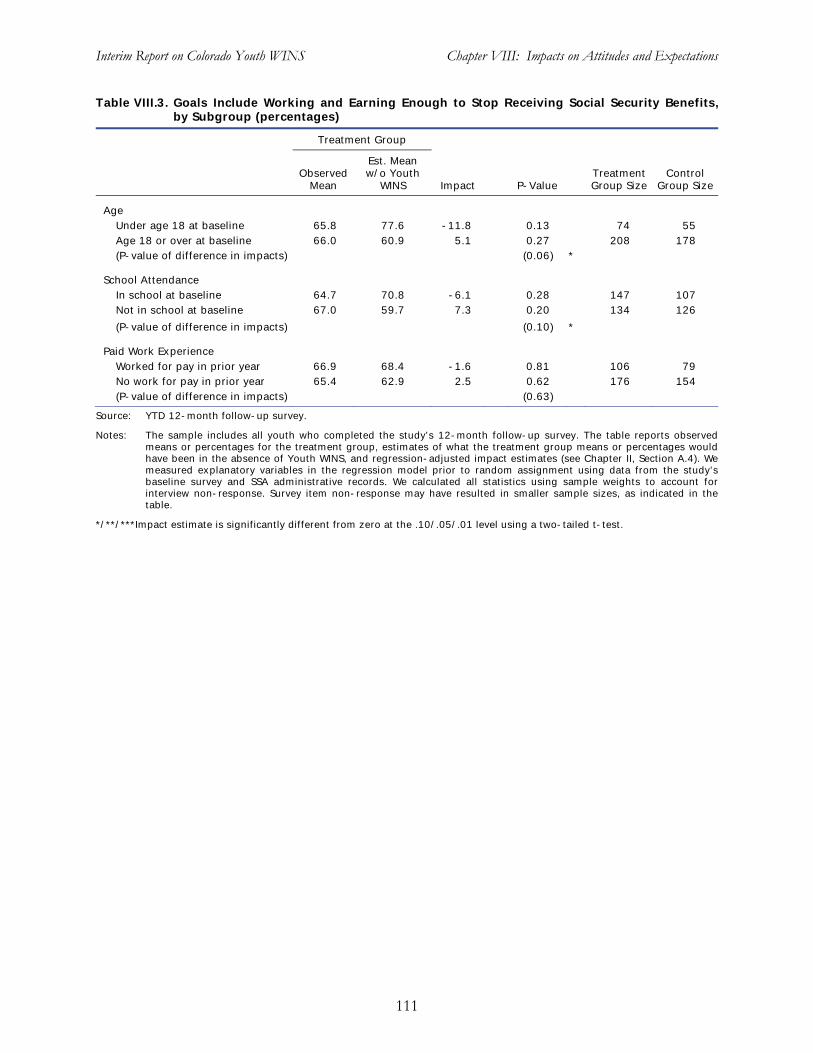
Interim Report on Colorado Youth WINS Chapter VIII: Impacts on Attitudes and Expectations
Table VIII.3. Goals Include Working and Earning Enough to Stop Receiving Social Security Benefits, by Subgroup (percentages)
Treatment Group
Est. Mean Observed w/o Youth Treatment Control
Mean WINS Impact P-Value Group Size Group Size
Age
Under age 18 at baseline 65.8 77.6 -11.8 0.13 74 55
Age 18 or over at baseline 66.0 60.9 5.1 0.27 208 178
(P-value of difference in impacts) (0.06) *
School Attendance In school at baseline 64.7 70.8 -6.1 0.28 147 107
Not in school at baseline 67.0 59.7 7.3 0.20 134 126
(P-value of difference in impacts) (0.10) *
Paid Work Experience
Worked for pay in prior year 66.9 68.4 -1.6 0.81 106 79
No work for pay in prior year 65.4 62.9 2.5 0.62 176 154
(P-value of difference in impacts) (0.63)
Source: YTD 12-month follow-up survey.
Notes: The sample includes all youth who completed the study’s 12-month follow-up survey. The table reports observed means or percentages for the treatment group, estimates of what the treatment group means or percentages would have been in the absence of Youth WINS, and regression-adjusted impact estimates (see Chapter II, Section A.4). Wemeasured explanatory variables in the regression model prior to random assignment using data from the study’sbaseline survey and SSA administrative records. We calculated all statistics using sample weights to account for interview non-response. Survey item non-response may have resulted in smaller sample sizes, as indicated in the table.
*/**/***Impact estimate is significantly different from zero at the .10/.05/.01 level using a two-tailed t-test.
111

Interim Report on Colorado Youth WINS Chapter IX: Exploratory Analyses
IX. EXPLORATORY ANALYSES OF IMPACTS ON TRAINING AND PRODUCTIVE ACTIVITIES
While training is an investment that can improve employment and earning opportunities, it is not a key component of the YTD intervention. The YTD projects, including Youth WINS, have not emphasized training as either a service input or an outcome. However, Youth WINS may have improved training outcomes through referrals to Workforce Centers and more generally through its support for developing and pursuing life goals and emphasis on self-sufficiency. Specifically, some youth may have been motivated to obtain training as an important step on the path to those objectives stressed by Youth WINS. Because of the importance of training for future employment and earnings and the potential for Youth WINS to have influenced training, in this chapter we explore the project’s impacts on training outcomes.
As a precursor to our planned longer-term analysis, our second exploratory analysis examines the impact of Youth WINS on a composite measure of participation in productive activities during the year following random assignment―specifically, participation in education, training, and paid and unpaid employment. Participation in productive activities is a key longer-term outcome in the YTD conceptual framework.
In light of the lack of statistically significant impacts on school enrollment and employment, it is not surprising that we found no impact of Youth WINS on training or the composite measure of productive activities.
A. Youth WINS Had No Impact on Participation in Training
Although Youth WINS did not emphasize enrollment in training programs, its focus on self-sufficiency possibly could have induced some of its participants to enroll in training. However, we found no impacts of the intervention on training-related outcomes. A small share of treatment group youth―about 10 percent―was enrolled in a training program during the year following random assignment (Table IX.1).124 We estimated that the proportion enrolled would have been about the same in the absence of Youth WINS.
124 At baseline, 35 percent of treatment group youth reported having received job training during the past year (Table II.2). The difference in the rate of receipt of training between the baseline and follow-up surveys may be due largely to differences in the way the surveys asked for this information. The baseline survey asked a very broad question about training in job skills, vocational education, career counseling, and help in finding a job. This measure of “job training” includes activities that fell in the employment services domain in the follow-up survey (as described in Chapter IV). That survey asked whether youth were “currently in a training program or taking classes to help you learn job skills or get a job?” If youth currently were not participating in training, the survey asked, “Did you go to school, attend a training program, or take any classes?” following the date of random assignment. We distinguished between schooling and training based on a follow-up question about the program type for each program reported. We coded educational institutions as schooling. We coded the remaining categories as training: “job skills training, job training, interviewing skills, computer skills, on the job training, assistance with finding a job”; “life skills, college preparation, transition programs, YTD”; and “day habilitation, day programs.” Although some of these categories could be considered employment services, youth specifically were asked to report training programs and classes to learn job skills or get a job, whereas the service section of the survey asked more broadly about “services or training.” For youth under the age of 18, we collected information on participation in training programs from parents or guardians.
113
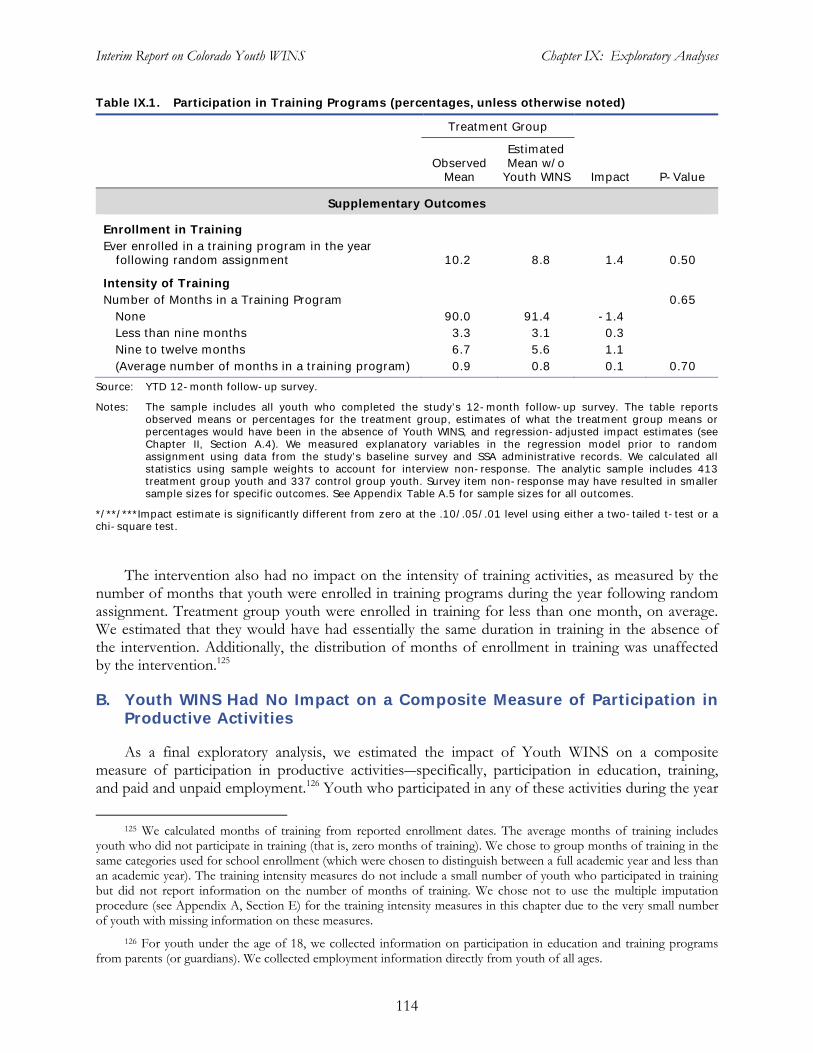
Interim Report on Colorado Youth WINS Chapter IX: Exploratory Analyses
Table IX.1. Participation in Training Programs (percentages, unless otherwise noted)
Treatment Group
Estimated Observed Mean w/o
Supplementary Outcomes
Mean Youth WINS Impact P-Value
Enrollment in TrainingEver enrolled in a training program in the year
following random assignment 10.2 8.8 1.4 0.50
Intensity of TrainingNumber of Months in a Training Program 0.65
None 90.0 91.4 -1.4 Less than nine months 3.3 3.1 0.3 Nine to twelve months 6.7 5.6 1.1 (Average number of months in a training program) 0.9 0.8 0.1 0.70
Source: YTD 12-month follow-up survey.
Notes: The sample includes all youth who completed the study’s 12-month follow-up survey. The table reportsobserved means or percentages for the treatment group, estimates of what the treatment group means or percentages would have been in the absence of Youth WINS, and regression-adjusted impact estimates (see Chapter II, Section A.4). We measured explanatory variables in the regression model prior to random assignment using data from the study’s baseline survey and SSA administrative records. We calculated allstatistics using sample weights to account for interview non-response. The analytic sample includes 413 treatment group youth and 337 control group youth. Survey item non-response may have resulted in smaller sample sizes for specific outcomes. See Appendix Table A.5 for sample sizes for all outcomes.
*/**/***Impact estimate is significantly different from zero at the .10/.05/.01 level using either a two-tailed t-test or achi-square test.
The intervention also had no impact on the intensity of training activities, as measured by the number of months that youth were enrolled in training programs during the year following random assignment. Treatment group youth were enrolled in training for less than one month, on average. We estimated that they would have had essentially the same duration in training in the absence of the intervention. Additionally, the distribution of months of enrollment in training was unaffected by the intervention.125
B. Youth WINS Had No Impact on a Composite Measure of Participation in Productive Activities
As a final exploratory analysis, we estimated the impact of Youth WINS on a composite measure of participation in productive activities―specifically, participation in education, training, and paid and unpaid employment.126 Youth who participated in any of these activities during the year
125 We calculated months of training from reported enrollment dates. The average months of training includes youth who did not participate in training (that is, zero months of training). We chose to group months of training in the same categories used for school enrollment (which were chosen to distinguish between a full academic year and less than an academic year). The training intensity measures do not include a small number of youth who participated in training but did not report information on the number of months of training. We chose not to use the multiple imputation procedure (see Appendix A, Section E) for the training intensity measures in this chapter due to the very small number of youth with missing information on these measures.
126 For youth under the age of 18, we collected information on participation in education and training programs from parents (or guardians). We collected employment information directly from youth of all ages.
114
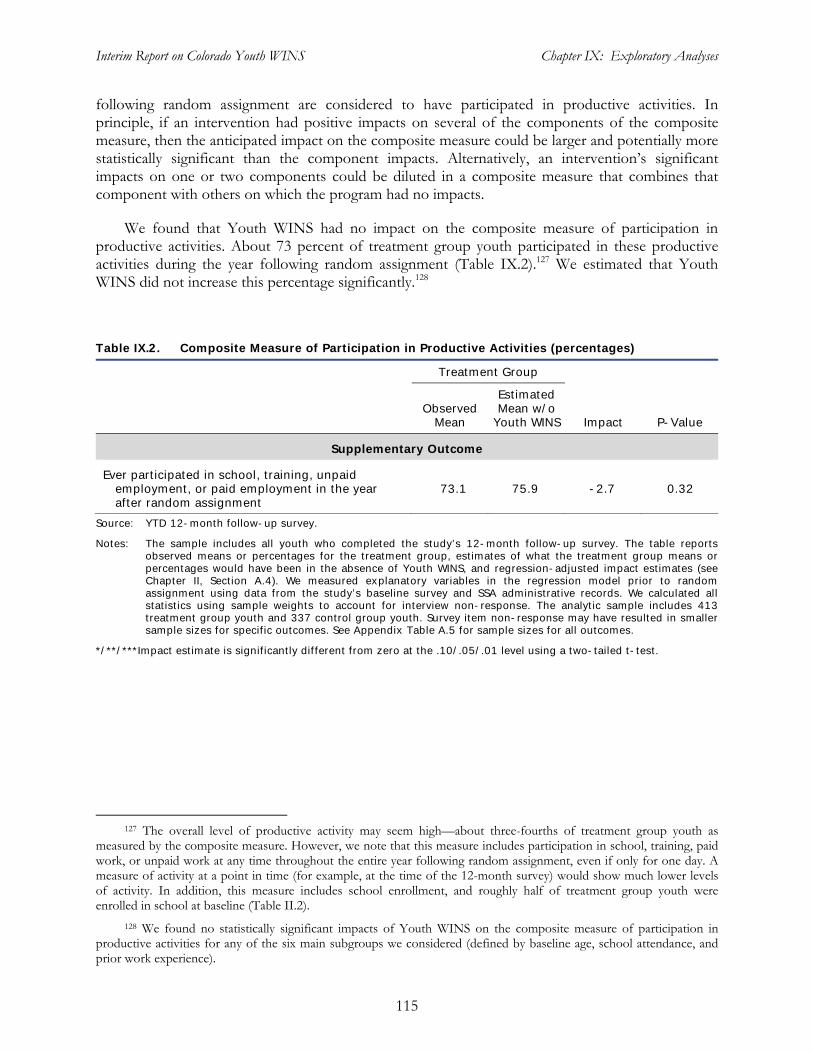
Interim Report on Colorado Youth WINS Chapter IX: Exploratory Analyses
following random assignment are considered to have participated in productive activities. In principle, if an intervention had positive impacts on several of the components of the composite measure, then the anticipated impact on the composite measure could be larger and potentially more statistically significant than the component impacts. Alternatively, an intervention’s significant impacts on one or two components could be diluted in a composite measure that combines that component with others on which the program had no impacts.
We found that Youth WINS had no impact on the composite measure of participation in productive activities. About 73 percent of treatment group youth participated in these productive activities during the year following random assignment (Table IX.2).127 We estimated that Youth WINS did not increase this percentage significantly.128
Table IX.2. Composite Measure of Participation in Productive Activities (percentages)
Treatment Group
Estimated Observed Mean w/o
Mean Youth WINS Impact P-Value
Supplementary Outcome
Ever participated in school, training, unpaid employment, or paid employment in the year 73.1 75.9 -2.7 0.32 after random assignment
Source: YTD 12-month follow-up survey.
Notes: The sample includes all youth who completed the study’s 12-month follow-up survey. The table reportsobserved means or percentages for the treatment group, estimates of what the treatment group means or percentages would have been in the absence of Youth WINS, and regression-adjusted impact estimates (see Chapter II, Section A.4). We measured explanatory variables in the regression model prior to random assignment using data from the study’s baseline survey and SSA administrative records. We calculated allstatistics using sample weights to account for interview non-response. The analytic sample includes 413 treatment group youth and 337 control group youth. Survey item non-response may have resulted in smaller sample sizes for specific outcomes. See Appendix Table A.5 for sample sizes for all outcomes.
*/**/***Impact estimate is significantly different from zero at the .10/.05/.01 level using a two-tailed t-test.
127 The overall level of productive activity may seem high—about three-fourths of treatment group youth as measured by the composite measure. However, we note that this measure includes participation in school, training, paid work, or unpaid work at any time throughout the entire year following random assignment, even if only for one day. A measure of activity at a point in time (for example, at the time of the 12-month survey) would show much lower levels of activity. In addition, this measure includes school enrollment, and roughly half of treatment group youth were enrolled in school at baseline (Table II.2).
128 We found no statistically significant impacts of Youth WINS on the composite measure of participation in productive activities for any of the six main subgroups we considered (defined by baseline age, school attendance, and prior work experience).
115

Interim Report on Colorado Youth WINS Chapter X: Conclusion
X. CONCLUSION
In this report, we present findings from process and impact analyses of the Colorado YTD project, Youth WINS. Through the process analysis, we found that Youth WINS, as implemented, deviated from the YTD program model in ways that may have reduced its potential to achieve certain critical YTD objectives. The impact analysis revealed that youth who had been randomly assigned to the study’s treatment group (and therefore were given the opportunity to participate in Youth WINS) received more services designed to promote employment than did youth who had been randomly assigned to the control group. However, we found no impacts on key measures of youth employment, income, and expectations during the year following random assignment.
Youth WINS had already been operating on a pilot basis for two years when SSA awarded the YTD evaluation contract to Mathematica. The Colorado project had a fully developed program model that emphasized individual case management and filling gaps in existing services but did not include a strong employment component. As a condition for its selection into the YTD random assignment evaluation, the management of Youth WINS agreed to strengthen the project’s employment component to make it consistent with the YTD program model. However, a philosophical commitment on the part of Youth WINS management and staff to the original project model was a persistent barrier to their modifying it to substantially increase the emphasis on employment. One manifestation of this was resistance by project management to technical assistance, which resulted in staff who were not well-trained to deliver individualized job development and placement services to youth with disabilities.
The dual management structure of Youth WINS (central management by Colorado WIN Partners in Denver and supervision of the I-Teams by the directors of four One-Stop Workforce Centers) may have facilitated the integration of the local projects with the Workforce Centers (where these projects were housed), but this structure also made it more difficult to resolve staff-related issues quickly. In particular, there were chronic staff vacancies on the I-Teams in three of the project sites. These vacancies may have contributed to the generally low intensity of services received by the treatment group members who enrolled in Youth WINS.
We estimated the impacts of Youth WINS in the year following random assignment on outcome measures in five domains. Within each domain, we based our principal conclusions on statistical results for a single primary outcome measure:
Employment-promoting services
- Primary outcome—receipt of any employment-promoting services
Paid employment
- Primary outcome—ever employed in a paid job
Education
- Primary outcome—ever enrolled in school during the year following random assignment, or had completed high school by the end of the year
Youth income
- Primary outcome—total income from earnings and benefits
117
Interim Report on Colorado Youth WINS Chapter X: Conclusion
Attitudes and expectations
- Primary outcome—goals include working and earning enough money to stop receiving SSA benefits
We found that Youth WINS increased by 12 percentage points the proportion of treatment group youth who received any employment-promoting services. However, the intervention had no significant impacts on the primary measures in the domains of paid employment, education, youth income, and attitudes and expectations during the year following random assignment. Even when we expanded the analysis to include supplementary outcome measures in these domains, we found no consistent patterns of impacts. Furthermore, these results were consistent across key subgroups of the full study sample, including youth who were in school or out of school at baseline and youth who were at least 18 years old or under age 18.
Two features of Youth WINS and its service environment contributed to the absence of impacts on key short-term outcome measures: (1) the critical employment component of the YTD program model was not well-implemented, and (2) key partner organizations were unable (largely due to budget cutbacks) to provide significant employment services to youth referred by the I-Teams. In this context, the one-year impact estimates for Youth WINS may be more revealing of the efficacy of a case management model of service delivery than the YTD program model.
It is important to recognize that this report has presented interim impact estimates based on just one of the six random assignment YTD projects and data pertaining to the first year in the evaluation’s multiyear follow-up period. Many of the youth who were participating in Youth WINS still were receiving project services when they completed the evaluation’s 12-month follow-up survey. Interim evaluation findings from the other five random assignment YTD projects will enable us to extend the initial assessments presented in this report. As planned, the projects vary in the mix and intensity of services, while broadly adhering to the YTD program model. We therefore expect that the full set of six interim evaluation reports will provide SSA with a better understanding of the challenges that youth with disabilities face in making transitions and the specific types of interventions that might assist more of them to succeed. Furthermore, the YTD evaluation’s comprehensive final report will present impact estimates based on 36 months of follow-up data from all six of the random assignment projects. Our analyses of those data may reveal longer-term impacts of Youth WINS in addition to the short-term impacts reported here.
118
Interim Report on Colorado Youth WINS References
REFERENCES
Baird, P., A. LeBlanc, T. Fraker, A. Ciemnecki, C. DeSimone, L. Guy, S. Muller-Ravett, and G. Tilson. “The Colorado Youth Transition Demonstration Project: Early Assessment Report.” Washington, DC: Mathematica Policy Research, April 2008.
Bjelland, M.J., W.A. Erickson, and C.G. Lee. “Disability Statistics from the American Community Survey (ACS).” Ithaca, NY: Cornell University Rehabilitation Research and Training Center on Disability Demographics and Statistics (StatsRRTC), November 2008.
Bloom, H. “Accounting for No-Shows in Experimental Evaluation Design.” Evaluation Review, vol. 8, 1984.
Carlin, J.B., J.C. Galati, and P. Royston. “New Framework for Managing and Analyzing Multiply Imputed Data.” Stata Journal, vol. 8, no. 1, 2008, pp. 49-67.
Elinson, L. and W.D. Frey. “Evaluation of Disability Employment Policy Demonstration Programs: Interim Progress Report.” Rockville, MD: Westat, June 2005. Available at [http://www.dol. gov/odep/categories/research/policy_programs.htm].
Emery, J., J. Friedman-Peremel, P. Pike, G. Livermore, D. Stapleton, and J. Kregel. “Colorado’s Disability Navigators and Systems Change Employment Initiatives: An Evaluation Report.” Denver, CO: Colorado WIN Partners, 2005.
Emery, J. and M.C. Bryan. “Disability Program Navigator Project Prospects for Systems Change-2005: Disability Implementation Maturity Model.” Denver, CO: Colorado WIN Partners, 2006.
Freedman, D. “On Regression Adjustments to Experimental Data.” University of California Statistics Department Working Paper. 2006. Available at [http://www.stat.berkeley. edu/~census/neyregr.pdf]. Accessed February 24, 2010.
Gresham, F.M. and S.N. Elliot. Social Skills Rating System Manual. Circle Pines, MN: American Guidance Service, 1990.
Harper, S. “Causes, Correlates, and the Functional Role of Global Self-Worth: A Life Span Perspective.” In Competence Considered, edited by R.J. Sternberg and J.J. Kooligian. New Haven, CT: Yale University Press, 1990, pp. 67-97.
Hertz, D. and K. Kosanovich. “Trends in Youth Employment: Data from the Current Population Survey.” Washington, DC: U.S. Bureau of Labor Statistics, 2000.
Hildebrand, L., L. Kosar, J. Page, M. Loewenberg, D. Phelps, and N. Hazelwood. “User’s Guide for the Ticket Research File: TRF08: Data from January 1994 to December 2008.” Washington, DC: Mathematica Policy Research, January 2010.
Livermore, G., A. Roche, and S. Prenovitz. “Work Activity and Use of Employment Supports Under the Original Ticket to Work Regulations: SSI and DI Beneficiaries with Work-Related Goals and Expectations.” Washington, DC: Mathematica Policy Research, October 2009a.
119
Interim Report on Colorado Youth WINS References
Livermore, G., D. Stapleton, and A. Roche. “Work Activity and Use of Employment Supports Under the Original Ticket to Work Regulations: Characteristics, Employment, and Sources of Support Among Working-Age SSI and DI Beneficiaries.” Washington, DC: Mathematica Policy Research, April 2009b.
Livermore, G., D.A. Wright, A. Roche, and E. Grau. “Work Activity and Use of Employment Supports Under the Original Ticket to Work Regulations: 2006 National Beneficiary Survey: Methodology and Descriptive Statistics.” Washington, DC: Mathematica Policy Research, October 2009c.
Loprest, P. and D. Wittenburg. “Choices, Challenges, and Options: Child SSI Recipients Preparing for the Transition to Adult Life.” Washington, DC: The Urban Institute, May 2005.
Loprest, P. and D. Wittenburg. “Post-Transition Experiences of Former Child SSI Recipients.” Social Service Review, vol. 81, no. 4, 2007, pp. 583-608.
Mank, D., A. Cioffi, and P. Yovanoff. “Supported Employment Outcomes Across a Decade: Is There Evidence of Improvement in the Quality of Implementation?” Mental Retardation, vol. 41, 2003, pp. 199-197.
Marsh, H.W., I.D. Smith, J. Barnes, and S. Butler. “Self-Concept: Reliability, Stability, Dimensionality, Validity, and the Measurement of Change.” Journal of Educational Psychology, vol. 75, 1983, pp. 772-790.
Martinez, J., M. Manno, P. Baird, T. Fraker, T. Honeycutt, A. Mamun, B. O’Day, and A. Rangarajan. “The Social Security Administration’s Youth Transition Demonstration Projects: Profiles of the Random Assignment Projects.” Princeton, NJ: Mathematica Policy Research, 2008.
Martinez, J., T. Fraker, M. Manno, P. Baird, A. Mamun, B. O’Day, A. Rangarajan, and D. Wittenburg. “The Social Security Administration’s Youth Transition Demonstration Projects: Implementation Lessons from the Original Projects.” Washington, DC: Mathematica Policy Research, 2010.
National Collaborative on Workforce and Disability for Youth. “Guideposts for Success.” Washington, DC: Institute on Education Leadership, 2005.
Pearlin, L.I. and C. Schooler. “The Structure of Coping.” Journal of Health and Social Behavior, vol. 19, no. 1, 1978, pp. 2-21.
Pike, P., N. Koester, and K. Alfson. “Colorado Youth WINS Local Process Evaluation.” Denver, CO: Colorado WIN Partners, 2010.
Puma, M.J., R.B. Olsen, S.H. Bell, and C. Price. “What to Do When Data Are Missing in Group Randomized Controlled Trials.” (NCEE 2009-0049). Washington, DC: National Center for Education Evaluation and Regional Assistance, Institute of Education Sciences, U.S. Department of Education, October 2009.
Rangarajan, A., L. Grossman, J. Martinez, T. Fraker, K. CyBulski, A. Ciemnecki, and G. Livermore. “Data Collection and Survey Plan for the Youth Transition Demonstration Evaluation.” Washington, DC: Mathematica Policy Research, 2007.
120
Interim Report on Colorado Youth WINS References
Rangarajan, A., T. Fraker, T. Honeycutt, A. Mamun, J. Martinez, B. O’Day, and D. Wittenburg. “SSA’s Youth Transition Demonstration Projects: Evaluation Design Report.” Princeton, NJ: Mathematica Policy Research, 2009a.
Rangarajan, A., D. Reed, A. Mamun, J. Martinez, and T. Fraker. “The Social Security Administration’s Youth Transition Demonstration Projects: Analysis Plan for Interim Reports.” Princeton, NJ: Mathematica Policy Research, 2009b.
Royston, P. “Multiple Imputation of Missing Values: Update of ICE.” Stata Journal, vol. 7, no. 4, 2007, pp. 445-464.
Royston, P., J.B. Carlin, and I.R. White. “Multiple Imputation of Missing Values: New Features for MIM.” Stata Journal, vol. 9, no. 2, 2009, pp. 252-264.
Schochet, P.Z. “Technical Methods Report: Guidelines for Multiple Testing in Impact Evaluations.” (NCEE 2008-4018). Washington, DC: National Center for Education Evaluation and Regional Assistance, Institute of Education Sciences, U.S. Department of Education, May 2008.
Schochet, P.Z. “Is Regression Adjustment Supported by the Neyman Model for Causal Inference?” Journal of Statistical Planning and Inference, vol. 140, January 2010, pp. 246-259.
Social Security Administration. “Annual Statistical Supplement to the Social Security Bulletin: 2008.” Washington, DC: Office of Retirement and Disability Policy, Social Security Administration, 2008a.
Social Security Administration. “SSI Recipients by State and County, 2008.” Washington, DC: Office of Retirement and Disability Policy, Social Security Administration, 2008b.
U.S. Census Bureau. “American Fact Finder: 2008 American Community Survey 1-Year Estimates.” Washington, DC: U.S. Census Bureau (on-line database).
U.S. Census Bureau, “American Fact Finder: 2006-2008 American Community Survey 3-Year Estimates.” Washington, DC: U.S. Census Bureau (on-line database).
U.S. Census Bureau. “Cumulative Estimates of Resident Population Change for the United States, States, Counties, Puerto Rico, and Puerto Rico Municipios: April 1, 2000 to July 1, 2008.” Washington, DC: U.S. Census Bureau, 2009.
Wagner, M., T.W. Cadwallader, C. Marder, R. Cameto, D. Cardoso, N. Garza, P. Levine, and L. Newman. “Life Outside the Classroom for Youth with Disabilities.” Menlo Park, CA: SRI International, 2003.
Wehman, P. Life Beyond the Classroom: Transition Strategies for Young People with Disabilities (4th ed.). Baltimore: Paul H. Brookes Publishing Co., 2006.
121


APPENDIX A
ADDITIONAL ANALYSES AND TECHNICAL DISCUSSION

Interim Report on Colorado Youth WINS Appendix A: Additional Analyses and Technical Discussion
In this appendix, we provide a detailed discussion of some of the analytic issues raised in Chapter II. We begin by examining baseline characteristics of youth who enrolled in the evaluation relative to those who did not, and of youth in the treatment group relative to those in the control group. We also provide simple unadjusted means for all outcome measures and compare impacts based on simple and regression-adjusted means for the primary outcomes. We then discuss response and non-response to the 12-month survey and our treatment of missing information for dependent and independent variables. In the final sections, we present monthly average benefit amounts for the annual periods before and following random assignment, examine outcomes for exploratory subgroups, and provide impact estimates for the component outcomes of the composite locus of control measures.
A. Characteristics of Youth Who Enrolled in the Evaluation
Although we attempted to contact a representative sample of youth in the Colorado counties served by Youth WINS, only about 30 percent of those were recruited into the study and randomly assigned to the treatment or control groups. Those not randomly assigned, and thus not in the study, included (1) youth we were unable to reach, (2) youth we reached but who were not interested in participating and did not complete a baseline interview, (3) youth who completed a baseline interview but did not return a signed consent form, and (4) youth who returned a signed consent form but did not want to participate in the study.
To understand more fully study participants’ characteristics compared to those of the project’s full target population, we used SSA administrative data to compare the characteristics of those who were recruited into the study to those who were not (Table A.1). Relative to youth who did not enroll, those who did enroll in the evaluation were more likely to be in the middle age range (ages 18 to 21). Enrollees also had a somewhat shorter duration of benefits receipt. A greater share of enrollees had a parental representative payee. Enrollees were less likely to have a mental illness and more likely to have a cognitive/developmental disability. A greater share of enrollees lived in Larimer County and a lesser share lived in Pueblo County.
Although differences between enrollees and non-enrollees are statistically significant for several baseline characteristics, the overall differences were not large. The comparisons suggest that, among eligible youth in Colorado, the YTD program enrolled a broad group of disability beneficiaries and not merely a distinctive subset. Moreover, enrollees and non-enrollees did not differ in terms of the amount of benefits received, the share with earnings in the year before random assignment, or the average amount of those earnings.129 We thus found no evidence that enrollees were a highly self-selected group. However, we suspect that Youth WINS proved most attractive to youth motivated to work in the future; for this reason, some self-selection on unobserved characteristics, such as motivation, likely occurred.130
129 The average earnings amount two years prior to random assignment was somewhat lower for enrollees: $830 for enrollees and $1,050 for non-enrollees (the difference of about $220 is statistically significant at the 10 percent level). However, the difference in share of youth with earnings two years prior to random assignment was only three percentage points and not statistically significant. There were no significant differences in employment or earnings three years prior to random assignment (values for two and three years prior to random assignment based on administrative records from the MEF; not shown in Table A.1).
130 In future years, we can use administrative data to examine trends in work and earnings for enrollees and non-enrollees. At the time of this writing, administrative data on earnings are not available for the period after random assignment.
A.1
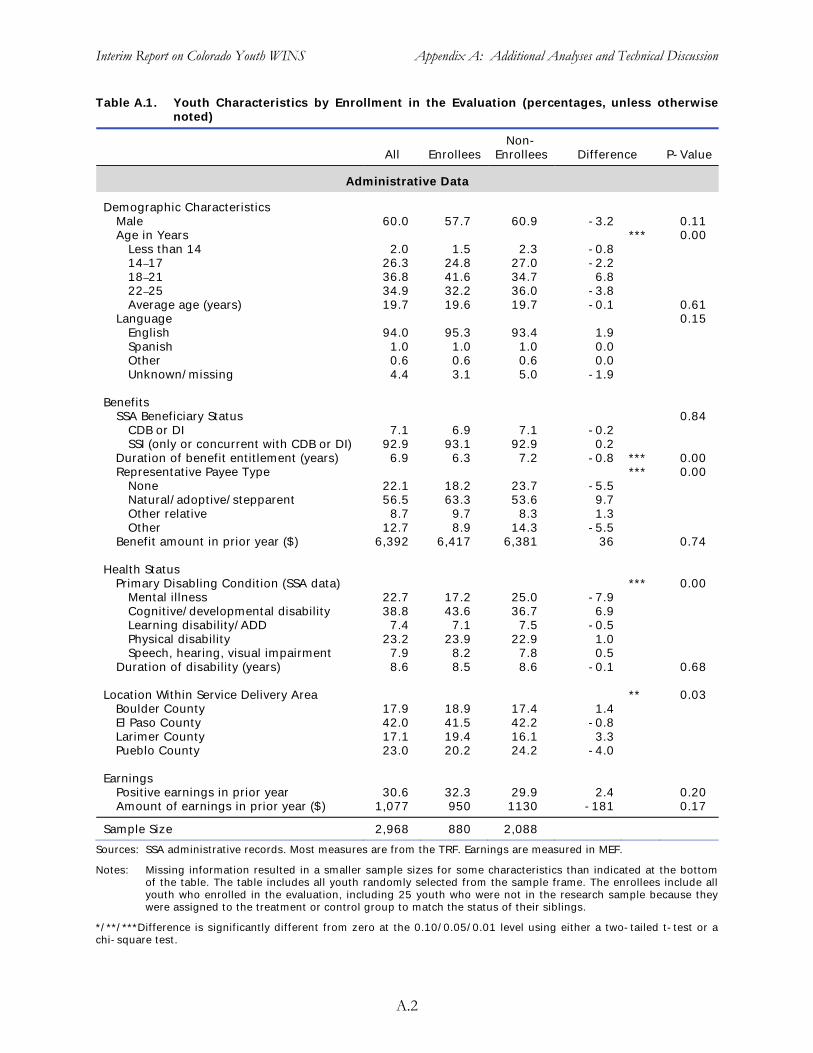
Interim Report on Colorado Youth WINS Appendix A: Additional Analyses and Technical Discussion
Table A.1. Youth Characteristics by Enrollment in the Evaluation (percentages, unless otherwisenoted)
Non-All Enrollees Enrollees Difference P-Value
Administrative Data
Demographic CharacteristicsMale 60.0 57.7 60.9 -3.2 0.11 Age in Years *** 0.00
Less than 14 2.0 1.5 2.3 -0.8 14–17 26.3 24.8 27.0 -2.2 18–21 36.8 41.6 34.7 6.8 22–25 34.9 32.2 36.0 -3.8 Average age (years) 19.7 19.6 19.7 -0.1 0.61
Language 0.15 English 94.0 95.3 93.4 1.9 Spanish 1.0 1.0 1.0 0.0 Other 0.6 0.6 0.6 0.0 Unknown/missing 4.4 3.1 5.0 -1.9
Benefits SSA Beneficiary Status 0.84
CDB or DI 7.1 6.9 7.1 -0.2 SSI (only or concurrent with CDB or DI) 92.9 93.1 92.9 0.2
Duration of benefit entitlement (years) 6.9 6.3 7.2 -0.8 *** 0.00 Representative Payee Type *** 0.00
None 22.1 18.2 23.7 -5.5 Natural/adoptive/stepparent 56.5 63.3 53.6 9.7 Other relative 8.7 9.7 8.3 1.3 Other 12.7 8.9 14.3 -5.5
Benefit amount in prior year ($) 6,392 6,417 6,381 36 0.74
Health Status Primary Disabling Condition (SSA data) *** 0.00
Mental illness 22.7 17.2 25.0 -7.9 Cognitive/developmental disability 38.8 43.6 36.7 6.9 Learning disability/ADD 7.4 7.1 7.5 -0.5 Physical disability 23.2 23.9 22.9 1.0 Speech, hearing, visual impairment 7.9 8.2 7.8 0.5
Duration of disability (years) 8.6 8.5 8.6 -0.1 0.68
Location Within Service Delivery Area ** 0.03 Boulder County 17.9 18.9 17.4 1.4 El Paso County 42.0 41.5 42.2 -0.8 Larimer County 17.1 19.4 16.1 3.3 Pueblo County 23.0 20.2 24.2 -4.0
EarningsPositive earnings in prior year 30.6 32.3 29.9 2.4 0.20 Amount of earnings in prior year ($) 1,077 950 1130 -181 0.17
Sample Size 2,968 880 2,088
Sources: SSA administrative records. Most measures are from the TRF. Earnings are measured in MEF.
Notes: Missing information resulted in a smaller sample sizes for some characteristics than indicated at the bottom of the table. The table includes all youth randomly selected from the sample frame. The enrollees include all youth who enrolled in the evaluation, including 25 youth who were not in the research sample because they were assigned to the treatment or control group to match the status of their siblings.
*/**/***Difference is significantly different from zero at the 0.10/0.05/0.01 level using either a two-tailed t-test or a chi-square test.
A.2
Interim Report on Colorado Youth WINS Appendix A: Additional Analyses and Technical Discussion
The share of youth with earnings in the year prior to random assignment may seem fairly high to readers familiar with employment among adults with disabilities: 32 percent for enrollees and 30 percent for non-enrollees (based on administrative records, Table A.1). These rates do not seem remarkably high for young people. For comparison, we examined national employment rates for youth ages 16 to 20 who had a disability and found overall employment rates of 28.131
B. Baseline Equivalence
We examined the baseline characteristics of the treatment and control groups to assess the equivalence of the samples before youths’ participation in the evaluation. Most important, we assessed baseline equivalence in the analytic sample, which is the sample of all respondents to the 12-month follow-up survey and the source of most outcome measures. In Chapter II (Table II.2), we discuss the baseline equivalence for the analytic sample for several characteristics. In Table A.2, we show the treatment and control groups were similar at baseline for several additional characteristics.132
We also examined baseline characteristics for the research sample, which is the full sample of youth randomized into the treatment and control groups, including those who did not respond to the 12-month follow-up survey.133 We found that the two groups were highly similar at baseline, with two more statistically significant differences than we found for the analytic sample (Table A.3). For the research sample (but not for the analytic sample), we found that youth in the treatment group were more likely to report that they worked for pay in the last year and less likely to report they expected to live independently in the future (differences significant at the 10 percent level).
The degree of difference between the treatment and control groups was about what we would expect due to chance. For example, of 50 baseline characteristics we investigated, we would expect about five characteristics to be statistically different at the 10 percent significance level or lower. We found statistically significant differences at the 10 percent level or lower for five characteristics in the analytic sample and seven characteristics in the research sample.
131 The national employment rate reported here is from the American Community Survey, as reported by Bjelland et al. (2008). We found similar employment rates for YTD youth in Erie (31 percent in the overall sample in both Colorado and Erie). We found lower employment rates for YTD youth Bronx County (just over 10 percent), perhaps reflecting the greater share of youth under age 18 in that YTD project. We have not yet analyzed baseline employment for the other three YTD projects.
132 In addition, for the analytic and research samples, we found no statistically significant differences between treatment and control group youth in employment or earnings for the three years before random assignment (based on administrative records from the MEF; not shown in Tables A.2 and A.3).
133 For the research sample, which includes non-respondents to the 12-month follow-up survey, we can estimate impacts only for outcomes in administrative data (Appendix A, Section D).
A.3
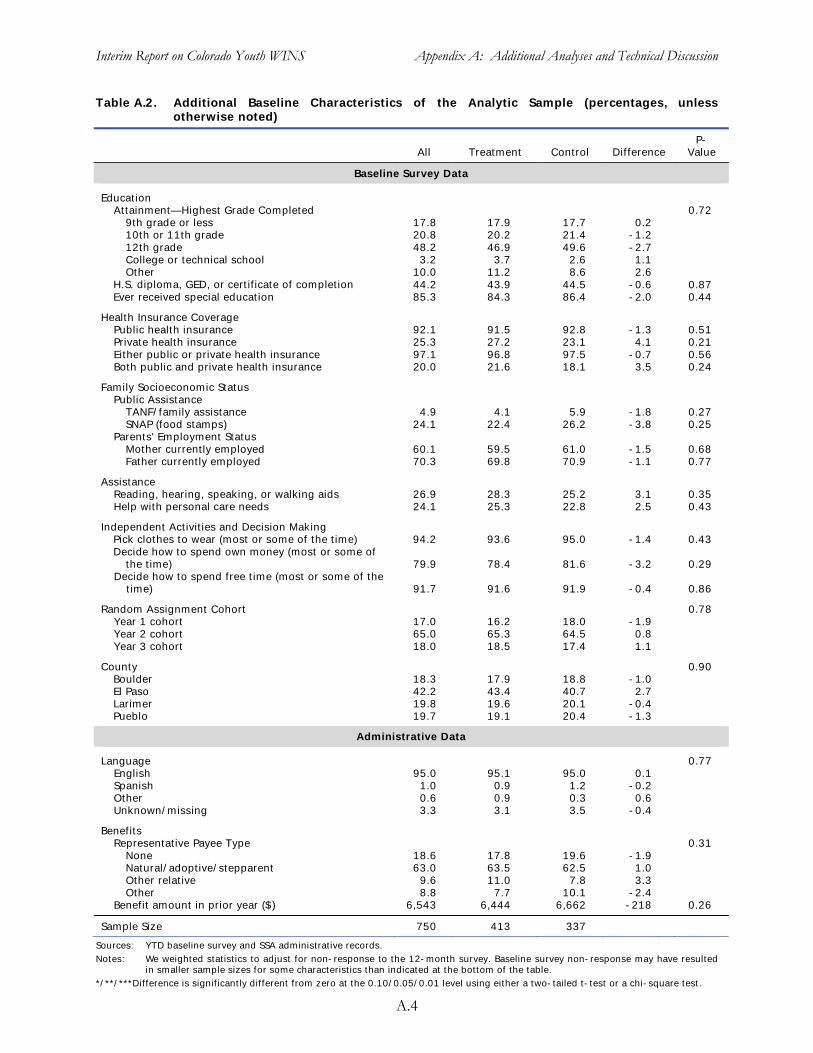
Interim Report on Colorado Youth WINS Appendix A: Additional Analyses and Technical Discussion
Table A.2. Additional Baseline otherwise noted)
Characteristics of the Analytic Sample (percentages, unless
P-All Treatment Control Difference Value
Baseline Survey Data
Education Attainment—Highest Grade Completed 0.72
9th grade or less 17.8 17.9 17.7 0.2 10th or 11th grade 20.8 20.2 21.4 -1.2 12th grade 48.2 46.9 49.6 -2.7 College or technical school 3.2 3.7 2.6 1.1 Other 10.0 11.2 8.6 2.6
H.S. diploma, GED, or certificate of completion 44.2 43.9 44.5 -0.6 0.87 Ever received special education 85.3 84.3 86.4 -2.0 0.44
Health Insurance CoveragePublic health insurance 92.1 91.5 92.8 -1.3 0.51 Private health insurance 25.3 27.2 23.1 4.1 0.21 Either public or private health insurance 97.1 96.8 97.5 -0.7 0.56 Both public and private health insurance 20.0 21.6 18.1 3.5 0.24
Family Socioeconomic StatusPublic Assistance
TANF/family assistance 4.9 4.1 5.9 -1.8 0.27 SNAP (food stamps) 24.1 22.4 26.2 -3.8 0.25
Parents' Employment Status Mother currently employed 60.1 59.5 61.0 -1.5 0.68 Father currently employed 70.3 69.8 70.9 -1.1 0.77
Assistance Reading, hearing, speaking, or walking aids 26.9 28.3 25.2 3.1 0.35 Help with personal care needs 24.1 25.3 22.8 2.5 0.43
Independent Activities and Decision MakingPick clothes to wear (most or some of the time) 94.2 93.6 95.0 -1.4 0.43 Decide how to spend own money (most or some of
the time) 79.9 78.4 81.6 -3.2 0.29 Decide how to spend free time (most or some of the
time) 91.7 91.6 91.9 -0.4 0.86
Random Assignment Cohort 0.78 Year 1 cohort 17.0 16.2 18.0 -1.9 Year 2 cohort 65.0 65.3 64.5 0.8 Year 3 cohort 18.0 18.5 17.4 1.1
County 0.90 Boulder 18.3 17.9 18.8 -1.0 El Paso 42.2 43.4 40.7 2.7 Larimer 19.8 19.6 20.1 -0.4 Pueblo 19.7 19.1 20.4 -1.3
Administrative Data
Language 0.77 English 95.0 95.1 95.0 0.1 Spanish 1.0 0.9 1.2 -0.2 Other 0.6 0.9 0.3 0.6 Unknown/missing 3.3 3.1 3.5 -0.4
Benefits Representative Payee Type 0.31
None 18.6 17.8 19.6 -1.9 Natural/adoptive/stepparent 63.0 63.5 62.5 1.0 Other relative 9.6 11.0 7.8 3.3 Other 8.8 7.7 10.1 -2.4
Benefit amount in prior year ($) 6,543 6,444 6,662 -218 0.26
Sample Size 750 413 337
Sources: YTD baseline survey and SSA administrative records. Notes: We weighted statistics to adjust for non-response to the 12-month survey. Baseline survey non-response may have resulted
in smaller sample sizes for some characteristics than indicated at the bottom of the table.*/**/***Difference is significantly different from zero at the 0.10/0.05/0.01 level using either a two-tailed t-test or a chi-square test.
A.4
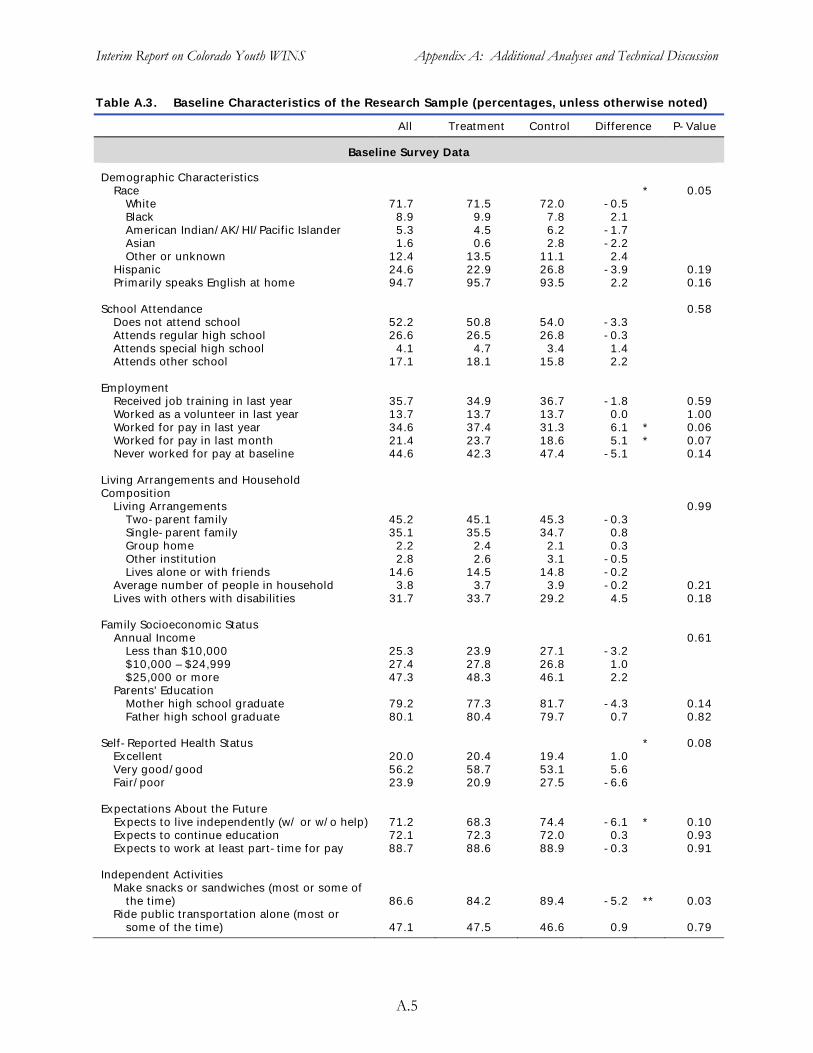
Interim Report on Colorado Youth WINS Appendix A: Additional Analyses and Technical Discussion
Table A.3. Baseline Characteristics of the Research Sample (percentages, unless otherwise noted)
All Treatment Control Difference P-Value
Baseline Survey Data
Demographic Characteristics Race * 0.05
White 71.7 71.5 72.0 -0.5 Black 8.9 9.9 7.8 2.1 American Indian/AK/HI/Pacific Islander 5.3 4.5 6.2 -1.7 Asian 1.6 0.6 2.8 -2.2 Other or unknown 12.4 13.5 11.1 2.4
Hispanic 24.6 22.9 26.8 -3.9 0.19 Primarily speaks English at home 94.7 95.7 93.5 2.2 0.16
School Attendance 0.58 Does not attend school 52.2 50.8 54.0 -3.3 Attends regular high school 26.6 26.5 26.8 -0.3 Attends special high school 4.1 4.7 3.4 1.4 Attends other school 17.1 18.1 15.8 2.2
EmploymentReceived job training in last year 35.7 34.9 36.7 -1.8 0.59 Worked as a volunteer in last year 13.7 13.7 13.7 0.0 1.00 Worked for pay in last year 34.6 37.4 31.3 6.1 * 0.06 Worked for pay in last month 21.4 23.7 18.6 5.1 * 0.07 Never worked for pay at baseline 44.6 42.3 47.4 -5.1 0.14
Living Arrangements and Household Composition
Living Arrangements 0.99 Two-parent family 45.2 45.1 45.3 -0.3 Single-parent family 35.1 35.5 34.7 0.8 Group home 2.2 2.4 2.1 0.3 Other institution 2.8 2.6 3.1 -0.5 Lives alone or with friends 14.6 14.5 14.8 -0.2
Average number of people in household 3.8 3.7 3.9 -0.2 0.21 Lives with others with disabilities 31.7 33.7 29.2 4.5 0.18
Family Socioeconomic StatusAnnual Income 0.61
Less than $10,000 25.3 23.9 27.1 -3.2 $10,000 – $24,999 27.4 27.8 26.8 1.0 $25,000 or more 47.3 48.3 46.1 2.2
Parents' Education Mother high school graduate 79.2 77.3 81.7 -4.3 0.14 Father high school graduate 80.1 80.4 79.7 0.7 0.82
Self-Reported Health Status * 0.08 Excellent 20.0 20.4 19.4 1.0 Very good/good 56.2 58.7 53.1 5.6 Fair/poor 23.9 20.9 27.5 -6.6
Expectations About the Future Expects to live independently (w/ or w/o help) 71.2 68.3 74.4 -6.1 * 0.10 Expects to continue education 72.1 72.3 72.0 0.3 0.93 Expects to work at least part-time for pay 88.7 88.6 88.9 -0.3 0.91
Independent Activities Make snacks or sandwiches (most or some of
the time) 86.6 84.2 89.4 -5.2 ** 0.03 Ride public transportation alone (most or
some of the time) 47.1 47.5 46.6 0.9 0.79
A.5
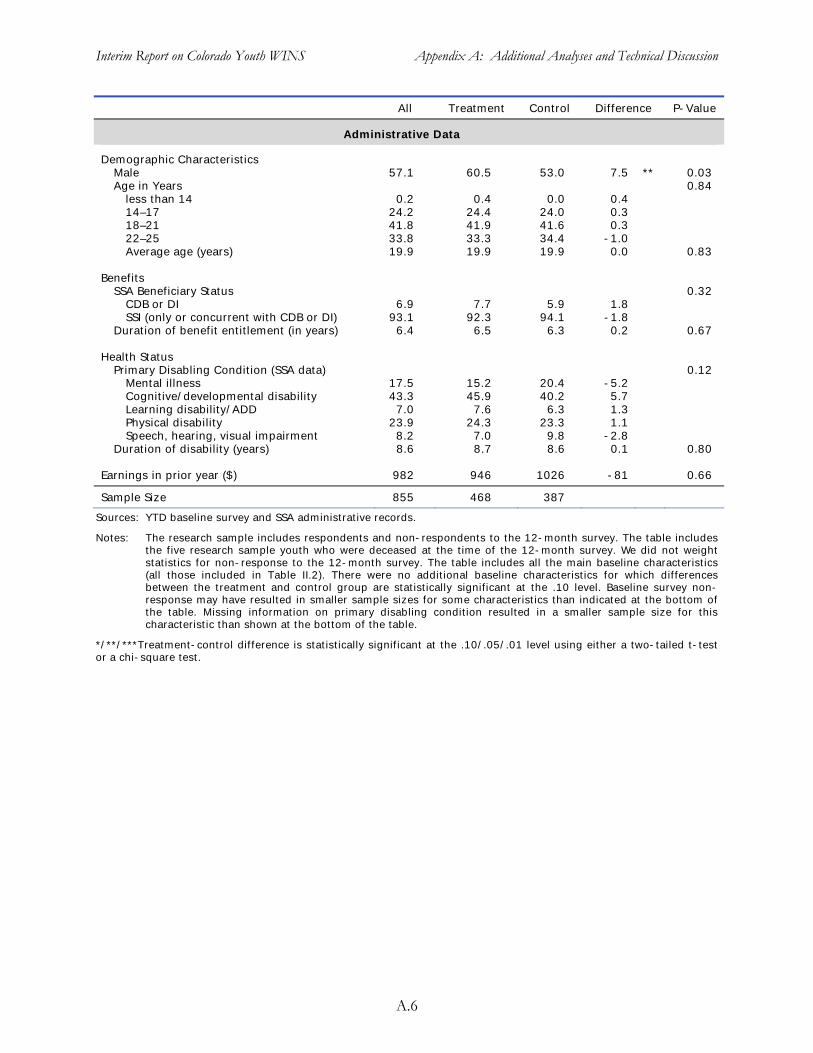
Interim Report on Colorado Youth WINS Appendix A: Additional Analyses and Technical Discussion
All Treatment Control Difference P-Value
Administrative Data
Demographic Characteristics Male 57.1 60.5 53.0 7.5 ** 0.03 Age in Years 0.84
less than 14 0.2 0.4 0.0 0.4 14–17 24.2 24.4 24.0 0.3 18–21 41.8 41.9 41.6 0.3 22–25 33.8 33.3 34.4 -1.0 Average age (years) 19.9 19.9 19.9 0.0 0.83
Benefits SSA Beneficiary Status 0.32
CDB or DI 6.9 7.7 5.9 1.8 SSI (only or concurrent with CDB or DI) 93.1 92.3 94.1 -1.8
Duration of benefit entitlement (in years) 6.4 6.5 6.3 0.2 0.67
Health Status Primary Disabling Condition (SSA data) 0.12
Mental illness 17.5 15.2 20.4 -5.2 Cognitive/developmental disability 43.3 45.9 40.2 5.7 Learning disability/ADD 7.0 7.6 6.3 1.3 Physical disability 23.9 24.3 23.3 1.1 Speech, hearing, visual impairment 8.2 7.0 9.8 -2.8
Duration of disability (years) 8.6 8.7 8.6 0.1 0.80
Earnings in prior year ($) 982 946 1026 -81 0.66
Sample Size 855 468 387
Sources: YTD baseline survey and SSA administrative records.
Notes: The research sample includes respondents and non-respondents to the 12-month survey. The table includesthe five research sample youth who were deceased at the time of the 12-month survey. We did not weight statistics for non-response to the 12-month survey. The table includes all the main baseline characteristics(all those included in Table II.2). There were no additional baseline characteristics for which differencesbetween the treatment and control group are statistically significant at the .10 level. Baseline survey non-response may have resulted in smaller sample sizes for some characteristics than indicated at the bottom ofthe table. Missing information on primary disabling condition resulted in a smaller sample size for thischaracteristic than shown at the bottom of the table.
*/**/***Treatment-control difference is statistically significant at the .10/.05/.01 level using either a two-tailed t-testor a chi-square test.
A.6
Interim Report on Colorado Youth WINS Appendix A: Additional Analyses and Technical Discussion
C. Comparison of Means and Regression-Adjusted Means
In the text, we report regression-adjusted impact estimates. We estimated the regressions by using ordinary least squares (OLS) for continuous variables, logistic regression for binary variables, and multinomial logistic regression for categorical variables.134 The regression adjustments control for small differences in baseline characteristics between the treatment and control groups. In addition, the regression-adjusted approach tends to yield more precise estimates—that is, estimates with smaller standard errors—thereby providing greater statistical power to detect small impacts. In Table A.4, we list the variables in the regression models.135
Some recent concern has suggested that the use of OLS multivariate regression models may not always be justified for impact estimation, even with the availability of control variables with significant power to explain the variation in outcome measures (Freedman 2006). Freedman’s argument is that multivariate models, under some circumstances, may lead to biases in the standard errors of impact estimates. Schochet (2010) examined data from several large-scale random assignment evaluations and found that, in practice, regression adjustments did not lead to biases in the standard errors of impact estimates. In general, as long as there is a fairly even split in the sample between treatment and control groups, the regression-adjusted estimates do not lead to biases in the standard errors of impact estimates. The Youth WINS analytic sample is only slightly unbalanced (55 percent treatment group) and so should not introduce significant issues with respect to regression-based standard errors.
To provide a relevant reference point for understanding the regression-adjusted impact estimates, we report the observed mean (or percentage) for the treatment group in the text tables.136
This provides a reference mean (or percentage) for the outcome for youth who had the opportunity to participate in Youth WINS. We also report the estimated mean (or percentage) for the treatment group in the absence of Youth WINS. We computed this estimated mean as the observed treatment group mean less the estimated regression-adjusted impact. For most important outcome measures, the unadjusted control group means (Table A.5) do not differ substantially from the estimated means for the treatment group in the absence of Youth WINS (Chapters IV through IX). In reporting impact estimates, we provide a note whenever a statistically significant impact would differ substantially in proportional terms if considered relative to the observed control group mean rather than to the estimated mean for the treatment group in the absence of Youth WINS. In Table A.5, we provide the simple mean impact estimates for all outcomes.
134 For the logistic and multinomial logistic regressions, we computed the estimated impact as the difference between the estimated outcome if all sample youth were in the treatment group (that is, the predicted value with the treatment dummy equal to one) less the estimated outcome if all sample youth were in the control group (that is, the predicted value with the treatment dummy equal to zero). The reported p-value for the estimated impact is the p-value on the treatment dummy in the regression model.
135 The control variables in the regression model were chosen, in part, to include characteristics for which the baseline difference between treatment and control groups was substantial and/or statistically significant. The regression model used here for Youth WINS is largely the same as the model used for the interim analysis of Erie Transition WORKS. For Transition WORKS, we added an indicator for completion of high school (or GED or certificate) due to the five percentage point higher value among control youth compared to treatment youth (the difference is not statistically significant).
136 All continuous variables without a specified range (for example, earnings has no specified range, but number of months of service receipt has a range of 0 to 12) were top-coded by assigning the value of the 98th percentile to the highest two percent of observations.
A.7
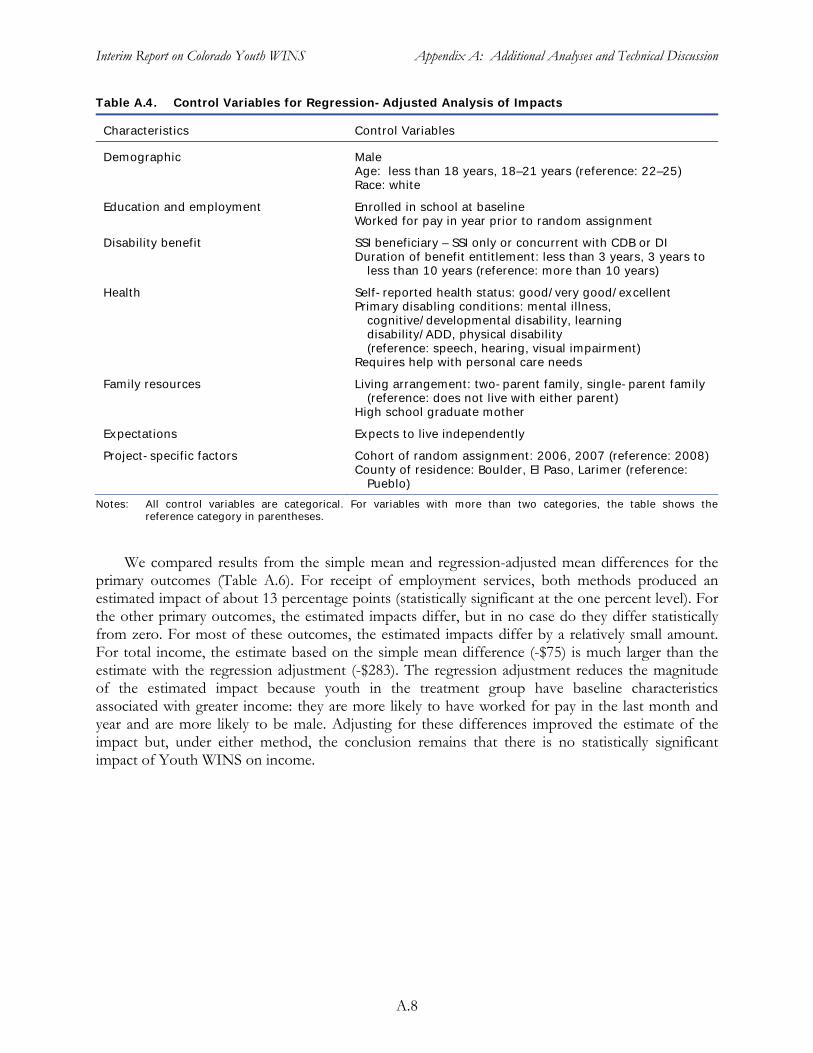
Interim Report on Colorado Youth WINS Appendix A: Additional Analyses and Technical Discussion
Table A.4. Control Variables for Regression-Adjusted Analysis of Impacts
Characteristics Control Variables
Demographic Male Age: less than 18 years, 18–21 years (reference: 22–25)
Race: white
Education and employment Enrolled in school at baseline Worked for pay in year prior to random assignment
Disability benefit SSI beneficiary – SSI only or concurrent with CDB or DIDuration of benefit entitlement: less than 3 years, 3 years to
less than 10 years (reference: more than 10 years)
Health Self-reported health status: good/very good/excellent Primary disabling conditions: mental illness,
cognitive/developmental disability, learningdisability/ADD, physical disability(reference: speech, hearing, visual impairment)
Requires help with personal care needs
Family resources Living arrangement: two-parent family, single-parent family(reference: does not live with either parent)
High school graduate mother
Expectations Expects to live independently
Project-specific factors Cohort of random assignment: 2006, 2007 (reference: 2008) County of residence: Boulder, El Paso, Larimer (reference:
Pueblo)
Notes: All control variables are categorical. For variables with more than two categories, the table shows the reference category in parentheses.
We compared results from the simple mean and regression-adjusted mean differences for the primary outcomes (Table A.6). For receipt of employment services, both methods produced an estimated impact of about 13 percentage points (statistically significant at the one percent level). For the other primary outcomes, the estimated impacts differ, but in no case do they differ statistically from zero. For most of these outcomes, the estimated impacts differ by a relatively small amount. For total income, the estimate based on the simple mean difference (-$75) is much larger than the estimate with the regression adjustment (-$283). The regression adjustment reduces the magnitude of the estimated impact because youth in the treatment group have baseline characteristics associated with greater income: they are more likely to have worked for pay in the last month and year and are more likely to be male. Adjusting for these differences improved the estimate of the impact but, under either method, the conclusion remains that there is no statistically significant impact of Youth WINS on income.
A.8
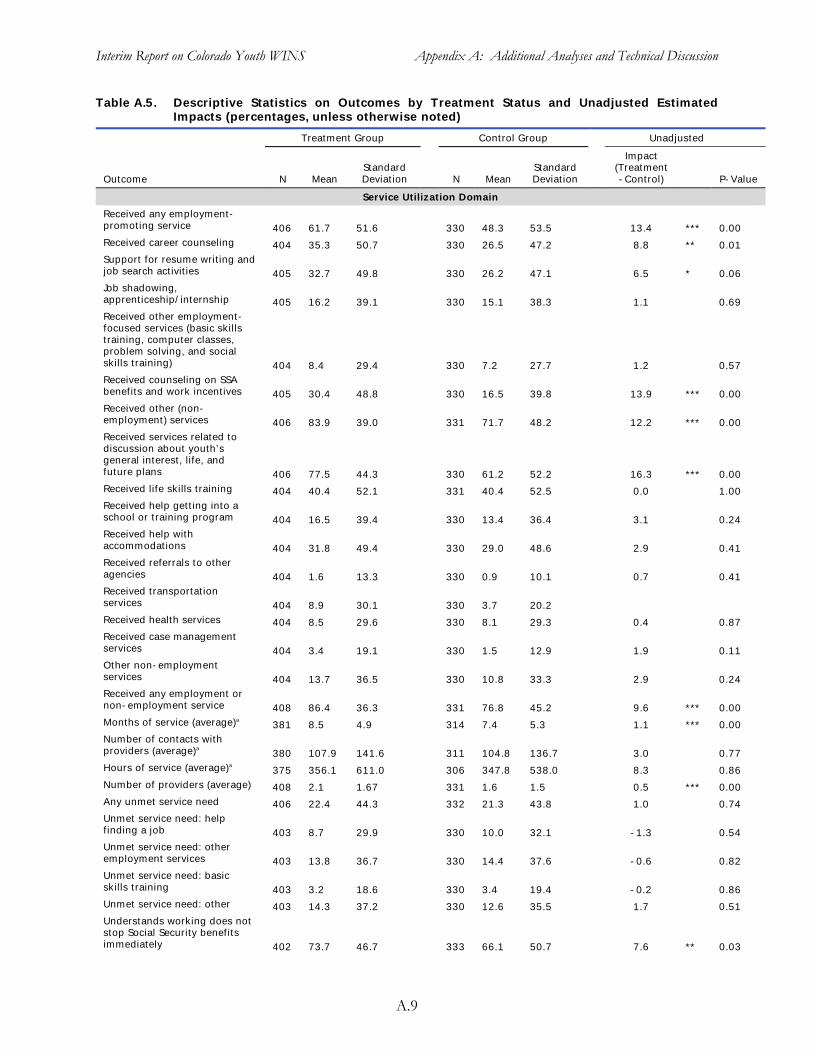
Interim Report on Colorado Youth WINS Appendix A: Additional Analyses and Technical Discussion
Table A.5. Descriptive Statistics on Outcomes by Treatment Status and Unadjusted Estimated Impacts (percentages, unless otherwise noted)
Treatment Group Control Group Unadjusted
ImpactStandard Standard (Treatment
Outcome N Mean Deviation N Mean Deviation -Control) P-Value
Service Utilization Domain
Received any employment-promoting service 406 61.7 51.6 330 48.3 53.5 13.4 *** 0.00 Received career counseling 404 35.3 50.7 330 26.5 47.2 8.8 ** 0.01 Support for resume writing and job search activities 405 32.7 49.8 330 26.2 47.1 6.5 * 0.06 Job shadowing,apprenticeship/internship 405 16.2 39.1 330 15.1 38.3 1.1 0.69 Received other employment-focused services (basic skills training, computer classes, problem solving, and social skills training) 404 8.4 29.4 330 7.2 27.7 1.2 0.57 Received counseling on SSA benefits and work incentives 405 30.4 48.8 330 16.5 39.8 13.9 *** 0.00 Received other (nonemployment) services 406 83.9 39.0 331 71.7 48.2 12.2 *** 0.00 Received services related to discussion about youth’sgeneral interest, life, and future plans 406 77.5 44.3 330 61.2 52.2 16.3 *** 0.00 Received life skills training 404 40.4 52.1 331 40.4 52.5 0.0 1.00 Received help getting into a school or training program 404 16.5 39.4 330 13.4 36.4 3.1 0.24 Received help with accommodations 404 31.8 49.4 330 29.0 48.6 2.9 0.41 Received referrals to other agencies 404 1.6 13.3 330 0.9 10.1 0.7 0.41 Received transportationservices 404 8.9 30.1 330 3.7 20.2 Received health services 404 8.5 29.6 330 8.1 29.3 0.4 0.87 Received case managementservices 404 3.4 19.1 330 1.5 12.9 1.9 0.11 Other non-employmentservices 404 13.7 36.5 330 10.8 33.3 2.9 0.24 Received any employment or non-employment service 408 86.4 36.3 331 76.8 45.2 9.6 *** 0.00 Months of service (average)a
381 8.5 4.9 314 7.4 5.3 1.1 *** 0.00 Number of contacts with providers (average)a
380 107.9 141.6 311 104.8 136.7 3.0 0.77 Hours of service (average)a
375 356.1 611.0 306 347.8 538.0 8.3 0.86 Number of providers (average) 408 2.1 1.67 331 1.6 1.5 0.5 *** 0.00 Any unmet service need 406 22.4 44.3 332 21.3 43.8 1.0 0.74 Unmet service need: helpfinding a job 403 8.7 29.9 330 10.0 32.1 -1.3 0.54 Unmet service need: other employment services 403 13.8 36.7 330 14.4 37.6 -0.6 0.82 Unmet service need: basic skills training 403 3.2 18.6 330 3.4 19.4 -0.2 0.86 Unmet service need: other 403 14.3 37.2 330 12.6 35.5 1.7 0.51 Understands working does not stop Social Security benefits immediately 402 73.7 46.7 333 66.1 50.7 7.6 ** 0.03
A.9
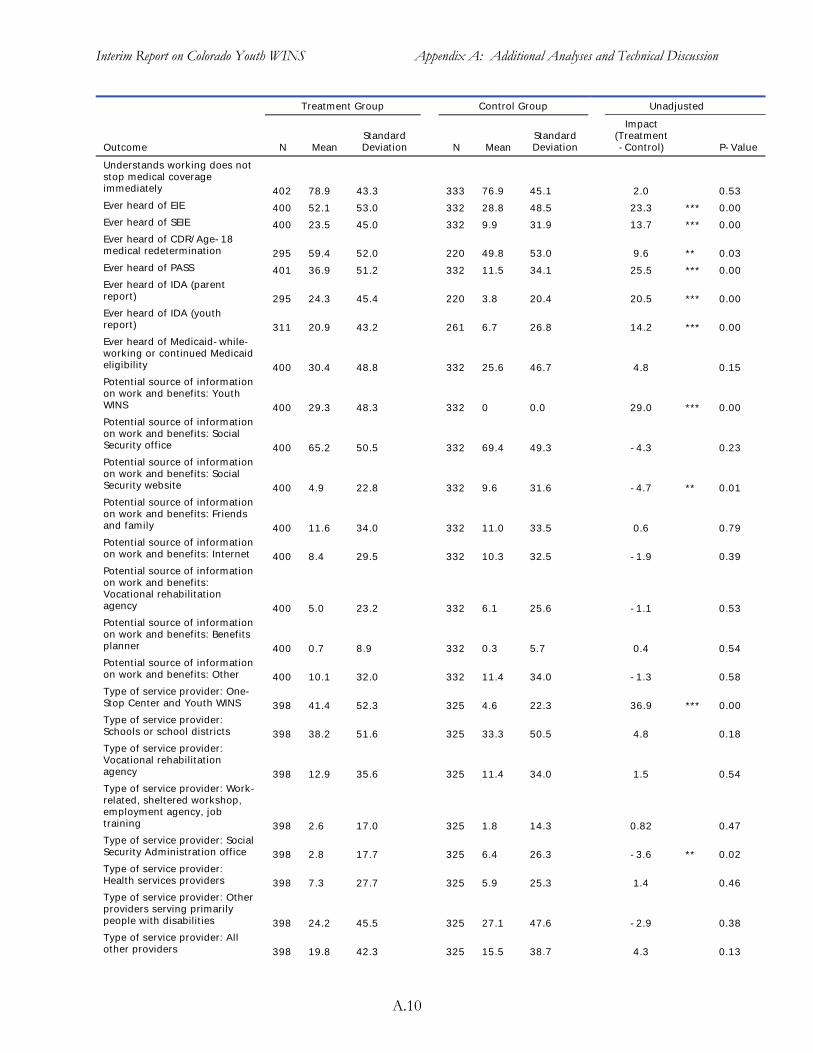
Interim Report on Colorado Youth WINS Appendix A: Additional Analyses and Technical Discussion
Treatment Group Control Group Unadjusted
ImpactStandard Standard (Treatment
Outcome N Mean Deviation N Mean Deviation -Control) P-Value
Understands working does not stop medical coverage immediately 402 78.9 43.3 333 76.9 45.1 2.0 0.53 Ever heard of EIE 400 52.1 53.0 332 28.8 48.5 23.3 *** 0.00 Ever heard of SEIE 400 23.5 45.0 332 9.9 31.9 13.7 *** 0.00 Ever heard of CDR/Age-18 medical redetermination 295 59.4 52.0 220 49.8 53.0 9.6 ** 0.03 Ever heard of PASS 401 36.9 51.2 332 11.5 34.1 25.5 *** 0.00 Ever heard of IDA (parent report) 295 24.3 45.4 220 3.8 20.4 20.5 *** 0.00 Ever heard of IDA (youthreport) 311 20.9 43.2 261 6.7 26.8 14.2 *** 0.00 Ever heard of Medicaid-whileworking or continued Medicaid eligibility 400 30.4 48.8 332 25.6 46.7 4.8 0.15 Potential source of information on work and benefits: Youth WINS 400 29.3 48.3 332 0 0.0 29.0 *** 0.00 Potential source of information on work and benefits: Social Security office 400 65.2 50.5 332 69.4 49.3 -4.3 0.23 Potential source of information on work and benefits: Social Security website 400 4.9 22.8 332 9.6 31.6 -4.7 ** 0.01 Potential source of information on work and benefits: Friends and family 400 11.6 34.0 332 11.0 33.5 0.6 0.79 Potential source of information on work and benefits: Internet 400 8.4 29.5 332 10.3 32.5 -1.9 0.39 Potential source of information on work and benefits: Vocational rehabilitation agency 400 5.0 23.2 332 6.1 25.6 -1.1 0.53 Potential source of information on work and benefits: Benefits planner 400 0.7 8.9 332 0.3 5.7 0.4 0.54 Potential source of information on work and benefits: Other 400 10.1 32.0 332 11.4 34.0 -1.3 0.58 Type of service provider: One-Stop Center and Youth WINS 398 41.4 52.3 325 4.6 22.3 36.9 *** 0.00 Type of service provider: Schools or school districts 398 38.2 51.6 325 33.3 50.5 4.8 0.18 Type of service provider: Vocational rehabilitation agency 398 12.9 35.6 325 11.4 34.0 1.5 0.54 Type of service provider: Work-related, sheltered workshop,employment agency, job training 398 2.6 17.0 325 1.8 14.3 0.82 0.47 Type of service provider: Social Security Administration office 398 2.8 17.7 325 6.4 26.3 -3.6 ** 0.02 Type of service provider: Health services providers 398 7.3 27.7 325 5.9 25.3 1.4 0.46 Type of service provider: Other providers serving primarily people with disabilities 398 24.2 45.5 325 27.1 47.6 -2.9 0.38 Type of service provider: All other providers 398 19.8 42.3 325 15.5 38.7 4.3 0.13
A.10
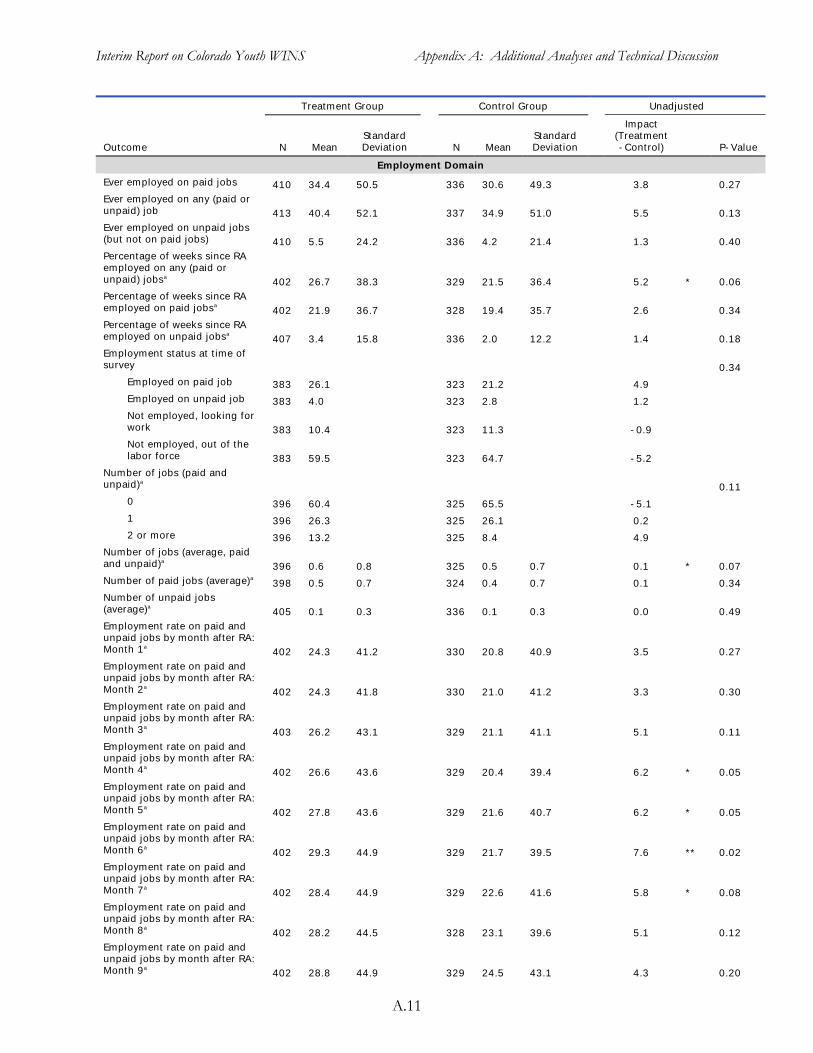
Interim Report on Colorado Youth WINS Appendix A: Additional Analyses and Technical Discussion
Treatment Group Control Group Unadjusted
ImpactStandard Standard (Treatment
Outcome N Mean Deviation N Mean Deviation -Control) P-Value
Employment Domain
Ever employed on paid jobs 410 34.4 50.5 336 30.6 49.3 3.8 0.27 Ever employed on any (paid or unpaid) job 413 40.4 52.1 337 34.9 51.0 5.5 0.13 Ever employed on unpaid jobs(but not on paid jobs) 410 5.5 24.2 336 4.2 21.4 1.3 0.40 Percentage of weeks since RA employed on any (paid or unpaid) jobsa
402 26.7 38.3 329 21.5 36.4 5.2 * 0.06 Percentage of weeks since RA employed on paid jobsa
402 21.9 36.7 328 19.4 35.7 2.6 0.34 Percentage of weeks since RA employed on unpaid jobsa
407 3.4 15.8 336 2.0 12.2 1.4 0.18 Employment status at time ofsurvey 0.34
Employed on paid job 383 26.1 323 21.2 4.9
Employed on unpaid job 383 4.0 323 2.8 1.2
Not employed, looking forwork 383 10.4 323 11.3 -0.9
Not employed, out of the labor force 383 59.5 323 64.7 -5.2
Number of jobs (paid and unpaid)a
0.11 0 396 60.4 325 65.5 -5.1
1 396 26.3 325 26.1 0.2
2 or more 396 13.2 325 8.4 4.9 Number of jobs (average, paidand unpaid)a
396 0.6 0.8 325 0.5 0.7 0.1 * 0.07 Number of paid jobs (average)a
398 0.5 0.7 324 0.4 0.7 0.1 0.34 Number of unpaid jobs(average)a
405 0.1 0.3 336 0.1 0.3 0.0 0.49 Employment rate on paid and unpaid jobs by month after RA:Month 1a
402 24.3 41.2 330 20.8 40.9 3.5 0.27 Employment rate on paid and unpaid jobs by month after RA:Month 2a
402 24.3 41.8 330 21.0 41.2 3.3 0.30 Employment rate on paid and unpaid jobs by month after RA:Month 3a
403 26.2 43.1 329 21.1 41.1 5.1 0.11 Employment rate on paid and unpaid jobs by month after RA:Month 4a
402 26.6 43.6 329 20.4 39.4 6.2 * 0.05 Employment rate on paid and unpaid jobs by month after RA:Month 5a
402 27.8 43.6 329 21.6 40.7 6.2 * 0.05 Employment rate on paid and unpaid jobs by month after RA:Month 6a
402 29.3 44.9 329 21.7 39.5 7.6 ** 0.02 Employment rate on paid and unpaid jobs by month after RA:Month 7a
402 28.4 44.9 329 22.6 41.6 5.8 * 0.08 Employment rate on paid and unpaid jobs by month after RA:Month 8a
402 28.2 44.5 328 23.1 39.6 5.1 0.12 Employment rate on paid and unpaid jobs by month after RA:Month 9a
402 28.8 44.9 329 24.5 43.1 4.3 0.20
A.11
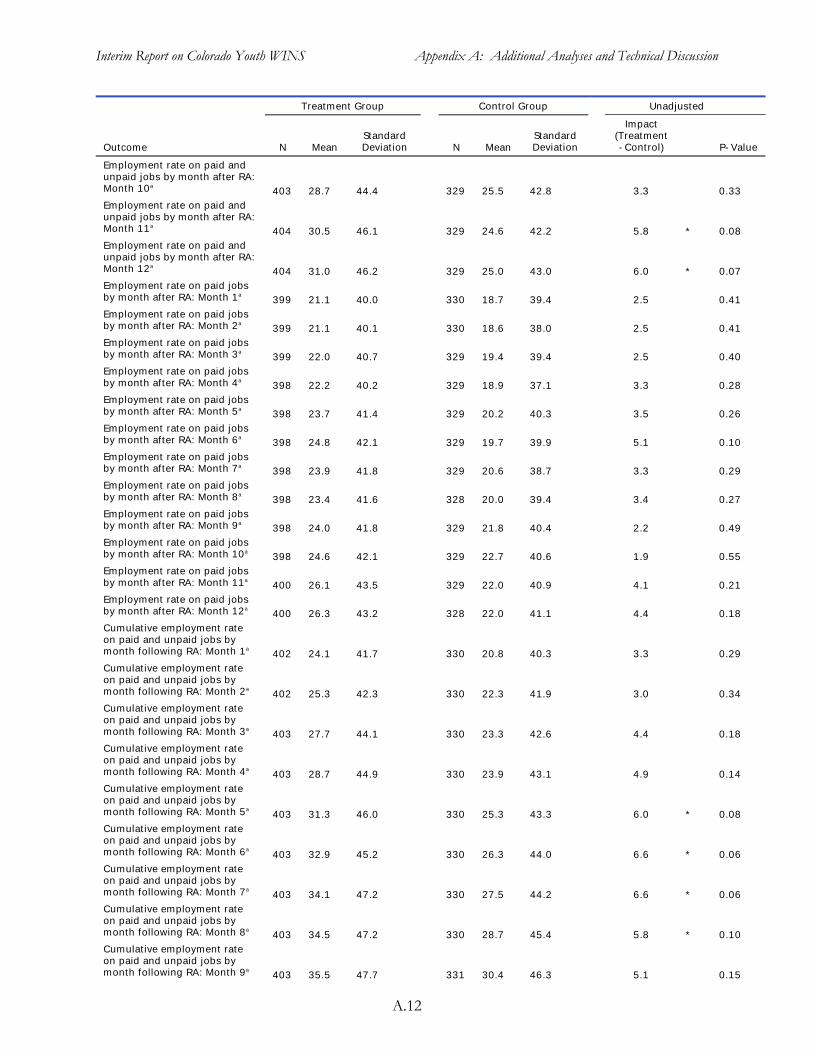
Interim Report on Colorado Youth WINS Appendix A: Additional Analyses and Technical Discussion
Treatment Group Control Group Unadjusted
ImpactStandard Standard (Treatment
Outcome N Mean Deviation N Mean Deviation -Control) P-Value
Employment rate on paid and unpaid jobs by month after RA:Month 10a
403 28.7 44.4 329 25.5 42.8 3.3 0.33 Employment rate on paid and unpaid jobs by month after RA:Month 11a
404 30.5 46.1 329 24.6 42.2 5.8 * 0.08 Employment rate on paid and unpaid jobs by month after RA:Month 12a
404 31.0 46.2 329 25.0 43.0 6.0 * 0.07 Employment rate on paid jobsby month after RA: Month 1a
399 21.1 40.0 330 18.7 39.4 2.5 0.41 Employment rate on paid jobsby month after RA: Month 2a
399 21.1 40.1 330 18.6 38.0 2.5 0.41 Employment rate on paid jobsby month after RA: Month 3a
399 22.0 40.7 329 19.4 39.4 2.5 0.40 Employment rate on paid jobsby month after RA: Month 4a
398 22.2 40.2 329 18.9 37.1 3.3 0.28 Employment rate on paid jobsby month after RA: Month 5a
398 23.7 41.4 329 20.2 40.3 3.5 0.26 Employment rate on paid jobsby month after RA: Month 6a
398 24.8 42.1 329 19.7 39.9 5.1 0.10 Employment rate on paid jobsby month after RA: Month 7a
398 23.9 41.8 329 20.6 38.7 3.3 0.29 Employment rate on paid jobsby month after RA: Month 8a
398 23.4 41.6 328 20.0 39.4 3.4 0.27 Employment rate on paid jobsby month after RA: Month 9a
398 24.0 41.8 329 21.8 40.4 2.2 0.49 Employment rate on paid jobsby month after RA: Month 10a
398 24.6 42.1 329 22.7 40.6 1.9 0.55 Employment rate on paid jobsby month after RA: Month 11a
400 26.1 43.5 329 22.0 40.9 4.1 0.21 Employment rate on paid jobsby month after RA: Month 12a
400 26.3 43.2 328 22.0 41.1 4.4 0.18 Cumulative employment rateon paid and unpaid jobs bymonth following RA: Month 1a
402 24.1 41.7 330 20.8 40.3 3.3 0.29 Cumulative employment rateon paid and unpaid jobs bymonth following RA: Month 2a
402 25.3 42.3 330 22.3 41.9 3.0 0.34 Cumulative employment rateon paid and unpaid jobs bymonth following RA: Month 3a
403 27.7 44.1 330 23.3 42.6 4.4 0.18 Cumulative employment rateon paid and unpaid jobs bymonth following RA: Month 4a
403 28.7 44.9 330 23.9 43.1 4.9 0.14 Cumulative employment rateon paid and unpaid jobs bymonth following RA: Month 5a
403 31.3 46.0 330 25.3 43.3 6.0 * 0.08 Cumulative employment rateon paid and unpaid jobs bymonth following RA: Month 6a
403 32.9 45.2 330 26.3 44.0 6.6 * 0.06 Cumulative employment rateon paid and unpaid jobs bymonth following RA: Month 7a
403 34.1 47.2 330 27.5 44.2 6.6 * 0.06 Cumulative employment rateon paid and unpaid jobs bymonth following RA: Month 8a
403 34.5 47.2 330 28.7 45.4 5.8 * 0.10 Cumulative employment rateon paid and unpaid jobs bymonth following RA: Month 9a
403 35.5 47.7 331 30.4 46.3 5.1 0.15
A.12
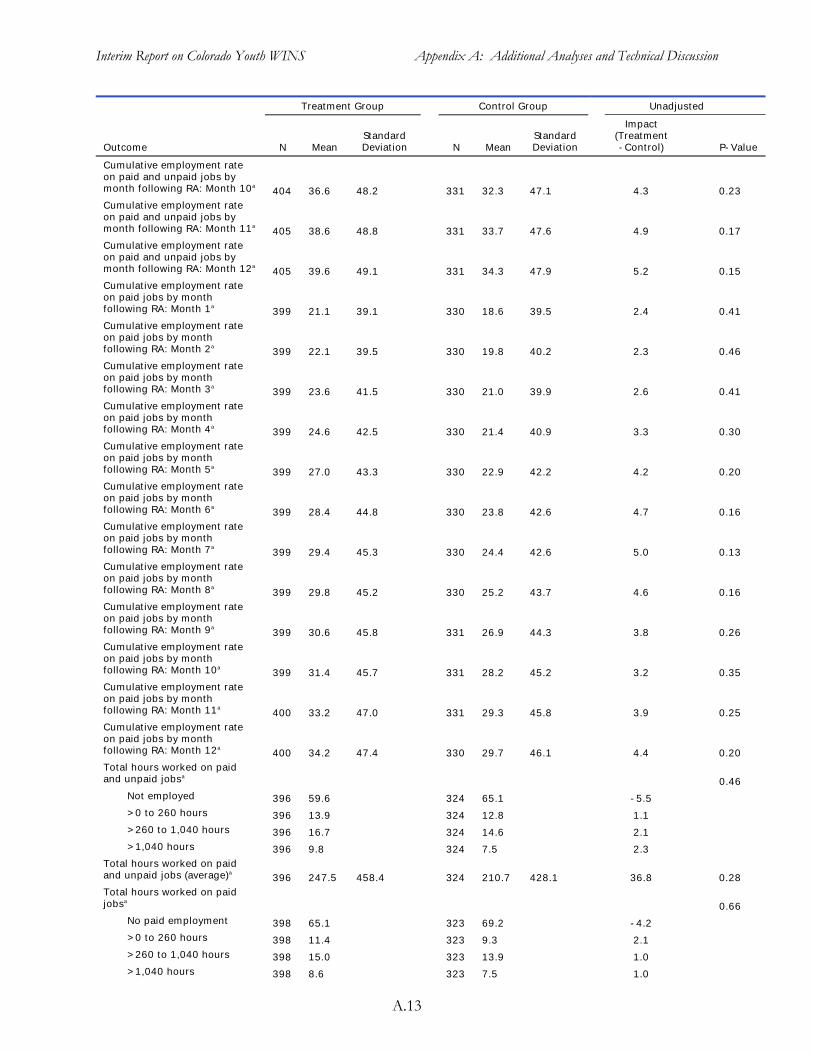
Interim Report on Colorado Youth WINS Appendix A: Additional Analyses and Technical Discussion
Treatment Group Control Group Unadjusted
Outcome N Mean Standard Deviation N Mean
Standard Deviation
Impact(Treatment-Control) P-Value
Cumulative employment rateon paid and unpaid jobs bymonth following RA: Month 10a
404 36.6 48.2 331 32.3 47.1 4.3 0.23 Cumulative employment rateon paid and unpaid jobs bymonth following RA: Month 11a
405 38.6 48.8 331 33.7 47.6 4.9 0.17 Cumulative employment rateon paid and unpaid jobs bymonth following RA: Month 12a
405 39.6 49.1 331 34.3 47.9 5.2 0.15 Cumulative employment rateon paid jobs by month following RA: Month 1a
399 21.1 39.1 330 18.6 39.5 2.4 0.41 Cumulative employment rateon paid jobs by month following RA: Month 2a
399 22.1 39.5 330 19.8 40.2 2.3 0.46 Cumulative employment rateon paid jobs by month following RA: Month 3a
399 23.6 41.5 330 21.0 39.9 2.6 0.41 Cumulative employment rateon paid jobs by month following RA: Month 4a
399 24.6 42.5 330 21.4 40.9 3.3 0.30 Cumulative employment rateon paid jobs by month following RA: Month 5a
399 27.0 43.3 330 22.9 42.2 4.2 0.20 Cumulative employment rateon paid jobs by month following RA: Month 6a
399 28.4 44.8 330 23.8 42.6 4.7 0.16 Cumulative employment rateon paid jobs by month following RA: Month 7a
399 29.4 45.3 330 24.4 42.6 5.0 0.13 Cumulative employment rateon paid jobs by month following RA: Month 8a
399 29.8 45.2 330 25.2 43.7 4.6 0.16 Cumulative employment rateon paid jobs by month following RA: Month 9a
399 30.6 45.8 331 26.9 44.3 3.8 0.26 Cumulative employment rateon paid jobs by month following RA: Month 10a
399 31.4 45.7 331 28.2 45.2 3.2 0.35 Cumulative employment rateon paid jobs by month following RA: Month 11a
400 33.2 47.0 331 29.3 45.8 3.9 0.25 Cumulative employment rateon paid jobs by month following RA: Month 12a
400 34.2 47.4 330 29.7 46.1 4.4 0.20 Total hours worked on paid and unpaid jobsa
0.46 Not employed 396 59.6 324 65.1 -5.5 >0 to 260 hours 396 13.9 324 12.8 1.1 >260 to 1,040 hours 396 16.7 324 14.6 2.1 >1,040 hours 396 9.8 324 7.5 2.3
Total hours worked on paid and unpaid jobs (average)a
396 247.5 458.4 324 210.7 428.1 36.8 0.28 Total hours worked on paid jobsa
0.66 No paid employment 398 65.1 323 69.2 -4.2 >0 to 260 hours 398 11.4 323 9.3 2.1 >260 to 1,040 hours 398 15.0 323 13.9 1.0 >1,040 hours 398 8.6 323 7.5 1.0
A.13
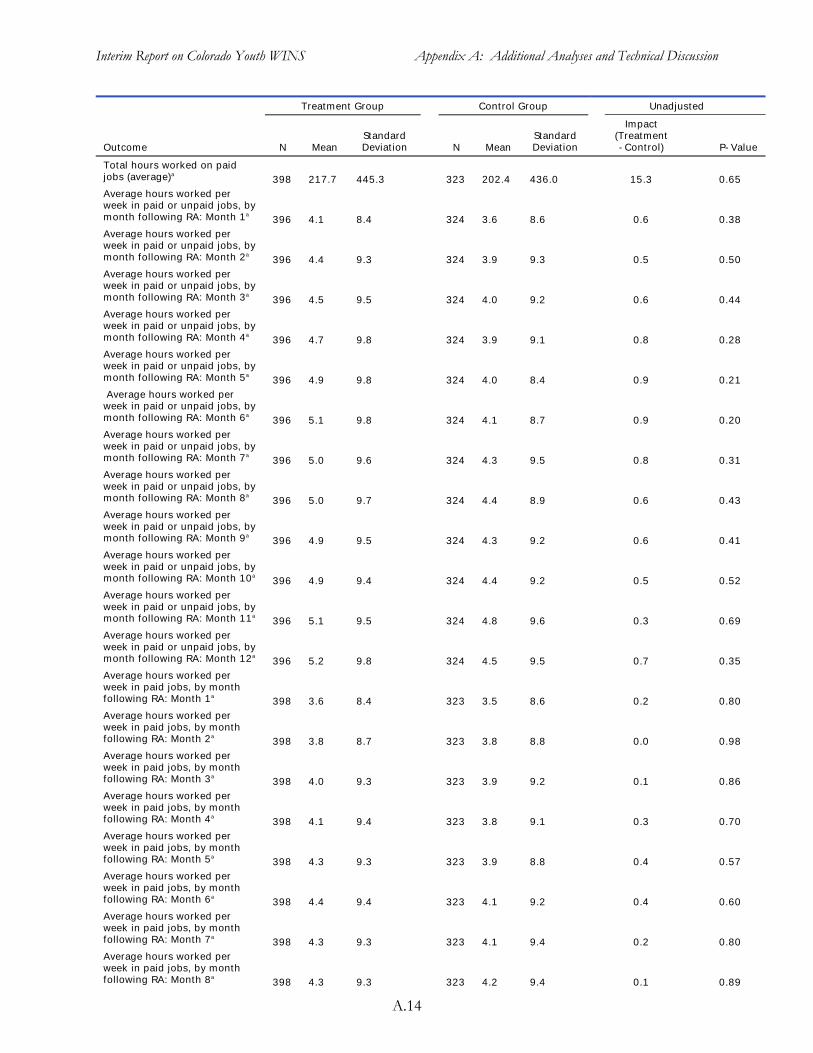
Interim Report on Colorado Youth WINS Appendix A: Additional Analyses and Technical Discussion
Treatment Group Control Group Unadjusted
Outcome N Mean Standard Deviation N Mean
Standard Deviation
Impact(Treatment-Control) P-Value
Total hours worked on paid jobs (average)a
398 217.7 445.3 323 202.4 436.0 15.3 0.65 Average hours worked per week in paid or unpaid jobs, by month following RA: Month 1a
396 4.1 8.4 324 3.6 8.6 0.6 0.38 Average hours worked per week in paid or unpaid jobs, by month following RA: Month 2a
396 4.4 9.3 324 3.9 9.3 0.5 0.50 Average hours worked per week in paid or unpaid jobs, by month following RA: Month 3a
396 4.5 9.5 324 4.0 9.2 0.6 0.44 Average hours worked per week in paid or unpaid jobs, by month following RA: Month 4a
396 4.7 9.8 324 3.9 9.1 0.8 0.28 Average hours worked per week in paid or unpaid jobs, by month following RA: Month 5a
396 4.9 9.8 324 4.0 8.4 0.9 0.21 Average hours worked per week in paid or unpaid jobs, by month following RA: Month 6a
396 5.1 9.8 324 4.1 8.7 0.9 0.20 Average hours worked per week in paid or unpaid jobs, by month following RA: Month 7a
396 5.0 9.6 324 4.3 9.5 0.8 0.31 Average hours worked per week in paid or unpaid jobs, by month following RA: Month 8a
396 5.0 9.7 324 4.4 8.9 0.6 0.43 Average hours worked per week in paid or unpaid jobs, by month following RA: Month 9a
396 4.9 9.5 324 4.3 9.2 0.6 0.41 Average hours worked per week in paid or unpaid jobs, by month following RA: Month 10a
396 4.9 9.4 324 4.4 9.2 0.5 0.52 Average hours worked per week in paid or unpaid jobs, by month following RA: Month 11a
396 5.1 9.5 324 4.8 9.6 0.3 0.69 Average hours worked per week in paid or unpaid jobs, by month following RA: Month 12a
396 5.2 9.8 324 4.5 9.5 0.7 0.35 Average hours worked per week in paid jobs, by monthfollowing RA: Month 1a
398 3.6 8.4 323 3.5 8.6 0.2 0.80 Average hours worked per week in paid jobs, by monthfollowing RA: Month 2a
398 3.8 8.7 323 3.8 8.8 0.0 0.98 Average hours worked per week in paid jobs, by monthfollowing RA: Month 3a
398 4.0 9.3 323 3.9 9.2 0.1 0.86 Average hours worked per week in paid jobs, by monthfollowing RA: Month 4a
398 4.1 9.4 323 3.8 9.1 0.3 0.70 Average hours worked per week in paid jobs, by monthfollowing RA: Month 5a
398 4.3 9.3 323 3.9 8.8 0.4 0.57 Average hours worked per week in paid jobs, by monthfollowing RA: Month 6a
398 4.4 9.4 323 4.1 9.2 0.4 0.60 Average hours worked per week in paid jobs, by monthfollowing RA: Month 7a
398 4.3 9.3 323 4.1 9.4 0.2 0.80 Average hours worked per week in paid jobs, by monthfollowing RA: Month 8a
398 4.3 9.3 323 4.2 9.4 0.1 0.89
A.14
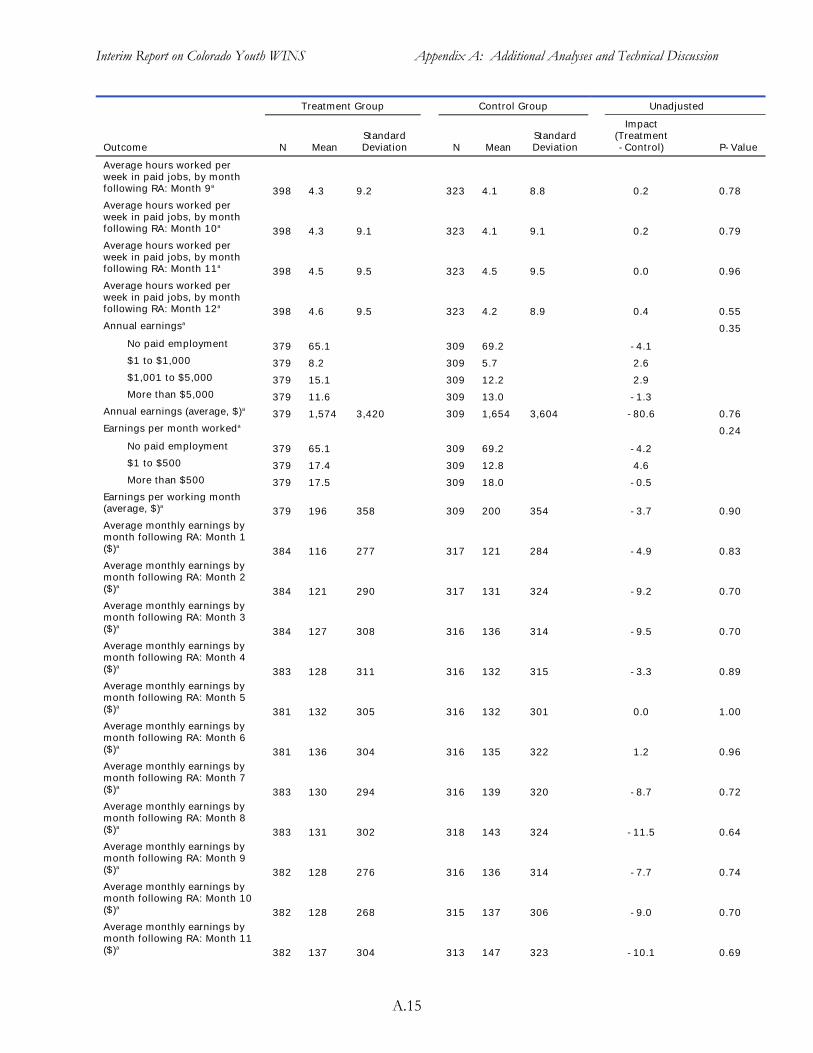
Interim Report on Colorado Youth WINS Appendix A: Additional Analyses and Technical Discussion
Treatment Group Control Group Unadjusted
Outcome N Mean Standard Deviation N Mean
Standard Deviation
Impact(Treatment-Control) P-Value
Average hours worked per week in paid jobs, by monthfollowing RA: Month 9a
398 4.3 9.2 323 4.1 8.8 0.2 0.78 Average hours worked per week in paid jobs, by monthfollowing RA: Month 10a
398 4.3 9.1 323 4.1 9.1 0.2 0.79 Average hours worked per week in paid jobs, by monthfollowing RA: Month 11a
398 4.5 9.5 323 4.5 9.5 0.0 0.96 Average hours worked per week in paid jobs, by monthfollowing RA: Month 12a
398 4.6 9.5 323 4.2 8.9 0.4 0.55 Annual earningsa
0.35
No paid employment 379 65.1 309 69.2 -4.1 $1 to $1,000 379 8.2 309 5.7 2.6 $1,001 to $5,000 379 15.1 309 12.2 2.9 More than $5,000 379 11.6 309 13.0 -1.3
Annual earnings (average, $)a
Earnings per month workeda
379 1,574 3,420 309 1,654 3,604 -80.6 0.76
0.24
No paid employment 379 65.1 309 69.2 -4.2 $1 to $500 379 17.4 309 12.8 4.6 More than $500 379 17.5 309 18.0 -0.5
Earnings per working month (average, $)a
379 196 358 309 200 354 -3.7 0.90 Average monthly earnings bymonth following RA: Month 1($)a
384 116 277 317 121 284 -4.9 0.83 Average monthly earnings bymonth following RA: Month 2($)a
384 121 290 317 131 324 -9.2 0.70 Average monthly earnings bymonth following RA: Month 3($)a
384 127 308 316 136 314 -9.5 0.70 Average monthly earnings bymonth following RA: Month 4($)a
383 128 311 316 132 315 -3.3 0.89 Average monthly earnings bymonth following RA: Month 5($)a
381 132 305 316 132 301 0.0 1.00 Average monthly earnings bymonth following RA: Month 6($)a
381 136 304 316 135 322 1.2 0.96 Average monthly earnings bymonth following RA: Month 7($)a
383 130 294 316 139 320 -8.7 0.72 Average monthly earnings bymonth following RA: Month 8($)a
383 131 302 318 143 324 -11.5 0.64 Average monthly earnings bymonth following RA: Month 9($)a
382 128 276 316 136 314 -7.7 0.74 Average monthly earnings bymonth following RA: Month 10($)a
382 128 268 315 137 306 -9.0 0.70 Average monthly earnings bymonth following RA: Month 11($)a
382 137 304 313 147 323 -10.1 0.69
A.15
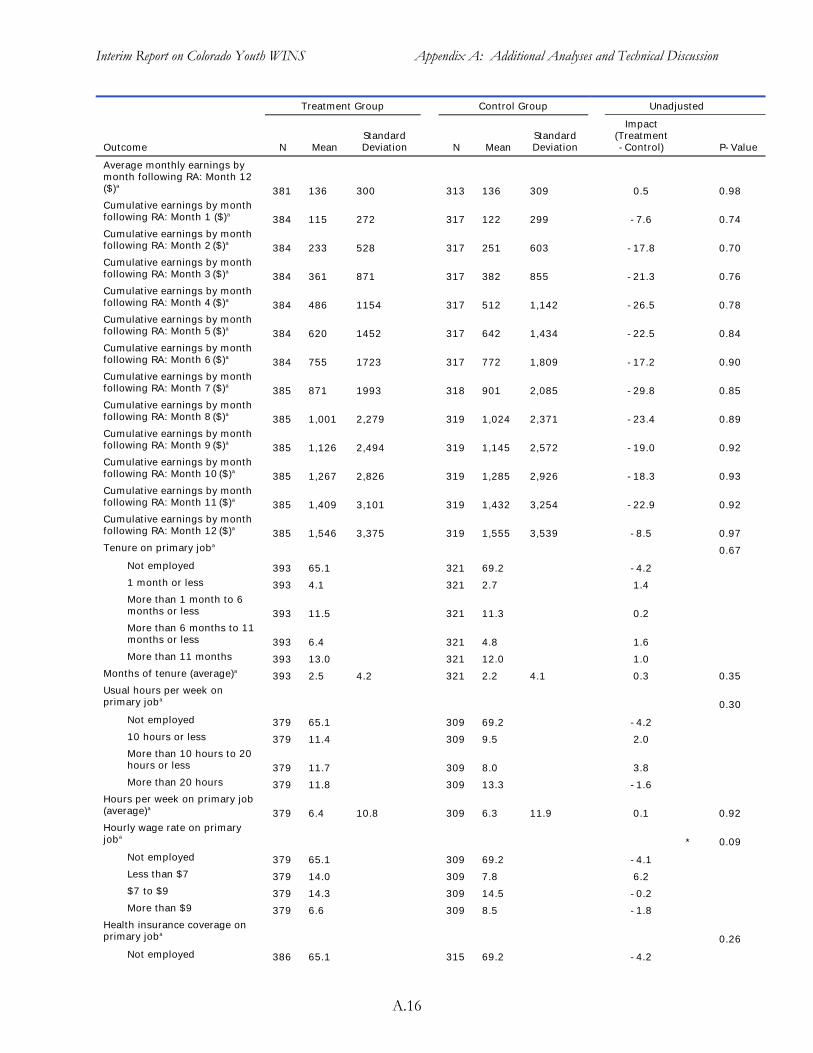
Interim Report on Colorado Youth WINS Appendix A: Additional Analyses and Technical Discussion
Treatment Group Control Group Unadjusted
ImpactStandard Standard (Treatment
Outcome N Mean Deviation N Mean Deviation -Control) P-Value
Average monthly earnings bymonth following RA: Month 12($)a
381 136 300 313 136 309 0.5 0.98 Cumulative earnings by monthfollowing RA: Month 1 ($)a
384 115 272 317 122 299 -7.6 0.74 Cumulative earnings by monthfollowing RA: Month 2 ($)a
384 233 528 317 251 603 -17.8 0.70 Cumulative earnings by monthfollowing RA: Month 3 ($)a
384 361 871 317 382 855 -21.3 0.76 Cumulative earnings by monthfollowing RA: Month 4 ($)a
384 486 1154 317 512 1,142 -26.5 0.78 Cumulative earnings by monthfollowing RA: Month 5 ($)a
384 620 1452 317 642 1,434 -22.5 0.84 Cumulative earnings by monthfollowing RA: Month 6 ($)a
384 755 1723 317 772 1,809 -17.2 0.90 Cumulative earnings by monthfollowing RA: Month 7 ($)a
385 871 1993 318 901 2,085 -29.8 0.85 Cumulative earnings by monthfollowing RA: Month 8 ($)a
385 1,001 2,279 319 1,024 2,371 -23.4 0.89 Cumulative earnings by monthfollowing RA: Month 9 ($)a
385 1,126 2,494 319 1,145 2,572 -19.0 0.92 Cumulative earnings by monthfollowing RA: Month 10 ($)a
385 1,267 2,826 319 1,285 2,926 -18.3 0.93 Cumulative earnings by monthfollowing RA: Month 11 ($)a
385 1,409 3,101 319 1,432 3,254 -22.9 0.92 Cumulative earnings by monthfollowing RA: Month 12 ($)a
385 1,546 3,375 319 1,555 3,539 -8.5 0.97 Tenure on primary joba
0.67
Not employed 393 65.1 321 69.2 -4.2
1 month or less 393 4.1 321 2.7 1.4
More than 1 month to 6 months or less 393 11.5 321 11.3 0.2
More than 6 months to 11 months or less 393 6.4 321 4.8 1.6
More than 11 months 393 13.0 321 12.0 1.0 Months of tenure (average)a
393 2.5 4.2 321 2.2 4.1 0.3 0.35 Usual hours per week onprimary joba
0.30
Not employed 379 65.1 309 69.2 -4.2
10 hours or less 379 11.4 309 9.5 2.0
More than 10 hours to 20 hours or less 379 11.7 309 8.0 3.8
More than 20 hours 379 11.8 309 13.3 -1.6 Hours per week on primary job (average)a
379 6.4 10.8 309 6.3 11.9 0.1 0.92 Hourly wage rate on primaryjoba
* 0.09
Not employed 379 65.1 309 69.2 -4.1
Less than $7 379 14.0 309 7.8 6.2
$7 to $9 379 14.3 309 14.5 -0.2
More than $9 379 6.6 309 8.5 -1.8 Health insurance coverage onprimary joba
0.26
Not employed 386 65.1 315 69.2 -4.2
A.16
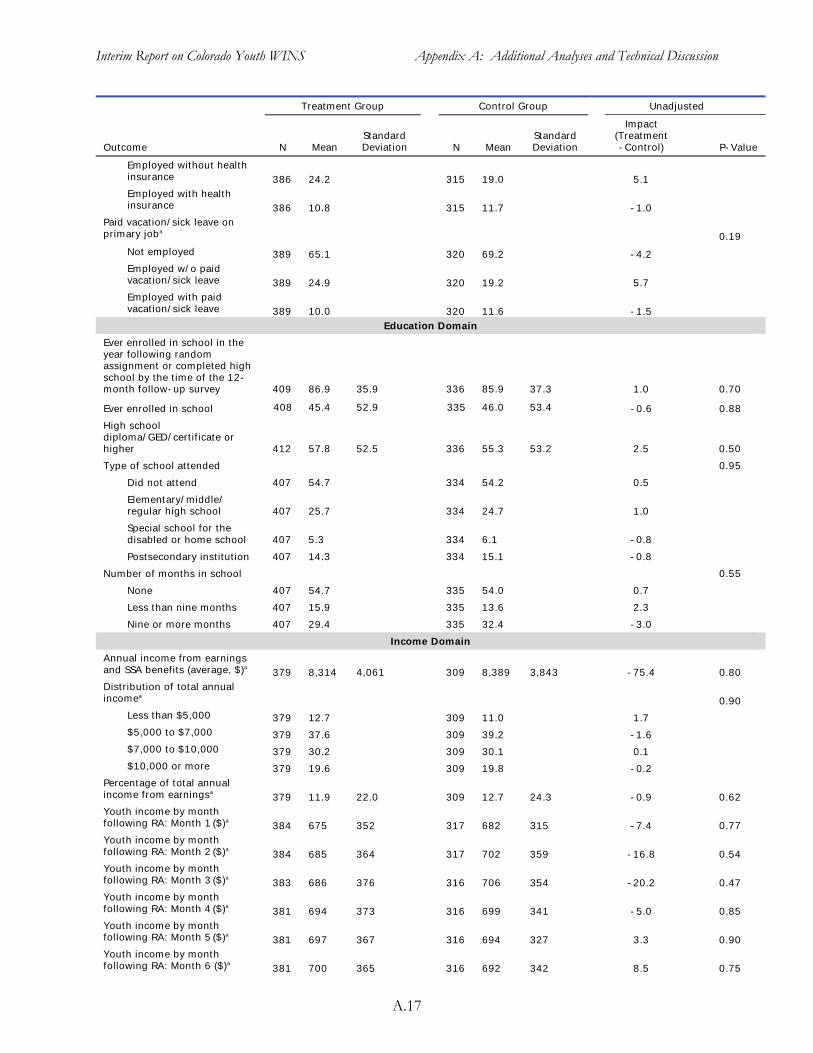
Interim Report on Colorado Youth WINS Appendix A: Additional Analyses and Technical Discussion
Treatment Group Control Group Unadjusted
ImpactStandard Standard (Treatment
Outcome N Mean Deviation N Mean Deviation -Control) P-Value
Employed without healthinsurance 386 24.2 315 19.0 5.1 Employed with health insurance 386 10.8 315 11.7 -1.0
Paid vacation/sick leave on primary joba
Not employed
Employed w/o paid vacation/sick leave
Employed with paid vacation/sick leave
389
389
389
65.1
24.9
10.0
320 69.2
320 19.2
320 11.6 Education Domain
-4.2
5.7
-1.5
0.19
Ever enrolled in school in the year following random assignment or completed highschool by the time of the 12month follow-up survey
Ever enrolled in school
409
408
86.9
45.4
35.9
52.9
336
335
85.9
46.0
37.3
53.4
1.0
-0.6
0.70
0.88
High school diploma/GED/certificate or higher
Type of school attended
Did not attend
412
407
57.8
54.7
52.5 336
334
55.3
54.2
53.2 2.5
0.5
0.50
0.95
Elementary/middle/regular high school
Special school for the disabled or home school
407
407
25.7
5.3
334
334
24.7
6.1
1.0
-0.8
Postsecondary institution
Number of months in school
407 14.3 334 15.1 -0.8
0.55
None 407 54.7 335 54.0 0.7
Less than nine months 407 15.9 335 13.6 2.3
Nine or more months 407 29.4 335 32.4 -3.0
Income Domain
Annual income from earningsand SSA benefits (average, $)a
Distribution of total annual incomea
379 8,314 4,061 309 8,389 3,843 -75.4 0.80
0.90 Less than $5,000
$5,000 to $7,000
$7,000 to $10,000
$10,000 or more
Percentage of total annual income from earningsa
Youth income by month following RA: Month 1 ($)a
Youth income by month following RA: Month 2 ($)a
Youth income by month following RA: Month 3 ($)a
Youth income by month following RA: Month 4 ($)a
Youth income by month following RA: Month 5 ($)a
Youth income by month following RA: Month 6 ($)a
379
379
379
379
379
384
384
383
381
381
381
12.7
37.6
30.2
19.6
11.9
675
685
686
694
697
700
22.0
352
364
376
373
367
365
309
309
309
309
309
317
317
316
316
316
316
11.0
39.2
30.1
19.8
12.7
682
702
706
699
694
692
24.3
315
359
354
341
327
342
1.7
-1.6
0.1
-0.2
-0.9
-7.4
-16.8
-20.2
-5.0
3.3
8.5
0.62
0.77
0.54
0.47
0.85
0.90
0.75
A.17
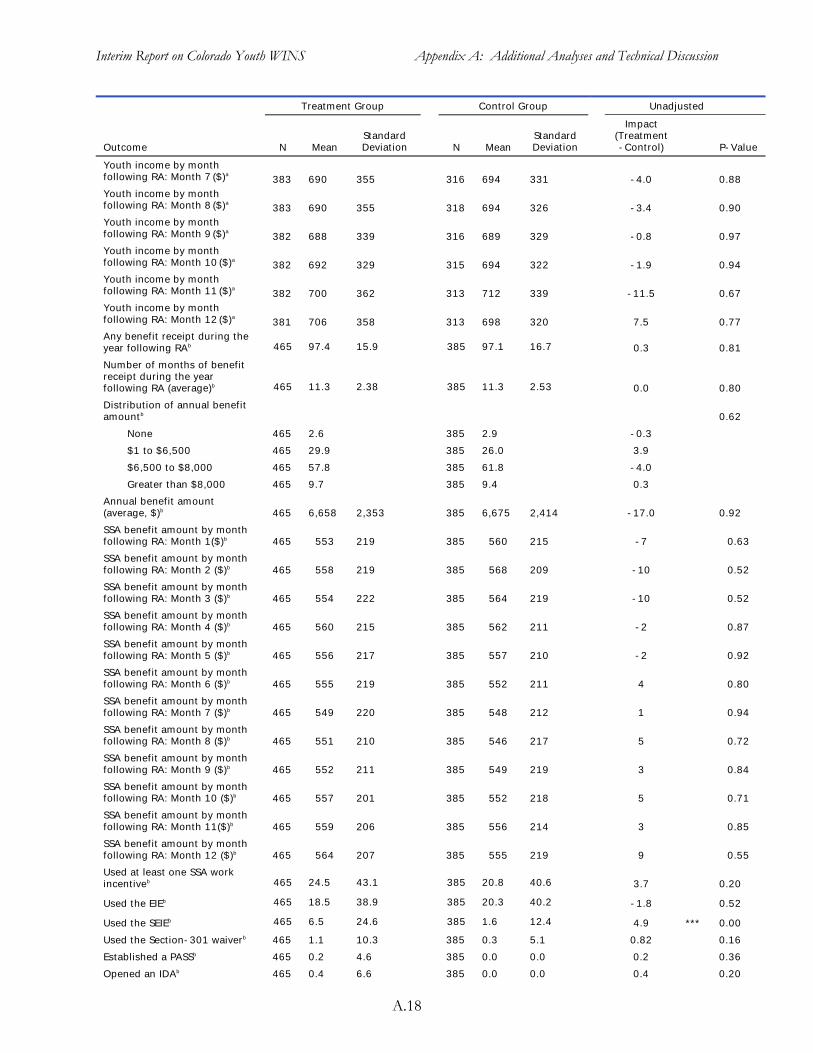
Interim Report on Colorado Youth WINS Appendix A: Additional Analyses and Technical Discussion
Treatment Group Control Group Unadjusted
ImpactStandard Standard (Treatment
Outcome N Mean Deviation N Mean Deviation -Control) P-Value
Youth income by month following RA: Month 7 ($)a
383 690 355 316 694 331 -4.0 0.88 Youth income by month following RA: Month 8 ($)a
383 690 355 318 694 326 -3.4 0.90 Youth income by month following RA: Month 9 ($)a
382 688 339 316 689 329 -0.8 0.97 Youth income by month following RA: Month 10 ($)a
382 692 329 315 694 322 -1.9 0.94 Youth income by month following RA: Month 11 ($)a
382 700 362 313 712 339 -11.5 0.67 Youth income by month following RA: Month 12 ($)a
381 706 358 313 698 320 7.5 0.77 Any benefit receipt during theyear following RAb 465 97.4 15.9 385 97.1 16.7 0.3 0.81
Number of months of benefit receipt during the year following RA (average)b 465 11.3 2.38 385 11.3 2.53 0.0 0.80
Distribution of annual benefit amountb 0.62
None 465 2.6 385 2.9 -0.3
$1 to $6,500 465 29.9 385 26.0 3.9
$6,500 to $8,000 465 57.8 385 61.8 -4.0
Greater than $8,000 465 9.7 385 9.4 0.3
Annual benefit amount (average, $)b 465 6,658 2,353 385 6,675 2,414 -17.0 0.92
SSA benefit amount by month following RA: Month 1($)b 465 553 219 385 560 215 -7 0.63
SSA benefit amount by month following RA: Month 2 ($)b 465 558 219 385 568 209 -10 0.52
SSA benefit amount by month following RA: Month 3 ($)b 465 554 222 385 564 219 -10 0.52
SSA benefit amount by month following RA: Month 4 ($)b 465 560 215 385 562 211 -2 0.87
SSA benefit amount by month following RA: Month 5 ($)b 465 556 217 385 557 210 -2 0.92
SSA benefit amount by month following RA: Month 6 ($)b 465 555 219 385 552 211 4 0.80
SSA benefit amount by month following RA: Month 7 ($)b 465 549 220 385 548 212 1 0.94
SSA benefit amount by month following RA: Month 8 ($)b 465 551 210 385 546 217 5 0.72
SSA benefit amount by month following RA: Month 9 ($)b 465 552 211 385 549 219 3 0.84
SSA benefit amount by month following RA: Month 10 ($)b 465 557 201 385 552 218 5 0.71
SSA benefit amount by month following RA: Month 11($)b 465 559 206 385 556 214 3 0.85
SSA benefit amount by month following RA: Month 12 ($)b 465 564 207 385 555 219 9 0.55
Used at least one SSA work incentiveb 465 24.5 43.1 385 20.8 40.6 3.7 0.20
Used the EIEb 465 18.5 38.9 385 20.3 40.2 -1.8 0.52
Used the SEIEb 465 6.5 24.6 385 1.6 12.4 4.9 *** 0.00
Used the Section-301 waiverb 465 1.1 10.3 385 0.3 5.1 0.82 0.16
Established a PASSb 465 0.2 4.6 385 0.0 0.0 0.2 0.36
Opened an IDAb 465 0.4 6.6 385 0.0 0.0 0.4 0.20
A.18
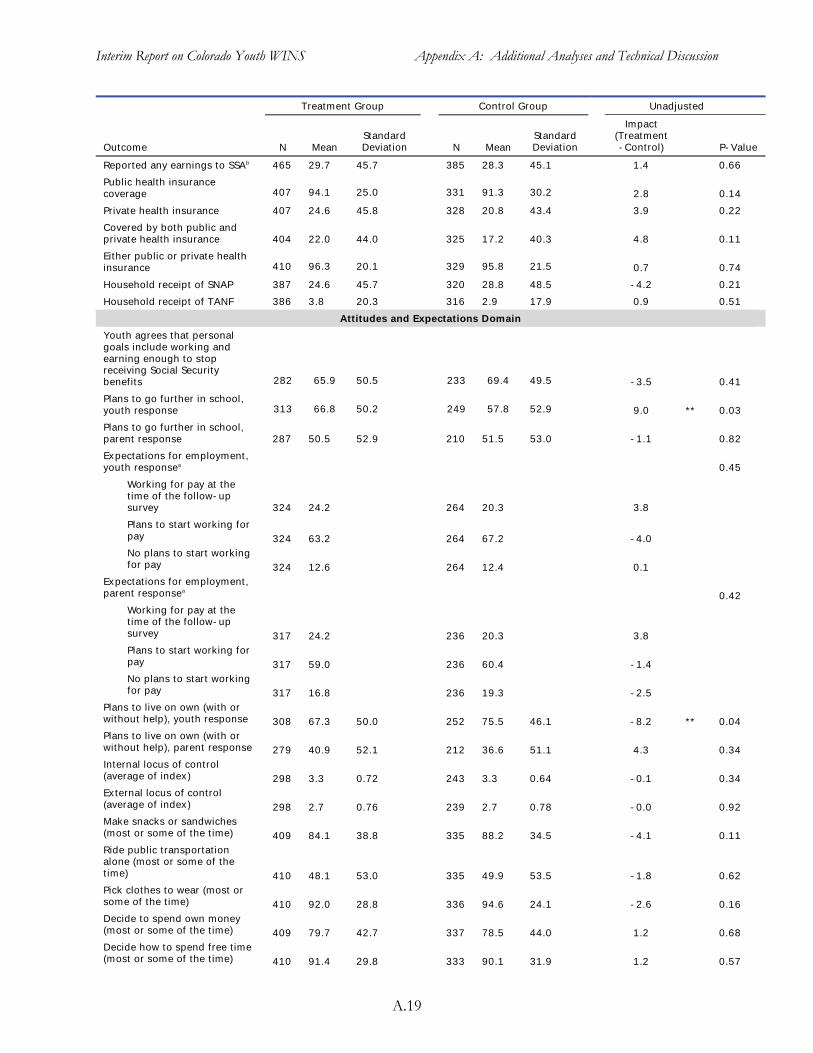
Interim Report on Colorado Youth WINS Appendix A: Additional Analyses and Technical Discussion
Treatment Group Control Group Unadjusted
ImpactStandard Standard (Treatment
Outcome N Mean Deviation N Mean Deviation -Control) P-Value
Reported any earnings to SSAb 465 29.7 45.7 385 28.3 45.1 1.4 0.66
Public health insurance coverage 407 94.1 25.0 331 91.3 30.2 2.8 0.14
Private health insurance 407 24.6 45.8 328 20.8 43.4 3.9 0.22
Covered by both public andprivate health insurance 404 22.0 44.0 325 17.2 40.3 4.8 0.11
Either public or private healthinsurance 410 96.3 20.1 329 95.8 21.5 0.7 0.74
Household receipt of SNAP 387 24.6 45.7 320 28.8 48.5 -4.2 0.21
Household receipt of TANF 386 3.8 20.3 316 2.9 17.9 0.9 0.51
Attitudes and Expectations Domain
Youth agrees that personal goals include working andearning enough to stop receiving Social Security benefits 282 65.9 50.5 233 69.4 49.5 -3.5 0.41
Plans to go further in school, youth response 313 66.8 50.2 249 57.8 52.9 9.0 ** 0.03
Plans to go further in school, parent response 287 50.5 52.9 210 51.5 53.0 -1.1 0.82
Expectations for employment, youth responsea 0.45
Working for pay at the time of the follow-up survey 324 24.2 264 20.3 3.8
Plans to start working for pay 324 63.2 264 67.2 -4.0
No plans to start working for pay 324 12.6 264 12.4 0.1
Expectations for employment, parent responsea
0.42
Working for pay at the time of the follow-up survey 317 24.2 236 20.3 3.8 Plans to start working for pay 317 59.0 236 60.4 -1.4 No plans to start working for pay 317 16.8 236 19.3 -2.5
Plans to live on own (with or without help), youth response 308 67.3 50.0 252 75.5 46.1 -8.2 ** 0.04 Plans to live on own (with or without help), parent response 279 40.9 52.1 212 36.6 51.1 4.3 0.34 Internal locus of control (average of index) 298 3.3 0.72 243 3.3 0.64 -0.1 0.34 External locus of control (average of index) 298 2.7 0.76 239 2.7 0.78 -0.0 0.92 Make snacks or sandwiches (most or some of the time) 409 84.1 38.8 335 88.2 34.5 -4.1 0.11 Ride public transportationalone (most or some of thetime) 410 48.1 53.0 335 49.9 53.5 -1.8 0.62 Pick clothes to wear (most or some of the time) 410 92.0 28.8 336 94.6 24.1 -2.6 0.16 Decide to spend own money(most or some of the time) 409 79.7 42.7 337 78.5 44.0 1.2 0.68 Decide how to spend free time(most or some of the time) 410 91.4 29.8 333 90.1 31.9 1.2 0.57
A.19
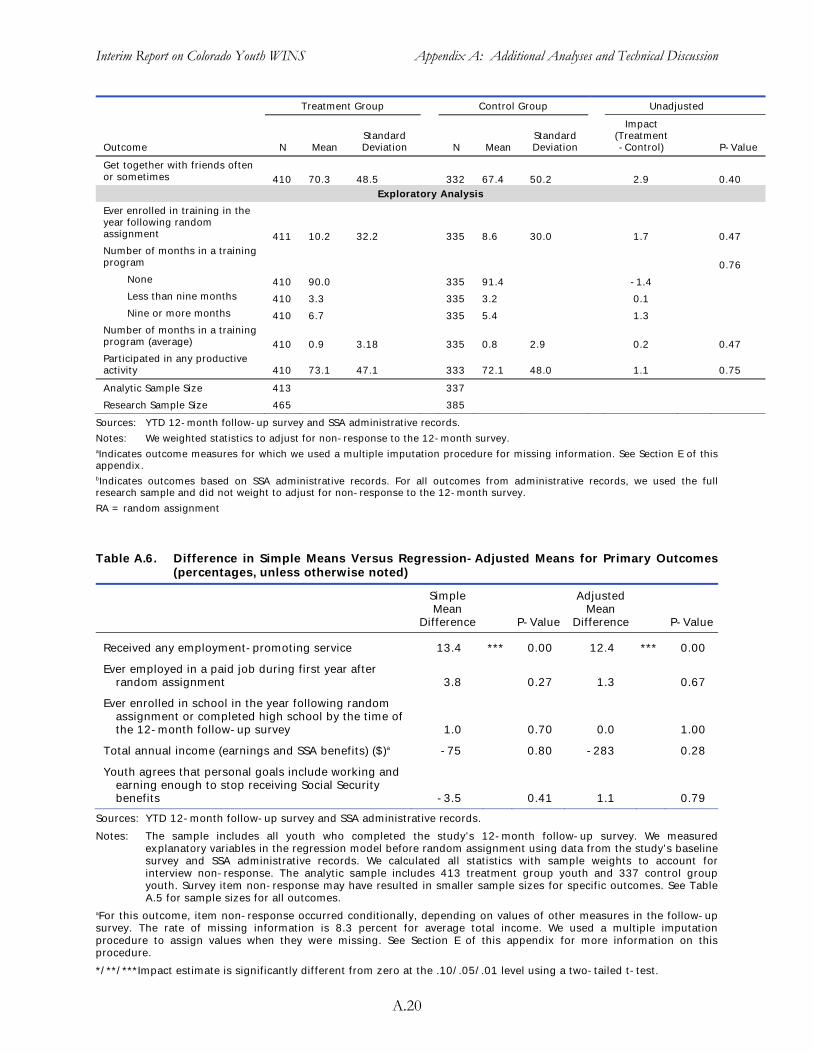
Interim Report on Colorado Youth WINS Appendix A: Additional Analyses and Technical Discussion
Treatment Group Control Group Unadjusted
ImpactStandard Standard (Treatment
Outcome N Mean Deviation N Mean Deviation -Control) P-Value
Get together with friends often or sometimes 410 70.3 48.5 332 67.4 50.2 2.9 0.40
Exploratory Analysis
Ever enrolled in training in the year following random assignment 411 10.2 32.2 335 8.6 30.0 1.7 0.47 Number of months in a trainingprogram 0.76
None 410 90.0 335 91.4 -1.4
Less than nine months 410 3.3 335 3.2 0.1
Nine or more months 410 6.7 335 5.4 1.3 Number of months in a trainingprogram (average) 410 0.9 3.18 335 0.8 2.9 0.2 0.47 Participated in any productive activity 410 73.1 47.1 333 72.1 48.0 1.1 0.75
Analytic Sample Size 413 337
Research Sample Size 465 385
Sources: YTD 12-month follow-up survey and SSA administrative records.
Notes: We weighted statistics to adjust for non-response to the 12-month survey. aIndicates outcome measures for which we used a multiple imputation procedure for missing information. See Section E of thisappendix.bIndicates outcomes based on SSA administrative records. For all outcomes from administrative records, we used the fullresearch sample and did not weight to adjust for non-response to the 12-month survey.
RA = random assignment
Table A.6. Difference in Simple Means Versus Regression-Adjusted Means for Primary Outcomes (percentages, unless otherwise noted)
Simple AdjustedMean Mean
Difference P-Value Difference P-Value
Received any employment-promoting service 13.4 *** 0.00 12.4 *** 0.00
Ever employed in a paid job during first year after random assignment 3.8 0.27 1.3 0.67
Ever enrolled in school in the year following random assignment or completed high school by the time of the 12-month follow-up survey 1.0 0.70 0.0 1.00
Total annual income (earnings and SSA benefits) ($)a -75 0.80 -283 0.28
Youth agrees that personal goals include working and earning enough to stop receiving Social Security benefits -3.5 0.41 1.1 0.79
Sources: YTD 12-month follow-up survey and SSA administrative records.
Notes: The sample includes all youth who completed the study’s 12-month follow-up survey. We measured explanatory variables in the regression model before random assignment using data from the study’s baseline survey and SSA administrative records. We calculated all statistics with sample weights to account for interview non-response. The analytic sample includes 413 treatment group youth and 337 control groupyouth. Survey item non-response may have resulted in smaller sample sizes for specific outcomes. See TableA.5 for sample sizes for all outcomes.
aFor this outcome, item non-response occurred conditionally, depending on values of other measures in the follow-upsurvey. The rate of missing information is 8.3 percent for average total income. We used a multiple imputationprocedure to assign values when they were missing. See Section E of this appendix for more information on thisprocedure.
*/**/***Impact estimate is significantly different from zero at the .10/.05/.01 level using a two-tailed t-test.
A.20
Interim Report on Colorado Youth WINS Appendix A: Additional Analyses and Technical Discussion
D. Non-Response to the 12-Month Follow-Up Survey and Survey Weights
For the 12-month follow-up survey, if respondents differed systematically from non-respondents in terms of characteristics that were also correlated with the outcomes of interest, the estimated impacts could be biased if we did not account for the differences. We found that respondents did differ from non-respondents on several baseline characteristics; for example, respondents had somewhat higher educational attainment, were more likely to live with both parents, and were more likely to be covered by health insurance (Table A.7). Respondents also were less likely to attend school, more likely to have received job training, more likely to have worked as a volunteer, more likely to have a mother who was a high school graduate, less likely to make decisions about how to spend their own money, and less likely to expect to live independently or expect to continue with education.
Nearly all youth received SSA benefits during the year before baseline, and the annual benefit amount received by respondents is not statistically different from that received by non-respondents (Table A.8).137 In the year following baseline, however, non-respondents received a lower average annual benefit amount relative to respondents. One reason for the difference is that youth no longer receiving benefits were more difficult to locate through SSA records using the most recent beneficiary contact information. Youth who terminated benefits at some point during the year thus were more likely to be non-respondents. Even though the results showed some selectivity in who responded, we did not find that the estimated impact of Youth WINS on benefit receipt differed between the respondent sample and the full research sample (Table A.9). Furthermore, across all outcomes measured in administrative records, we found little difference in levels or estimated impacts between the respondent and full research samples. The only exception was that the estimated impact on the use of EIE is statistically significant in the respondent sample but not the research sample.
In our analysis, we used weights that adjust for survey non-response to make respondent cases more representative of the original sample and reduce the potential for non-response bias. For the weight adjustments, we used forward and backward stepwise logistic models to estimate the propensity for a sample member to respond. We used the inverse of the propensity score as the non-response weight. We computed the models separately for treatment and control observations within Colorado. To select variables in the logistic model, we included variables with a statistical significance level of 0.30 or lower (instead of the standard 0.05) because the purpose of the model was to improve estimation of the propensity score, not identify statistically significant factors related to response. For both the control and treatment groups, the explanatory variables included age, race, self-reported health status, school attendance, highest grade completed, food stamp receipt, and living arrangement. Additional characteristics for the control group included income level, lived with others with disabilities, number of people in the household, and needed help with personal care. For the treatment group, additional characteristics included gender, primary disabling condition, duration of disability, duration of benefit entitlement, receipt of TANF or family assistance, and receipt of job training in the prior year.
137 All youth in the research sample were on the SSA benefit rolls at the time data were extracted for the sample; however, a small percentage of them were not in “current pay” status. Subsequent analysis of benefit records showed that three percent of youth in the research sample did not receive benefits in the year prior to random assignment. These youth were considered to be at high risk of returning to “current pay” status in the future.
A.21
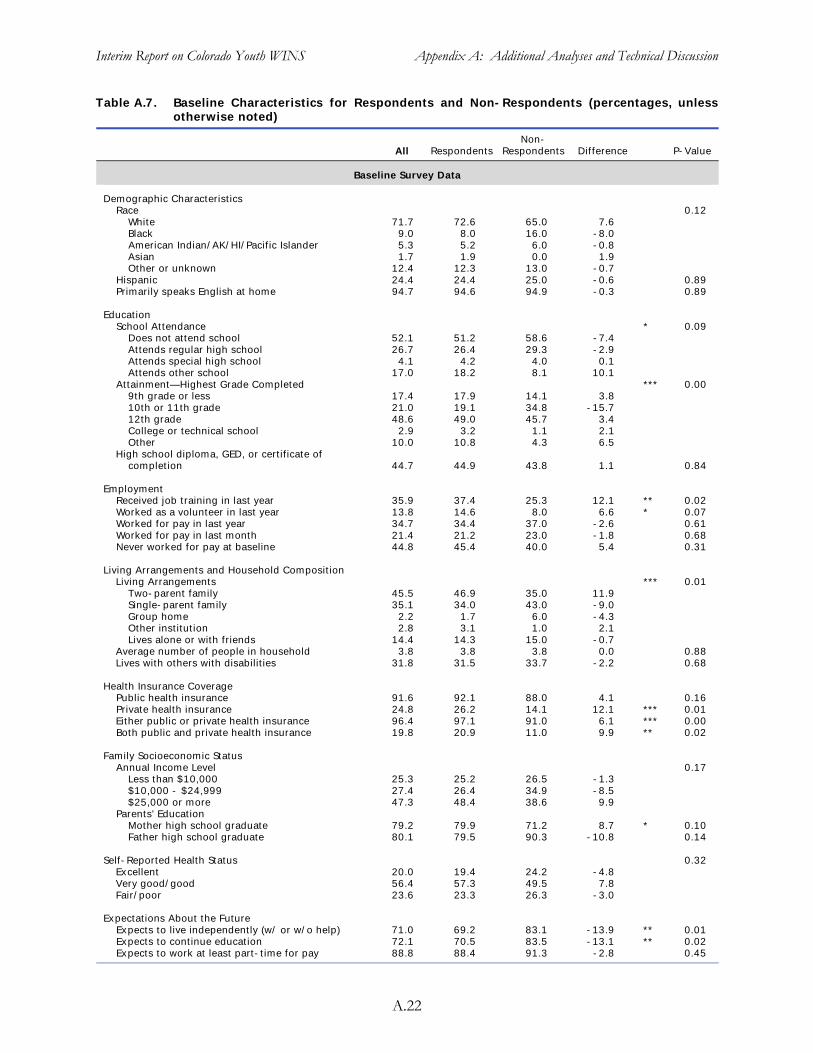
Interim Report on Colorado Youth WINS Appendix A: Additional Analyses and Technical Discussion
Table A.7. Baseline Characteristics for Respondents and Non-Respondents (percentages, unless otherwise noted)
All Respondents Non-
Respondents Difference P-Value
Baseline Survey Data
Demographic CharacteristicsRace 0.12
White 71.7 72.6 65.0 7.6 Black 9.0 8.0 16.0 -8.0 American Indian/AK/HI/Pacific Islander 5.3 5.2 6.0 -0.8 Asian 1.7 1.9 0.0 1.9 Other or unknown 12.4 12.3 13.0 -0.7
Hispanic 24.4 24.4 25.0 -0.6 0.89 Primarily speaks English at home 94.7 94.6 94.9 -0.3 0.89
Education School Attendance * 0.09
Does not attend school 52.1 51.2 58.6 -7.4 Attends regular high school 26.7 26.4 29.3 -2.9 Attends special high school 4.1 4.2 4.0 0.1 Attends other school 17.0 18.2 8.1 10.1
Attainment—Highest Grade Completed *** 0.00 9th grade or less 17.4 17.9 14.1 3.8 10th or 11th grade 21.0 19.1 34.8 -15.7 12th grade 48.6 49.0 45.7 3.4 College or technical school 2.9 3.2 1.1 2.1 Other 10.0 10.8 4.3 6.5
High school diploma, GED, or certificate ofcompletion 44.7 44.9 43.8 1.1 0.84
EmploymentReceived job training in last year 35.9 37.4 25.3 12.1 ** 0.02 Worked as a volunteer in last year 13.8 14.6 8.0 6.6 * 0.07 Worked for pay in last year 34.7 34.4 37.0 -2.6 0.61 Worked for pay in last month 21.4 21.2 23.0 -1.8 0.68 Never worked for pay at baseline 44.8 45.4 40.0 5.4 0.31
Living Arrangements and Household CompositionLiving Arrangements *** 0.01
Two-parent family 45.5 46.9 35.0 11.9 Single-parent family 35.1 34.0 43.0 -9.0 Group home 2.2 1.7 6.0 -4.3 Other institution 2.8 3.1 1.0 2.1 Lives alone or with friends 14.4 14.3 15.0 -0.7
Average number of people in household 3.8 3.8 3.8 0.0 0.88 Lives with others with disabilities 31.8 31.5 33.7 -2.2 0.68
Health Insurance Coverage Public health insurance 91.6 92.1 88.0 4.1 0.16 Private health insurance 24.8 26.2 14.1 12.1 *** 0.01 Either public or private health insurance 96.4 97.1 91.0 6.1 *** 0.00 Both public and private health insurance 19.8 20.9 11.0 9.9 ** 0.02
Family Socioeconomic StatusAnnual Income Level 0.17
Less than $10,000 25.3 25.2 26.5 -1.3 $10,000 - $24,999 27.4 26.4 34.9 -8.5 $25,000 or more 47.3 48.4 38.6 9.9
Parents' Education Mother high school graduate 79.2 79.9 71.2 8.7 * 0.10 Father high school graduate 80.1 79.5 90.3 -10.8 0.14
Self-Reported Health Status 0.32 Excellent 20.0 19.4 24.2 -4.8 Very good/good 56.4 57.3 49.5 7.8 Fair/poor 23.6 23.3 26.3 -3.0
Expectations About the FutureExpects to live independently (w/ or w/o help) 71.0 69.2 83.1 -13.9 ** 0.01 Expects to continue education 72.1 70.5 83.5 -13.1 ** 0.02 Expects to work at least part-time for pay 88.8 88.4 91.3 -2.8 0.45
A.22
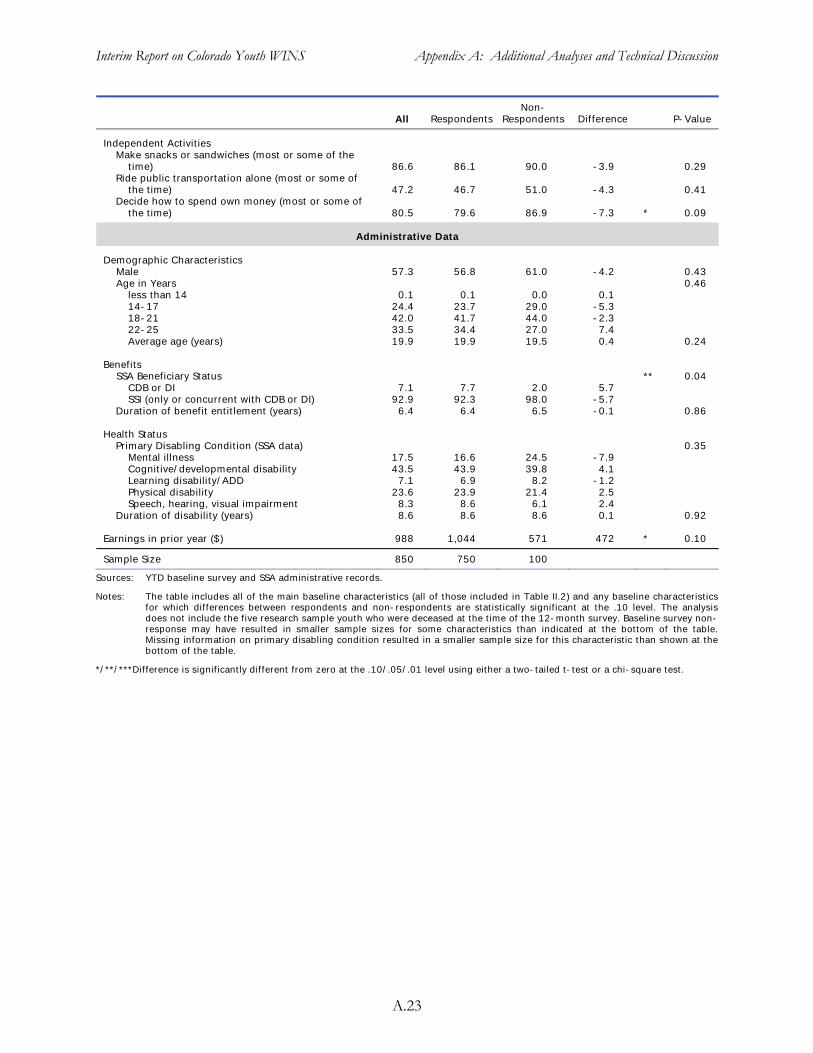
Interim Report on Colorado Youth WINS Appendix A: Additional Analyses and Technical Discussion
NonAll Respondents Respondents Difference P-Value
Independent ActivitiesMake snacks or sandwiches (most or some of the
time) 86.6 86.1 90.0 -3.9 0.29 Ride public transportation alone (most or some of
the time) 47.2 46.7 51.0 -4.3 0.41 Decide how to spend own money (most or some of
the time) 80.5 79.6 86.9 -7.3 * 0.09
Administrative Data
Demographic CharacteristicsMale 57.3 56.8 61.0 -4.2 0.43 Age in Years 0.46
less than 14 0.1 0.1 0.0 0.1 14-17 24.4 23.7 29.0 -5.3 18-21 42.0 41.7 44.0 -2.3 22-25 33.5 34.4 27.0 7.4 Average age (years) 19.9 19.9 19.5 0.4 0.24
Benefits SSA Beneficiary Status ** 0.04
CDB or DI 7.1 7.7 2.0 5.7 SSI (only or concurrent with CDB or DI) 92.9 92.3 98.0 -5.7
Duration of benefit entitlement (years) 6.4 6.4 6.5 -0.1 0.86
Health Status Primary Disabling Condition (SSA data) 0.35
Mental illness 17.5 16.6 24.5 -7.9 Cognitive/developmental disability 43.5 43.9 39.8 4.1 Learning disability/ADD 7.1 6.9 8.2 -1.2 Physical disability 23.6 23.9 21.4 2.5 Speech, hearing, visual impairment 8.3 8.6 6.1 2.4
Duration of disability (years) 8.6 8.6 8.6 0.1 0.92
Earnings in prior year ($) 988 1,044 571 472 * 0.10
Sample Size 850 750 100
Sources: YTD baseline survey and SSA administrative records.
Notes: The table includes all of the main baseline characteristics (all of those included in Table II.2) and any baseline characteristics for which differences between respondents and non-respondents are statistically significant at the .10 level. The analysisdoes not include the five research sample youth who were deceased at the time of the 12-month survey. Baseline survey non-response may have resulted in smaller sample sizes for some characteristics than indicated at the bottom of the table.Missing information on primary disabling condition resulted in a smaller sample size for this characteristic than shown at the bottom of the table.
*/**/***Difference is significantly different from zero at the .10/.05/.01 level using either a two-tailed t-test or a chi-square test.
A.23
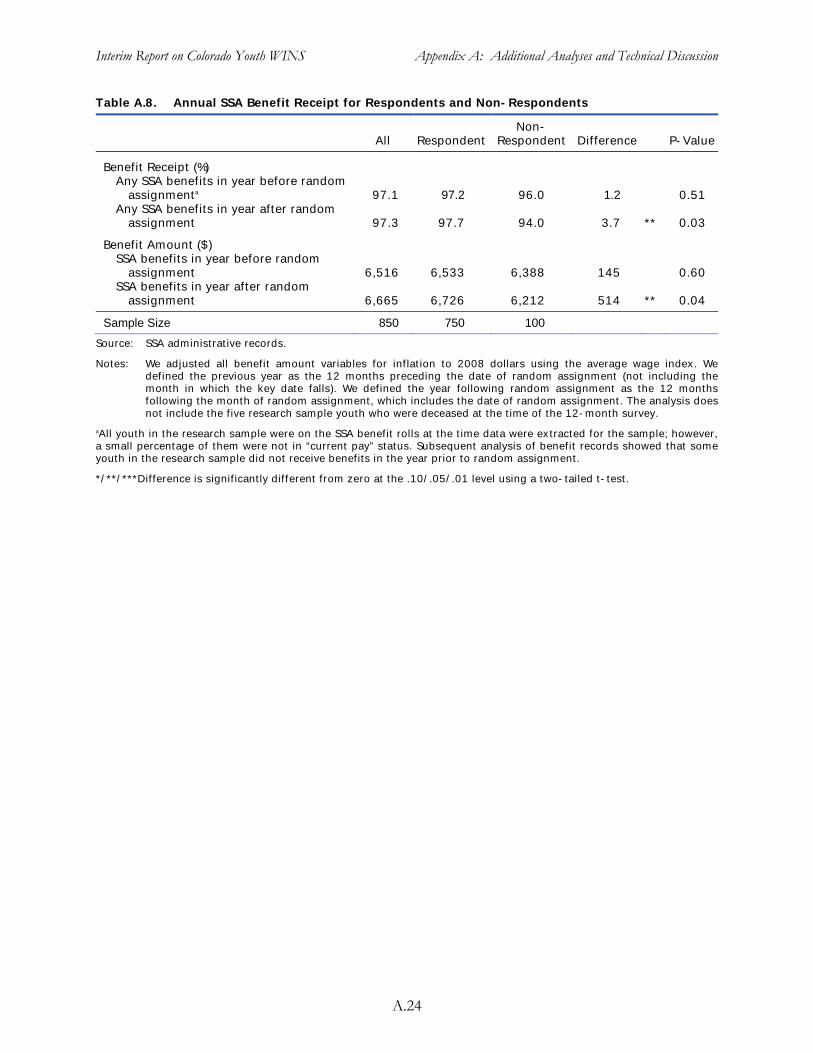
Interim Report on Colorado Youth WINS Appendix A: Additional Analyses and Technical Discussion
Table A.8. Annual SSA Benefit Receipt for Respondents and Non-Respondents
NonAll Respondent Respondent Difference P-Value
Benefit Receipt (%)Any SSA benefits in year before random
assignmenta
Any SSA benefits in year after randomassignment
97.1
97.3
97.2
97.7
96.0
94.0
1.2
3.7 **
0.51
0.03
Benefit Amount ($) SSA benefits in year before random
assignmentSSA benefits in year after random
assignment
6,516
6,665
6,533
6,726
6,388
6,212
145
514 **
0.60
0.04
Sample Size 850 750 100
Source: SSA administrative records.
Notes: We adjusted all benefit amount variables for inflation to 2008 dollars using the average wage index. We defined the previous year as the 12 months preceding the date of random assignment (not including themonth in which the key date falls). We defined the year following random assignment as the 12 months following the month of random assignment, which includes the date of random assignment. The analysis doesnot include the five research sample youth who were deceased at the time of the 12-month survey.
aAll youth in the research sample were on the SSA benefit rolls at the time data were extracted for the sample; however, a small percentage of them were not in “current pay” status. Subsequent analysis of benefit records showed that someyouth in the research sample did not receive benefits in the year prior to random assignment.
*/**/***Difference is significantly different from zero at the .10/.05/.01 level using a two-tailed t-test.
A.24
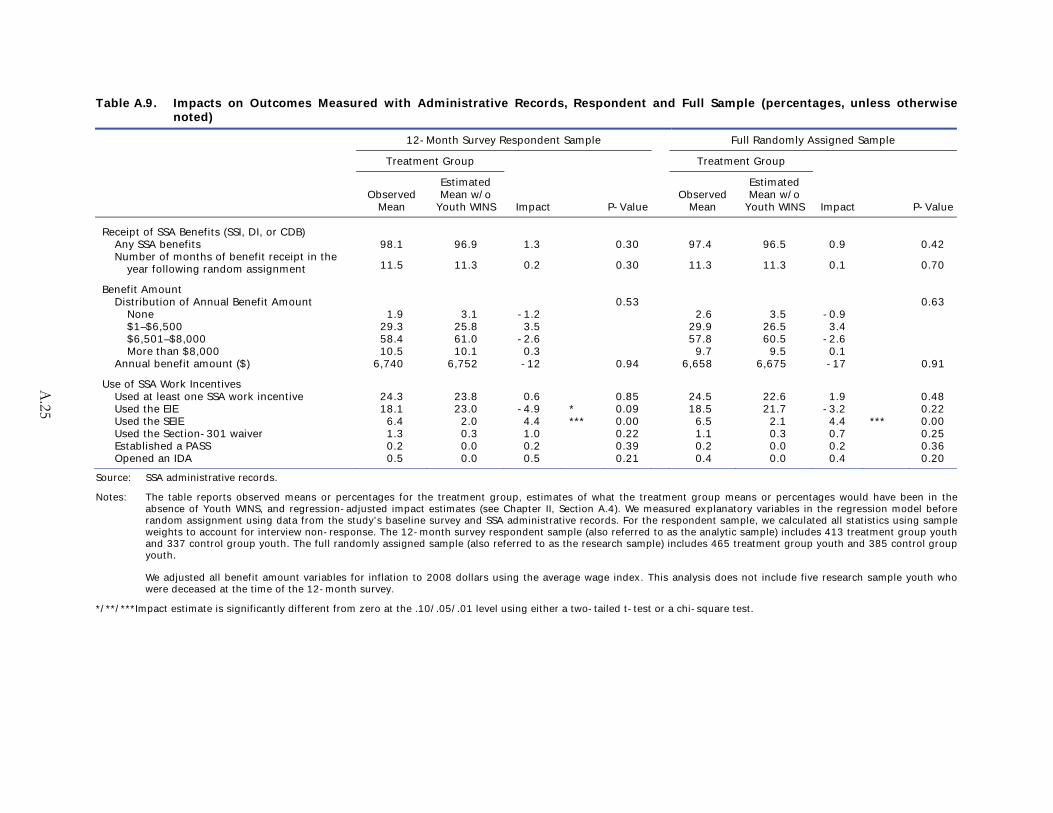
A.25
Table A.9. Impacts on Outcomes Measured with Administrative Records, Respondent and Full Sample (percentages, unless otherwise noted)
12-Month Survey Respondent Sample Full Randomly Assigned Sample
Treatment Group Treatment Group
Estimated Estimated Observed Mean w/o Observed Mean w/o
Mean Youth WINS Impact P-Value Mean Youth WINS Impact P-Value
Receipt of SSA Benefits (SSI, DI, or CDB)Any SSA benefits 98.1 96.9 1.3 0.30 97.4 96.5 0.9 0.42 Number of months of benefit receipt in the
year following random assignment 11.5 11.3 0.2 0.30 11.3 11.3 0.1 0.70
Benefit Amount Distribution of Annual Benefit Amount 0.53 0.63
None 1.9 3.1 -1.2 2.6 3.5 -0.9 $1–$6,500 29.3 25.8 3.5 29.9 26.5 3.4 $6,501–$8,000 58.4 61.0 -2.6 57.8 60.5 -2.6 More than $8,000 10.5 10.1 0.3 9.7 9.5 0.1
Annual benefit amount ($) 6,740 6,752 -12 0.94 6,658 6,675 -17 0.91
Use of SSA Work Incentives
Used at least one SSA work incentive 24.3 23.8 0.6 0.85 24.5 22.6 1.9 0.48
Used the EIE 18.1 23.0 -4.9 * 0.09 18.5 21.7 -3.2 0.22
Used the SEIE 6.4 2.0 4.4 *** 0.00 6.5 2.1 4.4 *** 0.00
Used the Section-301 waiver 1.3 0.3 1.0 0.22 1.1 0.3 0.7 0.25
Established a PASS 0.2 0.0 0.2 0.39 0.2 0.0 0.2 0.36
Opened an IDA 0.5 0.0 0.5 0.21 0.4 0.0 0.4 0.20
Source: SSA administrative records.
Notes: The table reports observed means or percentages for the treatment group, estimates of what the treatment group means or percentages would have been in theabsence of Youth WINS, and regression-adjusted impact estimates (see Chapter II, Section A.4). We measured explanatory variables in the regression model before random assignment using data from the study’s baseline survey and SSA administrative records. For the respondent sample, we calculated all statistics using sampleweights to account for interview non-response. The 12-month survey respondent sample (also referred to as the analytic sample) includes 413 treatment group youth and 337 control group youth. The full randomly assigned sample (also referred to as the research sample) includes 465 treatment group youth and 385 control groupyouth.
We adjusted all benefit amount variables for inflation to 2008 dollars using the average wage index. This analysis does not include five research sample youth who were deceased at the time of the 12-month survey.
*/**/***Impact estimate is significantly different from zero at the .10/.05/.01 level using either a two-tailed t-test or a chi-square test.
Appendix A. Additional Analyses and Technical Discussion Mathematica Policy Research
E. Missing Information for Independent and Dependent Variables
For most of the explanatory characteristics (independent variables) used in our regression models, we had few observations with missing information. For these variables, generally with far fewer than five percent of observations missing information, we replaced the missing information with the mean value from the non-missing observations. For two variables with a larger share of missing observations, we used dummy variables to indicate that the information was missing: mother’s education (6 percent missing) and expects to live independently in the future (29 percent missing). For the subgroup analysis, we omitted observations if the subgroup information was missing.
We typically excluded observations with missing information on an outcome measure (dependent variable) from any analysis of that outcome. For some outcome measures, however, the elimination of missing observations would produce potential bias. Specifically, the potential for bias occurs when the outcome is known to have a specific value for some observations, conditional on another outcome. For example, for youth reporting that they did not work for pay in the year following random assignment, earnings in that year are known to be zero. Missing information thus arises only for observations of youth who worked for pay during the year. In this example, the elimination of missing observations would imply elimination of observations only for youth who worked for pay, resulting in an underestimate of average earnings. The degree to which the earnings estimate is too low could differ by treatment status (for example, if treatment youth were more likely to work for pay and just as likely to respond to questions on earnings). For almost all outcome measures with conditionally missing data, less than 10 percent of observations were missing. The one exception is expectations for future work (about 22 percent missing for youth responses and 26 percent missing for parent responses). In Table A.5, we provide the sample sizes for all outcome measures.
For outcome measures for which information was missing conditional on another outcome, we used a multiple imputation procedure, as described in Puma et al. (2009). Here, we provide a conceptual description of the imputation process. We first imputed the missing values by using a stochastic regression model. The imputation model included all variables in our impact analysis model, plus key outcome measures and a stochastic residual term to match the observed variance in the sample. We performed the process 10 times to create 10 separate analytic data sets. We then conducted the impact analysis separately on each of the 10 data sets. The impact estimate was computed as the simple average of the impact estimates across the 10 data sets. The standard error of the combined impact estimate was calculated from within-imputation variance and between-imputation variance components. To implement the analysis, we used Stata procedures written by Royston (2007), Carlin et al. (2008), and Royston et al. (2009).138
F. Monthly SSA Benefit Amount Before and After Random Assignment
In Figure A.1 and Table A.10, we present the unadjusted average monthly benefit amount for youth in the treatment and control groups before and after random assignment. The differences in the average monthly benefit amount between the two groups were small and not statistically significant in any of the months during either the year prior to or the year following random assignment.
138 Impact estimates for outcomes with conditionally missing data would be biased if we did not adjust for missing information. However, when we calculated the biased impact estimates by dropping observations with missing outcome information, we found results very similar to those of the multiple imputation procedure. The impact estimates wereslightly different, but the pattern of statistical significance was the same. The similarity in the findings is not surprising,given the relatively small share of observations with missing outcome information.
A.26
450
470
490
510
530
550
570
590
12 11 10 9 8 7 6 5 4 3 2 1 0 1 2 3 4 5 6 7 8 9 10 11 12
Dollars
Month Relative to Month of Random Assignment
SSA Benefit Amount: Unadjusted Mean
Interim Report on Colorado Youth WINS Appendix A: Additional Analyses and Technical Discussion
Figure A.1. Average SSA Benefit Amount by Months Before and After Random Assignment
‐ ‐ ‐ ‐ ‐ ‐ ‐ ‐ ‐ ‐ ‐ ‐
Source: SSA administrative records.
Notes: The analysis includes all youth who were randomly assigned, with the exception of five youth who were deceased at the time of the 12-month survey. The figure presents observed means for the treatment and control groups.
None of the estimated differences between the treatment and control groups are significantly different from zeroat the .10 level.
Treatment Group Control Group
G. Exploratory Subgroups
In the evaluation design report (Rangarajan et al. 2009a), we hypothesized the potential for differential impacts across a number of subgroups. To be responsive to the multiple comparisons problem, we limited the main subgroups discussed in the text to those with the strongest conceptual reasons for likely differential impacts: pairs of subgroups defined by age, school attendance, and work experience. In this section, we examine differential impacts for several exploratory subgroups. For these subgroups, we hypothesized the potential for differential impacts but decided before the analysis that the potential was lower than for the main subgroups discussed in the text.
We conducted exploratory analysis of the impact of Youth WINS on the primary outcomes for six exploratory subgroup pairs:
Enrollment cohort. Impacts may differ between early and later cohorts because project services differ over time (attributable, for example, to differences in staff experience or staff turnover) and because other conditions differ over time (for example, job availability in the labor market). To divide the sample somewhat evenly, we considered youth randomly assigned by July 2007 as the early cohort.139 The early cohort comprised 49 percent of the youth.140
139 In Chapter III, we described Youth WINS service provision in two cohorts: those randomly assigned in 2006 and 2007 and those randomly assigned in 2008. As a robustness check, we conducted the impact analysis for all primary outcomes using these cohorts. The early cohort comprised 72 percent of youth. We found no statistically significant
(continued)
A.27
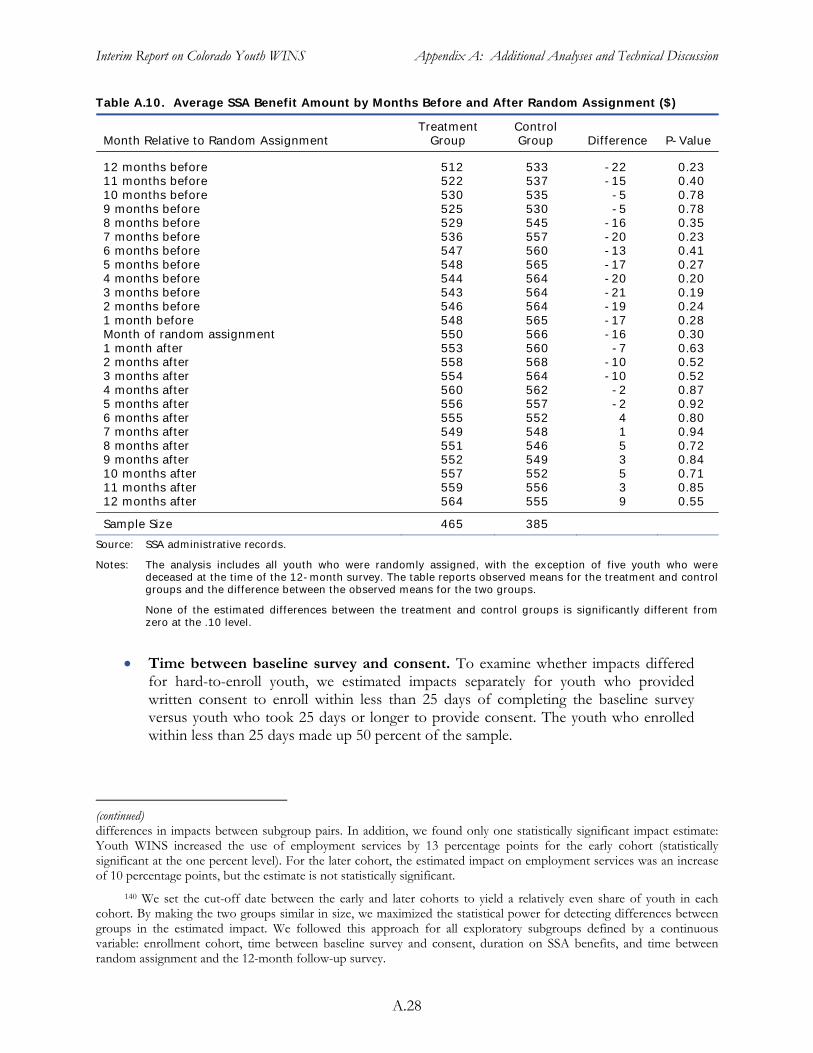
Interim Report on Colorado Youth WINS Appendix A: Additional Analyses and Technical Discussion
Table A.10. Average SSA Benefit Amount by Months Before and After Random Assignment ($)
Treatment Control Month Relative to Random Assignment Group Group Difference P-Value
12 months before 512 533 -22 0.23 11 months before 522 537 -15 0.40 10 months before 530 535 -5 0.78 9 months before 525 530 -5 0.78 8 months before 529 545 -16 0.35 7 months before 536 557 -20 0.23 6 months before 547 560 -13 0.41 5 months before 548 565 -17 0.27 4 months before 544 564 -20 0.20 3 months before 543 564 -21 0.19 2 months before 546 564 -19 0.24 1 month before 548 565 -17 0.28 Month of random assignment 1 month after
550 553
566 560
-16 -7
0.30 0.63
2 months after 558 568 -10 0.52 3 months after 554 564 -10 0.52 4 months after 560 562 -2 0.87 5 months after 556 557 -2 0.92 6 months after 555 552 4 0.80 7 months after 549 548 1 0.94 8 months after 551 546 5 0.72 9 months after 552 549 3 0.84 10 months after 557 552 5 0.71 11 months after 559 556 3 0.85 12 months after 564 555 9 0.55
Sample Size 465 385
Source: SSA administrative records.
Notes: The analysis includes all youth who were randomly assigned, with the exception of five youth who weredeceased at the time of the 12-month survey. The table reports observed means for the treatment and control groups and the difference between the observed means for the two groups.
None of the estimated differences between the treatment and control groups is significantly different from zero at the .10 level.
Time between baseline survey and consent. To examine whether impacts differed for hard-to-enroll youth, we estimated impacts separately for youth who provided written consent to enroll within less than 25 days of completing the baseline survey versus youth who took 25 days or longer to provide consent. The youth who enrolled within less than 25 days made up 50 percent of the sample.
(continued) differences in impacts between subgroup pairs. In addition, we found only one statistically significant impact estimate: Youth WINS increased the use of employment services by 13 percentage points for the early cohort (statistically significant at the one percent level). For the later cohort, the estimated impact on employment services was an increase of 10 percentage points, but the estimate is not statistically significant.
140 We set the cut-off date between the early and later cohorts to yield a relatively even share of youth in each cohort. By making the two groups similar in size, we maximized the statistical power for detecting differences between groups in the estimated impact. We followed this approach for all exploratory subgroups defined by a continuous variable: enrollment cohort, time between baseline survey and consent, duration on SSA benefits, and time between random assignment and the 12-month follow-up survey.
A.28
Interim Report on Colorado Youth WINS Appendix A: Additional Analyses and Technical Discussion
Duration on SSA benefits. To examine whether impacts differed for youth who had received SSA benefits for a shorter period, we estimated impacts separately for youth who had received benefits for less than five years (54 percent) versus those who had received them for five years or more.
Physical primary disabling condition. Impacts may differ for youth with a physical primary disability, including speech, hearing, and visual impairment (32 percent), compared to those with a mental, cognitive/developmental, or learning disability (68 percent).
Two-parent family. To examine whether impacts differed by socioeconomic status, we estimated separate impacts for those who lived with both parents (47 percent) compared to all other youth (53 percent). We chose this measure of socioeconomic status due to the likelihood of a high degree of error in our measure of family income and the relatively uneven sample split by mother’s education (about 75 percent of the sample had a mother who completed high school; also, about 6 percent were missing information on mother’s education).
Time between random assignment and 12-month follow-up survey. Ideally, the 12-month follow-up survey would have occurred exactly 12 months after random assignment for all youth. In practice, 56 percent of respondents completed the survey in the 12th or 13th month; the remaining 44 percent of respondents completed the survey in a later month.141 To examine whether the timing of the follow-up survey affected impact estimates, we estimated separate impact estimates for youth interviewed by the end of the 13th month and those interviewed later. The purpose of this subgroup analysis is to examine the fidelity of the research approach; this analysis is the only subgroup pair for which the defining characteristics were not measured at baseline.
In general, we found no consistent patterns of differential impacts (Tables A.11 through A.15). We found only 4 cases (out of 30 total cases) for which the difference in impacts between the subgroup pairs is statistically significant. The findings suggest that Youth WINS may have had a larger impact on participation in employment services for youth who provided written consent to enroll in less than 25 days from the date of completing the baseline survey. The findings also suggest that for youth who provided written consent to enroll in 25 days or more and youth who lived with both parents at baseline, Youth WINS had a larger impact on the composite measure of school enrollment or high school completion. In addition, the findings suggest that Youth WINS may have had a larger impact on goals for future work and earnings for youth who had received disability benefits for no more than five years prior to baseline. However, given that we have conducted 30 tests of the exploratory subgroup pairs (six subgroups for each of five primary outcomes), we would expect to have found some statistically significant differences attributable to chance. In light of the lack of a pattern of differences for any subgroup, we conclude that there is no evidence that any impacts differed meaningfully for these subgroups.
141 The earliest completion occurred at 11.4 months, 50 percent of youth completed by 12.8 months, 84 percent of youth completed by the end of the 15th month, and the latest completion occurred at 24.6 months.
A.29
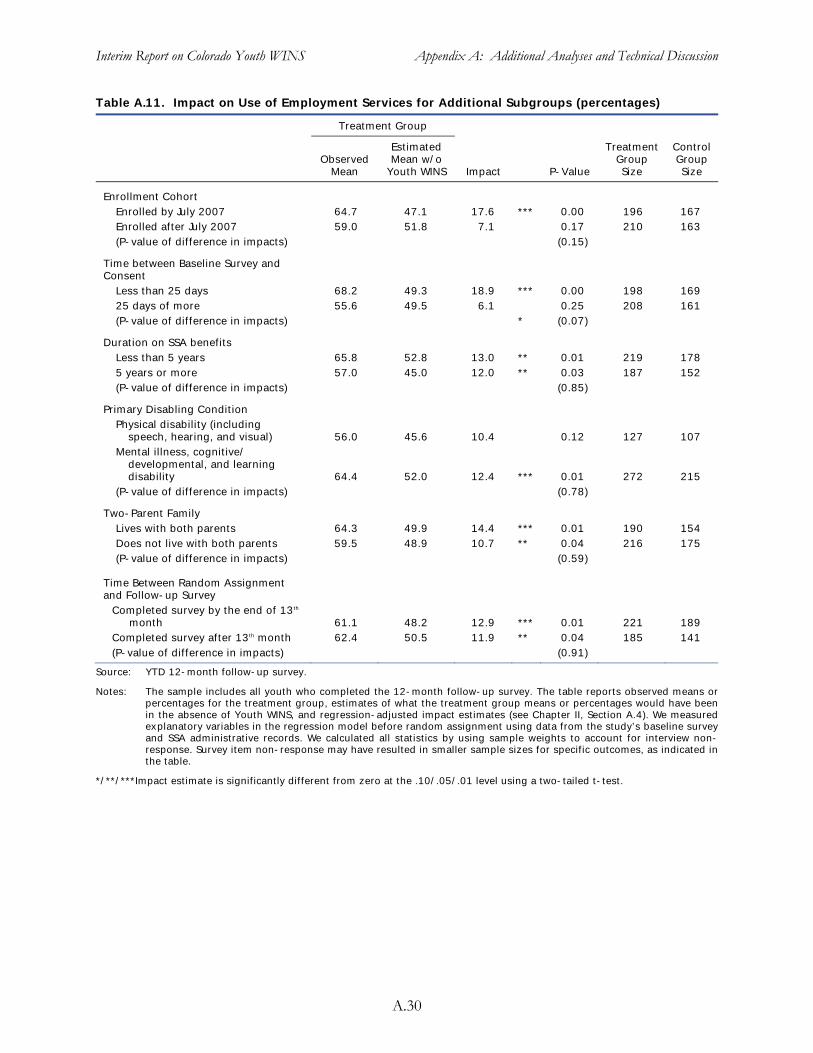
Interim Report on Colorado Youth WINS Appendix A: Additional Analyses and Technical Discussion
Table A.11. Impact on Use of Employment Services for Additional Subgroups (percentages)
Treatment Group
Estimated Treatment Control Observed
Mean Mean w/o
Youth WINS Impact P-Value GroupSize
GroupSize
Enrollment Cohort Enrolled by July 2007 64.7 47.1 17.6 *** 0.00 196 167
Enrolled after July 2007 59.0 51.8 7.1 0.17 210 163
(P-value of difference in impacts) (0.15)
Time between Baseline Survey and Consent
Less than 25 days 68.2 49.3 18.9 *** 0.00 198 169
25 days of more 55.6 49.5 6.1 0.25 208 161
(P-value of difference in impacts) * (0.07)
Duration on SSA benefits
Less than 5 years 65.8 52.8 13.0 ** 0.01 219 178
5 years or more 57.0 45.0 12.0 ** 0.03 187 152
(P-value of difference in impacts) (0.85)
Primary Disabling Condition
Physical disability (includingspeech, hearing, and visual) 56.0 45.6 10.4 0.12 127 107
Mental illness, cognitive/developmental, and learning disability 64.4 52.0 12.4 *** 0.01 272 215
(P-value of difference in impacts) (0.78)
Two-Parent Family
Lives with both parents 64.3 49.9 14.4 *** 0.01 190 154
Does not live with both parents 59.5 48.9 10.7 ** 0.04 216 175
(P-value of difference in impacts) (0.59)
Time Between Random Assignment and Follow-up Survey
Completed survey by the end of 13th
month 61.1 48.2 12.9 *** 0.01 221 189
Completed survey after 13th month 62.4 50.5 11.9 ** 0.04 185 141
(P-value of difference in impacts) (0.91)
Source: YTD 12-month follow-up survey.
Notes: The sample includes all youth who completed the 12-month follow-up survey. The table reports observed means orpercentages for the treatment group, estimates of what the treatment group means or percentages would have been in the absence of Youth WINS, and regression-adjusted impact estimates (see Chapter II, Section A.4). We measuredexplanatory variables in the regression model before random assignment using data from the study’s baseline surveyand SSA administrative records. We calculated all statistics by using sample weights to account for interview non-response. Survey item non-response may have resulted in smaller sample sizes for specific outcomes, as indicated in the table.
*/**/***Impact estimate is significantly different from zero at the .10/.05/.01 level using a two-tailed t-test.
A.30
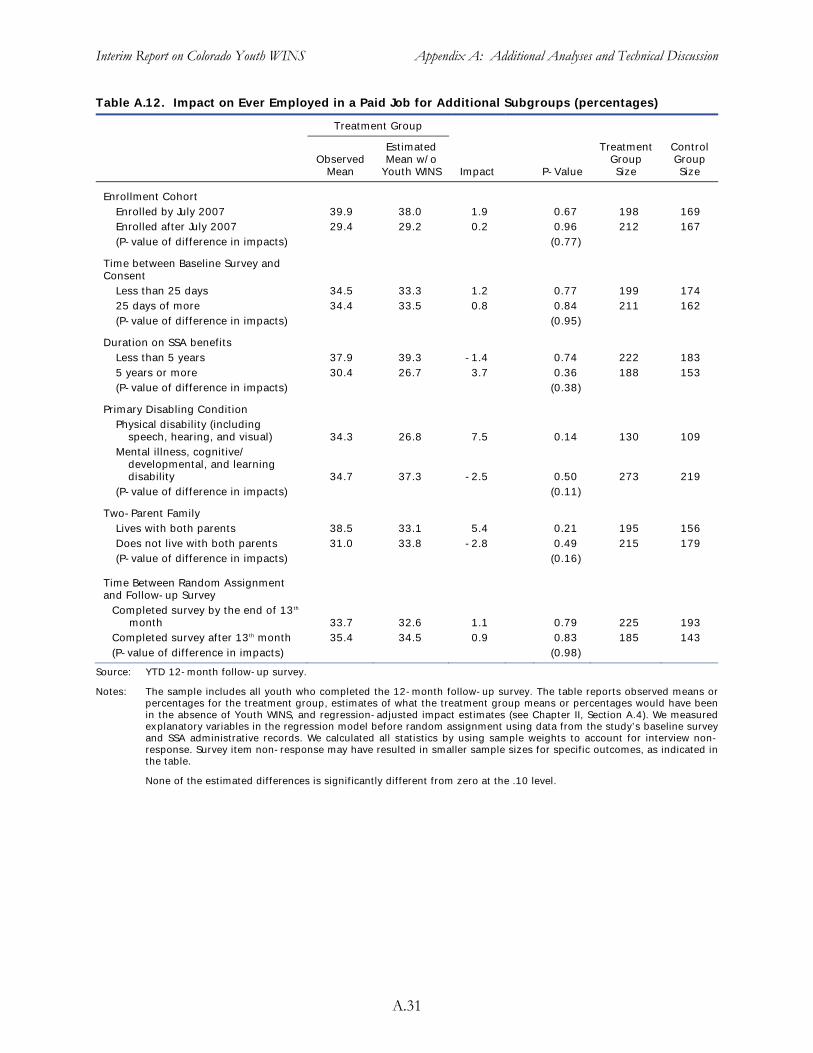
Interim Report on Colorado Youth WINS Appendix A: Additional Analyses and Technical Discussion
Table A.12. Impact on Ever Employed in a Paid Job for Additional Subgroups (percentages)
Treatment Group
Estimated Treatment Control Observed
Mean Mean w/o
Youth WINS Impact P-Value GroupSize
GroupSize
Enrollment Cohort Enrolled by July 2007 39.9 38.0 1.9 0.67 198 169
Enrolled after July 2007 29.4 29.2 0.2 0.96 212 167
(P-value of difference in impacts) (0.77)
Time between Baseline Survey and Consent
Less than 25 days 34.5 33.3 1.2 0.77 199 174
25 days of more 34.4 33.5 0.8 0.84 211 162
(P-value of difference in impacts) (0.95)
Duration on SSA benefits
Less than 5 years 37.9 39.3 -1.4 0.74 222 183
5 years or more 30.4 26.7 3.7 0.36 188 153
(P-value of difference in impacts) (0.38)
Primary Disabling Condition
Physical disability (includingspeech, hearing, and visual) 34.3 26.8 7.5 0.14 130 109
Mental illness, cognitive/developmental, and learning disability 34.7 37.3 -2.5 0.50 273 219
(P-value of difference in impacts) (0.11)
Two-Parent Family
Lives with both parents 38.5 33.1 5.4 0.21 195 156
Does not live with both parents 31.0 33.8 -2.8 0.49 215 179
(P-value of difference in impacts) (0.16)
Time Between Random Assignment and Follow-up Survey
Completed survey by the end of 13th
month 33.7 32.6 1.1 0.79 225 193
Completed survey after 13th month 35.4 34.5 0.9 0.83 185 143
(P-value of difference in impacts) (0.98)
Source: YTD 12-month follow-up survey.
Notes: The sample includes all youth who completed the 12-month follow-up survey. The table reports observed means orpercentages for the treatment group, estimates of what the treatment group means or percentages would have been in the absence of Youth WINS, and regression-adjusted impact estimates (see Chapter II, Section A.4). We measuredexplanatory variables in the regression model before random assignment using data from the study’s baseline surveyand SSA administrative records. We calculated all statistics by using sample weights to account for interview non-response. Survey item non-response may have resulted in smaller sample sizes for specific outcomes, as indicated in the table.
None of the estimated differences is significantly different from zero at the .10 level.
A.31
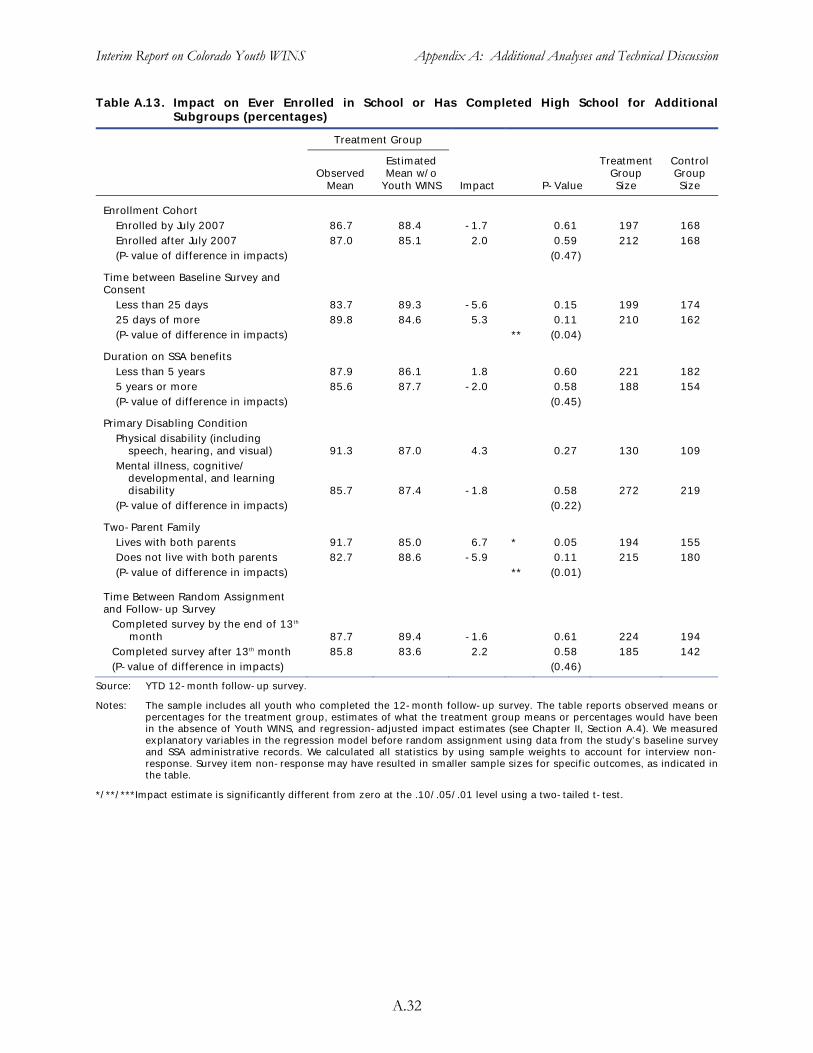
Interim Report on Colorado Youth WINS Appendix A: Additional Analyses and Technical Discussion
Table A.13. Impact on Ever Enrolled in School or Has Completed High School for Additional Subgroups (percentages)
Treatment Group
Estimated Treatment Control Observed Mean w/o Group Group
Mean Youth WINS Impact P-Value Size Size
Enrollment Cohort Enrolled by July 2007 86.7 88.4 -1.7 0.61 197 168
Enrolled after July 2007 87.0 85.1 2.0 0.59 212 168
(P-value of difference in impacts) (0.47)
Time between Baseline Survey and Consent
Less than 25 days 83.7 89.3 -5.6 0.15 199 174
25 days of more 89.8 84.6 5.3 0.11 210 162
(P-value of difference in impacts) ** (0.04)
Duration on SSA benefits
Less than 5 years 87.9 86.1 1.8 0.60 221 182
5 years or more 85.6 87.7 -2.0 0.58 188 154
(P-value of difference in impacts) (0.45)
Primary Disabling Condition
Physical disability (includingspeech, hearing, and visual) 91.3 87.0 4.3 0.27 130 109
Mental illness, cognitive/developmental, and learning disability 85.7 87.4 -1.8 0.58 272 219
(P-value of difference in impacts) (0.22)
Two-Parent Family
Lives with both parents 91.7 85.0 6.7 * 0.05 194 155
Does not live with both parents 82.7 88.6 -5.9 0.11 215 180
(P-value of difference in impacts) ** (0.01)
Time Between Random Assignment and Follow-up Survey
Completed survey by the end of 13th
month 87.7 89.4 -1.6 0.61 224 194
Completed survey after 13th month 85.8 83.6 2.2 0.58 185 142
(P-value of difference in impacts) (0.46)
Source: YTD 12-month follow-up survey.
Notes: The sample includes all youth who completed the 12-month follow-up survey. The table reports observed means orpercentages for the treatment group, estimates of what the treatment group means or percentages would have been in the absence of Youth WINS, and regression-adjusted impact estimates (see Chapter II, Section A.4). We measuredexplanatory variables in the regression model before random assignment using data from the study’s baseline surveyand SSA administrative records. We calculated all statistics by using sample weights to account for interview non-response. Survey item non-response may have resulted in smaller sample sizes for specific outcomes, as indicated in the table.
*/**/***Impact estimate is significantly different from zero at the .10/.05/.01 level using a two-tailed t-test.
A.32
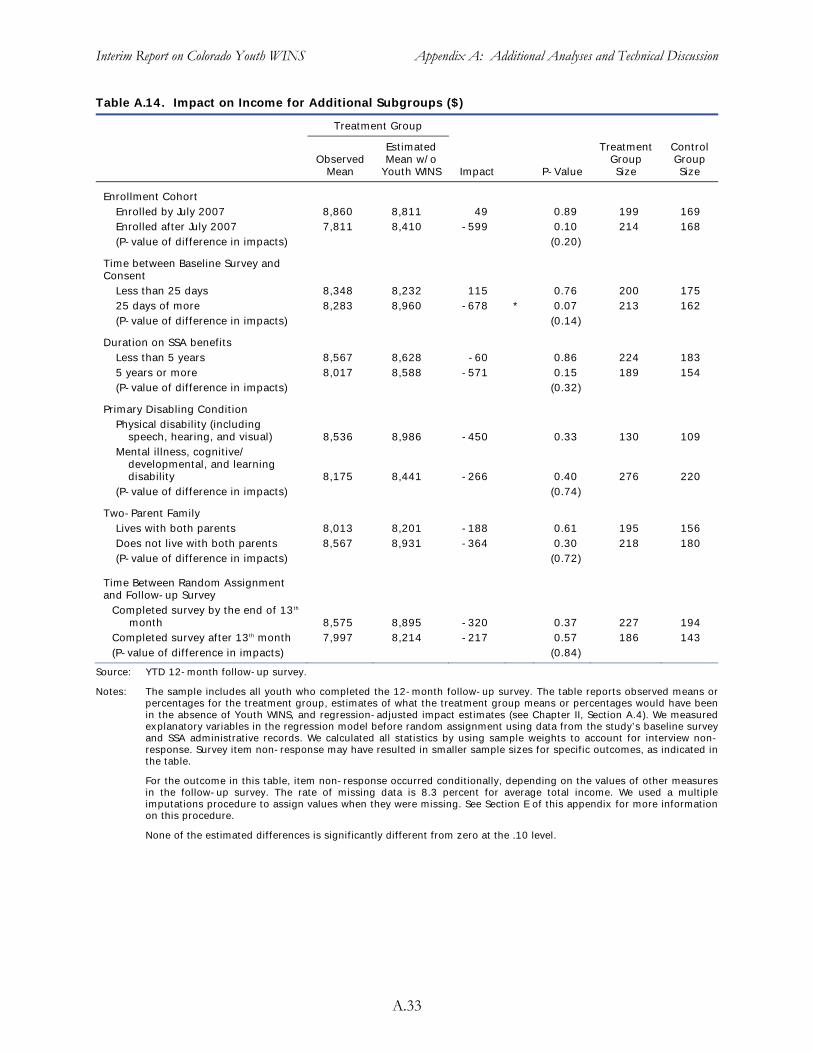
Interim Report on Colorado Youth WINS Appendix A: Additional Analyses and Technical Discussion
Table A.14. Impact on Income for Additional Subgroups ($)
Treatment Group
Estimated Treatment Control Observed
Mean Mean w/o
Youth WINS Impact P-Value GroupSize
GroupSize
Enrollment Cohort Enrolled by July 2007Enrolled after July 2007 (P-value of difference in impacts)
8,860 7,811
8,811 8,410
49 -599
0.89 0.10 (0.20)
199 214
169 168
Time between Baseline Survey and Consent
Less than 25 days 25 days of more (P-value of difference in impacts)
8,348 8,283
8,232 8,960
115 -678 *
0.76 0.07 (0.14)
200 213
175 162
Duration on SSA benefits Less than 5 years 5 years or more (P-value of difference in impacts)
8,567 8,017
8,628 8,588
-60 -571
0.86 0.15 (0.32)
224 189
183 154
Primary Disabling ConditionPhysical disability (including
speech, hearing, and visual) Mental illness, cognitive/
developmental, and learning disability
(P-value of difference in impacts)
8,536
8,175
8,986
8,441
-450
-266
0.33
0.40 (0.74)
130
276
109
220
Two-Parent FamilyLives with both parents Does not live with both parents (P-value of difference in impacts)
8,013 8,567
8,201 8,931
-188 -364
0.61 0.30 (0.72)
195 218
156 180
Time Between Random Assignment and Follow-up Survey
Completed survey by the end of 13th
month Completed survey after 13th month (P-value of difference in impacts)
8,575 7,997
8,895 8,214
-320 -217
0.37 0.57
(0.84)
227 186
194 143
Source: YTD 12-month follow-up survey.
Notes: The sample includes all youth who completed the 12-month follow-up survey. The table reports observed means orpercentages for the treatment group, estimates of what the treatment group means or percentages would have been in the absence of Youth WINS, and regression-adjusted impact estimates (see Chapter II, Section A.4). We measuredexplanatory variables in the regression model before random assignment using data from the study’s baseline surveyand SSA administrative records. We calculated all statistics by using sample weights to account for interview non-response. Survey item non-response may have resulted in smaller sample sizes for specific outcomes, as indicated in the table.
For the outcome in this table, item non-response occurred conditionally, depending on the values of other measures in the follow-up survey. The rate of missing data is 8.3 percent for average total income. We used a multipleimputations procedure to assign values when they were missing. See Section E of this appendix for more informationon this procedure.
None of the estimated differences is significantly different from zero at the .10 level.
A.33
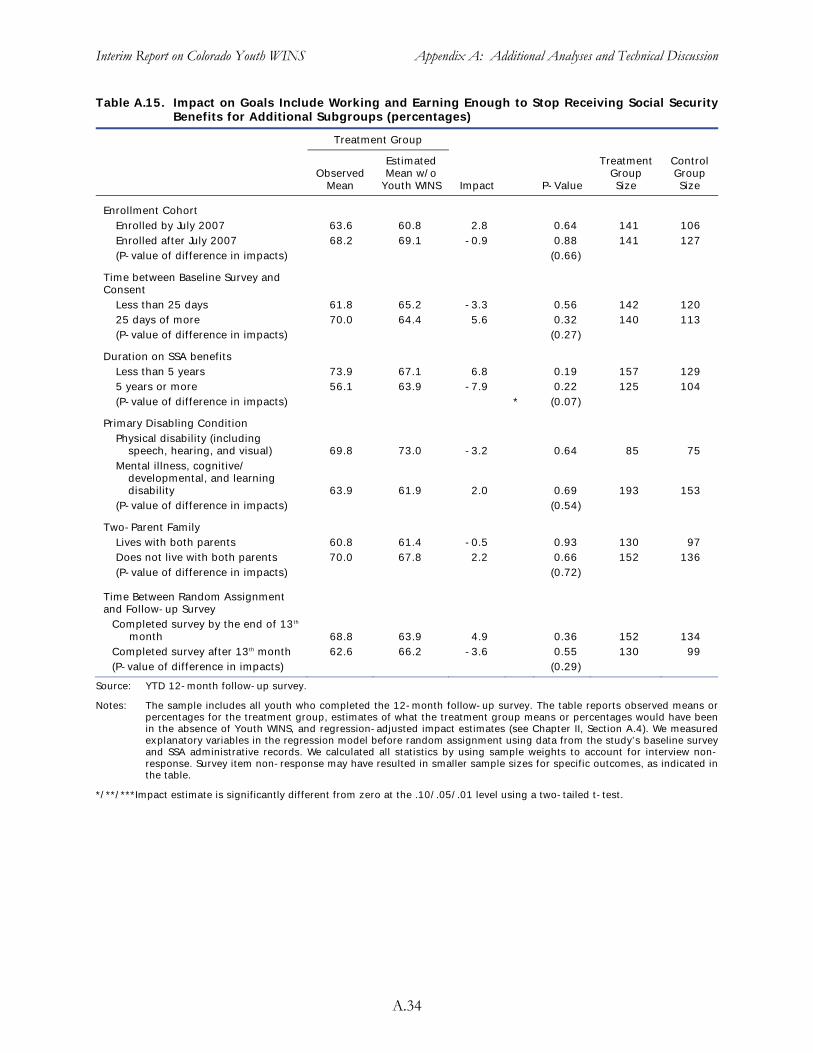
Interim Report on Colorado Youth WINS Appendix A: Additional Analyses and Technical Discussion
Table A.15. Impact on Goals Include Working and Earning Enough to Stop Receiving Social SecurityBenefits for Additional Subgroups (percentages)
Treatment Group
Estimated Treatment Control Observed
Mean Mean w/o
Youth WINS Impact P-Value GroupSize
GroupSize
Enrollment Cohort Enrolled by July 2007 63.6 60.8 2.8 0.64 141 106
Enrolled after July 2007 68.2 69.1 -0.9 0.88 141 127
(P-value of difference in impacts) (0.66)
Time between Baseline Survey and Consent
Less than 25 days 61.8 65.2 -3.3 0.56 142 120
25 days of more 70.0 64.4 5.6 0.32 140 113
(P-value of difference in impacts) (0.27)
Duration on SSA benefits
Less than 5 years 73.9 67.1 6.8 0.19 157 129
5 years or more 56.1 63.9 -7.9 0.22 125 104
(P-value of difference in impacts) * (0.07)
Primary Disabling Condition
Physical disability (includingspeech, hearing, and visual) 69.8 73.0 -3.2 0.64 85 75
Mental illness, cognitive/developmental, and learning disability 63.9 61.9 2.0 0.69 193 153
(P-value of difference in impacts) (0.54)
Two-Parent Family
Lives with both parents 60.8 61.4 -0.5 0.93 130 97
Does not live with both parents 70.0 67.8 2.2 0.66 152 136
(P-value of difference in impacts) (0.72)
Time Between Random Assignment and Follow-up Survey
Completed survey by the end of 13th
month 68.8 63.9 4.9 0.36 152 134
Completed survey after 13th month 62.6 66.2 -3.6 0.55 130 99
(P-value of difference in impacts) (0.29)
Source: YTD 12-month follow-up survey.
Notes: The sample includes all youth who completed the 12-month follow-up survey. The table reports observed means orpercentages for the treatment group, estimates of what the treatment group means or percentages would have been in the absence of Youth WINS, and regression-adjusted impact estimates (see Chapter II, Section A.4). We measuredexplanatory variables in the regression model before random assignment using data from the study’s baseline surveyand SSA administrative records. We calculated all statistics by using sample weights to account for interview non-response. Survey item non-response may have resulted in smaller sample sizes for specific outcomes, as indicated in the table.
*/**/***Impact estimate is significantly different from zero at the .10/.05/.01 level using a two-tailed t-test.
A.34
Interim Report on Colorado Youth WINS Appendix A: Additional Analyses and Technical Discussion
H. Additional Self-Efficacy Outcomes
In Chapter VIII, we reported that Youth WINS did not have statistically significant impacts on the internal or external locus of control. We created these composite measures from a series of questions in the follow-up survey. The self-efficacy measures are based on a battery of 12 questions that includes the Pearlin Mastery Scale (Pearlin and Schooler 1978). We selected one of these questions, on goals for future work and earnings, as the primary outcome in this domain because of its relevance to the YTD initiative. We used factor analysis to determine that the remaining 11 questions could be aggregated into two factors based on the high degree of correlation of the measures within the two groupings. After examining the concepts in each group of questions, we labeled the first group “internal locus of control” and the second group “external locus of control.”142
It is preferable to use the two composite outcomes instead of estimating impacts separately for each question because the questions are meant to assess the same underlying concept (self-efficacy) and the responses are highly correlated within two factors. The composite measures have lower random variation than the separate measures, and the approach addresses the multiple comparisons problem (Chapter II). Specifically, with 11 outcomes, we would expect to find one statistically significant impact because of random variation even if Youth WINS had no impact on self-efficacy.
In this evaluation, the internal locus of control reflects whether youth believe their life outcomes result primarily from their own behaviors and actions. Our measure of the internal locus of control is an index based on the degree to which youth agreed with the following five statements:
What happens to you in the future mostly depends on you.
You can do just about anything you really set your mind to.
You tell other people how you feel when they upset you or hurt your feelings.
You know how to get the information you need.
You have a good sense of the path you want to take in life and the steps to get there.
The index for the internal locus of control runs from 1 to 4, with 1 signaling strong disagreement with the statements and 4 signaling strong agreement. The average value of this index for treatment group youth is 3.3, and we estimated that, in the absence of Youth WINS, the average would have been the same.
The external locus of control reflects the degree to which youth believe that others, fate, or chance primarily determine their life outcomes. Our measure of the external locus of control is an index based on the degree to which youth agreed with the following six statements:
You have little control over the things that happen to you.
There is really no way you can solve some of the problems you have.
There is little you can do to change many of the things in your life.
142 The factor analysis showed that the questions in each group had a high degree of correlation, so it is appropriate to combine the separate questions in a single measure for each group. Furthermore, the results of the factor analysis are consistent with grouping the questions conceptually, based on whether they affirm or suggest a lack of self-efficacy.
A.35
Interim Report on Colorado Youth WINS Appendix A: Additional Analyses and Technical Discussion
You often feel helpless in dealing with the problems of life.
Sometimes you feel like you are being pushed around in life.
Your job opportunities will be limited by discrimination because of your gender, race, or disability.
This index also runs from 1 to 4, with 1 signaling strong agreement with the statements and 4 signaling strong disagreement. The average value of this index for the external locus of control for treatment group youth is 2.7. We estimated that these youth would have had essentially the same average value of this index even if they had not been given the opportunity to participate in Youth WINS.
As a robustness check for the findings from the two composite measures, we also estimated the impact estimates for each question separately. Consistent with the findings for the composite outcomes, we found no statistically significant impacts for any of the 11 questions (Table A.16).
A.36
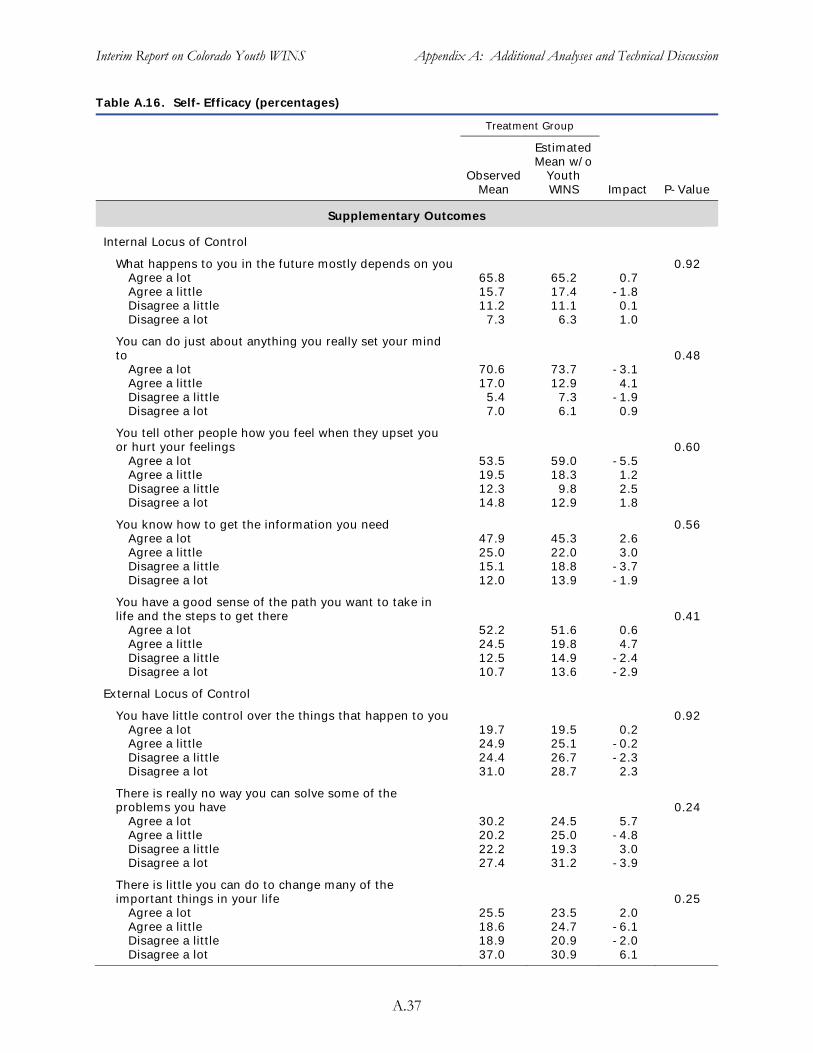
Interim Report on Colorado Youth WINS Appendix A: Additional Analyses and Technical Discussion
Table A.16. Self-Efficacy (percentages)
Treatment Group
Estimated Mean w/o
Observed Youth Mean WINS Impact P-Value
Supplementary Outcomes
Internal Locus of Control
What happens to you in the future mostly depends on you Agree a lotAgree a littleDisagree a littleDisagree a lot
You can do just about anything you really set your mind to
Agree a lotAgree a littleDisagree a little Disagree a lot
You tell other people how you feel when they upset you or hurt your feelings
Agree a lotAgree a littleDisagree a littleDisagree a lot
You know how to get the information you need Agree a lotAgree a littleDisagree a littleDisagree a lot
You have a good sense of the path you want to take in life and the steps to get there
Agree a lotAgree a littleDisagree a littleDisagree a lot
External Locus of Control
65.8 15.7 11.2
7.3
70.6 17.0
5.4 7.0
53.5 19.5 12.3 14.8
47.9 25.0 15.1 12.0
52.2 24.5 12.5 10.7
65.2 17.4 11.1
6.3
73.7 12.9
7.3 6.1
59.0 18.3 9.8
12.9
45.3 22.0 18.8 13.9
51.6 19.8 14.9 13.6
0.7 -1.8 0.1 1.0
-3.1 4.1
-1.9 0.9
-5.5 1.2 2.5 1.8
2.6 3.0
-3.7 -1.9
0.6 4.7
-2.4 -2.9
0.92
0.48
0.60
0.56
0.41
You have little control over the things that happen to you Agree a lotAgree a littleDisagree a littleDisagree a lot
There is really no way you can solve some of theproblems you have
Agree a lotAgree a littleDisagree a littleDisagree a lot
There is little you can do to change many of the important things in your life
Agree a lotAgree a littleDisagree a littleDisagree a lot
19.7 24.9 24.4 31.0
30.2 20.2 22.2 27.4
25.5 18.6 18.9 37.0
19.5 25.1 26.7 28.7
24.5 25.0 19.3 31.2
23.5 24.7 20.9 30.9
0.2 -0.2 -2.3 2.3
5.7 -4.8 3.0
-3.9
2.0 -6.1 -2.0 6.1
0.92
0.24
0.25
A.37
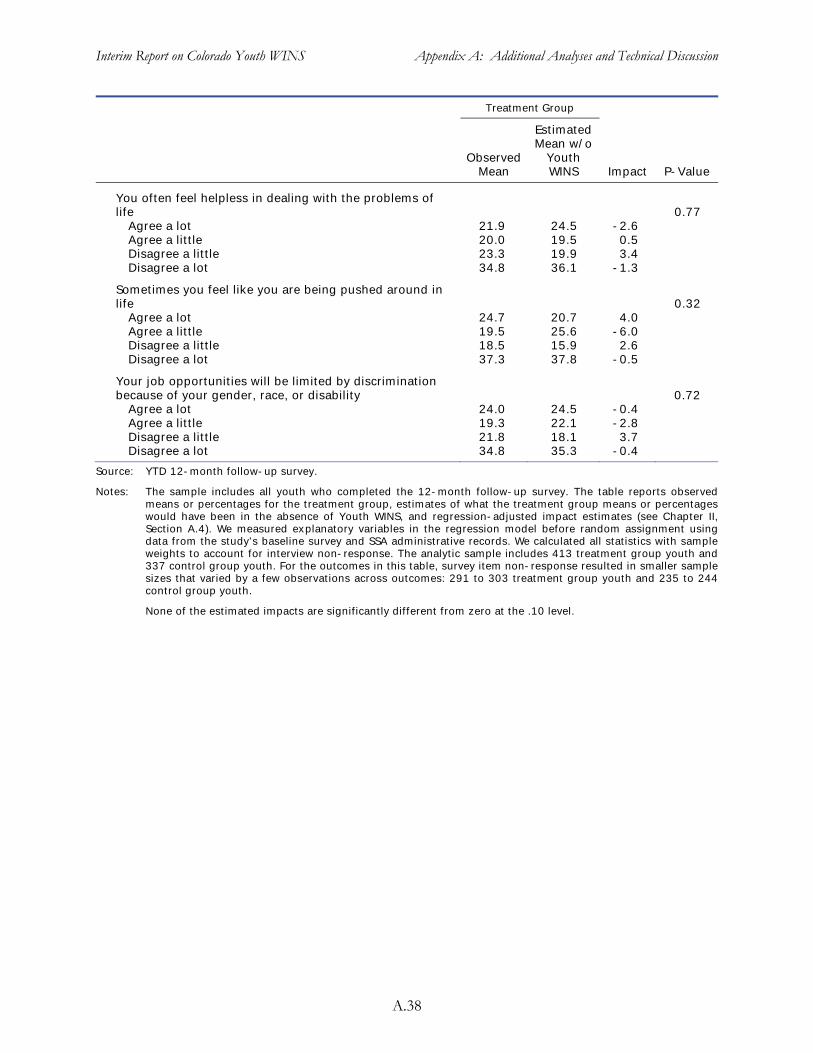
Interim Report on Colorado Youth WINS Appendix A: Additional Analyses and Technical Discussion
Treatment Group
Estimated
Observed Mean w/o
Youth Mean WINS Impact P-Value
You often feel helpless in dealing with the problems oflife 0.77
Agree a lotAgree a littleDisagree a littleDisagree a lot
21.9 20.0 23.3 34.8
24.5 19.5 19.9 36.1
-2.6 0.5 3.4
-1.3
Sometimes you feel like you are being pushed around in life 0.32
Agree a lotAgree a littleDisagree a littleDisagree a lot
24.7 19.5 18.5 37.3
20.7 25.6 15.9 37.8
4.0 -6.0 2.6
-0.5
Your job opportunities will be limited by discriminationbecause of your gender, race, or disability
Agree a lotAgree a littleDisagree a littleDisagree a lot
24.0 19.3 21.8 34.8
24.5 22.1 18.1 35.3
-0.4 -2.8 3.7
-0.4
0.72
Source: YTD 12-month follow-up survey.
Notes: The sample includes all youth who completed the 12-month follow-up survey. The table reports observedmeans or percentages for the treatment group, estimates of what the treatment group means or percentageswould have been in the absence of Youth WINS, and regression-adjusted impact estimates (see Chapter II, Section A.4). We measured explanatory variables in the regression model before random assignment using data from the study’s baseline survey and SSA administrative records. We calculated all statistics with sampleweights to account for interview non-response. The analytic sample includes 413 treatment group youth and337 control group youth. For the outcomes in this table, survey item non-response resulted in smaller samplesizes that varied by a few observations across outcomes: 291 to 303 treatment group youth and 235 to 244 control group youth.
None of the estimated impacts are significantly different from zero at the .10 level.
A.38
APPENDIX B
I-TEAM JOB DESCRIPTIONS

Interim Report on Colorado Youth WINS Appendix B: I-Team Job Descriptions
Disability Program Navigator (DPN). This position was originally based upon the Disability Program Navigator Initiative that was implemented in selected One-Stop Workforce Centers and was funded jointly by the U.S. Department of Labor (DOL) and SSA. The U.S. DOL DPNs help people with disabilities “navigate” through the enormous challenge of seeking work, educate One-Stop staff, and inform SSA beneficiaries and others with disabilities about the work support programs available through the Workforce System. The U.S. DOL DPN initiative is intended to increase employment and self-sufficiency for people with disabilities, and facilitate seamless and comprehensive services in the One-Stop Workforce Centers. In Youth WINS, the DPNs did not specifically act as a resource for One-Stop staff, but they did assist youth in accessing services from various government agencies and community-based organizations, as well as advocate on their behalf with these entities, and served as a resource to and link between participants and service providers. They sought to “fill gaps” by trying to solve system shortcomings, and ensure that other programs served people as they should.
Benefits Planner. The benefits planner position was based upon SSA’s WIPA program. This grant-funded program, provided in all 50 states, funds full-time professional benefits planners who serve any person receiving SSI or DI. The WIPA benefits planners help people and their families understand the impact that work will have on benefits, and help ensure that people use work incentives in a way that maximizes their employment opportunities and financial independence. In Youth WINS, benefits planners helped youth, their families, and their representative payees understand the implications of work, earnings, and resources on disability program benefits. They informed youth of the work incentives that are available to them under standard SSA rules and also encouraged use of the special YTD waivers. Youth WINS benefits planners helped the enrollees access these work incentives and, in particular, served as a liaison with the SSA field office to troubleshoot problems with benefits, ensure that the enrollees had full access to the waiver provisions, and that they reported earnings appropriately.
Career Counselor. The career counselor provided Youth WINS enrollees with individualized, client-driven career planning services. This included vocational assessments and career exploration, as well as job development services (i.e., they worked with local employers to identify appropriate jobs for Youth WINS enrollees) and job placement services. The career counselor gave support to maintain employment after enrollees obtain jobs, by arranging job accommodations or job coaching services. The career counselor also worked with other employment service agencies, such as the One-Stop support staff, the Colorado Division of Vocational Rehabilitation, and the employment program funded by the Community Centered Boards, in order to coordinate employment supports.
B.1

APPENDIX C
SUPPORTING TABLES FOR CHAPTER III: RECEIPT OF SPECIFIC YOUTH WINS SERVICES

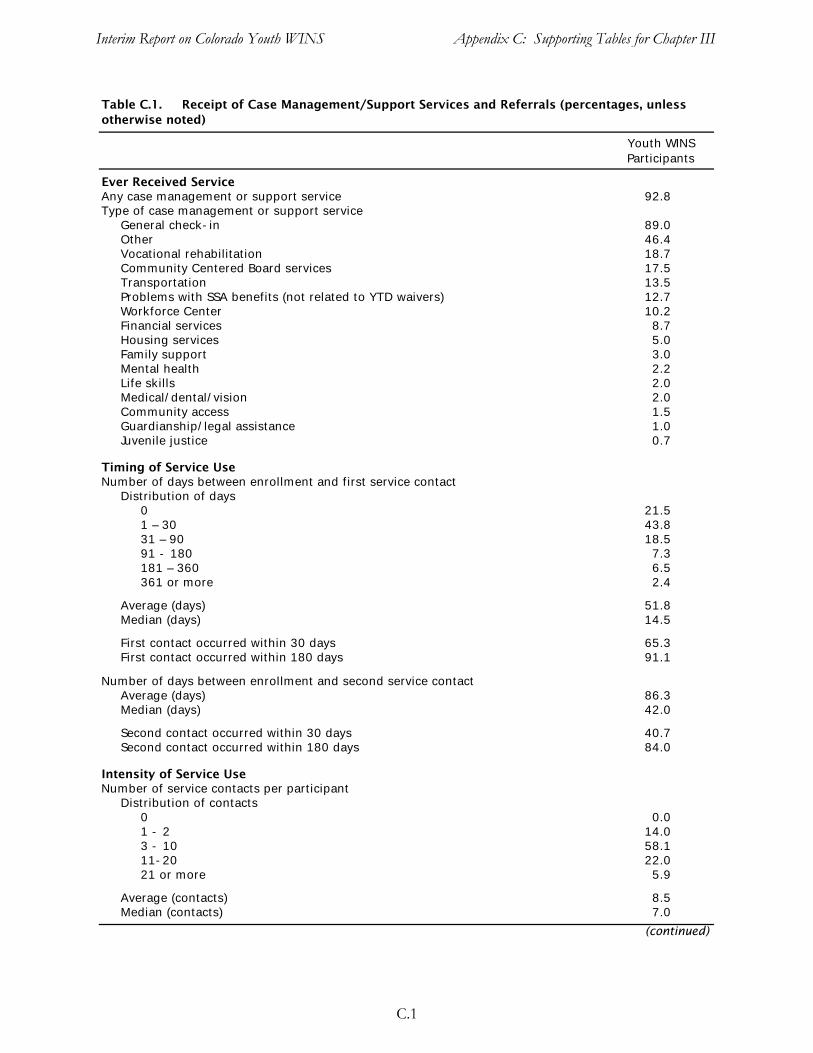
Interim Report on Colorado Youth WINS Appendix C: Supporting Tables for Chapter III
Table C.1. Receipt of Case Management/Support Services and Referrals (percentages, unless otherwise noted)
Youth WINS Participants
Ever Received Service Any case management or support service 92.8 Type of case management or support service
General check-in 89.0 Other 46.4 Vocational rehabilitation 18.7 Community Centered Board services 17.5 Transportation 13.5 Problems with SSA benefits (not related to YTD waivers) 12.7 Workforce Center 10.2 Financial services 8.7 Housing services 5.0 Family support 3.0 Mental health 2.2 Life skills 2.0 Medical/dental/vision 2.0 Community access 1.5 Guardianship/legal assistance 1.0 Juvenile justice 0.7
Timing of Service Use Number of days between enrollment and first service contact
Distribution of days 0 21.5 1 – 30 43.8 31 – 90 18.5 91 - 180 7.3 181 – 360 6.5 361 or more 2.4
Average (days) Median (days)
51.8 14.5
First contact occurred within 30 days First contact occurred within 180 days
65.3 91.1
Number of days between enrollment and second service contact Average (days) 86.3 Median (days) 42.0
Second contact occurred within 30 days Second contact occurred within 180 days
40.7 84.0
Intensity of Service Use Number of service contacts per participant
Distribution of contacts 0 0.0 1 - 2 14.0 3 - 10 58.1 11-20 22.0 21 or more 5.9
Average (contacts) Median (contacts)
8.5 7.0
C.1
(continued)
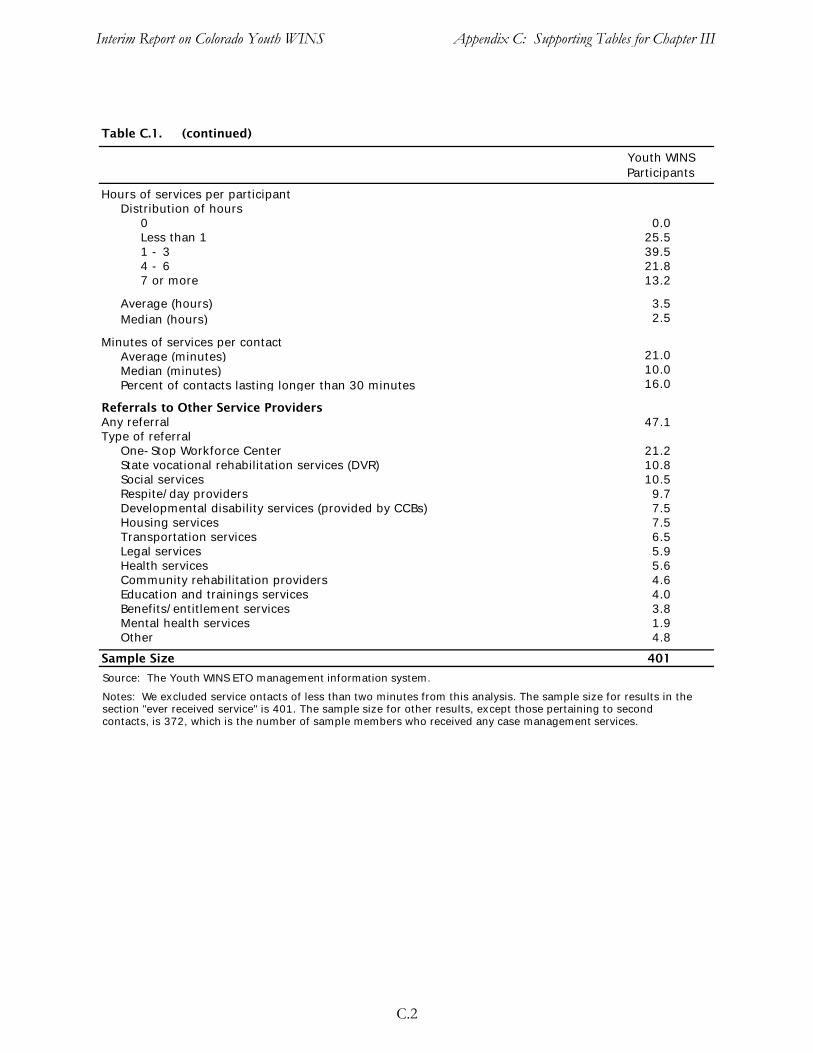
Interim Report on Colorado Youth WINS Appendix C: Supporting Tables for Chapter III
Table C.1. (continued)
Youth WINS Participants
Hours of services per participant Distribution of hours
0 0.0 Less than 1 25.5 1 - 3 39.5 4 - 6 21.8 7 or more 13.2
Average (hours) 3.5 Median (hours) 2.5
Minutes of services per contact Average (minutes) 21.0 Median (minutes) 10.0 Percent of contacts lasting longer than 30 minutes 16.0
Referrals to Other Service Providers Any referral 47.1 Type of referral
One-Stop Workforce Center 21.2 State vocational rehabilitation services (DVR) 10.8 Social services 10.5 Respite/day providers 9.7 Developmental disability services (provided by CCBs) 7.5 Housing services 7.5 Transportation services 6.5 Legal services 5.9 Health services 5.6 Community rehabilitation providers 4.6 Education and trainings services 4.0 Benefits/entitlement services 3.8 Mental health services 1.9 Other 4.8
Sample Size 401
Source: The Youth WINS ETO management information system.
Notes: We excluded service ontacts of less than two minutes from this analysis. The sample size for results in the section "ever received service" is 401. The sample size for other results, except those pertaining to secondcontacts, is 372, which is the number of sample members who received any case management services.
C.2
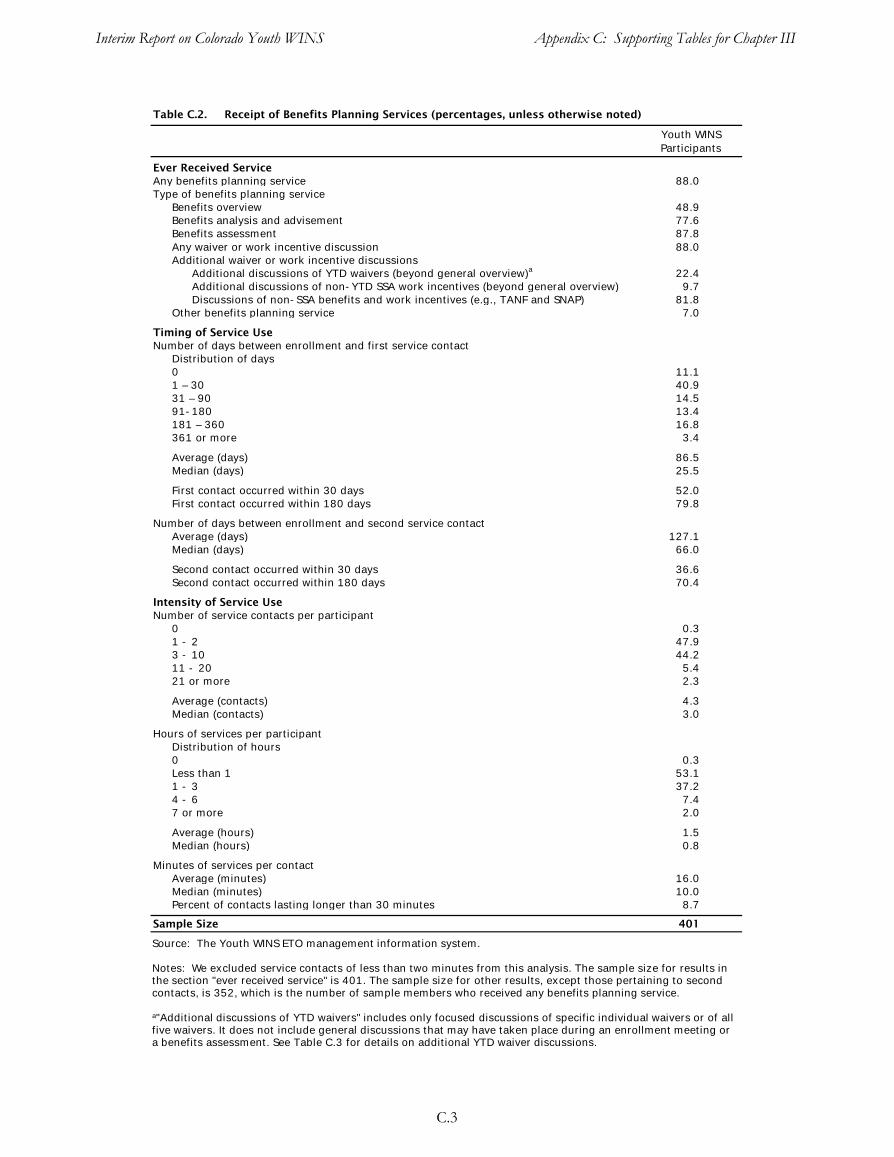
Interim Report on Colorado Youth WINS Appendix C: Supporting Tables for Chapter III
Table C.2. Receipt of Benefits Planning Services (percentages, unless otherwise noted)
Youth WINS Participants
Ever Received Service Any benefits planning service 88.0 Type of benefits planning service
Benefits overview 48.9 Benefits analysis and advisement 77.6 Benefits assessment 87.8 Any waiver or work incentive discussion Additional waiver or work incentive discussions
88.0
Additional discussions of YTD waivers (beyond general overview)a 22.4 Additional discussions of non-YTD SSA work incentives (beyond general overview) 9.7 Discussions of non-SSA benefits and work incentives (e.g., TANF and SNAP) 81.8
Other benefits planning service 7.0
Timing of Service Use Number of days between enrollment and first service contact
Distribution of days 0 11.1 1 – 30 40.9 31 – 90 14.5 91-180 13.4 181 – 360 16.8 361 or more 3.4
Average (days) Median (days)
86.5 25.5
First contact occurred within 30 days First contact occurred within 180 days
52.0 79.8
Number of days between enrollment and second service contact Average (days) 127.1 Median (days) 66.0
Second contact occurred within 30 days Second contact occurred within 180 days
36.6 70.4
Intensity of Service Use Number of service contacts per participant
0 0.3 1 - 2 47.9 3 - 10 44.2 11 - 20 5.4 21 or more 2.3
Average (contacts) Median (contacts)
4.3 3.0
Hours of services per participant Distribution of hours 0 0.3 Less than 1 53.1 1 - 3 37.2 4 - 6 7.4 7 or more 2.0
Average (hours) Median (hours)
1.5 0.8
Minutes of services per contact Average (minutes) 16.0 Median (minutes) 10.0 Percent of contacts lasting longer than 30 minutes 8.7
Sample Size 401
Source: The Youth WINS ETO management information system.
Notes: We excluded service contacts of less than two minutes from this analysis. The sample size for results inthe section "ever received service" is 401. The sample size for other results, except those pertaining to secondcontacts, is 352, which is the number of sample members who received any benefits planning service.
a"Additional discussions of YTD waivers" includes only focused discussions of specific individual waivers or of all five waivers. It does not include general discussions that may have taken place during an enrollment meeting ora benefits assessment. See Table C.3 for details on additional YTD waiver discussions.
C.3
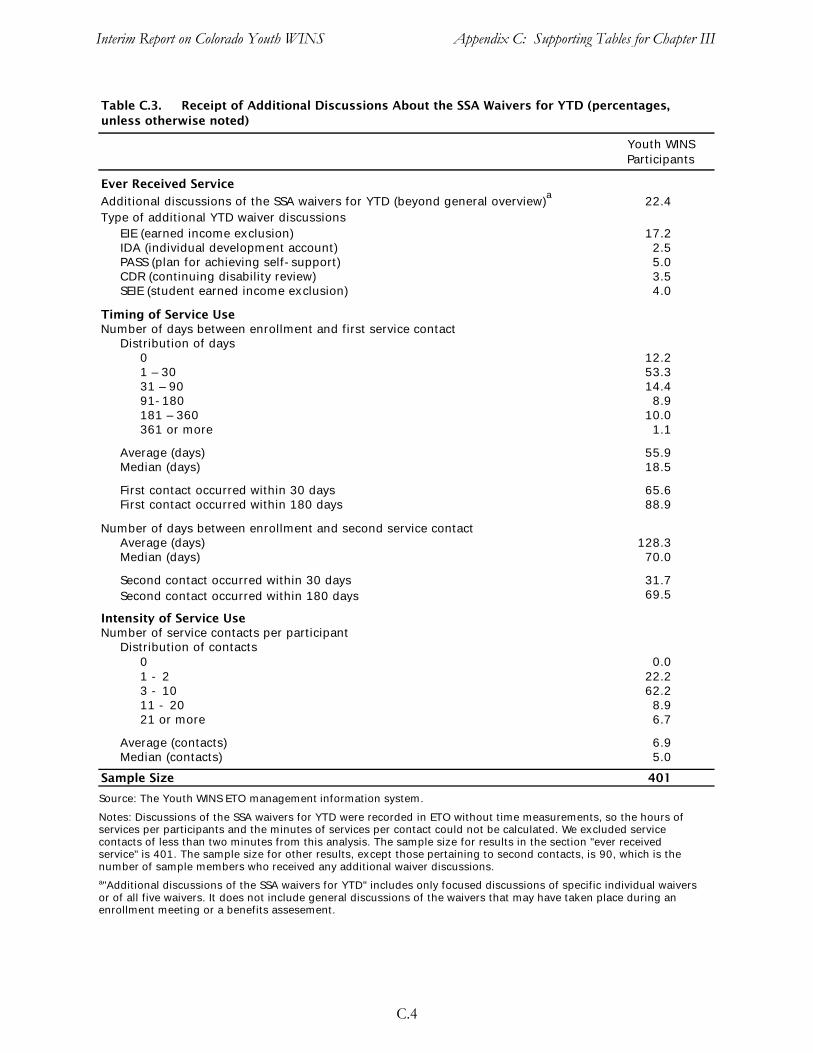
Interim Report on Colorado Youth WINS Appendix C: Supporting Tables for Chapter III
Table C.3. Receipt of Additional Discussions About the SSA Waivers for YTD (percentages, unless otherwise noted)
Youth WINS Participants
Ever Received Service
Additional discussions of the SSA waivers for YTD (beyond general overview)a
22.4 Type of additional YTD waiver discussions
EIE (earned income exclusion) 17.2 IDA (individual development account) 2.5 PASS (plan for achieving self-support) 5.0 CDR (continuing disability review) 3.5 SEIE (student earned income exclusion) 4.0
Timing of Service Use Number of days between enrollment and first service contact
Distribution of days 0 12.2 1 – 30 53.3 31 – 90 14.4 91-180 8.9 181 – 360 10.0 361 or more 1.1
Average (days) 55.9 Median (days) 18.5
First contact occurred within 30 days 65.6 First contact occurred within 180 days 88.9
Number of days between enrollment and second service contact Average (days) 128.3 Median (days) 70.0
Second contact occurred within 30 days 31.7 Second contact occurred within 180 days 69.5
Intensity of Service Use Number of service contacts per participant
Distribution of contacts 0 0.0 1 - 2 22.2 3 - 10 62.2 11 - 20 8.9 21 or more 6.7
Average (contacts) 6.9 Median (contacts) 5.0
Sample Size 401
Source: The Youth WINS ETO management information system.
Notes: Discussions of the SSA waivers for YTD were recorded in ETO without time measurements, so the hours ofservices per participants and the minutes of services per contact could not be calculated. We excluded service contacts of less than two minutes from this analysis. The sample size for results in the section "ever receivedservice" is 401. The sample size for other results, except those pertaining to second contacts, is 90, which is the number of sample members who received any additional waiver discussions. a"Additional discussions of the SSA waivers for YTD" includes only focused discussions of specific individual waiversor of all five waivers. It does not include general discussions of the waivers that may have taken place during anenrollment meeting or a benefits assesement.
C.4
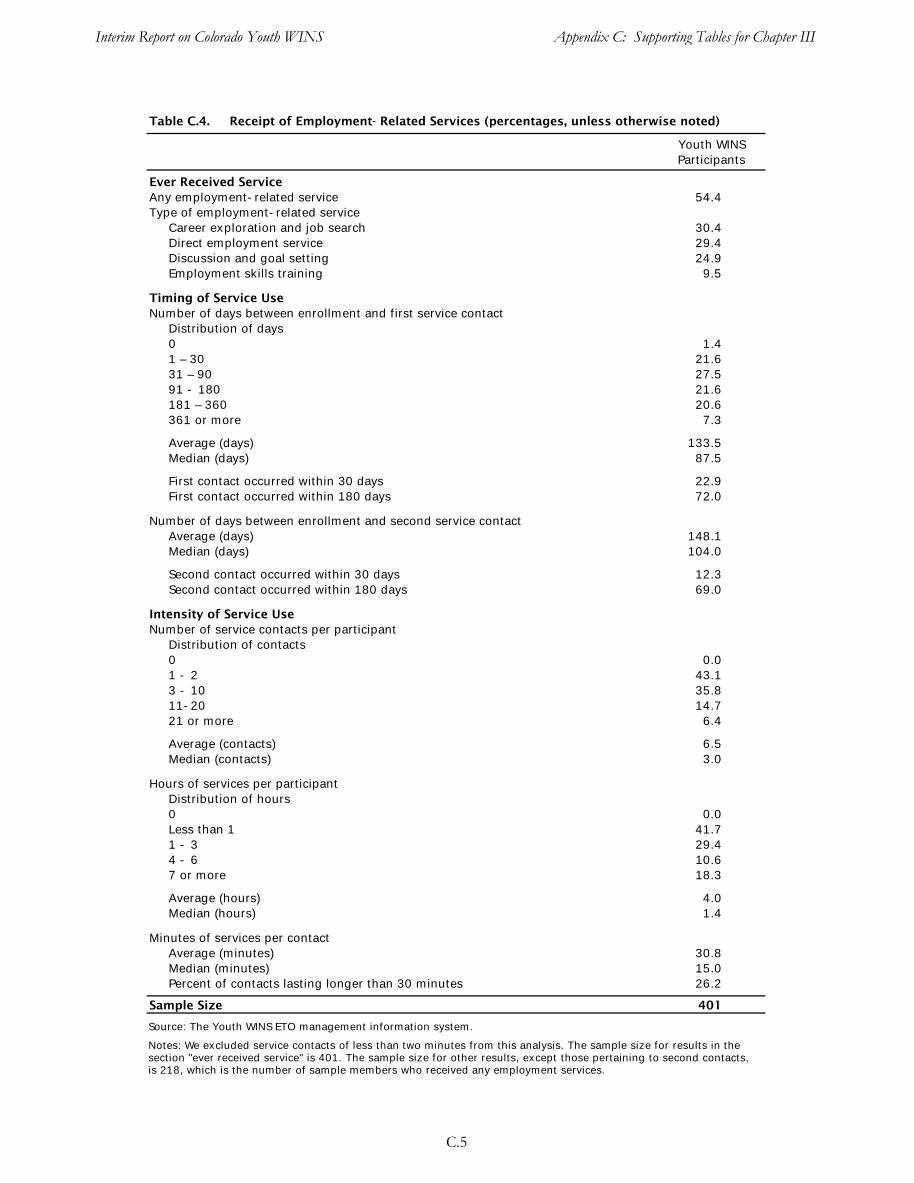
Interim Report on Colorado Youth WINS Appendix C: Supporting Tables for Chapter III
Table C.4. Receipt of Employment- Related Services (percentages, unless otherwise noted)
Youth WINS Participants
Ever Received Service Any employment-related service 54.4 Type of employment-related service
Career exploration and job search 30.4 Direct employment service 29.4 Discussion and goal setting 24.9 Employment skills training 9.5
Timing of Service Use Number of days between enrollment and first service contact
Distribution of days 0 1.4 1 – 30 21.6 31 – 90 27.5 91 - 180 21.6 181 – 360 20.6 361 or more 7.3
Average (days) Median (days)
133.5 87.5
First contact occurred within 30 days First contact occurred within 180 days
22.9 72.0
Number of days between enrollment and second service contact Average (days) 148.1 Median (days) 104.0
Second contact occurred within 30 days Second contact occurred within 180 days
12.3 69.0
Intensity of Service Use Number of service contacts per participant
Distribution of contacts 0 0.0 1 - 2 43.1 3 - 10 35.8 11-20 14.7 21 or more 6.4
Average (contacts) Median (contacts)
6.5 3.0
Hours of services per participant Distribution of hours 0 0.0 Less than 1 41.7 1 - 3 29.4 4 - 6 10.6 7 or more 18.3
Average (hours) Median (hours)
4.0 1.4
Minutes of services per contact Average (minutes) 30.8 Median (minutes) 15.0 Percent of contacts lasting longer than 30 minutes 26.2
Sample Size 401
Source: The Youth WINS ETO management information system.
Notes: We excluded service contacts of less than two minutes from this analysis. The sample size for results in thesection "ever received service" is 401. The sample size for other results, except those pertaining to second contacts,is 218, which is the number of sample members who received any employment services.
C.5
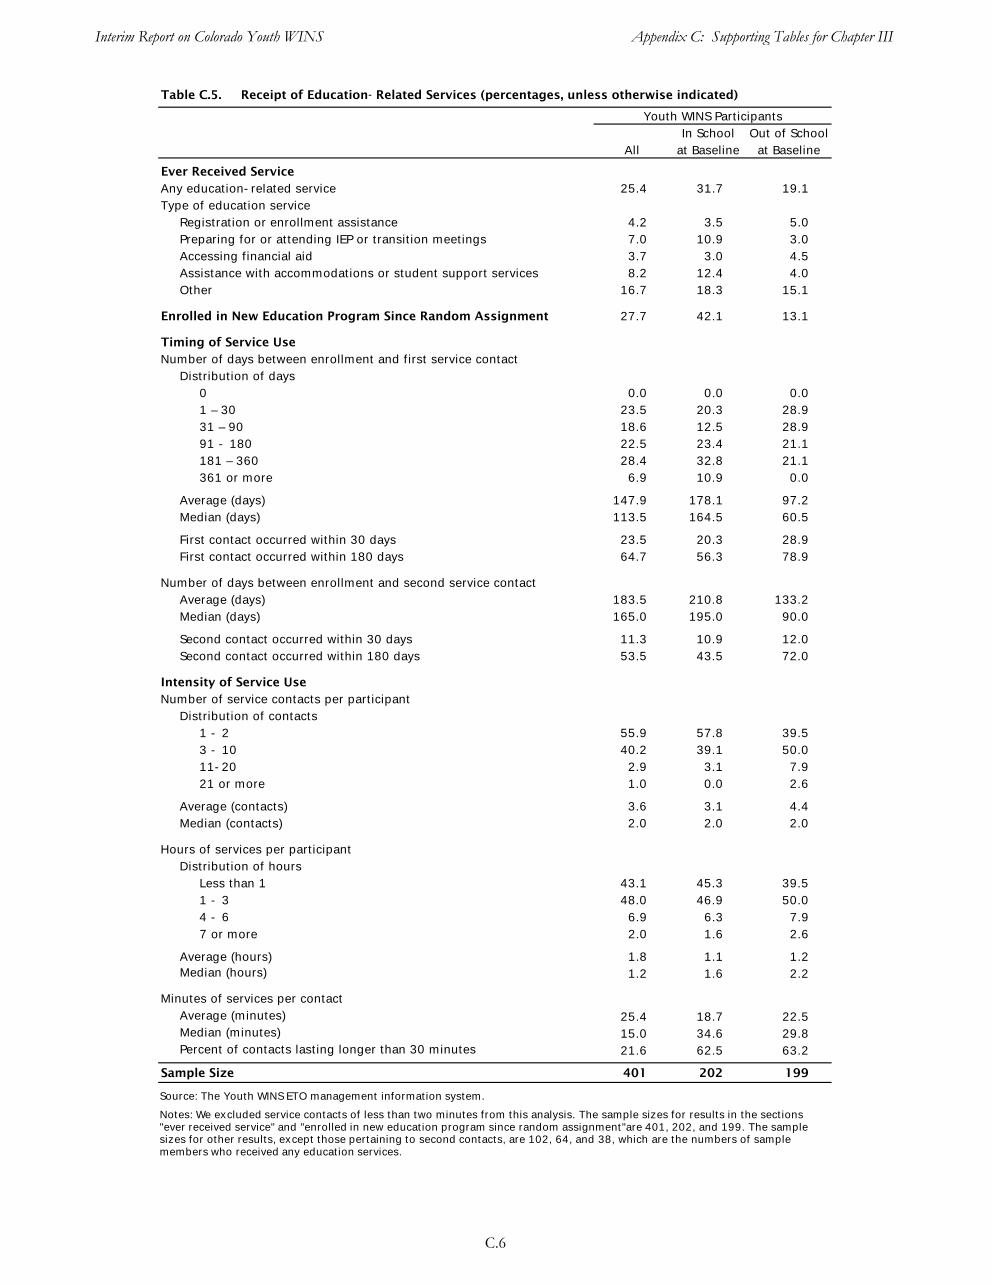
Interim Report on Colorado Youth WINS Appendix C: Supporting Tables for Chapter III
Table C.5. Receipt of Education- Related Services (percentages, unless otherwise indicated)
Youth WINS Participants In School Out of School
All at Baseline at Baseline
Ever Received Service Any education-related service 25.4 31.7 19.1 Type of education service
Registration or enrollment assistance 4.2 3.5 5.0 Preparing for or attending IEP or transition meetings 7.0 10.9 3.0 Accessing financial aid 3.7 3.0 4.5 Assistance with accommodations or student support services 8.2 12.4 4.0 Other 16.7 18.3 15.1
Enrolled in New Education Program Since Random Assignment 27.7 42.1 13.1
Timing of Service Use Number of days between enrollment and first service contact
Distribution of days0 0.0 0.0 0.0 1 – 30 23.5 20.3 28.9 31 – 90 18.6 12.5 28.9 91 - 180 22.5 23.4 21.1 181 – 360 28.4 32.8 21.1 361 or more 6.9 10.9 0.0
Average (days) 147.9 178.1 97.2 Median (days) 113.5 164.5 60.5
First contact occurred within 30 days 23.5 20.3 28.9 First contact occurred within 180 days 64.7 56.3 78.9
Number of days between enrollment and second service contactAverage (days) 183.5 210.8 133.2 Median (days) 165.0 195.0 90.0
Second contact occurred within 30 days 11.3 10.9 12.0 Second contact occurred within 180 days 53.5 43.5 72.0
Intensity of Service Use Number of service contacts per participant
Distribution of contacts 1 - 2 55.9 57.8 39.5 3 - 10 40.2 39.1 50.0 11-20 2.9 3.1 7.9 21 or more 1.0 0.0 2.6
Average (contacts) 3.6 3.1 4.4 Median (contacts) 2.0 2.0 2.0
Hours of services per participantDistribution of hours
Less than 1 43.1 45.3 39.5 1 - 3 48.0 46.9 50.0 4 - 6 6.9 6.3 7.9 7 or more 2.0 1.6 2.6
Average (hours) 1.8 1.1 1.2 Median (hours) 1.2 1.6 2.2
Minutes of services per contactAverage (minutes) 25.4 18.7 22.5 Median (minutes) 15.0 34.6 29.8 Percent of contacts lasting longer than 30 minutes 21.6 62.5 63.2
Sample Size 401 202 199
Source: The Youth WINS ETO management information system.
Notes: We excluded service contacts of less than two minutes from this analysis. The sample sizes for results in the sections"ever received service" and "enrolled in new education program since random assignment"are 401, 202, and 199. The sample sizes for other results, except those pertaining to second contacts, are 102, 64, and 38, which are the numbers of sample members who received any education services.
C.6
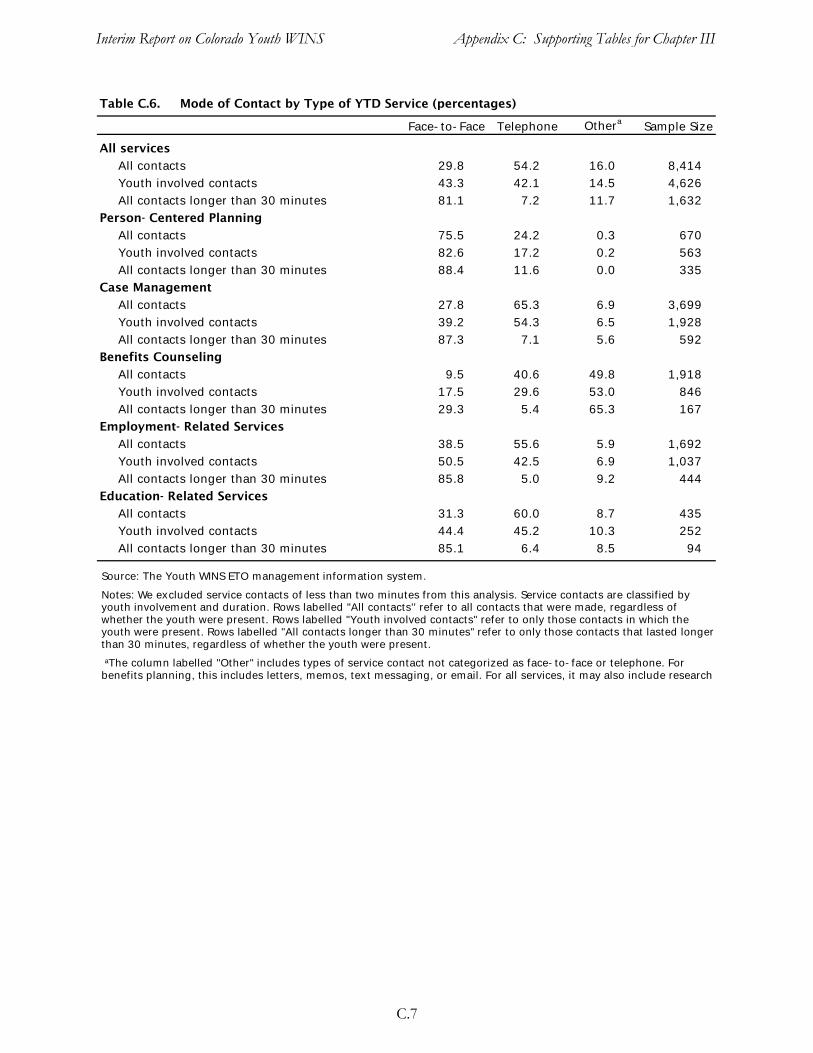
Interim Report on Colorado Youth WINS Appendix C: Supporting Tables for Chapter III
Table C.6. Mode of Contact by Type of YTD Service (percentages)
Face-to-Face Telephone Othera Sample Size
All services
All contacts 29.8 54.2 16.0 8,414 Youth involved contacts 43.3 42.1 14.5 4,626 All contacts longer than 30 minutes 81.1 7.2 11.7 1,632
Person- Centered Planning
All contacts 75.5 24.2 0.3 670 Youth involved contacts 82.6 17.2 0.2 563 All contacts longer than 30 minutes 88.4 11.6 0.0 335
Case Management
All contacts 27.8 65.3 6.9 3,699 Youth involved contacts 39.2 54.3 6.5 1,928 All contacts longer than 30 minutes 87.3 7.1 5.6 592
Benefits Counseling
All contacts 9.5 40.6 49.8 1,918 Youth involved contacts 17.5 29.6 53.0 846 All contacts longer than 30 minutes 29.3 5.4 65.3 167
Employment- Related Services
All contacts 38.5 55.6 5.9 1,692 Youth involved contacts 50.5 42.5 6.9 1,037 All contacts longer than 30 minutes 85.8 5.0 9.2 444
Education- Related Services
All contacts 31.3 60.0 8.7 435 Youth involved contacts 44.4 45.2 10.3 252 All contacts longer than 30 minutes 85.1 6.4 8.5 94
Source: The Youth WINS ETO management information system.
Notes: We excluded service contacts of less than two minutes from this analysis. Service contacts are classified byyouth involvement and duration. Rows labelled "All contacts'' refer to all contacts that were made, regardless ofwhether the youth were present. Rows labelled "Youth involved contacts" refer to only those contacts in which the youth were present. Rows labelled "All contacts longer than 30 minutes" refer to only those contacts that lasted longerthan 30 minutes, regardless of whether the youth were present. aThe column labelled "Other" includes types of service contact not categorized as face-to-face or telephone. Forbenefits planning, this includes letters, memos, text messaging, or email. For all services, it may also include research
C.7


APPENDIX D
THE SSA WAIVERS FOR YTD

Interim Report on Colorado Youth WINS Appendix D: The SSA Waivers for YTD
An important element of YTD is the modification of selected SSA program rules for project participants. These modifications, or waivers, have been designed to encourage and reward the efforts of youth to begin working, increase their earnings, or continue their education.
Student Earned Income Exclusion (SEIE). Under the SEIE, Social Security disregards up to $1,460 per month of a student’s earnings, subject to a cap of $5,910 for the year (in 2006—the monthly and yearly amounts are adjusted for inflation each year.) Normally, the SEIE applies only to students who are age 21 or younger. For YTD participants, the SEIE applies regardless of age. As long as a YTD participant regularly attends school, he or she is eligible for the SEIE.
Earned Income Exclusion (EIE). For all SSI recipients who work, Social Security disregards $65 plus half of any earnings over that amount when it determines eligibility for SSI. For YTD participants, Social Security disregards $65 plus three-fourths of any additional earnings. This waiver allows YTD participants to keep more of their SSI benefits when they work. (The EIE is applied to earnings in addition to all other applicable exclusions, including the SEIE.)
Plan for Achieving Self-Support (PASS). Normally, a PASS must specify a particular employment or self-employment goal, list the steps that will be taken to achieve the goal, and identify the income and/or assets (other than SSI benefits) that will be used to meet the plan’s expenses. YTD participants may specify postsecondary education or career exploration as the goal of a PASS.
If Social Security approves a PASS, it disregards the funds used to pursue the plan when it determines eligibility for SSI. Such funds may include, for example wages, SSDI benefits, childhood disability benefits, or deemed parental income. If the individual is eligible for SSI without the PASS, SSI benefits replace all of the funds used for PASS expenses. If the PASS creates eligibility for SSI (which generally conveys eligibility for Medicaid, as well), SSI benefits replace part of the funds used for PASS expenses.
Individual Development Accounts (IDAs). This waiver expands the options for YTD participants to acquire certain kinds of assets. IDAs are trust-like savings accounts. For each dollar of earnings the account holder deposits, a participating nonprofit organization sets aside a matching contribution of 50 cents to four dollars (the average is one dollar). In IDA programs that involve federal funds, a federal match also is set aside. Federally funded IDAs must be used to help buy a home, pay for postsecondary education, or start a small business. All IDA participants undergo financial literacy training.
Under current rules, Social Security deducts account-holder deposits from countable earned income and disregards matching deposits, IDA account balances, and any interest earned by the account when determining SSI eligibility for someone who has a federally funded IDA. For YTD participants, these disregards also apply to IDAs that do not involve federal funds, including those that may be used for purposes other than the purchase of a home, postsecondary education, or a business startup. The IDA may be part of an existing state or local program, or a program established by a YTD project for its participants.
Continuing Disability Review (CDR) or Age-18 Medical Redetermination. YTD participants will receive coverage under Section 301 that will allow for continued benefit eligibility throughout the project, regardless of the outcome of a continuing disability review (CDR) or age-18 medical redetermination. Under existing SSA rules, a CDR is scheduled to determine whether there has been an improvement in a disabling condition. Moreover, when an SSI recipient turns 18, there is a medical redetermination in which the SSI recipient must meet the adult criteria for disability. While this coverage does not eliminate these reviews, YTD participants who are determined ineligible for benefits for medical reasons can continue to receive SSI benefit payments under Section 301.
D.1

APPENDIX E
MATERIALS PROVIDED BY COLORADO WIN PARTNERS

Interim Report on Colorado Youth WINS Appendix E: Materials from Colorado WIN Partners
After this report had been through several rounds of review by SSA and revision by the evaluators, a draft of the report (dated November 10, 2010) was provided to Colorado WIN Partners, who responded with general comments in the form of a letter, more detailed comments in an accompanying document, and several additional documents that provide information about Youth WINS. The evaluators responded to these items by making a number of revisions to the report. As a consequence of those revisions, some of the comments in the letter may no longer be relevant and the page references in the letter may not be accurate with respect to the current version of the report. A complete list of the materials provided by Colorado WIN Partners follows below.
Letter dated December 10, 2010, from Judith Emery, director of Colorado WIN Partners, to Thomas Fraker, director of the YTD evaluation.
List of factual, grammatical, and typographical errors in the November 10, 2010, draft report. This document is designated “Appendix 1” in the letter. We have not included it here because subsequent revisions to the report addressed most of the issues raised in the document.
Training activities for Youth WINS career counselors and benefits planners. This document is designated “Appendix 2” in the letter. It is included in this appendix.
Job descriptions for the three positions on the Youth WINS I-Teams. This document is designated “Appendix 3” in the letter. It is included in this appendix.
Schematic diagram of Youth WINS services. This document is designated “Appendix 4” in the letter. It is included in this appendix.
E.1

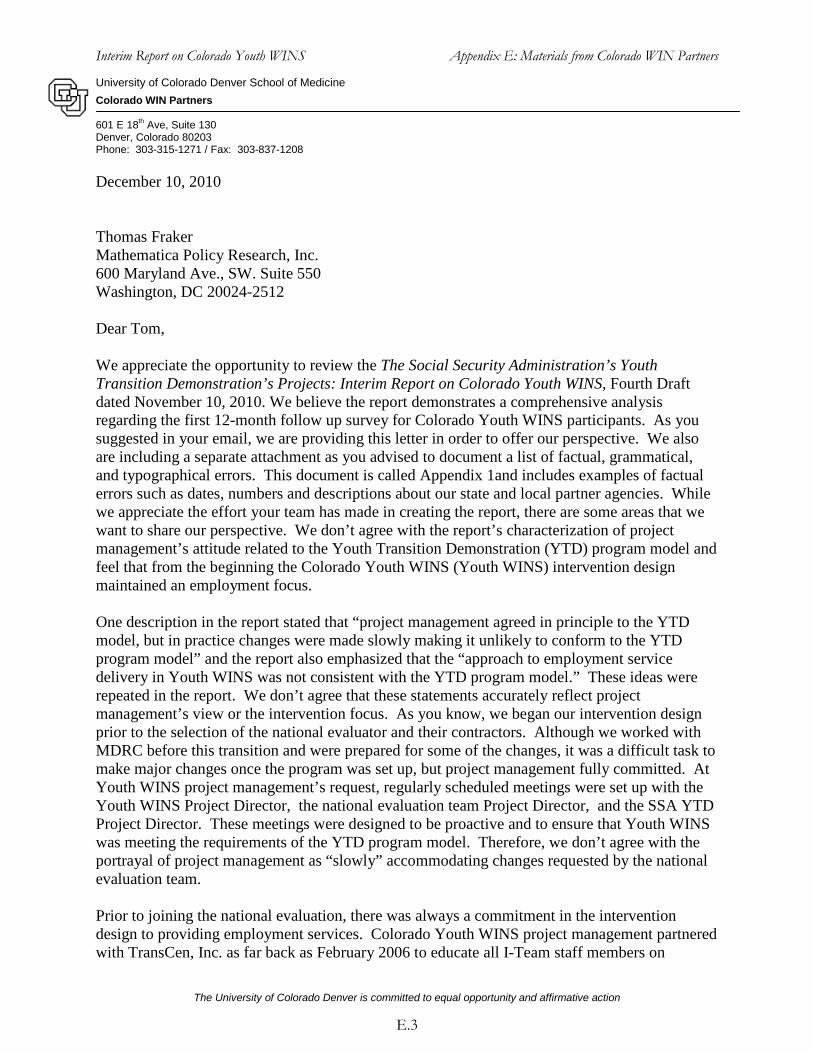
Interim Report on Colorado Youth WINS Appendix E: Materials from Colorado WIN Partners
University of Colorado Denver School of Medicine Colorado WIN Partners
601 E 18th Ave, Suite 130 Denver, Colorado 80203 Phone: 303-315-1271 / Fax: 303-837-1208
December 10, 2010
Thomas Fraker Mathematica Policy Research, Inc. 600 Maryland Ave., SW. Suite 550 Washington, DC 20024-2512
Dear Tom,
We appreciate the opportunity to review the The Social Security Administration’s Youth Transition Demonstration’s Projects: Interim Report on Colorado Youth WINS, Fourth Draft dated November 10, 2010. We believe the report demonstrates a comprehensive analysis regarding the first 12-month follow up survey for Colorado Youth WINS participants. As you suggested in your email, we are providing this letter in order to offer our perspective. We also are including a separate attachment as you advised to document a list of factual, grammatical, and typographical errors. This document is called Appendix 1and includes examples of factual errors such as dates, numbers and descriptions about our state and local partner agencies. While we appreciate the effort your team has made in creating the report, there are some areas that we want to share our perspective. We don’t agree with the report’s characterization of project management’s attitude related to the Youth Transition Demonstration (YTD) program model and feel that from the beginning the Colorado Youth WINS (Youth WINS) intervention design maintained an employment focus.
One description in the report stated that “project management agreed in principle to the YTD model, but in practice changes were made slowly making it unlikely to conform to the YTD program model” and the report also emphasized that the “approach to employment service delivery in Youth WINS was not consistent with the YTD program model.” These ideas were repeated in the report. We don’t agree that these statements accurately reflect project management’s view or the intervention focus. As you know, we began our intervention design prior to the selection of the national evaluator and their contractors. Although we worked with MDRC before this transition and were prepared for some of the changes, it was a difficult task to make major changes once the program was set up, but project management fully committed. At Youth WINS project management’s request, regularly scheduled meetings were set up with the Youth WINS Project Director, the national evaluation team Project Director, and the SSA YTD Project Director. These meetings were designed to be proactive and to ensure that Youth WINS was meeting the requirements of the YTD program model. Therefore, we don’t agree with the portrayal of project management as “slowly” accommodating changes requested by the national evaluation team.
Prior to joining the national evaluation, there was always a commitment in the intervention design to providing employment services. Colorado Youth WINS project management partnered with TransCen, Inc. as far back as February 2006 to educate all I-Team staff members on
The University of Colorado Denver is committed to equal opportunity and affirmative action
E.3
Interim Report on Colorado Youth WINS Appendix E: Materials from Colorado WIN Partners
University of Colorado Denver School of Medicine Colorado WIN Partners
601 E 18th Ave, Suite 130 Denver, Colorado 80203 Phone: 303-315-1271 / Fax: 303-837-1208
individualized job development. All of the dates and types of training were documented in our quarterly reports to SSA. These are also summarized and highlighted in Appendix 2 and attached to this report. Furthermore, during our participation with the national evaluation, Colorado Youth WINS went from focusing equally on employment, benefits planning and education outcomes, to focusing predominantly on employment outcomes.
There are several places in the report where an assertion is made that the project management team lacked commitment to emphasizing employment service delivery. Here are some examples that emphasize our commitment to an employment service delivery practice that were not fully explained in the report:
• Colorado Youth WINS project management and I-Teams used specially designed brochures to enroll individuals into the service intervention. These brochures specifically emphasized employment and education outcomes. These brochures were provided, upon request, to MPR so that they could be included in MPR’s recruitment materials. In addition, Community Forums conducted during the summer and fall of 2007 to increase awareness of Youth WINS in local communities by project management and I-Teams emphasized employment outcomes, education outcomes and employment-related services to community providers, businesses, participants and recruits for the study.
• Youth WINS project management and its state partners were deliberate about locating the I-Teams at a One-Stop Career Center (Colorado Workforce Center). This was an intentional design of the Youth WINS intervention. This location of the I-TEAMs in these organizations was intended to infuse the importance of the employment-business driven focus with participants. Additionally, being integrated within the One-Stop Career Center was identified as an asset to participants in the Colorado Youth WINS Final Process Evaluation Report, September 24, 2010. Some of the assets identified in this report included access to employment and training resources and participants’ involvement in the Summer Youth Employment Programs offered with the American Recovery and Reinvestment Act funds. Being connected to the Colorado Workforce Centers resource likely contributed to participants receiving these employment-related services. This strategy of using the public workforce system for participants allowed participants access to employment services during the period of heavy recruitment conducted by the I-Teams. Services provided by a Colorado Workforce Center included but was not limited to resume writing, interviewing skills training and job exploration and training.
• During the spring and summer of 2007, project management and I-Team members partnered with the State Medicaid Agency, the Colorado Department of Human Services, and SSA Central Office to provide workshops on the interaction of Colorado’s state Medicaid waivers and employment. Local Community Centered Boards expressed concern that this form of public assistance presented a barrier to participants pursuing employment. As a result, Youth WINS held training sessions for local social services agencies, Community Centered Boards, families, youth and community partners to demonstrate how individuals can work and continue to utilize this type of public assistance.
The University of Colorado Denver is committed to equal opportunity and affirmative action
E.4
Interim Report on Colorado Youth WINS Appendix E: Materials from Colorado WIN Partners
University of Colorado Denver School of Medicine Colorado WIN Partners
601 E 18th Ave, Suite 130 Denver, Colorado 80203 Phone: 303-315-1271 / Fax: 303-837-1208
• At the 2007 YTD National Conference, Improving Employment Outcomes for Youth with Disabilities, the career counselor from the Larimer County I-Team and project management co-presented with TransCen at a concurrent session entitled: Work-Based Experiences and Employment. This session focused on using proven strategies and case examples in appealing to an employer’s needs and expectations. At the same time, I-Team members, including all career counselors, attended the March 7, 2007 preconference titled: Work-Based Experiences and Employment for YTD Youth Using a Customized Approach to Ensure Successful Outcomes.
As we stated in our original YTD application, we know that benefits planning is key when serving individuals who are receiving Social Security disability benefits and are hesitant about entering or advancing in employment. We appreciate the acknowledgement in the report that benefits’ planning is important to youth and families when considering employment.
We also agree that the balance between recruitment and service provision was a challenge to manage. This is why our connection to local partners was important. The project management team worked closely with the national evaluator to recruit hard-to-reach clients and take whatever burden they could off the I-Teams. Our pilot study and other studies looking at recruitment of individuals with disabilities (Lennox et al., 2005) have shown that having the staff who delivered the intervention also recruit participants is the most effective way to recruit.
We believe these items provide an important perspective in understanding the Youth WINS intervention and we thank you for the opportunity to present our point of view. Although this initial report does not demonstrate significant outcomes, we want to express our gratitude and appreciation of the efforts from all our Colorado partners in the Colorado Youth WINS YTD project. They were highly committed to the SSA YTD Project and the youth and families they served. The Colorado Youth WINS Final Report to Social Security Administration provides important information on Youth WINS outcomes for participants and provides case examples of how the Youth WINS intervention affected the lives of participants.
As you note in a few places in your report, “Colorado Youth WINS worked hard with the national evaluator to exceed our enrollment goals” and that we “worked with the national technical assistance (TA) provider to make sure our staff had the support they needed to do their jobs.” We hope that future reports will move away from the negative description regarding project management and focus on what both groups value – providing services to youth with disabilities to maximize their employment potential.
We have attached two more documents that illustrate project’s commitment to employment service delivery in the Youth WINS intervention: • Appendix 3 - the complete job descriptions provided to I-Team members upon hire
outlining their job responsibilities. The career counselor job description outlines job development and direct employment services as a key job responsibility. The Interim Report only included a brief summary highlighting their overall responsibilities.
The University of Colorado Denver is committed to equal opportunity and affirmative action
E.5
Interim Report on Colorado Youth WINS Appendix E: Materials from Colorado WIN Partners
University of Colorado Denver School of Medicine Colorado WIN Partners
601 E 18th Ave, Suite 130 Denver, Colorado 80203 Phone: 303-315-1271 / Fax: 303-837-1208
• Appendix 4 - Service delivery flow chart that Project management cited in the Early Assessment Report (2008) that clearly reflects the flow of services for the Colorado Youth WINS Project and outlines the direct employment services for youth served through the project. This should replace Figure III.1 Participant Flow Through Youth WINS Services, since the one included in the report is not our chart.
Let me know if you have any questions. I do appreciate that we were able to share our perspective as an appendix to the SSA Youth Transition Interim Report on Colorado Youth WINS.
Sincerely,
Judith Emery, Director Colorado WIN Partners/UCD
The University of Colorado Denver is committed to equal opportunity and affirmative action
E.6
Interim Report on Colorado Youth WINS Appendix E: Materials from Colorado WIN Partners
Appendix 2
Colorado Youth WINSi
Career Counselor Training Activities
I-TEAMs and career counselors received training and technical assistance provided by the national evaluation team and their contractors beginning in 2006. TransCen, Inc. (TransCen) came to Colorado on 2/1/2006, 2/15/2006, and 2/22/2006, to plan and deliver training job development training to the I-TEAMs. Starting on 2/1/2006, TransCen and MDRC met with the I-TEAM supervisors, Career Counselors, VCU and the CWP to identify training needs and organize the agenda for the job development training. TransCen delivered training to the Southern two I-TEAMs (Pueblo and El Paso counties) on 2/15/2006 and training to the Northern two I-TEAMs (Boulder and Larimer counties) on 2/22/2006. In addition, community partners such as Workforce Center staff, School to Work Alliance Program staff and Community Centered Board staff participated in the training. As a result of this training, CWP worked with TransCen to establish additional onsite technical assistance on job development in the spring of 2006.
CWP coordinated with TransCen to deliver onsite technical assistance for job development and weekly technical assistance (TA) calls. TransCen provided onsite technical assistance to the Larimer I-TEAM on 4/24-25/2006 and the Boulder I-TEAM on 4/26-28/2006. At site visits, all I-TEAM members, I-TEAM supervisors and the Workforce Center Business Services Units participated. On 5/2-3/2006, TransCen provided on site technical assistance to the Pueblo I-TEAM with participation from the Pueblo I-TEAM supervisor and the Workforce Center Business Services Unit supervisor. The El Paso I-TEAM members and supervisor along with the Workforce Center Business Relations Group got on site technical assistance from TransCen on 6/19-20/2006. The onsite TA person for the Northern I-TEAMs was Sara Murphy and the TA persons for the Southern I-TEAMs were Lisa Cuozzo and Andrea Ceterra. During 6/2006, all I-TEAM members and supervisors participated in weekly TA calls scheduled for 6/7/2006, 6/12/2006, 621/2006 and 6/29/2006. Additionally, TransCen provided Customized Employment training to the new career counselor hired in Pueblo in October 2006.
Late in November 2006, a monthly teleconference specifically designed for career counselors was implemented. These teleconferences were designed for the career counselors to focus on employment placement and service delivery. They were hosted by the CYW administrative team and phased in to be facilitated by the career counselors. Project management invited TransCen, Inc. to participate in these calls during the beginning of 2007. TransCen, Inc. participated sporadically during 2007 but began participating regularly on these calls in
i This information was obtained from two sources: Colorado Youth WINS quarterly reports submitted to Social Security Administration (SSA) beginning 2006 and Colorado Youth WINS Process Evaluation Report, November 18, 2009 submitted to MPR and SSA.
E.7
Interim Report on Colorado Youth WINS Appendix E: Materials from Colorado WIN Partners
Appendix 2
September 2008. The purpose of the call was to support the career counselors in performing job development activities, problem solving unique cases, discussing post employment supports, and building capacity to assist youth in achieving employment outcomes. The calls occurred weekly, and then starting in January 2009, they occurred every other week. From September 2006 to May 2009 (33 months), approximately 41 career counselor teleconferences occurred, each scheduled for 60 minutes.
The career counselors participated in a variety of other trainings from September 2006 to May 2009. Some of this training was facilitated by TransCen and others provided locally. The national evaluator in conjunction with their subcontractors (TransCen) and SSA hosted annual YTD conferences. The CWP and I-TEAM members attended these conferences each year, March 2007, March 2008 and March 2009 to obtain training on customized employment, job development/placement, benefits planning, and ETO management. Starting in March 2007, I-Team members and all career counselors attended the preconference entitled: Work-Based Experiences and Employment for YTD Youth.
During the week of January 27-30 2009, TransCen, Inc. conducted a site visit with the career counselors in Larimer, Boulder, and El Paso (the Pueblo career counselor was unexpectedly on medical leave). TransCen introduced some new case management tools and business development tracking forms and reviewed the status of CYW participants’ employment activities. TransCen, Inc. also provided training and technical assistance on four topic areas for business development: business contacts, business surveys, business presentations and outcome. These topics were also addressed during the regularly scheduled career counselor calls. The El Paso career counselors used the case management tool and participated in follow-up teleconferences to ensure appropriate usage of the tool. The I-TEAM career counselors also routinely took advantage of the monthly Webcasts offered by TransCen, Inc.
Benefits Planner Training Activities
Over the course of the study, all I-TEAM benefits planners participated in teleconferences held every other week to review cases and discuss issues and concerns. The purpose of these calls was to build the capacity of the benefits planners across the sites through cross training with the expertise of SSA technical experts and technical consultants as available. When schedules allowed, other I-TEAM members participated for cross-training purposes.
When Virginia Commonwealth University (VCU) was the technical assistance provider, they provided technical assistance and expertise on these calls. VCU provided direct feedback on all benefits plan summaries and offered technical expertise on all cases. The SSA Area Work Incentive Coordinator (AWIC) participated as well. The impact of this technical assistance and training resulted in high quality Benefits Plan summaries and increased understanding and
E.8
Interim Report on Colorado Youth WINS Appendix E: Materials from Colorado WIN Partners
Appendix 2
accuracy of benefits counseling across all four sites. Overtime, these calls were hosted by the CYW administrative team with participation from the SSA regional office staff, SSA AWIC and SSA PASS cadre when available.
From September 2006 to May 2009 (33 months), approximately 55 benefits planner teleconferences occurred, each scheduled for 60 minutes. All benefit planners were required to participate in these teleconferences. In November 2008, the national technical assistance contractors, Ray Cebula and Mary Ridgely, began participation in these calls as well. The benefits planners participated in monthly calls with SSA and Colorado CWICs in July 2007. These calls, facilitated by the SSA AWIC, occurred approximately 11 times and lasted about 60 minutes.
In addition to the ongoing technical assistance calls, all Colorado Youth WINS benefits planners attended the BPAO or CWIC training and received “certification”. During the transition period between BPAO and Work Incentives Planning and Assistance alignment in January 2007, project management attended the interim benefits planner training provided by Mary Ridgely and Ray Cebula.
E.9

Interim Report on Colorado Youth WINS Appendix E: Materials from Colorado WIN Partners
Appendix 3
I-TEAM Career Counselor
General Job Description: Provide youth and their families with individualized, person centered career planning services. Coordinate vocational services with community agencies and provide direct services when a gap exists. Career-planning services will include: job development and placement activities; ongoing on the job supports; a variety of career exploration activities; and career/vocational assessment. Work with youth and I-TEAM to develop a Person Centered Independence Plan including identifying what type of assistive technology and additional types of accommodations may be needed for the participant to be successful in achieving employment and education goals. Provide youth with guidance and connections to resources that can provide assistance in resume writing and how to enhance their interviewing and job seeking skills. Implement a person-centered planning approach in working with youth and families.
Desired Knowledge, Skills and Abilities:
1. Ability and willingness to develop trust and interpersonal relationships with youth participants in the study and family members.
2. Ability to work with the Workforce Center to assist the youth participants in using job leads introduced through the existing JobLink.
3. Collaborate with Workforce Center staff, schools and Division of Vocational Rehabilitation staff to develop relationships within the business community to address any reluctance of employers hiring individuals with disabilities.
4. Effectively partner with local systems to support a common goal of employment outcomes for youth participants.
5. Develop networks to provide youth participants with additional, needed training or placement in an employment situation that furthers his or her career plan, including job shadowing and apprenticeships.
6. Build networks in the community to assist youth participants in accessing specialized training.
7. Experience with integrating youth with disabilities into existing systems to obtain education, training and employment outcomes.
8. Familiarity with and application of person centered planning models and experience with one-on-one interaction, individualized attention, and personal coaching.
9. Experience performing job development and placement activities, providing ongoing supports, and implementing customized employment.
10. Team oriented in order to work with multiple systems and the Benefit Planner and Disability Program Navigator on I-TEAM.
11. Organize communication to effectively develop a plan with youth participants and family members.
This product was created by Colorado WIN Partners/UCHSC for the Colorado Youth WINS Demonstration. Funding was provided through a Cooperative Agreement awarded under the Youth Transition Process Demonstration Program by Social Security Administration. Award Number 12-Y-30003-8-01. Alternate formats will be made available upon request.
E.11
Interim Report on Colorado Youth WINS Appendix E: Materials from Colorado WIN Partners
Appendix 3
Ideal Characteristics: 1. Personal experience with and/or knowledge of disability issues pertaining to youth. 2. Knowledge and familiarity with career/vocational assessment; a variety of career
exploration opportunities; job development and placement activities, customized employment and assistive technology.
3. Strengths in written communication and presentation skills. 4. Ability to work independently; self-initiate and prioritize duties, self-monitor
performance. 5. Strengths in multi-tasking, good memory for detailed information. 6. Ability to maintain confidentiality. 7. Bachelor’s degree or equivalent experience.
This product was created by Colorado WIN Partners/UCHSC for the Colorado Youth WINS Demonstration. Funding was provided through a Cooperative Agreement awarded under the Youth Transition Process Demonstration Program by Social Security Administration. Award Number 12-Y-30003-8-01. Alternate formats will be made available upon request.
E.12
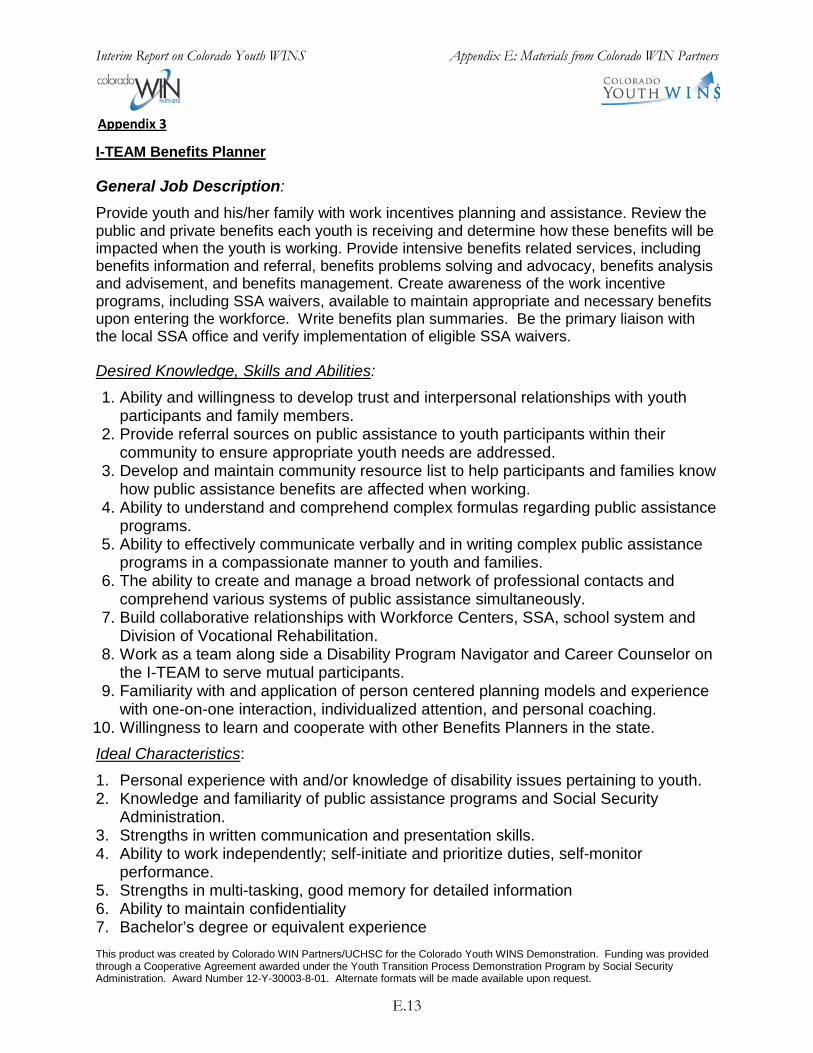
Interim Report on Colorado Youth WINS Appendix E: Materials from Colorado WIN Partners
Appendix 3
I-TEAM Benefits Planner
General Job Description:
Provide youth and his/her family with work incentives planning and assistance. Review the public and private benefits each youth is receiving and determine how these benefits will be impacted when the youth is working. Provide intensive benefits related services, including benefits information and referral, benefits problems solving and advocacy, benefits analysis and advisement, and benefits management. Create awareness of the work incentive programs, including SSA waivers, available to maintain appropriate and necessary benefits upon entering the workforce. Write benefits plan summaries. Be the primary liaison with the local SSA office and verify implementation of eligible SSA waivers.
Desired Knowledge, Skills and Abilities:
1. Ability and willingness to develop trust and interpersonal relationships with youth participants and family members.
2. Provide referral sources on public assistance to youth participants within their community to ensure appropriate youth needs are addressed.
3. Develop and maintain community resource list to help participants and families know how public assistance benefits are affected when working.
4. Ability to understand and comprehend complex formulas regarding public assistance programs.
5. Ability to effectively communicate verbally and in writing complex public assistance programs in a compassionate manner to youth and families.
6. The ability to create and manage a broad network of professional contacts and comprehend various systems of public assistance simultaneously.
7. Build collaborative relationships with Workforce Centers, SSA, school system and Division of Vocational Rehabilitation.
8. Work as a team along side a Disability Program Navigator and Career Counselor on the I-TEAM to serve mutual participants.
9. Familiarity with and application of person centered planning models and experience with one-on-one interaction, individualized attention, and personal coaching.
10. Willingness to learn and cooperate with other Benefits Planners in the state. Ideal Characteristics: 1. Personal experience with and/or knowledge of disability issues pertaining to youth. 2. Knowledge and familiarity of public assistance programs and Social Security
Administration. 3. Strengths in written communication and presentation skills. 4. Ability to work independently; self-initiate and prioritize duties, self-monitor
performance. 5. Strengths in multi-tasking, good memory for detailed information 6. Ability to maintain confidentiality 7. Bachelor’s degree or equivalent experience This product was created by Colorado WIN Partners/UCHSC for the Colorado Youth WINS Demonstration. Funding was provided through a Cooperative Agreement awarded under the Youth Transition Process Demonstration Program by Social Security Administration. Award Number 12-Y-30003-8-01. Alternate formats will be made available upon request.
E.13
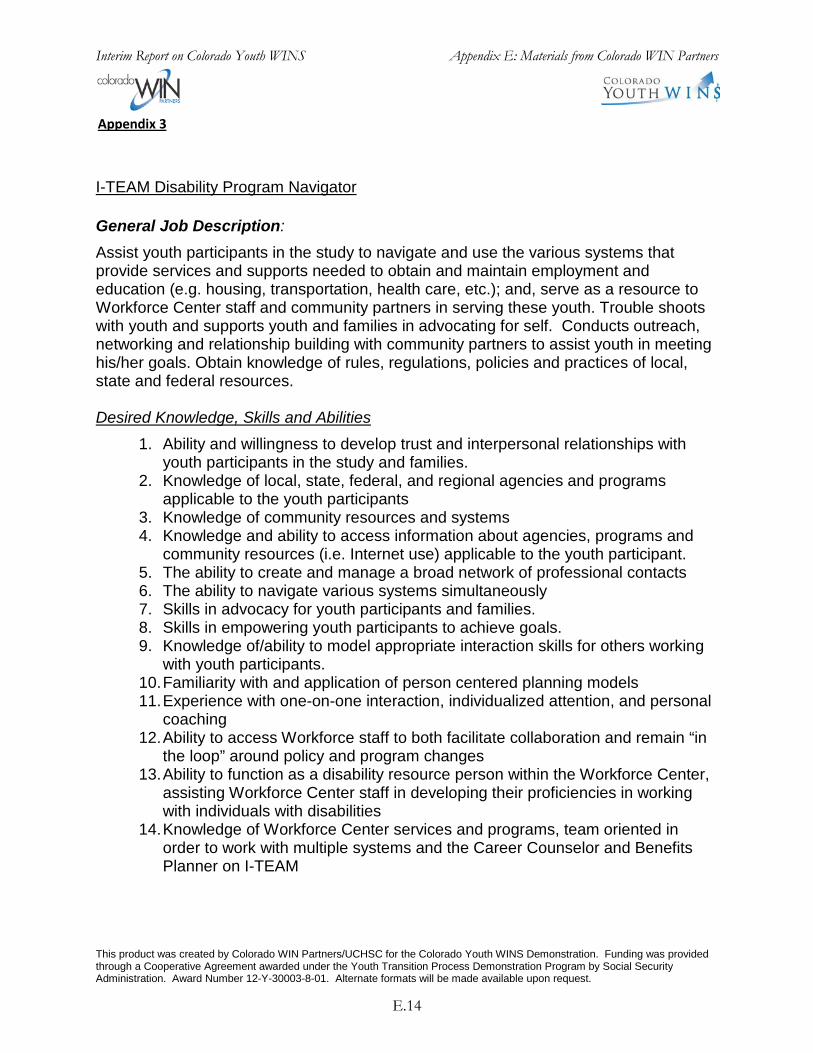
Interim Report on Colorado Youth WINS Appendix E: Materials from Colorado WIN Partners
Appendix 3
I-TEAM Disability Program Navigator
General Job Description:
Assist youth participants in the study to navigate and use the various systems that provide services and supports needed to obtain and maintain employment and education (e.g. housing, transportation, health care, etc.); and, serve as a resource to Workforce Center staff and community partners in serving these youth. Trouble shoots with youth and supports youth and families in advocating for self. Conducts outreach, networking and relationship building with community partners to assist youth in meeting his/her goals. Obtain knowledge of rules, regulations, policies and practices of local, state and federal resources.
Desired Knowledge, Skills and Abilities
1. Ability and willingness to develop trust and interpersonal relationships with youth participants in the study and families.
2. Knowledge of local, state, federal, and regional agencies and programs applicable to the youth participants
3. Knowledge of community resources and systems 4. Knowledge and ability to access information about agencies, programs and
community resources (i.e. Internet use) applicable to the youth participant. 5. The ability to create and manage a broad network of professional contacts 6. The ability to navigate various systems simultaneously 7. Skills in advocacy for youth participants and families. 8. Skills in empowering youth participants to achieve goals. 9. Knowledge of/ability to model appropriate interaction skills for others working
with youth participants. 10.Familiarity with and application of person centered planning models 11.Experience with one-on-one interaction, individualized attention, and personal
coaching 12.Ability to access Workforce staff to both facilitate collaboration and remain “in
the loop” around policy and program changes 13.Ability to function as a disability resource person within the Workforce Center,
assisting Workforce Center staff in developing their proficiencies in working with individuals with disabilities
14.Knowledge of Workforce Center services and programs, team oriented in order to work with multiple systems and the Career Counselor and Benefits Planner on I-TEAM
This product was created by Colorado WIN Partners/UCHSC for the Colorado Youth WINS Demonstration. Funding was provided through a Cooperative Agreement awarded under the Youth Transition Process Demonstration Program by Social Security Administration. Award Number 12-Y-30003-8-01. Alternate formats will be made available upon request.
E.14
Interim Report on Colorado Youth WINS Appendix E: Materials from Colorado WIN Partners
Appendix 3
Ideal Characteristics
1. Personal experience with and/or knowledge of disability issues pertaining to youth.
2. Experience in administration of community programs and/or educational background in human services or related field.
3. Strengths in written communication and presentation skills. 4. Ability to work independently; self-initiate and prioritize duties, self-monitor
performance. 5. Strong skills in time management 6. Strengths in multi-tasking, good memory for detailed information 7. Ability to maintain confidentiality
This product was created by Colorado WIN Partners/UCHSC for the Colorado Youth WINS Demonstration. Funding was provided through a Cooperative Agreement awarded under the Youth Transition Process Demonstration Program by Social Security Administration. Award Number 12-Y-30003-8-01. Alternate formats will be made available upon request.
E.15

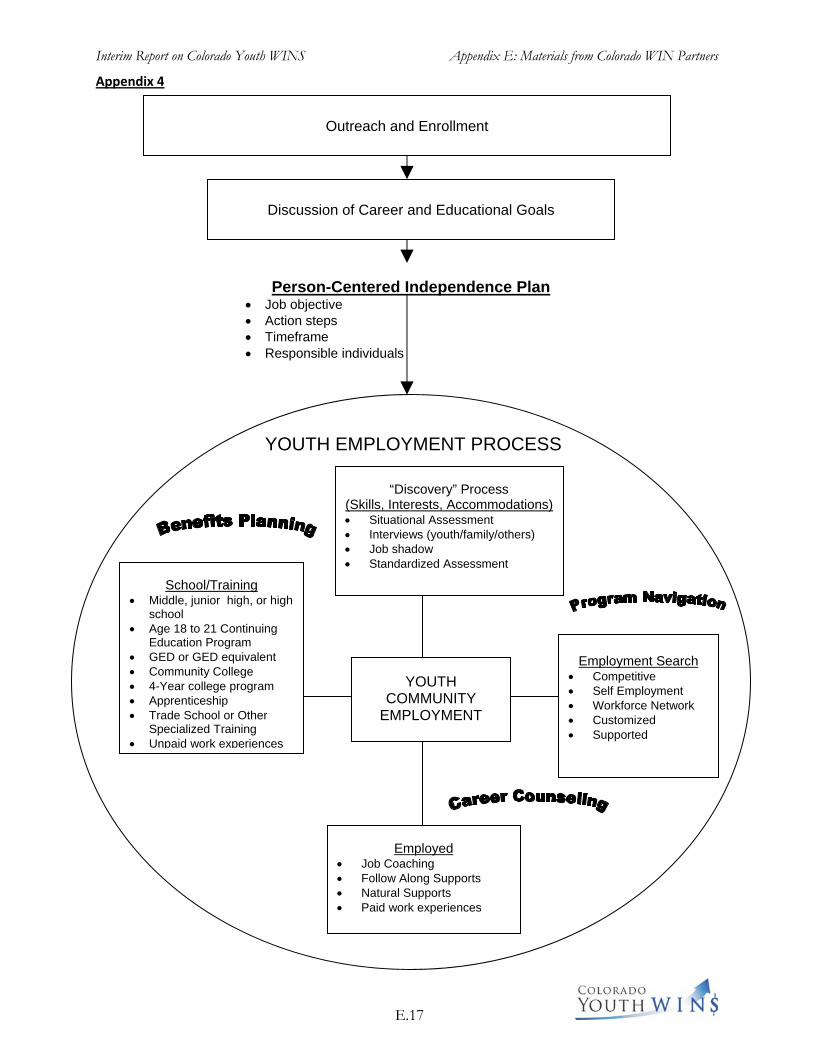
Interim Report on Colorado Youth WINS Appendix E: Materials from Colorado WIN Partners
Appendix 4
Outreach and Enrollment
Discussion of Career and Educational Goals
Person-Centered Independence Plan
YOUTH EMPLOYMENT PROCESS
“Discovery” Process (Skills, Interests, Accommodations) Situational Assessment Interviews (youth/family/others) Job shadow Standardized Assessment
Employment Search Competitive Self Employment Workforce Network Customized Supported
Employed Job Coaching Follow Along Supports Natural Supports Paid work experiences
School/Training Middle, junior high, or high
school Age 18 to 21 Continuing
Education Program GED or GED equivalent Community College 4-Year college program Apprenticeship Trade School or Other
Specialized Training Unpaid work experiences
Job objective Action steps Timeframe Responsible individuals
YOUTH COMMUNITY
EMPLOYMENT
E.17


www.mathematica-mpr.com
Improving public well-being by conducting high-quality, objective research and surveys
Princeton, NJ ■ Ann Arbor, MI ■ Cambridge, MA ■ Chicago, IL ■ Oakland, CA ■ Washington, DC
Mathematica® is a registered trademark of Mathematica Policy Research