Embed Size (px)
Citation preview
i
THE SOCIAL CORRELATES OF VALUE CONSENSUS
by
SHWETA. A. KULKARNI
A thesis submitted to the
Graduate School – Camden
Rutgers, the State University of New Jersey
in partial fulfillment of the requirements
for the degree of Master of Arts
Graduate Program in Psychology
Written under the direction of
Sean. E. Duffy, PhD
and approved by
Dr. Sean Duffy
Dr. Naomi Marmorstein
Dr. Mary Bravo
Camden, New Jersey October 2010
ii
Abstract
This paper examines societal value consensus, or the extent to which individuals
within a culture share similar values. This topic has been extensively theoretically
discussed, but has received limited empirical attention. This paper explores the social
variables of economic equality, religiosity and religious homogeneity and their relation to
value consensus. Publicly available data from the latest wave of World Values Survey (N
= 73,256), CIA world factbook and the World Bank World Development Indicators are
used for analysis. Results reveal that value consensus is not correlated with religiosity,
religious homogeneity or economic equality. Implications of these findings, with specific
reference to economic developmental theories are discussed.

1
The Social Correlates of Value Consensus
Culture influences almost every aspect of our lives. Child rearing practices,
interpersonal communication, art, business and commerce, governance, food are just
some of the aspects that are influenced and often determined by culture. Yet, culture and
the individual within the culture are two sides of a coin. Culture shapes the individual and
vice versa. (Kitayama & Cohen, 2007; Shweder, 2003). However, even as culture
influences practically every aspect of who we are and how we live, it is difficult to study
or measure directly. To investigate the cultural orientation in a society, we could look at
differences in perception, cognitive processes, morality, cultural artifacts or socialization
processes; but what they all seek, implicitly or explicitly are the underlying value
emphases. Therefore, studying value emphases are an especially efficient way to capture
and characterize cultures (Schwartz, 2006).
According to Schwartz (1992 p.1) “Values are criteria people use to select and
justify actions and to evaluate people (including the self) and events.” They are seen as
fundamental concepts that define culture by numerous researchers (Hostede, 1980;
Inglehart, 1997; Kluckhohn, 1951; Schwartz, 1992). Cultural value emphases shape and
validate group beliefs, action and goals. Institutional arrangements and policies, norms
and other daily practices express underlying cultural and value emphases in society. For
example, a cultural emphasis on success and ambition may be reflected in highly
competitive economic systems and child rearing practices that pressure children to
achieve.
The above rationale of studying values as an avenue of studying culture has been
adopted by several researchers. Notable among them are the works of Hofstede
2
(1980;1984;1991;2001), Inglehart (1995;1997;2006) and Schwartz
(1992;1994;2006;Schwartz & Bardi, 2001).
Hofstede (1980;1984;1991;2001) conducted surveys of the employees at IBM and
posited that the national cultures he examined could be positioned on four independent
value dimensions 1) High vs. low power distance, or the presence of a social hierarchy in
a culture 2) High vs. low uncertainty avoidance, or the extent to which individuals enjoy
uncertainty or desire certainty 3) Individualism vs. collectivism, or the degree to which
individuals define themselves as independent entities or as a member of a group and 4)
Masculinity vs. femininity, or the presence of either masculine or feminine values within
a culture. He later extended his framework to also include long vs. short term orientation.
Inglehart, (1995; 1997; 2006) using the process of modernization as an
explanation, divided all national cultures between two of four categories: traditional vs.
secular rational values and survival vs. self expression values. He suggested that
modernization moves societies from the traditional towards the secular rational values
and from survival to self expression values.
Although the Hofstede and Inglehart frameworks have been influential in the field
of organizational behavior and sociology respectively, they have been criticized because
they identify a set of values with nations based on the assumption that there is a uniform
national culture within each nation (Ailon, 2008). An alternate framework, the Schwartz
Value Framework describes countries using more number of values and has been
described below.
3
Schwartz Value Framework
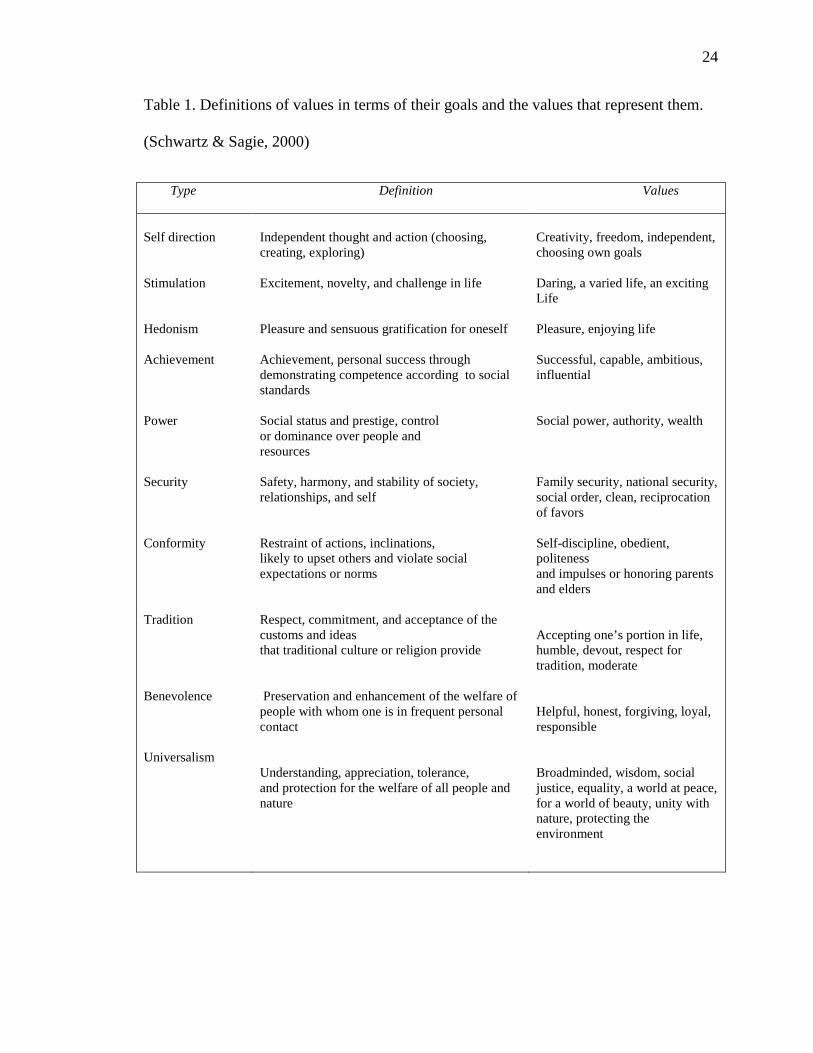
The Schwartz value framework includes 10 motivationally distinct, yet interrelated
values (See appendix, table 1). This theory was derived by providing participants with a
list of 56 value items (such as Social justice, humility, creativity, harmony) and asking
the participants to rate that value in terms of it being “the guiding principle of your life.”
The responses for each of the 56 values were then content analyzed and subjected to a
statistical procedure called smallest space analysis (see Schwartz, 1992) and then
synthesized into a framework of 10 inter related values.
The pursuit of one type of value may be closely related to or in opposition with
another value within the framework. For example, the pursuit of novelty and change
(stimulation values) is likely to be in conflict with preservation of time honored customs
(tradition values). This congruence and conflict of values is depicted through the relative
distance of various values from each other in the diagrammatic description of the
framework.
Value Consensus
Value consensus is defined as the extent to which individuals within an
interindividual structure share the same values (Schwartz & Sagie, 2000; Shils, 1975). In
other words, the level of agreement there is within a culture on what is considered
valuable, irrelevant, heinous, laudable etc is referred to as value consensus.
Value consensus dictates social norms and mores in a culture (Partridge, 1971). It is
the cornerstone of democracy, governance, the corpus of law, and the formation of the
constitution (Parsons, as cited in Partridge, 1971). The way each one of us lives our lives
is, to a large extent, dependent on these social norms and systems. Understanding value

4
consensus is vital in furthering positive social goals such as increasing social stability and
encouraging peaceful conflict resolution. A consensus of values also limits the area and
issues of conflict (Partridge, 1971; Shils, 1975). Adherence to shared values engenders a
sense of identity and acceptance of common goals as well as agreement on the norms for
how these goals should be achieved (Cohen, 1968; Kahl, 1968).
However, analogous to Shweder’s (2003) assertion about how culture and psyche
“dynamically make each other up”, value consensus and individual values, also mutually
and inextricably constitute each other. Societal values are a reflection of individual values
and at the same time, societal values help shape individual values. But even as value
consensus has the above mentioned important features and has received much attention in
theoretical discussions, it has received scant empirical attention (Rossi & Berk, 1985;
Schwartz & Sagie, 2000). Most psychological research on cultural differences in values
(c.f. Abramson & Inglehart, 1995; Schwartz & Bardi, 1997; Schwartz & Ros, 1995;
Smith & Schwartz, 1997; Triandis, 1990) has focused on value importance - how national
groups differ in the importance they attribute to various values and their implications; but
the extent to which individuals within these cultures share the same values has not been
studied adequately. Previous research on value consensus is discussed below.
Socio economic development and value consensus
Socio economic development is defined as the process of simultaneous growth in
the national income as well as factors that improve quality of life throughout the
population. (Szirmai, 2005). Socio economic development was found to be positively
correlated with value consensus (Schwartz & Sagie, 2000). Socio economic development
showed a significant positive correlation with value consensus from the Schwartz Value

5
Framework after controlling for democratization. Schwartz and Sagie (2000) suggest that
similar to Shil’s (1975) hypothesis, socio economic development brings the different
segments of the population under the influence of an integrated economic and political
system. It engenders more widely shared experiences in common social institutions.
People from various strata of the society obtain information from the same national
media, send their children to the same centralized education system, work under the
conditions of an integrated labor market, and are exposed to shared political ideas. All
sections of the population are progressively integrated into the centralized institutional
and value system of society. Consequently, people of differing socio cultural
backgrounds gradually develop similar values. In other words, socio economic
development leads to greater equality in a culture, which leads to greater value
consensus. However, the direct relationship between economic equality and value
consensus has not been tested. Past research (Kuznets, 1955; Ahluwalia, 1976; Ram,
2006) has found that the relationship between socio economic development and
economic equality exhibits an inverted U shaped function. That is, as a country develops,
economic inequality first increases and then decreases after reaching its peak. This
proposition holds true even for developed and socialistic countries. The factors that drive
this increase in equality in the latter stage include shifts in the structure of production,
expansion in educational attainment and resultant increase in the skill level of labor force
and reduction in rate of growth of population (Ahluwalia, 1976). Furthermore, in this
study, socio economic development was not significantly correlated with value consensus
before controlling for democratization. Thus, the first hypothesis of the present study is
that economic equality is positively correlated with value consensus.
6
Religiosity, religious homogeneity and values
Religiosity is defined as the extent to which an individual adheres to an
institutionally based set of beliefs concerning the cause, nature, and purpose of
the universe and human life (Pargament, 1992). It also refers to the adherence to moral
codes of behavior prescribed by religion (Durkheim, 1912). Religious homogeneity, on
the other hand, indicates how much one particular religious group predominates at the
national level, without taking into account the level of religiosity of the members of that
religion in that particular country (Mullins, Brackett, Bogie & Pruet, 2004). For the
purpose of this study, various sub-sections within a larger religion (such as Catholics and
Protestants within Christianity) are considered separately.
Several studies have investigated the relationship between Religiosity and Value
priorities (see for example Burris & Tarpley, 1998; Devos, Spini & Schwartz, 2002;
Dollinger, 2001; Roccas & Schwartz, 1997), particularly with respect to the Schwartz
value framework. Saroglou, Delpierre and Dernelle (2003) in a meta-analysis, found that
religious people tend to score high on values such as Tradition, Conformity, Security and
Benevolence, and score low on Stimulation and Self direction, Hedonism, Achievement
and Power.
However, in order to get a complete picture of the cross-cultural differences in values,
it is not sufficient to only study value priorities, or which values are important. The
degree of agreement on the importance of these values must also be taken into
consideration. This study addresses this dearth by examining value consensus and its
relationship with economic equality, religiosity and religious homogeneity. Moreover, the
relationship between value priorities and value consensus is neither strong, nor
7
consistent, according to Schwartz & Sagie (2000). They correlated the mean importance
of each value type with its consensus index across 42 countries and found that the
correlations ranged from -.30 (power) to .56 (security) which is neither high, nor
consistent across values.
Thus, the second hypothesis is that religiosity is positively correlated with value
consensus. Dissemination of religion through socialization may be considered part of the
more general dissemination of values. Conversely, individuals with specific value
systems may seek out religion in general and/or a specific religion in particular, because
they provide mechanisms that may positively or negatively reinforce these values
(Schwartz & Huismans, 1995). Thus, individuals that are highly religious will have more
widely shared common values.
The next hypothesis is that religious homogeneity is positively correlated with value
consensus. If a greater number of individuals within a country belong to the same
religion, regardless of the level of religious commitment, they will have similar values.
Being part of one religion builds a sense of community which, in turn, would be related
to the development of similar values. Furthermore, religious affiliation may have a
stronger association with the development of similar values than other factors that
citizens of a country might share like common government, history, national culture, etc.
Hypotheses
To summarize, the hypotheses for this study are:
H1: Economic equality is positively correlated with value consensus.
H2 : Religiosity is positively correlated with value consensus.
H3 : Religious homogeneity is positively correlated with value consensus.
8
Method
Publicly available data were used in this study. This study was exempted from
review by the IRB as it was not considered human subjects research as defined by
Federal and University regulations.
Participants
The dataset used for this study is World Values Survey dataset, a survey initiated
with an objective to study changes in values across the world and over time that has been
administered to a total of 257,000 respondents in 80 countries over a span of almost 30
years.
This study uses the latest (2005 – 2008) wave of the WVS, which is the only
wave that includes the Schwartz Value Survey. It has been administered to over 77,000
participants in 53 countries. The gender distribution was near equal within the
participants in this survey. Random probability samples were obtained wherever possible.
Procedure
In each country, a Principal Investigator (PI) was responsible for conducting the
survey in accordance to fixed rules and regulations laid down by the WVS Executive
Committee (EC) to ensure maximum reliability and validity. Data were collected from
multiple cities within each country to ensure maximum representativeness of the sample.
Use of core questionnaire translated into the local language was mandatory. The
questionnaires were back translated to ensure equivalency of questionnaires. The
sampling and documentation procedures were accepted by the EC before data collection
started. During the fieldwork, the agency had to report in writing in accordance to a
specific checklist. Items on the checklist included: questionnaire, sample, universe,

9
remarks about sampling, survey procedure, sample size, response rate, and weighting.
Face to face interviews were conducted by PIs in some countries, whereas paper and
pencil tests were conducted in others, after considering the mean reading proficiency of
the country.
Internal Consistency checks were made between sampling design and the
outcome and rigorous data cleaning procedures are followed at the WVS data archive. No
country was included in a wave before full documentation was delivered (World Values
Survey, 2009).
Measures
Value Consensus
Values are seen in terms of the Schwartz Value Framework (SVF). Specifically, an
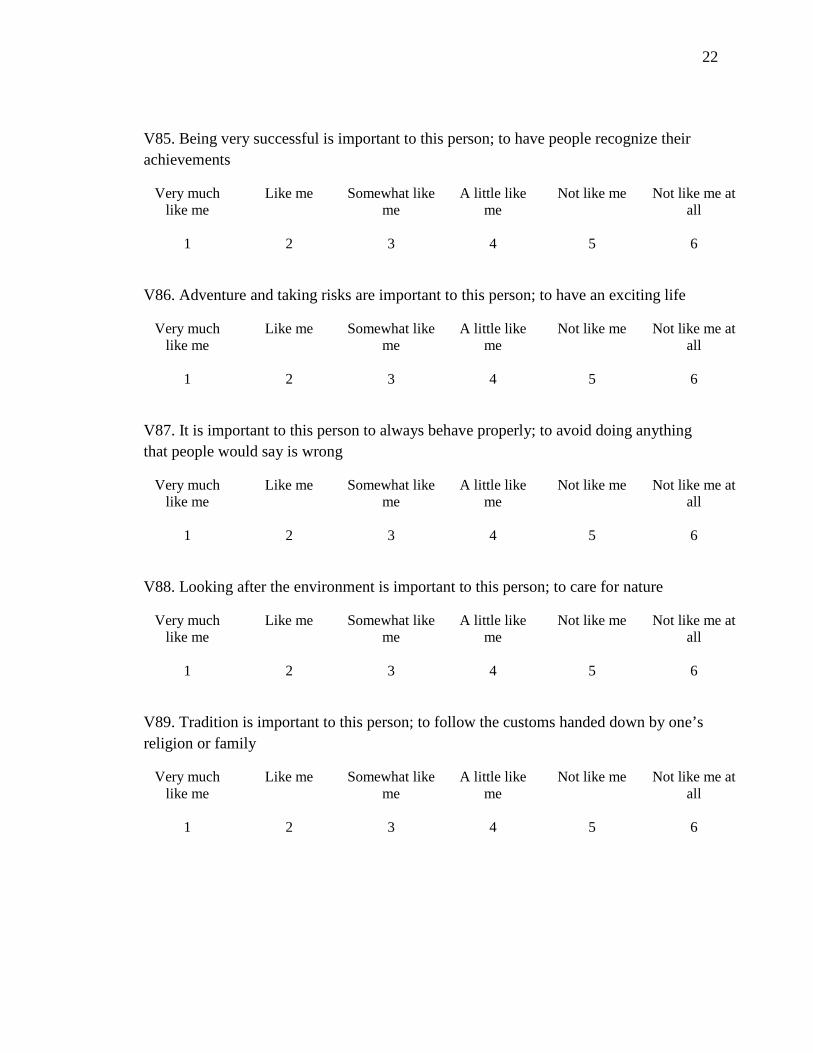
adapted version of the SVF, the Portrait Values Questionnaire (PVQ) was used. In the
PVQ, participants were provided with short portraits of 29 different people. Each one
described a person’s aspirations or goals that point implicitly to the importance of a
value. For example “Thinking up new ideas and being creative is important to this
person. He likes doing things his own original way” describes a person for whom self
direction is important. For each portrait, participants answered “How much like you is
this person” and respondents checked one of six boxes ranging from “very much like me”
to “not like me at all.” Participant’s values are inferred from their self reported similarity
to the portraits described implicitly in terms of their values. To analyze the data, the
standard deviation of respondents’ scores within a national group was taken (see table 2).

10
Religiosity
The Religiosity scale used in the WVS measures various aspects of an
individual’s religious behavior as well as beliefs. Although many religious people may
display overt religious behavior, they may do so out of habit or compulsion and may thus
lack religious conviction. Taking this into consideration, the scale also measures religious
beliefs, or the extent to which individuals feel that religious institutions “give the answer
to life’s problems”
This religiosity scale has been standardized by the creators of the survey and has
been widely used as a measure of religiosity in several studies (see for example, Inglehart
& Norris, 2004 ; Esmer, Klingemann, & Puranen B, 2009; Esmer, 2001) (see table 3).
Religious homogeneity
Religious homogeneity is the percentage of individuals that belong to the
dominant religion of each country. This information is obtained from the CIA World
factbook (see table 3).
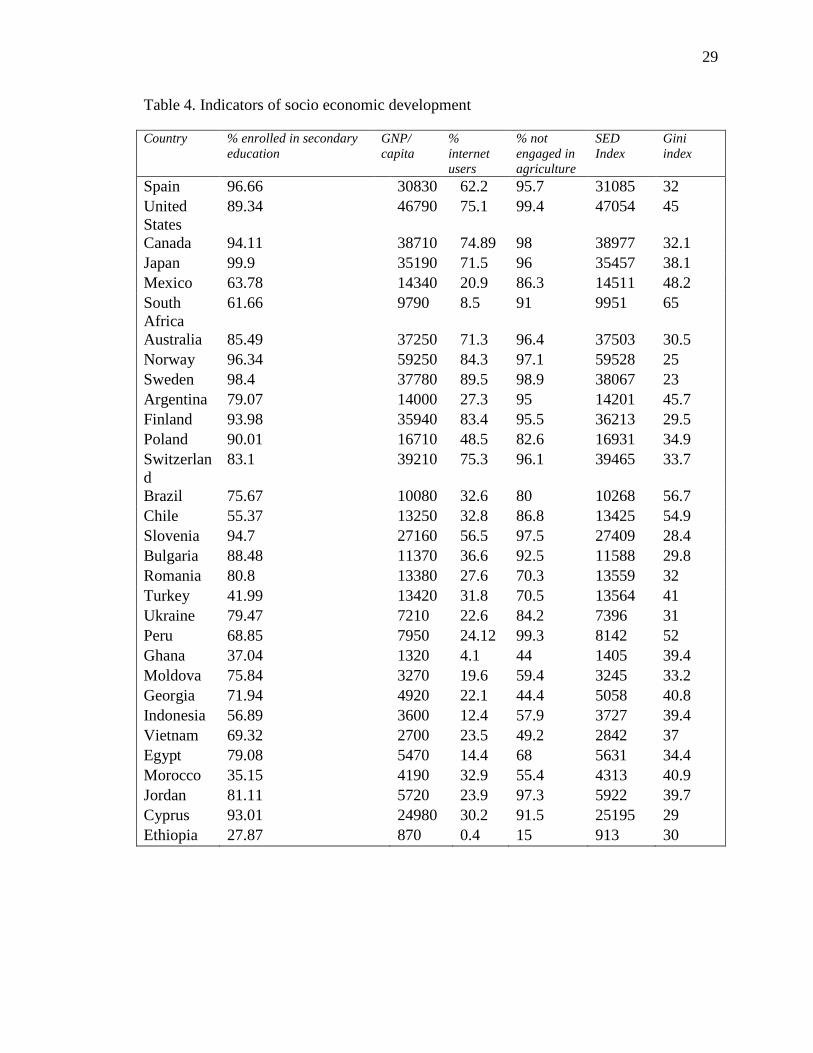
Socio economic development:
Socio economic development is measured using virtually all the same indicators
that were used in the Schwartz & Sagie (2000) study. They are 1) Gross National Product
(GNP) per capita for the current year 2) percentage of economically active population not
engaged in agriculture in the current year 3) percentage enrolled in secondary education
(see table 4). This study differs from the earlier study in the fourth indicator. The original
study uses number of phones per thousand individuals as an indicator. Although the study
was published in 2000, the data used to measure socio economic development were
obtained between the period of 1986 – 1990. Since the proliferation of mobile phones, the

11
average number of phones per thousand individuals has become somewhat of an obsolete
indicator of socio economic development. Hence the present study instead used
percentage of internet users in the population, as it is a better indicator of socio economic
development at the present time (Chinn & Fairley, 2002). These four indicators were
summed and standardized to form an index of socio economic development. The data for
percentage of the population not engaged in agriculture and percentage of internet users
in the population were obtained from the CIA world factbook (2010), whereas percentage
of age appropriate population engaged in secondary education and the GNP per capita
were obtained from the World Bank’s world development indicators (2010) (see table 5).
The data from the world factbook and the world development indicators is secondary data
obtained from sources such as Antarctic Information Program (National Science
Foundation), Armed Forces Medical Intelligence Center (Department of Defense),
Bureau of the Census (Department of Commerce), Bureau of Labor Statistics
(Department of Labor), Central Intelligence Agency, Council of Managers of National
Antarctic Programs, Defense Intelligence Agency (Department of Defense), Department
of Energy, Department of State, Fish and Wildlife Service (Department of the Interior),
Maritime Administration (Department of Transportation), National Geospatial-
Intelligence Agency (Department of Defense), Naval Facilities Engineering Command
(Department of Defense), Office of Insular Affairs (Department of the Interior), Office of
Naval Intelligence (Department of Defense), US Board on Geographic Names
(Department of the Interior), US Transportation Command (Department of Defense), Oil
& Gas Journal, and other public and private sources. ( CIA world factbook, 2010)

12
Economic equality:
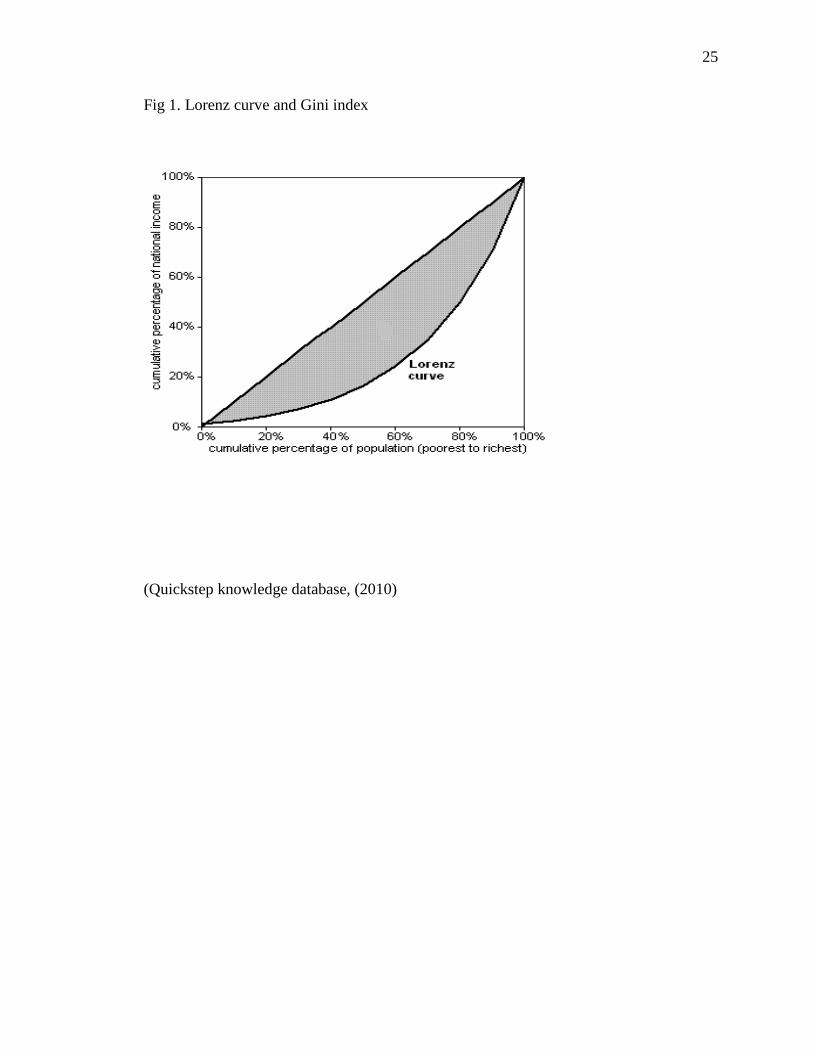
To measure socio economic equality, we used the Gini index for economic
inequality. The Gini coefficient is a ratio derived from the Lorenz curve. The Lorenz
curve follows the cumulative income share on the vertical axis and cumulative population
contribution to national income on the horizontal axis (see fig.1). For example, if the
poorest 40% contribute to 20% of the national income and the poorest 60% contribute to
40% of the total national income, the Lorenz curve will pass through all these points until
the 100% mark. The Lorenz curve would be a diagonal line (called the Line of Equality)
passing through the origin at 45 degrees to both axes if there were perfect equality in the
economy, that is, if 10% of the population contributed to 10% of the national income and
so on. The Gini coefficient is a ratio between the areas above the Lorenz curve to the
entire triangular area under the Line of Equality (World Bank, 2010). It is a widely used
and reliable index for measuring economic inequality between countries (Gastwirth,1972
; Yitzhaki, 1983 ; Ogwang, 2000). This variable too was obtained from the CIA world
factbook (2010) (see table 4).
Data cleaning:
Prior to analysis, the responses coded “Don’t know” and “Not answered” were
deleted. Countries in which neither the religiosity questionnaire nor with PVQ were
asked (11 countries) were eliminated from analysis. Thus, only 42 countries were used in
the analysis for value consensus, religiosity, and religious homogeneity. Furthermore,
since data were available only for 40 of the countries for economic equality and 31 of
them for socio economic development in the world factbook and world development
indicators, only those number of countries were used to correlate those variables (see
13
table 4). To correlate religiosity and mean value importance at the individual level, data
of participants from all countries who did not answer one of 10 PVQ questions were
deleted.
Results
Relation to prior studies
Since publicly available data have been used, findings from a meta analysis on
religiosity and value importance (Saroglou , Delpierre & Dernelle, 2003) were compared
to those obtained from the current dataset to examine its similarity to the datasets
previously used. Saroglou et al (2003) found that the values of Tradition, Conformity,
Self direction, Stimulation and Hedonism were significantly correlated with religiosity.
These correlation coefficients were compared to the coefficients obtained by correlating
the same variables at the individual and country level using the data from the WVS. It
was found that the country level correlation coefficients from the WVS and those of
Saroglou et al (2003) were not significantly different from each other, but the individual
level coefficients differed significantly from those of Saroglou et al (2003) (see table 5).
The correlations of the individual level data were found to be much smaller than
the country level data because much of the random measurement error normally found in
survey data cancels out in country level analysis (Inglehart & Baker, 2000).The
individual level correlation coefficients may be significantly different from Saroglou et al
(2003) because the total number of participants in each country in the WVS was not
equal. For example, there were 3052 participants in Egypt, but only 1001 in Poland,
Argentina and most other countries. Therefore, some countries had more weightage in the
correlations than others. Secondly, the average number of participants from each country

14
in Saroglou et al. was 446, whereas the lowest number of respondents in any country for
the WVS was 1000. Moreover, there were only 5 countries in common between those
used in the meta analysis of Saroglou et al (2003) and those used in the WVS. While
countries from the WVS spanned all 5 habited continents, countries used in the meta
analysis were all from the western hemisphere.
Relation between socio economic development and economic equality
Next, a polynomial regression was performed to ascertain if the relationship
between socio economic development and economic equality is curvilinear even with the
data used in this study. Analysis indicated that the polynomial regression was not
significant (p=0.11) which means that socio economic development and economic
equality do not share a curvilinear relationship. However, the results of a linear
regression revealed a significant positive correlation (r= 0.41; p< 0.05). The 31 countries
used for this analysis may not equally represent the different stages of economic
development. This could contribute to why a curvilinear relationship was not observed
between economic equality and socio economic development.
A graphical representation of this relationship can be seen in fig. 2. There are
three outliers in this graph, namely South Africa with a Gini index of 65, Brazil with a
Gini index of 56.7 and U.S.A with a socio economic development (SED) index of 287.93
and a Gini index of 45. South Africa has an exceptionally high Gini index due to massive
unemployment and sectional inequalities in income (Kingdon & Knight 2004; May,
2004). Brazil is an outlier on account of rapid industrialization in the past 30 years,
export of low value added goods, power of the economically elite to influence
government policies in their favor and neglect of education. (Skidmore, 2004). The

15
U.S.A goes against the trend and has a high Gini index in spite of a high SED index due
to an emphasis on capitalism and high degree of industrialization (Deininger & Squire,
1996; Piketty & Saez, 2003).
Religiosity and Value Consensus
A Pearson correlation was performed between mean religiosity and the value
consensus index per country. Based on prior research, the hypothesis was that religiosity
would be positively correlated with value consensus. Statistical analysis indicated that
there was no significant correlation (r=0.13).
Religious homogeneity and Value consensus
A Pearson correlation was performed between mean religious homogeneity and
the value consensus index. I predicted that religious homogeneity would be positively
correlated with value consensus, but results indicated that they were not significantly
correlated(r=-0.22). Economic equality and Value Consensus
Here again, a Pearson correlation was performed for the national economic
equality index and value consensus index. The hypothesis here was that economic
equality is positively correlated with value consensus. Statistical analysis revealed no
significant correlation between variables (r= 0.09).
General Discussion
Value consensus is the cornerstone of most major social institutions and is
associated with numerous positive outcomes such as conflict reduction and co-operation
(Parsons, as cited in Partridge, 1971). In this study, we sought to investigate the social
correlates of value consensus, namely religiosity, religious homogeneity and economic
equality. Based on evidence from prior studies, the hypotheses were that value consensus

16
will be positively correlated with all three of these variables. Analyses demonstrated that
value consensus was not significantly correlated with any of them.
The finding that economic equality is not correlated with value consensus
contradicts the hypotheses put forth by Schwartz & Sagie (2000), since they suggested
that the equality resulting from socio economic development is related to value
consensus. The findings from the present study indicate that economic factors are not
related to value consensus and cultural factors are more strongly related to the value
consensus of individuals within a society.
The above contradiction in findings effectively illustrates the views of two
opposing schools of economic developmental theories. The convergent school predicts
the decline of traditional values and their replacement with “modern” values with rising
economic development. This is the founding principle of modernization theory which
posits that economic development is linked with changes in culture and social and
political life (Bell, 1973; Bernstein, 1971; Scott, 1995; Tipps, 1973). The other school of
thought emphasizes the persistence of traditional values despite economic and political
changes. It assumes that values are relatively independent of economic conditions
(DiMaggio, 1994). Consequently, it predicts that convergence around some set of
“modern” values is unlikely and that traditional values will continue to exert an
independent influence on the cultural changes caused by economic development.
Thus, the findings from present study further the persistence school of economic
developmental theories. The agreement on important values does not change significantly
with increasing socio economic development or equality. This indicates that there are
other factors such as historic religious background (Inglehart & Baker, 2000) age

17
structure, colonial domination, political situation that are more strongly related to value
consensus in a nation than socio economic development. Furthermore, the present finding
could also be indicative of the fact that Schwartz & Sagie’s (2000) use of matched
samples of school teachers in measuring value consensus could have compromised the
validity of their results. Even Schwartz & Sagie (2000, p. 492) mention that “It is
essential to replicate the study with data from a large group of representative samples or
from other types of matched samples. Until this is done, our findings remain tentative.”
This study was a replication of theirs using a large representative sample, but their
findings were not replicated.
It was also found that religiosity was not significantly correlated with value
consensus. This indicates that it is not extent of religious commitment but other cultural
factors that are related to value consensus. Analyses also revealed that religious
homogeneity was not significantly correlated with value consensus. These two findings
indicate that it is national culture based on historical cultural or religious foundations and
not level of religiosity or current level of religious homogeneity that were related to the
values of individuals. Inglehart & Baker (2000) also found that the basic values of
German Catholics resemble those of German Protestants more than they resemble
Catholics of other countries. This was true even of Hindus and Muslims in India, between
Christians and Muslims in Nigeria and other religiously diverse countries. Thus, Inglehart
& Baker (2000) concluded that religious traditions have historically shaped the national
culture of a given society and that their impact is transmitted mainly through nationwide
institutions, to the population of the society as a whole, even to those who have little to
no contact with religious institutions.

18
Among the individual components of the socio economic development index,
literacy was found to be marginally positively correlated with value consensus (r=-0.24;
p= 0.07)*. None of the other correlations with individual indicators of socio economic
development were significant (GNI/capita = -0.06, percentage of internet users= -0.18,
percentage not engaged in agriculture= -0.12). This provides further evidence for the
above point that important values within a national culture are transmitted through
national public institutions such as schools, colleges and universities.
Value consensus is associated with positive social outcomes such as conflict
reduction and co-operation. Results from this study will inform practical research that
seeks to further the aforementioned social goals. Furthermore, there is a significant
amount of dissensus in values within some national cultures (Schwartz & Sagie, 2000).
This dissensus must be taken into account while making generalizations about them.
Studies such as these will help us obtain more information about value consensus within
particular cultures, characterizing national cultures in terms of its homogeneity or
heterogeneity in values. Thus, this study also provides findings which can be utilized by
researchers who wish to make generalizations about national cultures.
However, the study also has some limitations. There is only one item per value,
which compromises the validity of the survey. The interval points Somewhat like me and
A little like me seem semantically confusing and thus may be a threat to the reliability and
validity of the responses.
*The sign for the correlation is negative, since standard deviation was used in the analysis, which is the
reciprocal of value consensus.

19
There are shortcomings that stem from the value framework itself. Since the 56
root values that the theory was developed with were an extension of the Rokeach value
framework (Schwartz, 1992) there could be values that are salient in the value systems of
individuals (like trust) that have not been considered in the Schwartz value framework.
Furthermore, there were cultures where the 10 values of Schwartz value framework did
not typify the important values in the culture. (Schwartz, 1992 p. 27) hence the
framework may not be ideal for measuring values in all countries.
There may be mediating variables such as education, age structure of the
population, colonial domination, or wars that could be affecting the relationship between
the variables under study which have not been considered. This is a worthwhile direction
for future studies in this area. Future research can also examine value consensus by using
the Hofstede value framework to verify if value consensus is related to economic factors,
as seen through these values.
Hofstede (1980;1984;1991;2001) positioned cultures based on four independent
value dimensions 1) High vs. low power distance, or the presence of a social hierarchy in
a culture 2) High vs. low uncertainty avoidance, or the extent to which individuals enjoy
uncertainty or desire certainty 3) Individualism vs. collectivism, or the degree to which
individuals define themselves as independent entities or as a member of a group and 4)
Masculinity vs. femininity, or the presence of either masculine or feminine values within
a culture. He later extended his framework to also include long vs. short term orientation.
Inglehart, (1995; 1997; 2006) divided all national cultures between two of four
categories: traditional vs. secular rational values and survival vs. self expression values.
Neither of these frameworks is exhaustive of all values, and there are certain nuances of

20
values captured in one framework, that are not addressed in the others (Morinaga
Shearman, 2007). Thus, it would be worthwhile to study value consensus using the other
value frameworks to see if it leads to different results.

21
Appendix
Schwartz value survey
(Show card L)
Now I will briefly describe some people. Using this card, would you please indicate for each description whether that person is very much like you, like you, somewhat like you, a little like you, not like you or not like you at all.
V80. It is important for this person to think up new ideas and to be creative; to do things one’s own way
Very much like me
Like me Somewhat like me
A little like me
Not like me Not like me at all
1 2 3 4 5 6
V81. It is important to this person to be rich; to have a lot of money and expensive things
Very much like me
Like me Somewhat like me
A little like me
Not like me Not like me at all
1 2 3 4 5 6
V82. Living in secure surroundings is important to this person; to avoid anything that is dangerous
Very much like me
Like me Somewhat like me
A little like me
Not like me Not like me at all
1 2 3 4 5 6
V83. It is important to this person to have a good time; to spoil oneself
Very much like me
Like me Somewhat like me
A little like me
Not like me Not like me at all
1 2 3 4 5 6
V84. It is important to this person to help the people nearby; to care for their well being
Very much like me
Like me Somewhat like me
A little like me
Not like me Not like me at all
1 2 3 4 5 6
22
V85. Being very successful is important to this person; to have people recognize their achievements
Very much like me
Like me Somewhat like me
A little like me
Not like me Not like me at all
1 2 3 4 5 6
V86. Adventure and taking risks are important to this person; to have an exciting life
Very much like me
Like me Somewhat like me
A little like me
Not like me Not like me at all
1 2 3 4 5 6
V87. It is important to this person to always behave properly; to avoid doing anything that people would say is wrong
Very much like me
Like me Somewhat like me
A little like me
Not like me Not like me at all
1 2 3 4 5 6
V88. Looking after the environment is important to this person; to care for nature
Very much like me
Like me Somewhat like me
A little like me
Not like me Not like me at all
1 2 3 4 5 6
V89. Tradition is important to this person; to follow the customs handed down by one’s religion or family
Very much like me
Like me Somewhat like me
A little like me
Not like me Not like me at all
1 2 3 4 5 6

23
Religiosity scale (Campbell, 1964)
(Show Card X) V186. Apart from weddings and funerals, about how often do you attend religious services these days? (Code one answer): 1 More than once a week 2 Once a week 3 Once a month 4 Only on special holy days 5 Once a year 6 Less often 7 Never, practically never
(NOTE: In Islamic societies, ask how frequently the respondent prays!) V187. Independently of whether you attend religious services or not, would you say you are (read out and code one answer): 1 A religious person 2 Not a religious person 3 An atheist
V189.Generally speaking, do you think that the [churches]* in your country are giving adequate answers to (read out and code one answer for each):
Yes No
V188. The moral problems and needs of the individual
1 2
V189. The problems of family life 1 2 V190. People’s spiritual needs 1 2 V191. The social problems facing our society.
1 2
24
Table 1. Definitions of values in terms of their goals and the values that represent them.
(Schwartz & Sagie, 2000)
Type Definition Values Self direction Stimulation Hedonism Achievement Power Security Conformity Tradition Benevolence Universalism
Independent thought and action (choosing, creating, exploring) Excitement, novelty, and challenge in life Pleasure and sensuous gratification for oneself Achievement, personal success through demonstrating competence according to social standards Social status and prestige, control or dominance over people and resources Safety, harmony, and stability of society, relationships, and self Restraint of actions, inclinations, likely to upset others and violate social expectations or norms Respect, commitment, and acceptance of the customs and ideas that traditional culture or religion provide Preservation and enhancement of the welfare of people with whom one is in frequent personal contact Understanding, appreciation, tolerance, and protection for the welfare of all people and nature
Creativity, freedom, independent, choosing own goals Daring, a varied life, an exciting Life Pleasure, enjoying life Successful, capable, ambitious, influential Social power, authority, wealth Family security, national security, social order, clean, reciprocation of favors Self-discipline, obedient, politeness and impulses or honoring parents and elders Accepting one’s portion in life, humble, devout, respect for tradition, moderate Helpful, honest, forgiving, loyal, responsible Broadminded, wisdom, social justice, equality, a world at peace, for a world of beauty, unity with nature, protecting the environment
25
Fig 1. Lorenz curve and Gini index
(Quickstep knowledge database, (2010)

26
Fig 2. Relationship between socio economic development and economic inequality
0
10
20
30
40
50
60
70
0 10000 20000 30000 40000 50000 60000 70000
Gin
i ind
ex
Socio Economic development

27
Table 2. Mean Value Consensus per country
Country Standard deviation Spain 1.12 United States 1.28 Canada 1.30 Japan 1.13 Mexico 1.45 South Africa 1.22 Australia 1.30 Norway 1.22 Sweden 1.24 Argentina 1.33 Finland 1.23 Poland 1.18 Switzerland 1.26 Brazil 1.22 Chile 1.47 India 1.42 Germany 1.28 Slovenia 1.31 Bulgaria 1.33 Romania 1.23 Turkey 1.23 Ukraine 1.35 Peru 1.35 Uruguay 1.38 Ghana 1.16 Moldova 1.31 Georgia 1.21 Thailand 1.09 Indonesia 1.22 Vietnam 1.14 Serbia 1.32 Egypt 1.32 Morocco 1.34 Jordan 0.97 Cyprus 1.34 Malaysia 1.22 Burkina Faso 1.41 Ethiopia 1.42 Mali 1.37 Rwanda 1.36 Zambia 1.43 Iran 1.24
*Value consensus is the reciprocal of standard deviation
28
Table 3. Mean religiosity and religious homogeneity per country
Country Mean Religiosity
SD Religious homogeneity
Spain 1.36 0.1 94 United States
1.6 0.13 51.3
Canada 1.55 0.16 42.6 Japan 1.22 0.11 83.9 Mexico 1.64 0.12 76.5 South Africa 1.75 0.11 11.1 Australia 1.43 0.12 25.8 Norway 1.29 0.16 85.7 Sweden 1.34 0.17 87 Argentina 1.5 0.17 92 Finland 1.55 0.14 82.5 Poland 1.38 0.21 89.8 Switzerland 1.49 0.12 41.8 Brazil 1.31 0.15 73.6 Chile 1.56 0.09 70 India 1.47 0.18 80.5 Germany 1.33 0.06 34 Slovenia 1.51 0.19 57.8 Bulgaria 1.4 0.17 82.6 Romania 1.75 0.19 86.8 Turkey 1.66 0.15 99.8 Ukraine 1.66 0.18 50.4 Peru 1.67 0.12 81.3 Uruguay 1.46 0.13 47.1 Ghana 1.81 0.08 68.8 Moldova 1.64 0.26 98 Georgia 1.84 0.16 83.9 Thailand 1.67 0.19 94.6 Indonesia 1.21 0.1 86.1 Vietnam 1.51 0.23 80.8 Serbia 1.64 0.19 85 Egypt 1.71 0.13 90 Morocco 1.92 0.02 98.7 Jordan 1.73 0.1 92 Cyprus 1.42 0.11 78 Malaysia 1.75 0.09 60.4 Burkina Faso
1.74 0.14 50
Ethiopia 1.77 0.03 50.6 Mali 1.85 0.07 90 Rwanda 1.55 0.3 56.5 Zambia 1.74 0.13 63
29
Table 4. Indicators of socio economic development
Country % enrolled in secondary education
GNP/ capita
% internet users
% not engaged in agriculture
SED Index
Gini index
Spain 96.66 30830 62.2 95.7 31085 32 United States
89.34 46790 75.1 99.4 47054 45
Canada 94.11 38710 74.89 98 38977 32.1 Japan 99.9 35190 71.5 96 35457 38.1 Mexico 63.78 14340 20.9 86.3 14511 48.2 South Africa
61.66 9790 8.5 91 9951 65
Australia 85.49 37250 71.3 96.4 37503 30.5 Norway 96.34 59250 84.3 97.1 59528 25 Sweden 98.4 37780 89.5 98.9 38067 23 Argentina 79.07 14000 27.3 95 14201 45.7 Finland 93.98 35940 83.4 95.5 36213 29.5 Poland 90.01 16710 48.5 82.6 16931 34.9 Switzerland
83.1 39210 75.3 96.1 39465 33.7
Brazil 75.67 10080 32.6 80 10268 56.7 Chile 55.37 13250 32.8 86.8 13425 54.9 Slovenia 94.7 27160 56.5 97.5 27409 28.4 Bulgaria 88.48 11370 36.6 92.5 11588 29.8 Romania 80.8 13380 27.6 70.3 13559 32 Turkey 41.99 13420 31.8 70.5 13564 41 Ukraine 79.47 7210 22.6 84.2 7396 31 Peru 68.85 7950 24.12 99.3 8142 52 Ghana 37.04 1320 4.1 44 1405 39.4 Moldova 75.84 3270 19.6 59.4 3245 33.2 Georgia 71.94 4920 22.1 44.4 5058 40.8 Indonesia 56.89 3600 12.4 57.9 3727 39.4 Vietnam 69.32 2700 23.5 49.2 2842 37 Egypt 79.08 5470 14.4 68 5631 34.4 Morocco 35.15 4190 32.9 55.4 4313 40.9 Jordan 81.11 5720 23.9 97.3 5922 39.7 Cyprus 93.01 24980 30.2 91.5 25195 29 Ethiopia 27.87 870 0.4 15 913 30

30
Table 5. Correlations between mean religiosity and value importance
IV DV r from previous study N=8,551
r from present study (country level) N=42
r from present study (individual level) N=59,184
Z score (country level)b
Z score (individual level) c
Religiosity Tradition 0.45 0.51 0.24 -0.48 20.74** Religiosity Conformity 0.23 0.46 0.15 -1.62 7.18** Religiosity Self
direction -0.24 -0.28 -0.03 0.26 -18.56**
Religiosity Stimulation -0.26 -0.27 -0.004 0.07 -22.65** Religiosity Hedonism -0.3 -0.05 -0.02 -1.6 -25.02** Socio economic development
Value Consensus
0.34a 0.19 - 0.71 -
a n = 42 b column 3 compared with column 4
c column 3 compared to column 5
** p< 0.01

31
References
Abramson, P. R., & Inglehart, R. (1995). Value change in global perspective. Ann Arbor: University of Michigan.
Ansell, Ben and David Samuels. 2008. “Inequality and Democratization.” Paper Presented at the 2008 Annual Meeting of the American Political Science Association, Boston.
Ahluwalia, M. (1976). Inequality, poverty and development. Journal of Developmental Economics , 3, 307 - 342.
Ailon, G. (2008). Mirror mirror on the wall: Culture's consequences in a value test of its own design. Academy of Management Review , 33, 885 - 904.
Bell, D. (1973). The Coming of Post-Industrial Society. New York: Basic Books.
Bernstein, H. (1971). Modernization theory and the Sociological Study of Development. Journal of Developmental Studies , 7 (2), 141-160.
Burris, C. T., & Tarpley, W. R. (1998). Religion as being: preliminary validation of the Immanence scale. Journal of research in personality , 32, 55 -79.
CIA World Factbook. (2010, June 25). Retrieved June 25, 2010, from CIA World factbook website: https://www.cia.gov/library/publications/the-world-factbook/index.html
Cohen, P. (1968). Modern Social Theory. London: Heinemann.
CIA world factbook. (2010, April). Retrieved 2010, from CIA world factbook Web site: https://www.cia.gov/library/publications/the-world-factbook/docs/contributor_copyright.html
Deininger, K., & Squire, L. (1996). A new data set measuring income inequality. The World Bank economic review , 10 (3).
Devos, T., Spini, D., & Schwartz, S. H. (2002). Conflicts among human values and trust in institutions. British journal of social psychology , 41, 481 - 494.
DiMaggio, P. (1994). Culture and Economy. In N. Smelser, & R. Swedberg, The Handbook of Economic Sociology (pp. 27 - 58). Princeton, NJ: Princeton University Press.
Dollinger, S. J. (2001). Religious identity: an autophotographic study. International journal for the psychology of religion , 11, 71 - 92.
32
Durkheim, E., (1912 [1995]), The Elementary Forms of Religious Life. Translated by Karen E. Fields. New York: Free Press
Esmer, Y. (2001). Is there an Islamic civilization. World values research papers , 3.
Esmer, Y., Klingemann, H., & B, P. (2009). Religion, democratic values and political conflict. Uppsala, Sweden: Uppsala university.
Gastwirth, J. (1972). The estimation of the Lorenz curve and Gini index. Review of economics and statistics ,54, 306 - 316.
Hofstede, G. (1991). Culture and organizations: software of the mind. London: McGraw Hill.
Hofstede, G. (2001). Culture's Consequences: Comparing values, behaviors, institutions and organizations across nations (Second edition). Thousand Oaks, CA: Sage.
Hofstede, G. (1984). Culture’s consequences:international differences in work related values. Beverly Hills, CA: Sage.
Hofstede, G. (1980). Culture's Consequences: International Differences in Work-related Values, Sage, Beverly Hills, CA.
Inglehart, R. (1995). Changing values, economic development and political change. International Science Journal , 47, 379 - 403.
Inglehart, R. (2006). Mapping global values. Comparative sociology, 5, 115 - 136.
Inglehart, R. (1997). Modernization and post modernization: Cultural, economic and political change in 43 societies. Princeton, NJ: Princeton University Press.
Inglehart, R., & Baker, W. (2000). Modernization, Cultural Change and the Persistence of Traditional Values. American Sociological Review , 65, 19 - 51.
Kahl, J. (1968). The measurement of modernism: a study of values in Brazil and Mexico. Austin: University of Texas.
Kingdon Geeta and J. Knight (2004). Unemployment in South Africa: The Nature of the Beast. World Development 32(3): 391-408.
Kitayama, S., & Cohen, D. (2006). Handbook of Cutlural Psychology. New York, NY: Guilford press.
33
Kluckhohn, C. (1951). Values and value orientations in the theory of actions: an exploration in definition and classification. In T. Parsons, & E. Shils, Toward a general theory of action (pp. 388 - 433). Cambridge, MA: Harvard University press.
Kuznets, S. (1955). Economic growth and income inequality. The American Economic Review , 45, 1 - 28.
May, J. Poverty & Inequality in South Africa. Praxis Publishing, Durban, 1998
Mullins, L. C., Brackett, K. P., Bogie, D. W., & Pruett, D. (2004). The impact of religious homogeneity on divorce in the United States. Sociological Inquiry, 74, 338-354.
Morinaga-Shearman, S. (2007). Culture, Value, and Cultural Variability: Hofstede, Inglehart, and Schwartz's approach. International Communication Association, (pp. 1 - 30). Montreal, QC.
Ogwang, T. (2000). A convenient method for calculating the Gini index and its standard error. Oxford bulletin of economics and statistics , 62, 123 - 129.
Partridge, P. (1971). Consent and Consensus. New York: Praeger.
Pargament, K. (1992). Of means and ends: religion and the search for significance. International Journal of Psychology and Religion , 2, 201 - 229.
Piketty, T., & Saez, E. (2006). The Evolution of Top Incomes: A Historical and International Perspective. The American Economic Review , 96 (2), 200 - 205.
Quickstep knowledge database. (2010, September). Retrieved Spetember 2010, from Quickstep knowledge database: http://qwickstep.com/search/gini-coefficient-calculation.html
Ram, R. (1995). Economic development and income inequality: an overlooked regression constraint. Economic Development and Cultural Change , 43, 425 - 434.
Roccas, S., & Schwartz, S. H. (1997). Church state relations and the association of religiosity with values: A study of catholics in six countries. Cross cultural research , 31, 356 - 375.
Rokeach, M. (1973). The nature of Human Values. New York: free Press.
Rossi, P. H., & Berk, R. A. (1985). Varieties of normative consensus. American Sociological Review , 50, 333 - 347.
Saroglou, V., Delpierre, V., & Dernelle, R. (2004). Values and religiosity: a meta-analysis of studies using Schwartz's model. Personality and individual differences , 37, 721 - 734.

34
Schwartz, S. (1992). Universals in the content and structure of values: theoretical advances and empirical tests in 20 countries. Advances in Experimental Social Psychology , 25, 1 - 65.
Schwartz, S. H. (2006). A theory of cultural value orientations:explications and applications. Comparative Sociology , 5, 137 - 182.
Schwartz, S. H. (1994). Are there universals in the content and structure of values. Journal of social issues , 48, 23 - 47.
Schwartz, S. H., & Ros, M. (1995). Values in the west: A theoretical and empirical challenge to the individualism-collectivism cultural dimension. World Psychology , 1, 99- -122.
Schwartz, S., & Bardi, A. (2001). Value priorities across cultures: a similarities perspective. Journal of Cross Cultural Psychology , 32, 268 - 290.
Schwartz, S., & Huismans, S. (1995). Value prioirities and and religiosity in four western countries. Social Psychology Quarterly , 31, 88 - 107.
Schwartz, S., & Sagie, G. (2000). Value consensus and importance. Journal of Cross Cultural Psychology , 31, 465 - 497.
Scott, A. (1991). Ideology and the New Social Movements. London: Unwin Hyman.
Shils, E. (1975). Center and periphery: Essays in macrosociology. Chicago: University of Chicago press.
Shweder, R. (2003). Why Do Men Barbeque: Recipes for Cultural Psychology. Cambridge, MA: Harvard University Press.
Skidmore, T. (2004). Brazil's Persistent Income Inequality: Lessons from History. Latin American Politics & Society , 46 (2), 133 - 150.
Smith, P. B., & Schwartz, S. H. (1997). Values. In J. W. Berry, M. H. Seagal, & C. Kagitcibasi, Handbook of cross cultural psychology (pp. 77 - 118). Boston: Allyn & Bacon.
Szirmai, A. (2005). The Dynamics of Socio Economic Development: an Introduction. Cambridge, UK: Cambridge University Press.
Tipps, D. (1973). Modernization theory and the Comparitve Study of Societies: A Critical Perspective. Comparitive Studies in Society and History , 15, 199-226.

35
Triandis, H. (1990). Cross cultural studies of individualism and collectivism. In J. Berman, Nebraska symposium on motivation (pp. 41 - 133). Lincoln: University of Nebraska press.
Triandis, H. (1995). Individualism and collectivism. Boulder, CO: Westview.
World Development Indicators. (2010, June 26). Retrieved June 25, 2010, from World Bank’s World Development Indicators web site: http://databank.worldbank.org/ddp/home.do
World Values survey. (2009). Retrieved August 2009, from World values survey brochure: worldvalues survey.org
World Values Survey. (2010, June 25). Retrieved June 25, 2010, from World Values Survey website: worldvaluessurvey.org
Yitzhaki, S. (1983). On an extension of the Gini inequality index. International economic review , 24, 617 - 628.


![Artificial retina [shweta]](https://img.pdfslide.us/doc/110x75/5874c3ae1a28ab8f508b5dd3/artificial-retina-shweta.jpg)