Embed Size (px)
Citation preview

THE SOCIAL AND ECONOMIC IMPACT OF POOR VISION
MAy 2012
THE SOCIAL AND ECONOMIC IMPACT OF POOR VISION
This paper aims to summarize the most reliable published data on the personal, social and economic impact of poor vision on four categories of people: children, people in the work-place, elderly and car drivers. It also highlights areas that should be fur-ther explored to raise awareness of the huge economic impact of poor vision in the world and identify some mechanisms that could help reduce this impact.
This document reflects research and analysis carried out by The Boston Consulting Group and Essilor.

CONTENTS
Executive SummaryKey findings on impact .............................................................................................................................4
Research and MethodologyHow and what kinds of research were reviewed ...........................................................................................5
IntroductionA global perspective on poor vision ............................................................................................................6
1 Children The impact on health, school performance, and emotional/social development .............................................7
2 Workers The impact on health, productivity and national performance .....................................................................9
3 Elderly The impact on well-being, safety and mental health ............................................................................... 11
4 Car drivers The impact on road safety and accidents ............................................................................................... 13
5 Moving Forward Towards evaluating costs and developing solutions ................................................................................. 15
Appendix 1Overview on vision ................................................................................................................................ 16
Appendix 2Challenges to correcting vision ................................................................................................................ 17
Sources/Reference ............................................................................................................................. 19

4
THE SOCIAL AND ECONOMIC IMPACT OF POOR VISION
CHILDREN
30% of children experience vision problems that have a significant impact in terms of long-term health, school performance and emotional/social development.
n Visual difficulties affect children’s ability to learn (three times more likely to fail at least one grade1), resulting in academic under-achievement and risk of reduced adult literacy. This has a significant impact on professional and social fulfillment.
n Vision problems cause developmental difficulties and have been linked to anti-social /delinquent beha-vior. In the USA, up to 70% of juvenile offenders have undiagnosed vision problems2.
WORkERS
33% of the world’s working population has uncorrected vision problems that impact productivity with serious financial implications for the performance of economies worldwide.
n $269 billion of productivity is lost worldwide due to uncorrected vision.3
n Vision problems can reduce employees’ perfor-mance by as much as 20%4 and considerably affect employment opportunities, job satisfaction and job security.
ELDERLy
Poor vision disproportionately affects elderly people, negatively impacting their experience of a healthy ageing and increasing the burden and cost of medical services.
n Poor vision limits people’s ability to carry out daily living tasks and multiplies by 7 the risk of falls and hip fractures5.
n Visual impairment impacts psychological and emo-tional health of elderly people and increases five to nine fold the risk of cognitive decline and dementia6.
CAR DRIVERS
23% of drivers worldwide have uncorrected vision pro-blems, impacting the safety of drivers, pedestrians and road users.
n 59% of accidents can be linked to poor sight – such as failure to use corrective lenses or glare-related reasons7.
n The risk of car crash involvement increases 9% with visual impairment, and is higher for drivers whose visual function worsens as they get older8.
Greater public awareness of the importance of vision health is critical, as is mass screening to identify pro-blems that can be corrected. Most visual impairments can be treated with cost effective services, for example with corrective eye glasses, to reduce the personal, social and economic burden of vision loss.
The impact of poor vision can be significant - resulting in poorer educational performance, reduced employment opportunities, lower economic participation and deterio-rating later life health. And it’s an issue affecting people in both developed and developing countries. It is impor-tant to evaluate and measure the social impacts and costs if we are to target solutions to combat vision loss where they can most effectively contribute to reducing health costs, increasing productivity and improving qua-lity of life. This is ever more critical as the world’s popu-lation continues to grow and the demographics of an ageing population with declining vision, put increased pressure on health care services.
ExECuTIVE SuMMARy

5
The Boston Consulting Group was commissioned by Essilor to identify existing international research on the impacts of poor vision. In total over 100 studies were used in the initial review.
A scoring was developed to assess the relevance and quality of these studies. Four criteria were chosen to evaluate the research: newness, sample size, credibility of the author and impact of the results, with a score of 1-5 per criteria. For example, research published in 2010 and after scored most highly (5 points); research before 1980 lower (1 point). Research with a sample of over 10,000 people scored highest and those under 100 lowest. This scoring also weighted the credibility of stu-dies - research carried out by university, scientific and medical researchers as well as multinational organiza-tions scored highest. Finally the impact of results in terms of a clear, differentiating and quantifiable outcome was evaluated. A relative overall score out of a potential 20 points, helped to qualify 65 robust studies from an initial 105.
Analysis of the publication dates in these 65 studies revealed a recent acceleration in research linked to the question of the impacts of impaired vision, for example with 9 studies published in 2010. This suggests a growing interest by academics, researchers and medical/eye care professionals in the issues of vision, health, quality of life and socio-economic well-being.
Certain target populations naturally began to emerge from the review of research studies. It became clear that there was more data available for children, workers, elderly people and drivers. Other groups/activities affec-ted by poor vision – such as adolescents, sports practi-tioners- might have been interesting to review. However, the reliability and availability of data on children, wor-kers, elderly people and drivers made it more pertinent to focus on these four groups.
DEFINITIONS OF VISuAL IMPAIRMENT
In the research reviewed, visual impairment was assessed either through eye examination or self-repor-ting, for example asking people to rate their eyesight on a 1 to 5 scale (excellent to poor) or by asking their ability to perform a daily task such as reading text. The defini-tion of visual impairment identified by eye examination data varied across the different studies.
World Health Organization9 has defined visual impair-ment as visual acuity (VA) of <3/10 (<6/18) on the best-corrected eye. It identifies three categories: visual impairment presenting VA of less than < 6/18, moderate or severe visual impairment presenting VA of less than 6/18 and equal or better than 3/60 and blindness, a VA of less than 3/60. Using this definition, it estimates that there were 246 million people with low vision (severe or moderate visual impairment) and 39 million blind in 201010.
Despite some differences in definition and measurement, all studies converge on the notion of visual impairment caused by either eye diseases or uncorrected refractive errors.
RESEARCH AND METHODOLOgy

6
THE SOCIAL AND ECONOMIC IMPACT OF POOR VISION
Significant numbers of people in the world suffer from poor eyesight. It is estimated that as many as 2.5 billion11 people with vision problems do not benefit from corrective measures. Uncorrected vision (or uncorrected refractive errors), such as shortsightedness, far sightedness and blurred vision, which affect persons of all ages and ethnic groups, are the main causes of vision impairment.
There is a considerable lack of public awareness about the consequences of poor vision on individuals, families and the wider community. Much qualitative academic research has been carried out into societal impacts of impaired vision – on health, well-being and performance (notably in education, productivity and daily living). Some studies have set out to quantify the financial costs in a specific country – for example $72.8 billion in Japan, which is equi-valent to 1.7% of GDP.12 But estimating the economic cost of visual impairment on a global level, and, according to certain at-risk populations, has been less widely explored.
For children there is solid data available on almost all dimensions, with numerous reliable studies conducted (except in Africa) on the impacts of poor vision on per-formance at school and social behaviour, though no cost quantification of the economic burden of vision related learning difficulties. For workers we found reliable eco-nomic data, including detailed productivity loss estima-tion worldwide and per region, though fewer studies on the ‘softer’ impacts such as safety at work. For elderly people, there is significant data covering levels of impair-ment, the impacts of uncorrected vision on well-being, safety and mental health, but no evaluation of the eco-nomic cost of vision related to dependence and increased mortality. For drivers, we found a range of qualitative data exploring the links between visual ability and crash involvement, though no economic evaluation of the risks of poor vision to safety.
Worldwide levels of uncorrected vision CHILDREN WORkERS ELDERLy DRIVERS# people worldwide (Bn) 2.5 3.0 0.7 1.1
% uncorrected worldwide 30%/~810 Mn 33%/~110 Mn 37%/~300 Mn 23%/~280 Mn
FGM2 ~760Mn – 29% ~1000Mn – 32% ~260Mn – 43% ~180Mn – 32%Mature1 markets ~50Mn – 16% ~100Mn – 15% ~40Mn – 13% ~100Mn – 15%
Source: Informarché 2010 for children and elderly people, EIU (Economist Intelligence Unit) for labour force, WorldBank for drivers.1. Mature= North America + Europe. 2. FGM = Fast Growing Markets.
INTRODuCTION
% of people with uncorrected vision
gEOgRAPHIES CHILDREN WORkERS ELDERLy DRIVERS (<18 years old) (>60 years old) North America 14% 13 15% 26 8% 5 15% 40
US 14% 12 15% 23 8% 4 15% 38Canada 9% 1 11% 3 9% 1 11% 2
Europe 17% 27 15% 40 17% 28 15% 53France 7% 1 13% 4 5% 1 13% 5Germany 6% 1 9% 4 5% 1 9% 4UK 2% <1 7% 2 2% <1 7% 3Russia 42% 12 24% 18 19% 5 24% 9
Asia 37% 507 36% 669 41% 159 36% 40China 49% 180 35% 286 35% 57 35% 17India 41% 203 42% 205 45% 38 42% 7
Latin America 21% 42 28% 75 45% 25 28% 43Brazil 14% 9 20% 21 15% 3 20% 10Argentina 28% 4 23% 4 50% 3 23% 3
Rest of the world 23% 146 37% 174 64% 38 37% 65World 30% ~810 33% ~1100 37% ~300 23% ~290
Source: Informarché 2010 (retreated BCG) for % uncorrected and # children, EIU for labour force, WorldBank for drivers, WHO for number of elderly people.
units: Million. The percentage of poor vision shows considerable variation across the world, with significant prevalence in some developing countries. These percentages will continue to rise along with world population growth.

7
It is estimated that 30% of children worldwide (<18 years old) experience uncorrected vision problems. Studies converge on three key areas where impaired vision impacts children: life-long health, school perfor-mance, and emotional/social development.
EARLy DIAgNOSIS VS RISkS FOR LONg-TERM HEALTH
Vision disorders are the fourth most common disability in the United States and the most prevalent handicapping condition in children, particularly with special children needs13. Infants and young children are at risk to perma-nent vision loss from uncorrected refractive errors, stra-bismus and other conditions. Half of all children with amblyopia are diagnosed after the age of five when the-rapy and correction is often no longer as effective.
n Only 14% of children in the United States have received a comprehensive eye examination by the age of six.
In countries with differing levels of health care infras-tructure, little access to preventive eye testing and lower school attendance, the risks are even greater for child-ren’s vision and their subsequent quality of life.
THE IMPACT OF VISION DIFFICuLTIES ON LEARNINg
Vision is a fundamental part of the learning process. 80% of what children learn is acquired through the visual processing of information.14 Clear and comfortable vision is critical to ensure the ability of children to learn. Vision problems can have an adverse effect on comprehension and performance in reading and writing that constitute nearly ¾ of a typical school day. Many studies have looked at the association between visual impairment and poor school performance.
n A survey of school age children in Brazil, found that children with visual acuity below 20/20 have a three times larger risk of failing at least one grade.15
Good eyesight (the ability to read at a certain distance which is tested in some countries) is not the same as good vision. The school environment requires a combi-nation of far sight, near sight and eye-hand coordina-tion, for example reading, interpreting and reproducing information from chalkboard, computer to deskwork.
n A survey of school age children with reading and writing difficulties in Austria found that children with reduced visual acuity and other visual problems such as binocular accommodation and convergence spent 30% more time reading and made larger numbers of errors.16
n Among children who are reading disabled, as many as 80% show a deficiency in one or more basic vision skills.17
The definition of good vision needs to be updated to reflect the evolving requirements of the 21st century learning environment, impacted by the growing popula-rity and use of computers, smart phones, gaming consoles among children and teenagers. Screening should include tests that also detect near-vision pro-blems and other vision issues that hinder a child’s ability to read, learn and perform well in school. Vision care in these crucial childhood years should be a priority.
VISION PRObLEMS CAN IMPACT EMOTIONAL AND SOCIAL DEVELOPMENT
Children with visual impairment are at greater risk of developmental setback in their social development and integration. When vision problems are not detected early, they can negatively affect a child throughout his/her lifetime, potentially leading to anti-social or delinquent behaviour.
US researchers have been exploring the link between vision, learning disabilities and juvenile delinquency since 1949 when a study found that 91% of juveniles in a Tennessee facility performed below grade level due to visually-related learning problems. A 1992 Oregon study found that although 95% of first offenders tested had 20/20 visual acuity, almost half had significant learning-related vision problems that had caused academic pro-blems since early grades. A recent US study found that more than 70% of juvenile offenders had undiagnosed vision problems.19 While there is no single simple solu-tion to solve delinquency, optometric services as part of a multi-disciplinary approach has contributed positive results on rates of recidivism.
n Youngsters whose visual perception problems were corrected were six times less likely to return to court.20
TOWARDS EVALuATINg THE FINANCIAL COSTS OF POOR VISION IN CHILDREN
The educational, developmental and health impacts of poor vision in children are fairly well researched. However, there is very little evaluation on the financial costs these might entail.
n A significant proportion of children in South East Asia are affected by myopia - in Singapore alone it is estimated at 73.9% of teenagers. A 2008 Singapore study calculated the direct costs of myopia in teena-gers as $25 million21.
1 CHILDREN
8
THE SOCIAL AND ECONOMIC IMPACT OF POOR VISION
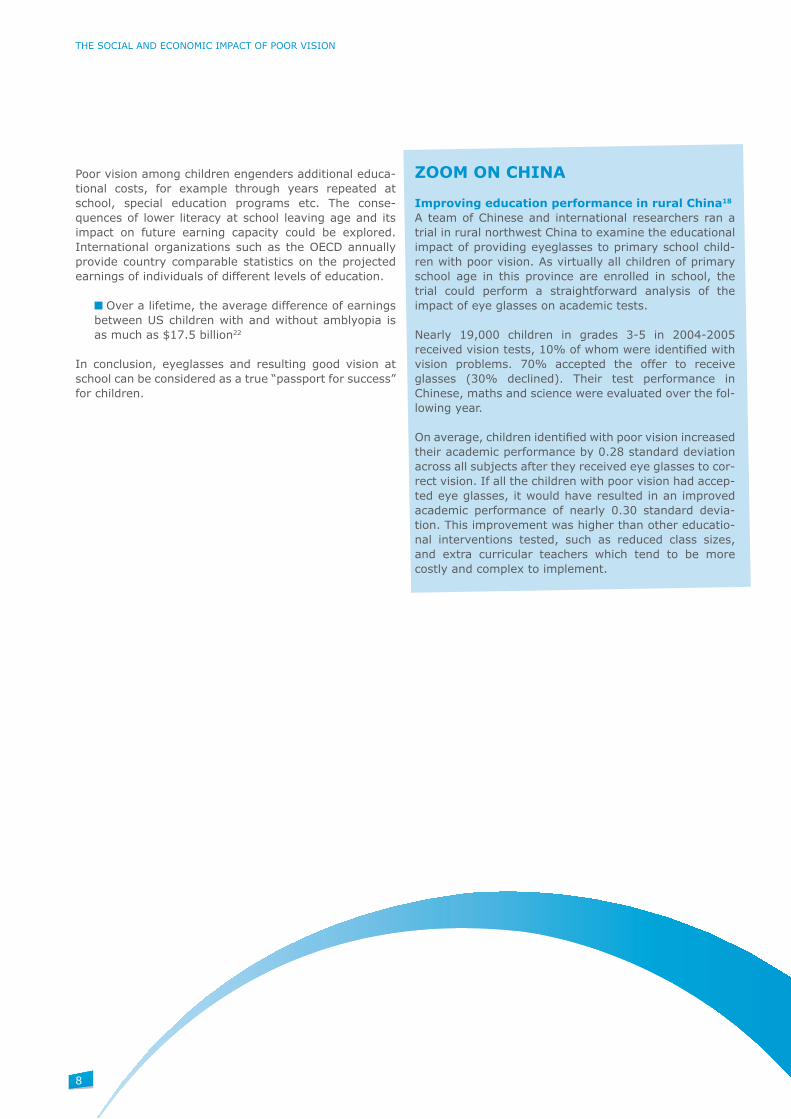
Poor vision among children engenders additional educa-tional costs, for example through years repeated at school, special education programs etc. The conse-quences of lower literacy at school leaving age and its impact on future earning capacity could be explored. International organizations such as the OECD annually provide country comparable statistics on the projected earnings of individuals of different levels of education.
n Over a lifetime, the average difference of earnings between US children with and without amblyopia is as much as $17.5 billion22
In conclusion, eyeglasses and resulting good vision at school can be considered as a true “passport for success” for children.
ZOOM ON CHINA
Improving education performance in rural China18
A team of Chinese and international researchers ran a trial in rural northwest China to examine the educational impact of providing eyeglasses to primary school child-ren with poor vision. As virtually all children of primary school age in this province are enrolled in school, the trial could perform a straightforward analysis of the impact of eye glasses on academic tests.
Nearly 19,000 children in grades 3-5 in 2004-2005 received vision tests, 10% of whom were identified with vision problems. 70% accepted the offer to receive glasses (30% declined). Their test performance in Chinese, maths and science were evaluated over the fol-lowing year.
On average, children identified with poor vision increased their academic performance by 0.28 standard deviation across all subjects after they received eye glasses to cor-rect vision. If all the children with poor vision had accep-ted eye glasses, it would have resulted in an improved academic performance of nearly 0.30 standard devia-tion. This improvement was higher than other educatio-nal interventions tested, such as reduced class sizes, and extra curricular teachers which tend to be more costly and complex to implement.

9
It is estimated that as many as 33% of workers across the world have uncorrected vision that could be impro-ved by screening and wearing glasses.
Studies have explored how visual impairment impacts the working population in terms of health, every day functioning, employment outcomes and sought to esti-mate the financial costs both globally and in specific countries. Some key points have emerged.
HEALTHy VISION IS VITAL FOR A PRODuCTIVE AND EFFICIENT WORkFORCE
Uncorrected childhood vision problems continue into adulthood, for example impacting literacy levels. 66-74% of US adults with literacy problems failed vision screenings.23
n A 1% rise in literacy scores can translate into a 2.5% relative rise in labour productivity and a 1.5% increase in GDP per person.24
Studies have shown direct correlations between correct vision prescription and people’s productivity and effi-ciency at work. For example, vision difficulties at a com-puter can extend necessary work time, cause increased mistakes and result in more breaks required to lessen discomfort from eyestrain or headaches.
n Uncorrected vision can decrease employee perfor-mance by as much as 20%25
n In a study of working men and women in India, wearing reading glasses was found to increase pro-ductivity by 34% and workers’ income by 20%26
We did not identify any research that measures the impact of non-corrected vision in specific work environ-ments such as manufacturing. In some industries, such as automotive or optical, which rely on very high quality levels and use visual checks to identify defects, it would seem likely that poor vision would increase the rate of non-quality. As this is measured in defective parts per million or even parts per billion the impact of non-detec-ted quality problems through poor vision could be high. In other industries such as electronics or confection, workers shortsight vision is critical and uncorrected presbyopia is likely to push many aging workers out of the workforce. Another impact of poor vision for all industries, but in particular manufacturing, is accident rates and safety of a large population of workers. This is an area that would benefit from further research.
VISION PRObLEMS CAN IMPACT WORkER WELL-bEINg AS WELL AS PRODuCTIVITy
Recent research into the self-reported perception by over 10,000 working individuals under 50 in 12 European countries and Israel27 on their employment found that visual impairment had a strong impact on individual employment, job satisfaction, productivity and well-being. Respondents felt they had less opportunity to develop new skills, less support in difficult situations, less recognition for their work and an inadequate salary.
n The worse the eyesight, the higher % of res-pondents reporting poor job security and a salary unequal to efforts and achievement.
THE WORLDWIDE ECONOMIC COST OF POOR VISION
It is estimated that in 2004, 153 million people, the majority of working age, suffered from visual impair-ment due to uncorrected refractive error.28 A collabora-tive research study, conducted with the World Health Organization in 200929 attempted to estimate the poten-tial global productivity loss associated with uncorrected refractive errors. It concluded:
n $269 billion of annual productivity was lost globally after adjustments for labour force participation and employment rates in each country.
n Almost half of the productivity loss was in the Western Pacific Region (including China)
n GDP loss for some areas was as high as 0.73% (South East Asia region including India) 0.86% (Western Pacific China), 0.30% in US, Canada and Western Europe.
n Current burden of uncorrected refractive error has a potentially greater impact on the global economy than all other preventable vision disorders.30
n Providing eye glasses would deliver considerable savings per person treated and a substantial net benefit to the global economy.
2 WORkERS

10
THE SOCIAL AND ECONOMIC IMPACT OF POOR VISION
TOWARDS EVALuATINg THE FINANCIAL COSTS OF POOR VISION AMONg WORkERS
Research such as the WHO report can help us develop a more in-depth evaluation of the financial costs of visual impairment by country. Taking the $269 billion total pro-ductivity loss and applying this per country according to level of impairment and GDP per head, we can begin to quantify the national economic impact of poor vision in the working population.
From this macro level, it would also be valuable for employers to understand the real and financial impact of poor vision, for example the lost productivity by both white collars working on computers and blue collars in precision work station. More research is also needed to explore the other indirect costs caused by poor vision in the working population, for example absenteeism and career costs.
PREVENTION CAN HELP REDuCE HEALTH COSTS CAuSED by VISION PRObLEMS
Health costs associated with a workforce growing older, needing to work for longer and with health issues such as declining vision will continue to increase. Beyond governmental action, there is growing recognition among employers on the business benefits of developing work-place wellness programs as a proactive investment in employee-health, well-being and productivity.
Eye and vision disorders are the second most prevalent health problem affecting over 120 million Americans. Preventive measures such as screening, early interven-tion and targeting at-risk populations can help avoid chronic conditions and reduce overall health care spending.
n Average annual expenditure per employee is 62% higher for workers who did not have an eye examina-tion at work.31
gDP loss due to visual impairment by country
gEOgRAPHy # uNCORRECTED gDP PER HEAD ESTIMATED PRODuCTIVITy
WORkERS (Mn) ($) LOSS ($bn)World 1 002 12 330 269Europe 43 32 440 50
France 2 35 700 3Germany 3 38 950 5Russia 20 16 710 6
America 21 47 065 57US 18 47 910 22Canada 2 40 130 2Brazil 18 11 850 7Argentina 6 17 410 2
Asia & ROW 706 7 590 159China 318 8 590 65India 205 3 790 37Australia 1 41 040 4Japan 5 34600 7
XX Input data WHO report
Method: weighted distribution of $Bn 269 total productivity loss (WHO report – 2009) according to level of impairment and GDP per head in each country.

11
Visual impairment disproportionately affects elderly people. Difficulties with seeing, even for people with eyeglasses, increases with age. After the age of 40, eye disease, visual impairment and blindness increases threefold with each decade.32 Yet under treatment of vision problems, in parti-cular uncorrected refractive error is common.
Research into the impact of visual impairment in the elderly has explored key areas affected: social functio-ning, psychological health and later-life health.
POOR VISION CAuSES DIFFICuLTIES WITH DAILy LIVINg TASkS
Visual impairment, even moderate, significantly impacts people’s daily experience in their later years, limiting their enjoyment of a healthy ageing. It can cause diffi-culties in simple daily living tasks, social interaction and community participation.
n Research in Finland among individuals aged 55+ found that people with a binocular visual acuity less than 0.6 have 2 to 5 times more limitations than those with good vision in performing day to day acti-vities such as mobility, cooking, shopping, climbing stairs.33
n A study in Australia among residents aged 49+ found that difficulties with daily social functioning increase two fold with moderate visual impairment.34
n Elderly people with visual impairment were three times as likely to use community support services, including meals on wheels, home care.35
ZOOM ON THE RISk OF FALLS
The less people can see clearly, the greater the risk of falls and hip fractures. Good vision is essential for main-taining stability, mobility and avoiding falls and fractures. Falls occur in about one third of elderly people living independently in the community and almost doubles for people in residential care. The proportion of elderly people who fall each year increases with age which, given the demographics of an ageing population, makes the prevention of falls an important health issue.
Falls are the leading cause of injury-related deaths and 15-24% of falls result in serious injury (like hip frac-tures) requiring medical treatment.36 A number of stu-dies in different countries have explored the potential risk factor of falls due to visual impairment in visual acuity, visual fields and depth perception. The Blue Mountain Eye Study used a population-based assess-ment of visual impairment to estimate risks to the elderly Australian community. It found:
n Impaired vision and reduced visual field doubled the risk of falls
n For people aged over 75 years, visual impairment represented a nine-fold increase in risk of hip fracture
POOR VISION AND PSyCHOLOgICAL HEALTH
Difficulties with daily living tasks due to poor vision also impact the psychological and emotional health of elderly people.
n Research among British individuals aged 75 and over37, found that that the % of self-reported depression was three times higher among visually impaired than that of non-visually impaired people.
n A higher prevalence of suicidal feelings was found in people with poor vision in research conducted among European individuals aged on average 64 years38. Nearly 20% of people with poor vision mentioned suicidal feelings vs 3% of people with good vision.
ZOOM ON VISION AND COgNITIVE DECLINE
Research has begun to look at the links between poor vision and cognitive decline and whether treatment for visual problems could help to slow down or delay the onset of cognitive impairment. Cloudy, sensitive or reduced vision can be disorienting. Visual problems, including spatial orientation, contrast sensitivity and colour perception, are often some of the first symptoms in persons with Alzheimer’s disease.
Research conducted on the experiences of elderly US participants39 sought to explore the link between poor vision, treatment for visual disorders and cognitive decline, including dementia. It found that elderly people who visited an ophthalmologist significantly reduced their risk of cognitive impairment or dementia.
n Individuals with good vision had a 63% reduced risk of dementia.
n Elderly people with poorer vision that remained untreated had a 9.5 fold increased risk of developing Alzheimer’s disease and a five fold increase of cogni-tive impairment without dementia.
n The risk of dementia increased by 52% with each 1-unit increase in the vision scale (measured in six levels from excellent to blind)
3 ELDERLy PEOPLE

12
THE SOCIAL AND ECONOMIC IMPACT OF POOR VISION
POOR VISION AND LATER LIFE HEALTH Increasing life expectancy with people living longer is changing demographics with a larger proportion of elderly people in the overall population in many countries. As vision declines with age, globally we can expect to see an exponential increase of eye disease and visual impairment.
Research in Australia has shown that the prevalence of certain age-specific conditions affecting vision will inevi-tably increase among the elderly population including cataracts, glaucoma (as much as 9% of people in their 80s and 90s40) and macular degeneration. The number of people with poor vision due to under-corrected refrac-tive error also increases significantly in older age groups41. More than a third of elderly people with an aged-care assessment in Australia have poor vision42.
TOWARDS EVALuATINg THE FINANCIAL COSTS OF POOR VISION AMONg THE ELDERLy
Given the data on the social, mental and physical health impacts of poor vision among elderly people there are several potential avenues of further research for evalua-ting the economic costs.
Increasing social isolation due to impaired vision engen-ders dependency and an increased uptake in social wel-fare services.
Some studies have highlighted the medical costs of falls and hip fractures which are seven times more likely among visual impaired elderly people. Falls typically result in significant hospital treatment, community care and personal care costs.
n The cost of falls to the Australia healthcare system in 2001 was estimated to be nearly $500 million and is projected to increase three-fold by 2051.43
Using this hypothesis on increased risk of fracture due to visual impairment, one could develop a cost modelisa-tion of the avoidable annual costs of hip fracture pro-cedures and hospitalization (see table below).
The relationship between poor vision and dementia could encourage further study into the relative costs of resi-dential and specialist mental health provision caused by visual impairment versus preventive eye treatment.
Country Average # Avoidable Avoidable annual
cost of procedure (€) hip fractures direct costsFrance 6 500 6 000 €38 MnGermany 6 500 11 000 €73 MnUSA 10 600 23 808 €253 Mn

13
Good eyesight and visual perception are fundamental for safe driving. It’s estimated that 23% of drivers across the world have uncorrected vision and need to wear glasses to improve their visual capacity while driving. Any visual impairment will affect the ability of a driver to see road signs clearly close and at distance, react to other road users quickly and anticipate certain driving maneuvers. More than 90% of decisions made behind the wheel depend on good vision.
VISuAL SENSORy AbILITy NEEDED FOR SAFE DRIVINg
There is no international standard for vision used world-wide for obtaining a driving licence. Many countries require a specified level of distance perception (visual acuity), for example in the UK the ability to read a num-ber plate at a required distance (around 20m) or a visual acuity of not less then 6/15 in Canada.
The American Academy of Ophthalmology defines the components of safe driving to include:
1. The motor ability to scan a rapidly changing environment
2. The sensory ability to perceive information in this rapidly changing environment
3. The attentiveness to process multiple pieces of information.
4. The cognitive ability to judge this information in a timely fashion and to make the appropriate decisions.
5. The motor ability to execute these decisions in a timely fashion.
The following components of visual sensory ability contri-bute to an individual’s ability to drive safely: visual acuity, peripheral visual field, useful field of view, contrast sensitivity, glare sensitivity, central visual field, colour vision.
THE RISkS OF IMPAIRED VISION ON DRIVINg
It’s estimated that 1.2 million people die and 50 million are injured in road accidents each year throughout the world44. Good vision plays a central role in the interaction of three key factors for safe driving – man-environment-vehicle. Yet many drivers are unaware that visual diffi-culties increase as light conditions change, underlining a lack of information about the role of sight in road safety.
n Visual skills testing among a sample of Italian dri-vers found a significant number that did not meet Road Code specifications: over 18% had inadequate visual acuity and over 24% had inadequate night vision45.
People with visual impairment often compensate for their difficulty, for example by avoiding crowded rush-hour conditions/driving in the dark or adjusting driving speed. Slower driving still cannot compensate for reduced ability to recognize road signs, hazards and pedestrians. Studies have investigated the risk factors for crash involvement.
n A 2008 report into road accidents in Italy found that 59% of accidents could be linked to causes asso-ciated with poor sight – such as failure to use correc-tive lenses or glare-related reasons46
n In a European analysis of health-related risk factors in road accidents, a study found that risk of car crash increases by 9% with visual impairment47. However, this was less than other impairments such as cardio-vascular diseases and the use of medication or drugs.
ZOOM ON NIgHT-TIME DRIVINg
Given current difficulties in a direct link between impai-red vision and accident rate statistics, researchers have looked at evaluating driving performance under varying conditions. Reduced lighting and poor visibility contri-bute to making driving at night more dangerous than during daytime hours – with higher crash and fatality rates, especially for pedestrians.
A research study in Australia looked at the effect of simulated visual impairment – cataracts and refractive blur - on night-time driving48. It found that even mode-rate visual impairment significantly reduced driving per-formance in night-time conditions:
n reducing by 30% the ability to recognize road signs
n increasing the risk of hitting road hazards by 2.5 n increasing by 8% the time taken to complete the dri-
ving course
4 DRIVERS
14
THE SOCIAL AND ECONOMIC IMPACT OF POOR VISION
HIgHER RISkS FOR OLDER DRIVERSStudies have also explored the risk factors for drivers whose visual functional typically worsens as they get older.
n In a study of older drivers aged 65-84 in the United States49, glare sensitivity, visual field loss and useful field of view were found to be significant predictors of crash involvement. n European research found that 4.9% of drivers 64-75 years had a limited visual acuity (0.5-0.8), rising to 13% of drivers over 75. n 41% of drivers 75 and over suffer from limited use-ful field of view, which is associated with slow infor-mation processing and difficulties with certain maneuvers such as merging, exiting and going round bends.
Some eye conditions such as cataracts, which are pre-sent in up to half of adults aged 65 years or older, have been identified as increasing the risk of accidents for older drivers.
n In a comparative study of older drivers with and without this condition, contrast sensitivity due to cataract was found to increase crash risk, and indivi-duals who underwent cataract surgery reduced by half the crash rate compared to those who did not undergo treatment50.
Poor vision is often the major factor behind the decision to stop driving.
n A study in Florida, USA, reviewed the impact of the introduction of a vision screening law designed to give drivers an opportunity to correct the identified problem on fatality rates of drivers 80 years and older. It reduced fatalities by 17% over a three-year period.51
n The number of UK drivers whose driving licences have been withdrawn due to failing eyesight has more than doubled over four years – from 1,597 in 2006 to 4,009 in 201052.
TOWARDS EVALuATINg THE FINANCIAL COST OF POOR VISION AMONg DRIVERS
The emerging link between road accidents and visual perception could offer a starting point for an evaluation of the financial costs of poor vision among drivers.
n The National Institute for Statistics in Italy estimated the social cost of road accidents in 2007 as over €30 billion – approximately 2% of GDP. €18bn of this can be linked to impaired vision according to an evaluation by University of Milan-Bicocca.
Data shows a lack of awareness and understanding of current legislative requirements that prevents many dri-vers from ensuring adequate levels of visual perception. This increases the risk of accident involvement, can lead to the withdrawal of driving licences or the decision to stop driving – all of which can financially impact on indi-viduals and society. Systematic and professionally hand-led eye examinations should be considered in the process
15
5 MOVINg FORWARD
TOWARDS EVALuATINg FINANCIAL COSTS OF VISION PRObLEMS
Poor vision has a financial cost as well as impacting indi-viduals, families and their communities. Currently there is little or no internationally comparative evaluation of direct costs as health infrastructures, financing and access to services vary considerably from country to country. Estimating the full economic impact of vision problems needs to go far beyond direct health costs – correction, surgery and outpatient treatment.
More research is needed to evaluate dimensions such as:
For children
n education costs: school years repeated, special education programs, school drop out rates
n judicial costs: social welfare, juvenile delinquency, criminality and incarceration
n lifetime costs of poor literacy, reduced employment opportunities and lower earning potential
For workers
n cost of productivity losses due to absenteeism, presenteeism and preventable eye problems
n cost of productivity losses due to increased accident rates and higher costs of non-quality
n cost of lower labour force participation and lower wages
For elderly
n cost of social isolation and community welfare services
n cost of injuries like hip fractures due to falls
n costs of declining cognitive health, depression and dementia
For drivers
n cost of preventable accidents through lack of awa-reness of vision standards
n cost of driving licences revoked due to impaired vision
n indirect cost to car manufacturers due to people giving up driving
DEVELOPINg SOLuTIONS TO VISuAL IMPAIRMENT
Greater public awareness of the importance of vision health is critical, as is mass screening to identify pro-blems that can be corrected. Most visual impairment can be treated with cost effective services, for example with corrective eye glasses, to reduce the personal, social and economic burden of vision loss. More available and affor-dable eye care services, particularly for more high-risk groups need to be explored.
A key enabler is the development of easier and effective (self) screening, for example in schools, in the work-place, on the move and in residential care settings. Handheld devices, or applications on widely available technology like mobile phones, could offer a practical way to take the important message of vision health to a wider audience.
The global challenge of vision impairment concerns us all and will require the combined efforts of governments, health authorities, medical/eye care professionals, aca-demic and private sector institutions as well as greater understanding among the general public.
We believe that highlighting the methodologies and results of existing studies in this area will help increase awareness in the wider community and encourage researchers and eye care professionals to explore further the impacts of poor vision within their own countries. If we can better understand this life impacting issue, we can advance towards removing some of the barriers to eliminate this widespread handicap.
16
THE SOCIAL AND ECONOMIC IMPACT OF POOR VISION
REFRACTIVE ERROR
Clear vision, which does not require any correction, is characterized by good visual acuity and a normal field of vision. Ametropia refers to a condition when the image does not form correctly on the retina and results in blur-red vision that requires optical correction – called refrac-tive error. This can be caused by four common problems:
n myopia (nearsightedness or shortsightedness),
n hyperopia (farsightedness), n astigmatism (imprecise near and far vision, blur-ring of peripheral vision and difficulties in distin-guishing shapes, details and contrasts)
n presbyopia (the blurring of near vision which gene-rally occurs after the age of 40 with the natural aging of the crystalline lens).
Other problems exist, such as amblyopia (‘lazy eye’) and strabismus (distortion between visual perception in both eyes). Corrective lenses are the most common means of correcting all these types of eyesight problems, though if some conditions are left untreated during childhood, sur-gery may be required for adults.
VISuAL ACuITy
Visual acuity is used as a key indication of vision. It is evaluated through testing a person’s ability to read detail (letters or symbols) from a certain distance. Visual acuity can be measured in feet and expressed relative to 20/20, in metres and expressed relative to 6/6, in decimal terms where 1.0 is equal to 20/20 or through a LogMAR scale where 0.00 equals 20/20 vision, positive values indicate vision loss and negative values denote normal or better visual acuity.
A visual acuity of 20/20 means that a person can see detail from 20 feet (6.1m) away the same as someone with normal eyesight would see from 20 feet. If a person has a visual acuity of 20/40, s/he would see detail from 20 feet away the same as someone with normal eyesight would see from 40 feet (12m) away.
VISuAL IMPAIRMENT
Visual impairment is due to a significant decrease in visual acuity or a reduction in the field of vision and is a term used when this degradation limits the fulfillment of daily tasks. Anyone can suffer from impaired vision at any age, but elderly people are particularly affected.
SyMPTOMS
Impaired vision results in:
n a reduction in central vision: causing difficulties reading, writing, carrying out tasks requiring preci-sion, interpreting colours and recognizing faces.
n a reduction in peripheral vision: the field of vision is reduced as if looking through a tunnel, resulting in difficulty moving around without bumping into objects.
Impaired vision can be caused by several conditions – age-related macular degeneration, retinitis pigmentosa, cataracts, glaucoma and diabetic retinopathy.
APPENDIx 1
OVERVIEW ON VISION
17
Correcting vision can be done through existing interven-tions such as mass screening, public information and cost-effective treatment like eye glasses. The challenges to correcting poor vision are not always financial, but in some cases, social and cultural too.
CHILDREN - bARRIERS TO CORRECTINg VISION
30% of children worldwide (<18 years old) should but do not wear glasses which could correct their vision. Many are simply not diagnosed, either because parents may not be aware of the importance of having young children’s eyes checked or because they are not able due to affordability issues, lack of time, lack of available eye care services locally. Parents may not want to take their child to an eye doctor for cultural reasons, e.g. as seen in China where glasses are believed to weaken the eyes and worsen myopia.
Eye-screening in many countries occurs once the child goes to school. However, this may not be automatic in many countries lacking enough trained eye care professio-nals and health care resources available throughout urban or rural areas. At this stage there may be a number of reasons for not wearing glasses:
n the child does not go to school
n there is no eye-screening organized at school
n screening is not exhaustive, for example focusing only on distance vision and not difficulties with near vision tasks
n parents may not follow-up eye screening at school with a comprehensive eye examination due to financial, logistical reasons and lack of basic infrastructure
n the child may refuse to wear glasses because it’s ‘inconvenient’, ‘uncomfortable’, ‘not trendy’.
WORkERS - bARRIERS TO CORRECTINg VISION
33% of workers across the world have uncorrected vision that could be improved by wearing glasses. Vision correc-tion is often not recognized by individuals nor promoted by employers. For example:
n Workforce wellness programs do not include eye screening as part of basic health coverage and do not reinforce the importance of having vision correction to improve daily comfort at work
n Employees may blame long hours spent at a compu-ter as reason for visual fatigue or headaches, without considering the possibility of underlying eye problems.
There are a range of reasons for not wearing glasses, most obviously dictated by the scope and availability of health-care infrastructure and the financing of services. Some key factors include:
n financial barriers to eye examination and corrective measures: for example little or no reimbursement of vision care costs
n logistical barriers: such as perceived lack of time to undergo eye testing, impossibility of taking time off from work, eye care services located too far from work or home
n lack of information on where to go to have an eye examination
n little public awareness of the importance of eye tes-ting or even misconceptions and beliefs about wearing eye glasses
In some countries, workforce wellness programs do not include eye screening as part of basic health coverage, and thus do not reinforce the message of the importance of eye examinations and the need to have vision correction to improve daily working conditions and comfort. Employees often blame long hours performing precision/near vision activities or accumulated hours spent on screen for pro-blems with visual fatigue and headaches, without conside-ring the possibility of underlying eye problems.
ELDERLy PEOPLE - bARRIERS TO CORRECTINg VISION
37% of elderly people worldwide over 60 years of age have problems with uncorrected vision and would benefit from glasses to improve their sight. After the age of 40, eye disease, visual impairment and blindness increases threefold with each decade. Yet under-treatment of vision problems, in particular uncorrected refractive error, is common.
Elderly people face a number of obstacles that can prevent them from visiting eye care professionals. For example:
n Mobility: inability to drive, difficulties in taking public transport (if available) or walking, isolated at home and unable to go out without assistance
n Financial: medical expenses tend to increase with age. With limited (or no) pensions, elderly people may forgo eye examination in favour of other more priority medical expenses such as diabetic or heart condition treatments.
APPENDIx 2
CHALLENgES TO CORRECTINg VISION

18
THE SOCIAL AND ECONOMIC IMPACT OF POOR VISION
DRIVERS - bARRIERS TO CORRECTINg VISION
23% of drivers across the world have uncorrected vision and need to wear glasses to improve visual capacity while driving. The majority of these drivers are located in mature markets such as North America, Europe and Japan, though improved economic conditions and demographics will increase the challenge for developing countries too.
Reasons for not wearing glasses when driving are mostly due to a lack of information on the specific vision needs required.
n Drivers may be unaware that they need glasses (no mandatory eye screening to get a driving license): their refractive default may be very modest but exacerbated when driving
n Some drivers replace their usual corrective glasses by ordinary sunglasses and thus drive without vision correction
n People who wear glasses may not be convinced of the need of an additional pair and for financial reasons may not want to buy a second pair (usually not reimbursed)
n People may not be aware of the existence of a dedi-cated product offer for driving
Legislation is not dissuasive enough for now.Mandatory eye screening to get driving license and syste-matic eye check-up for seniors have not yet been imple-mented in most countries, but there are discussions ongoing (e.g. European Parliament)

19
SOuRCES/REFERENCES1 Cumani Toledo et al, University Juiz de Fora (Brazil), “Early detec-tion of visual impairment and its relation with school effectiveness”, Rev Assoc Med Bras 2010; 56(4)
2 Barber, A Johnson, R, ed “Behavioral aspects of Vision Care”. Santa Ana CA: Optometric Extension Program 2002; 42:1-7
3 Smith et al, “Potential lost productivity resulting from the global burden of uncorrected refractive error”, Bull World Health Organ 2009; 87
4 Daum, Kent and Katherine Clore 2004. “Productivity associated with visual status of computer users”. Optometry 75(1)
5 Valbuena et al, “Self-reported assessment of visual function in a population-based study: the SEE project. Salisbury Eye Evaluation”. Invest Opthalmol Vis Sci 40 1999
5 Mitchell P et al, Blue Mountain Eye Study 2009
6 Rogers Mary, Langa Kenneth, “Untreated poor vision: a contributing factor to late-life dementia”, Am J Epidemiol 2010
7 Maffioletti et al, “The importance of precise sight correction for safe driving”, Università degli Studi di Milano, 2009
8 Vaa, “Impairments, diseases, age and their relative risks of accident involvement: results from meta-analysis“, 2003
9 “Consultation on development of standards for characterization of vision loss and visual functioning” (WHO/PBL/03.91,1-19). Geneva: World Health Organization; 2003.
10 Pascolini D and Mariotti S P, “Global estimates of visual impairment” 2010
11 Source: BCG estimation from Infomarché 2010 (children and elderly people), Economist Intelligence Unit (labour force), WorldBank (drivers)
12 For example – Frick et al, “Economic Impact of Visual Impairment and Blindness in the United States”, 2006; Roberts et al, “Economic Cost of Visual Impairment in Japan”, 2009; Taylor et al, “The econo-mic impact and cost of visual impairment in Australia”, 2006
13 “A Survey of Vision Screening Policy of Preschool Children in the United States”, Current Ophthalmology Vol 43 No 5 March-Apr 1999,
14 “Visual Screening of Adjudicated Adolescents”, Journal of Behavioural Optometry, Vol 10 No 1 1999
15 Cumani Toledo et al, University Juiz de Fora (Brazil), “Early detection of visual impairment and its relation with school effectiveness”, Rev Assoc Med Bras 2010; 56(4)
16 Dusek et al, “A survey of visual function in an Austrian population of school-age children with reading and writing difficulties”, BMC Ophthalmology 2010 10:16
17 Hoffman, LH, “Incidence of Vision Difficulties in Children with Learning Disabilities,” Journal of American Optometric Association, 1985,56:560- 563
18 “Eye tests, eye glasses and improving education performance in rural China, Rural Education Action Project 2004”, REAP Brief #109, The Gansu Vision Intervention Project.
19 Barber, A Johnson, R, ed “Behavioral aspects of Vision Care”. Santa Ana CA: Optometric Extension Program 2002; 42:1-7
20 Barber G, Zaba J, “Learning Disabilities and juvenile delinquency”. JLearn Disabil 1978;11(4)
21 Singapore Quek et al. “Prevalence of refractive errors in teenage high school students in Singapore”. Ophthalmic Physiol Opt 2004 24
22 Estimation from National Children’s Eye Care Foundation, 2000
23 Johnson R, Zaba J, “The link: Vision and illiteracy”, J Behav Optom 1994;5
24 Coulombe S et al. “International Adult Literacy Survey Scores, Human Capital and Growth across fourteen OECD countries”. Ottowa: University of Ottawa, 2004
25 Daum, Kent and Katherine Clore 2004. “Productivity associated with visual status of computer users”. Optometry 75(1)
26 Vision Spring – a case control study in Andhra Pradesh, India
27 Jugnoo S Rahi et al, “Visual Function in Working-Age Adults”, American Academy of Ophthalmology 2009
28 Resnikoff et al, “Global magnitude of visual impairment caused by uncorrected refractive errors in 2004”. Bull WHO 2008;86
29 Smith et al, “Potential lost productivity resulting from the global bur-den of uncorrected refractive error”, Bull World Health Organ 2009; 87
30 Frick KD , Foster A, “The magnitude and cost of global blindness: an increasing problem than can be alleviated.”, Am J Ophthalmol 2003;135
31 KDD Health Solutions based on an analysis of 389 invidividuals in a moderate size employer over three years.
32 VanNewkirk et al, “The cause-specific prevalence of bilateral visual impairment in Victoria, Australia (2001): The Visual Impairment Project”, Opthalmology 108
33 Laitinen et al, “The Association between visual acuity and functional limitations”. 2007
34 Valbuena et al, “Self-reported assessment of visual function in a population-based study: the SEE project. Salisbury Eye Evaluation”. Invest Opthalmol Vis Sci 40 1999
35 Mitchell P et al, Blue Mountain Eye Study 2009
36 Koski et al, “Risk factors for major injurious falls among the home-dwelling elderly by functional abilities. A prospective population-based study.” Gerontology 1998
37 Evans et al “Depression and anxiety in visually impaired older people”, 2007
38 Mojon et al, “Impact of low vision on well-being in 10 European countries“, 2008
39 Rogers Mary, Langa Kenneth, “Untreated poor vision: a contribu-ting factor to late-life dementia”, Am J Epidemiol 2010
40 Wensor et al, “The prevalence of glaucoma in the Melbourne Visual Impairment Project” Ophthalmology 105, 1998
41 Liou et al, “ Prevalent and predictors of undercorrected refractive errors in the Victorian population”, Am J Opthalmol, 1999
42 Nottle et al, “Detection of vision impairment in people admitted to aged care assessment centres”, Clin Exp Opthalmol 28, 2000
43 Moller, “Projected costs of fall related injury to older persons due to demographic changes in Australia.” Commonwealth Department of Health and Ageing 2003
44 Sethi et al, 2007. “Preventing the leading cause of death in young people in Europe” , J Epidemiol Community Health 2007;61
45 Maffioletti et al, “The importance of precise sight correction for safe driving”, Università degli Studi di Milano, 2009
46 Incidenti stradali , ISTAT/ACI Report 2008
47 Vaa, “Impairments, diseases, age and their relative risks of accident involvement: results from meta-analysis“, 2003
48 Wood et al, “Effect of simulated visual impairment on nighttime driving performance”, Optometry and Vision Science 87;6 June 2010
49 Rubin et al, “A prospective, population-based study of the role of visual impairment in motor vehicle crashes among older drivers: The SEE Study”. Invest Ophthalmol Vis Sci 2007;48
50 Owsley et al, “Visual risk factors for crash involvement in older drivers with cataracts”, Arch Opthalmol 2001;119
51 McGwin et al, “Survey of Older Drivers’ Experiences with Florida’s Mandatory Vision Re-Screening Law for Licensure”, Ophthalmic Epidemio 2008; 15(2)
52 Cooperative Motor Group 2011
Vision Impact InstituteObservatoire des enjeux de la vision147 rue de Paris94220 CharentonFrance