Embed Size (px)
Citation preview
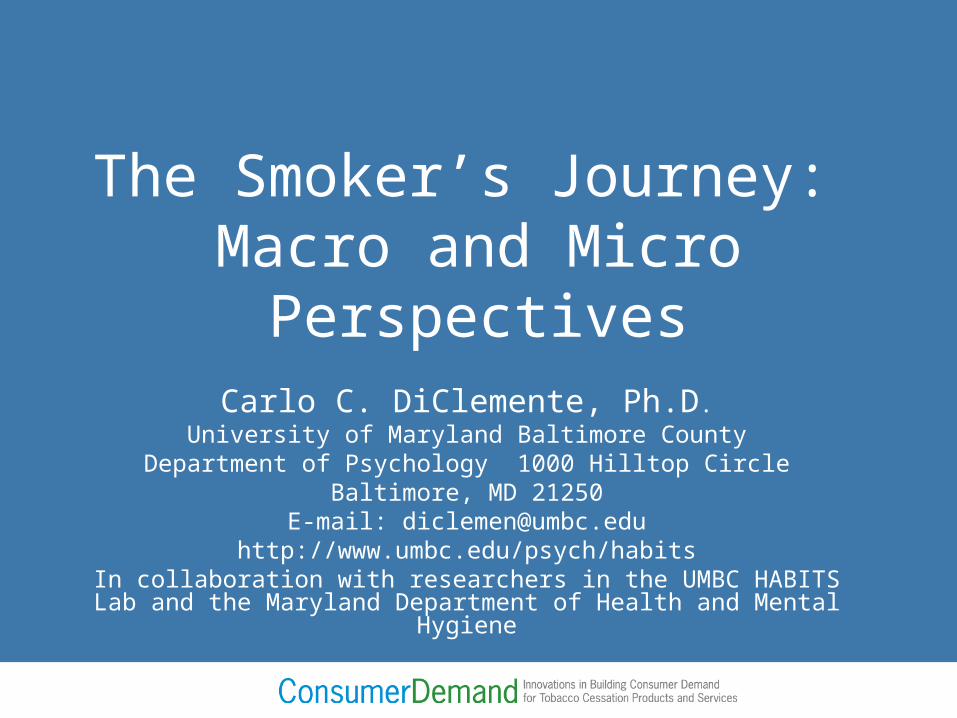
The Smoker’s Journey: Macro and Micro
PerspectivesCarlo C. DiClemente, Ph.D.
University of Maryland Baltimore CountyDepartment of Psychology 1000 Hilltop Circle
Baltimore, MD 21250E-mail: [email protected]
http://www.umbc.edu/psych/habitsIn collaboration with researchers in the UMBC HABITS Lab and
the Maryland Department of Health and Mental Hygiene
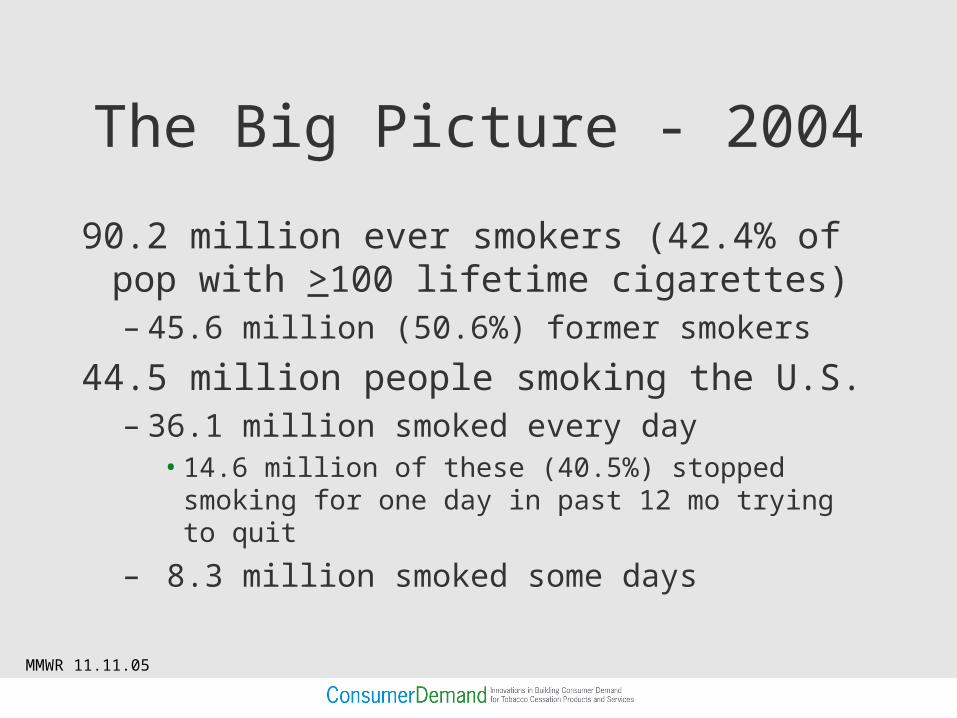
The Big Picture - 2004
90.2 million ever smokers (42.4% of pop with >100 lifetime cigarettes)– 45.6 million (50.6%) former smokers
44.5 million people smoking the U.S.– 36.1 million smoked every day
• 14.6 million of these (40.5%) stopped smoking for one day in past 12 mo trying to quit
– 8.3 million smoked some daysMMWR 11.11.05
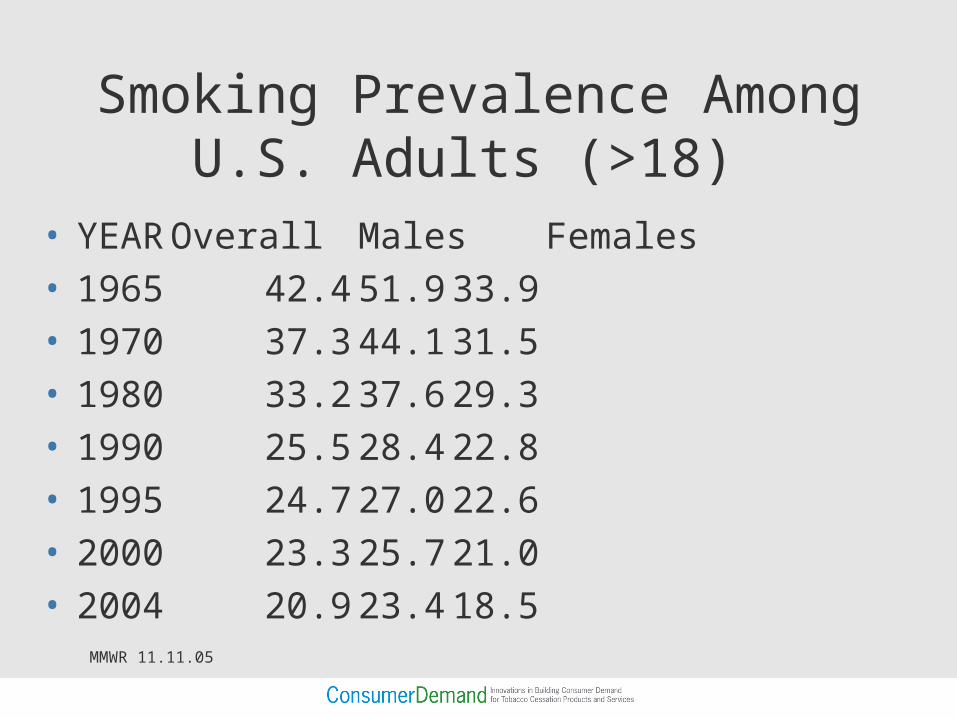
Smoking Prevalence Among U.S. Adults (>18)
• YEAR Overall MalesFemales
• 1965 42.4 51.9 33.9• 1970 37.3 44.1 31.5• 1980 33.2 37.6 29.3• 1990 25.5 28.4 22.8• 1995 24.7 27.0 22.6• 2000 23.3 25.7 21.0• 2004 20.9 23.4 18.5
MMWR 11.11.05
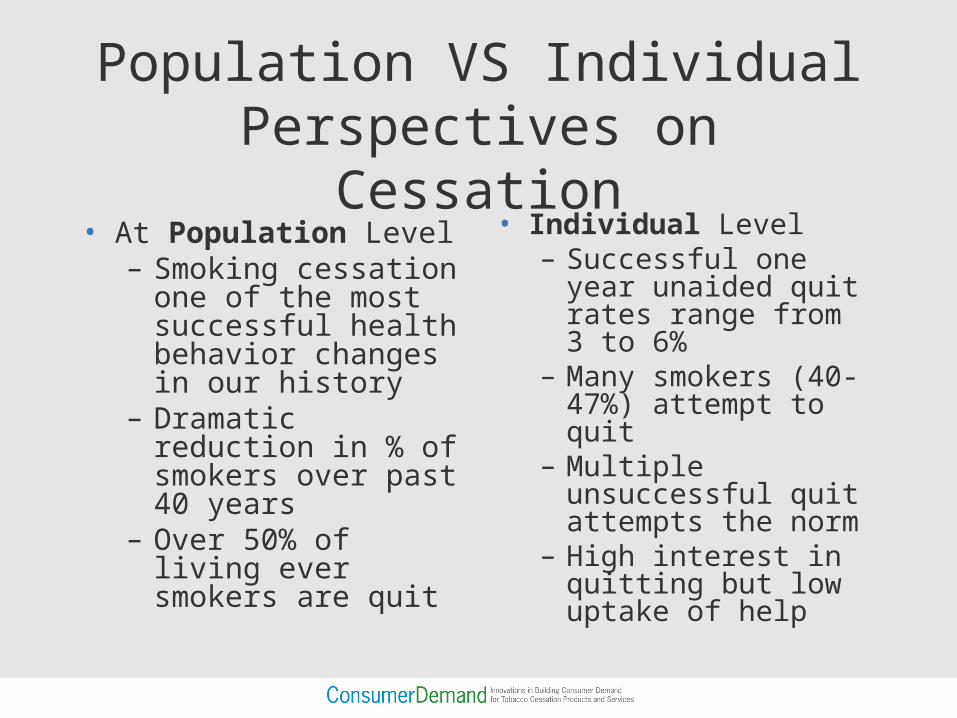
Population VS IndividualPerspectives on Cessation
• At Population Level– Smoking cessation
one of the most successful health behavior changes in our history
– Dramatic reduction in % of smokers over past 40 years
– Over 50% of living ever smokers are quit
• Individual Level– Successful one year
unaided quit rates range from 3 to 6%
– Many smokers (40-47%) attempt to quit
– Multiple unsuccessful quit attempts the norm
– High interest in quitting but low uptake of help
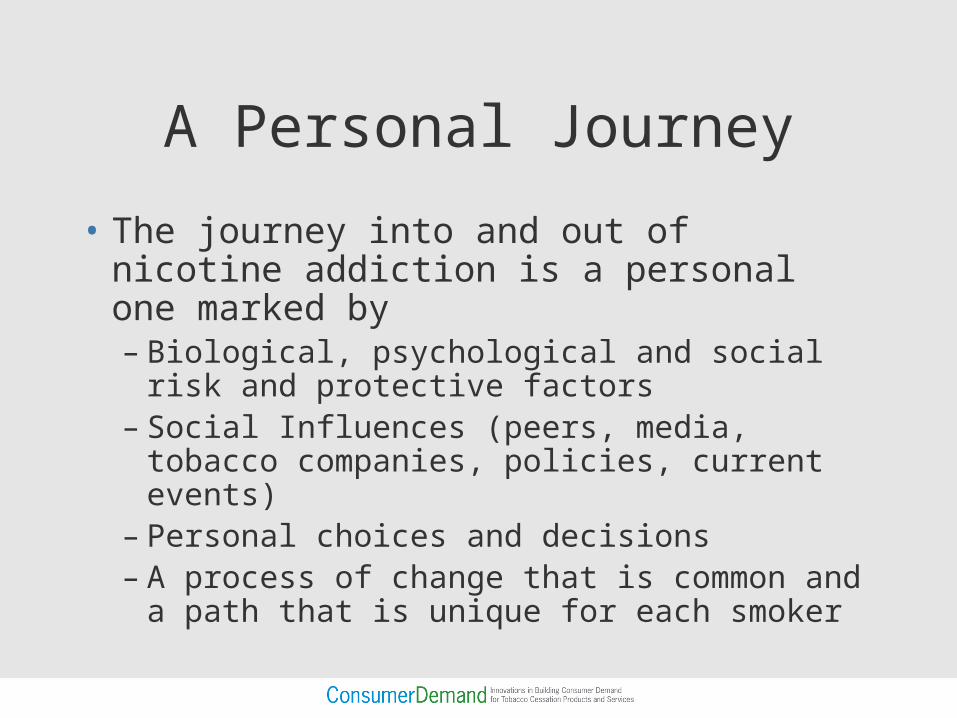
A Personal Journey
• The journey into and out of nicotine addiction is a personal one marked by– Biological, psychological and social risk
and protective factors– Social Influences (peers, media, tobacco
companies, policies, current events)– Personal choices and decisions– A process of change that is common and
a path that is unique for each smoker
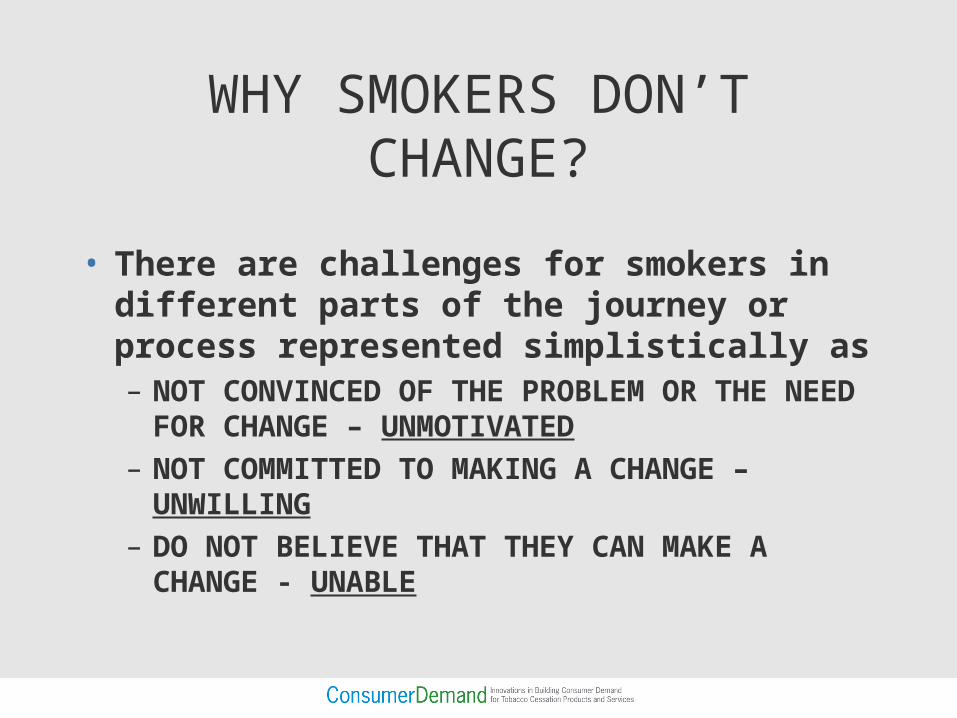
WHY SMOKERS DON’T CHANGE?
• There are challenges for smokers in different parts of the journey or process represented simplistically as– NOT CONVINCED OF THE PROBLEM OR
THE NEED FOR CHANGE – UNMOTIVATED– NOT COMMITTED TO MAKING A CHANGE –
UNWILLING– DO NOT BELIEVE THAT THEY CAN MAKE A
CHANGE - UNABLE
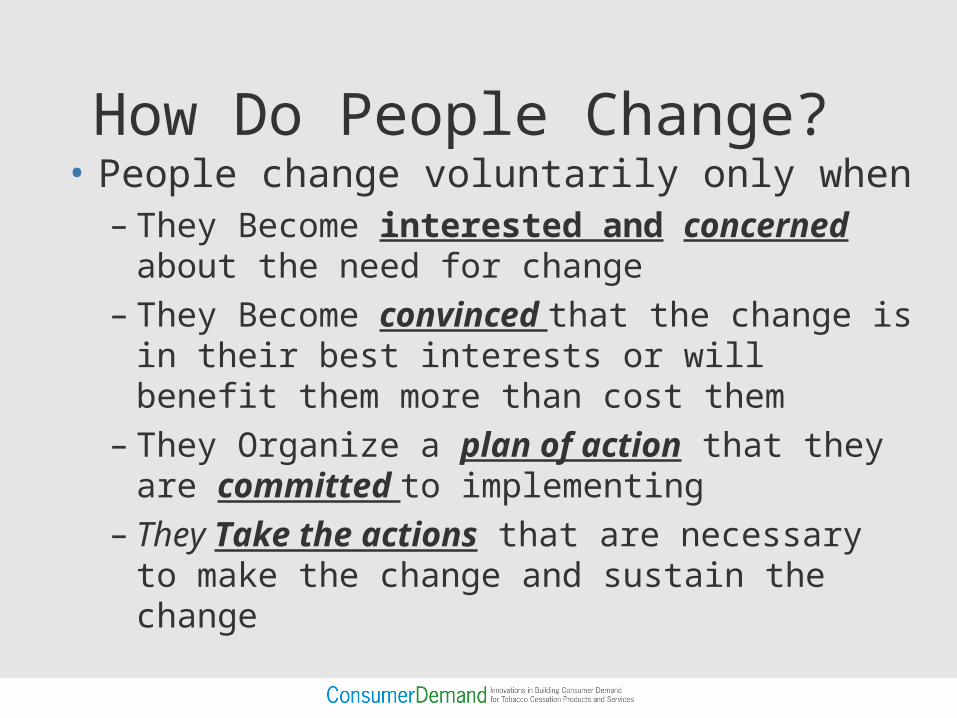
How Do People Change? • People change voluntarily only when
– They Become interested and concerned about the need for change
– They Become convinced that the change is in their best interests or will benefit them more than cost them
– They Organize a plan of action that they are committed to implementing
– They Take the actions that are necessary to make the change and sustain the change
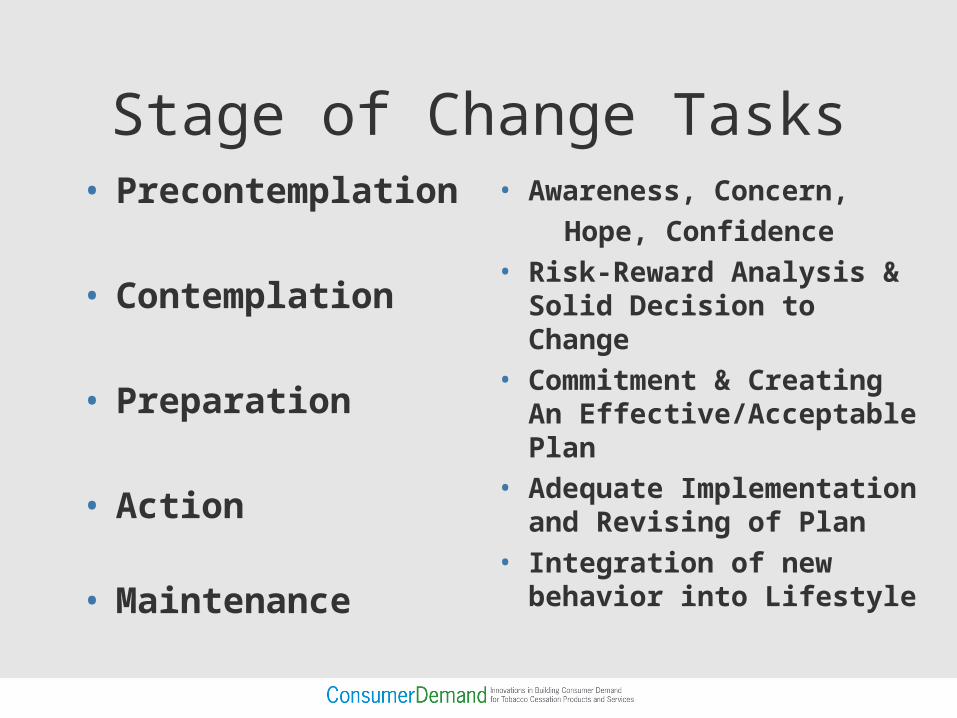
Stage of Change Tasks• Precontemplati
on
• Contemplation
• Preparation
• Action • Maintenance
• Awareness, Concern, Hope, Confidence• Risk-Reward Analysis &
Solid Decision to Change
• Commitment & Creating An Effective/Acceptable Plan
• Adequate Implementation and Revising of Plan
• Integration of new behavior into Lifestyle
Relapse: Not Just An Addiction Problem
• Relapse is defined as noncompliance, failure to follow through on a proposed or needed behavior change, slipping back to status quo, inability to sustain change long term.
• Relapse occurs at similar rates for individuals with diabetes, hypertension, cardiovascular problems, HIV/AIDS, dietary change, physical activity, etc
• Relapse a problem of sustaining behavior change not simply addiction
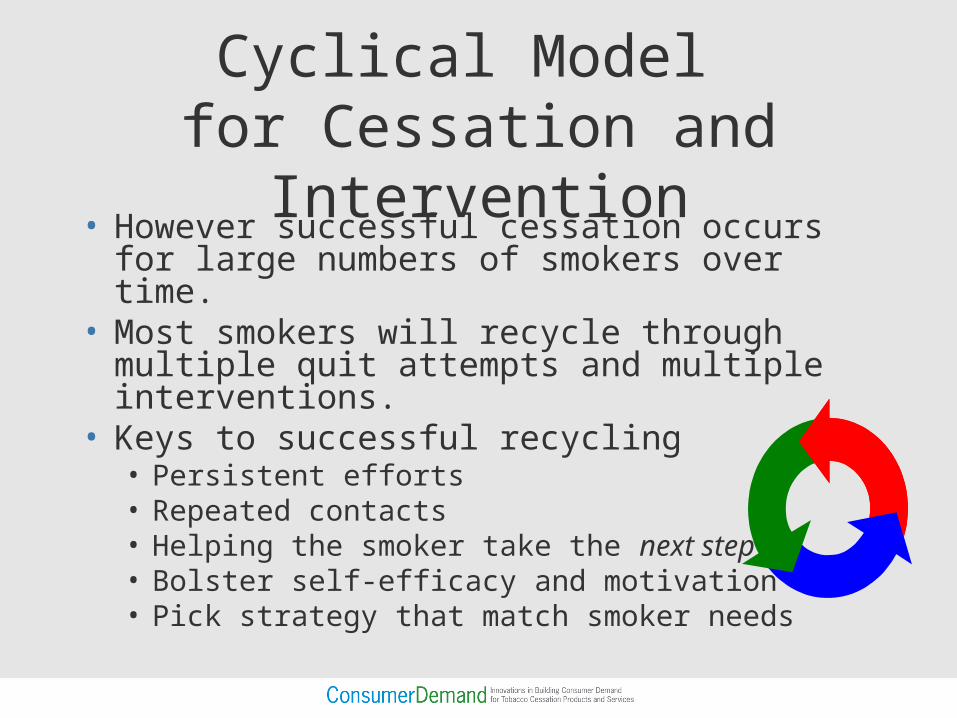
Cyclical Model for Cessation and
Intervention• However successful cessation occurs for large numbers of smokers over time.
• Most smokers will recycle through multiple quit attempts and multiple interventions.
• Keys to successful recycling• Persistent efforts• Repeated contacts• Helping the smoker take the next step• Bolster self-efficacy and motivation• Pick strategy that match smoker needs
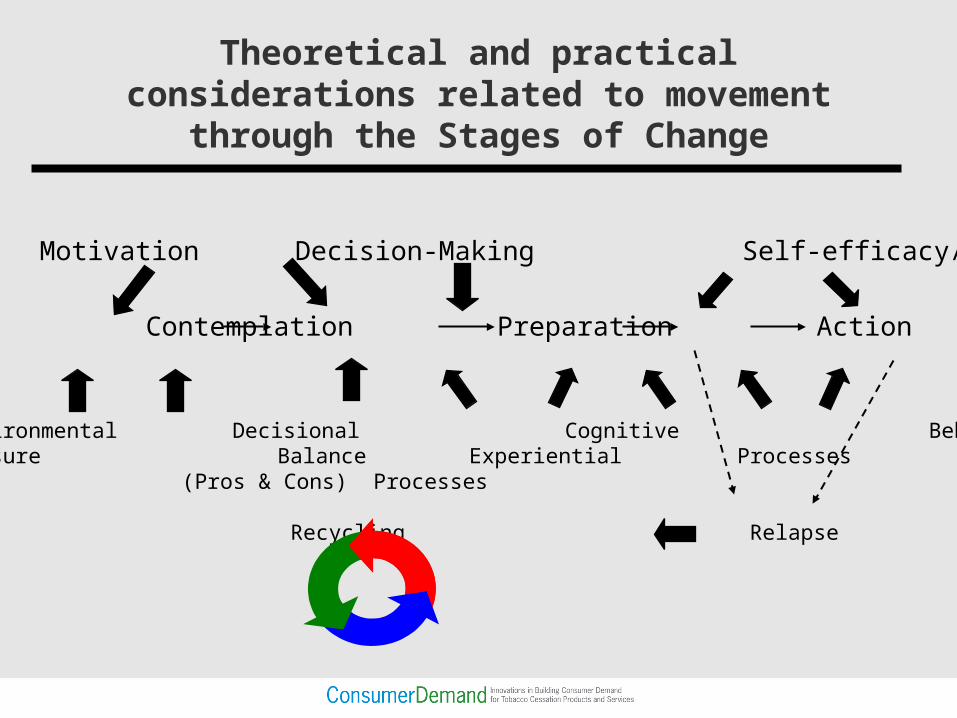
Theoretical and practical considerations related to movement through the
Stages of Change
Motivation Decision-Making Self-efficacy/Temptation
Precontemplation Contemplation Preparation Action Maintenance
Personal Environmental Decisional Cognitive Behavioral Concerns Pressure Balance Experiential Processes
(Pros & Cons) Processes
Recycling Relapse
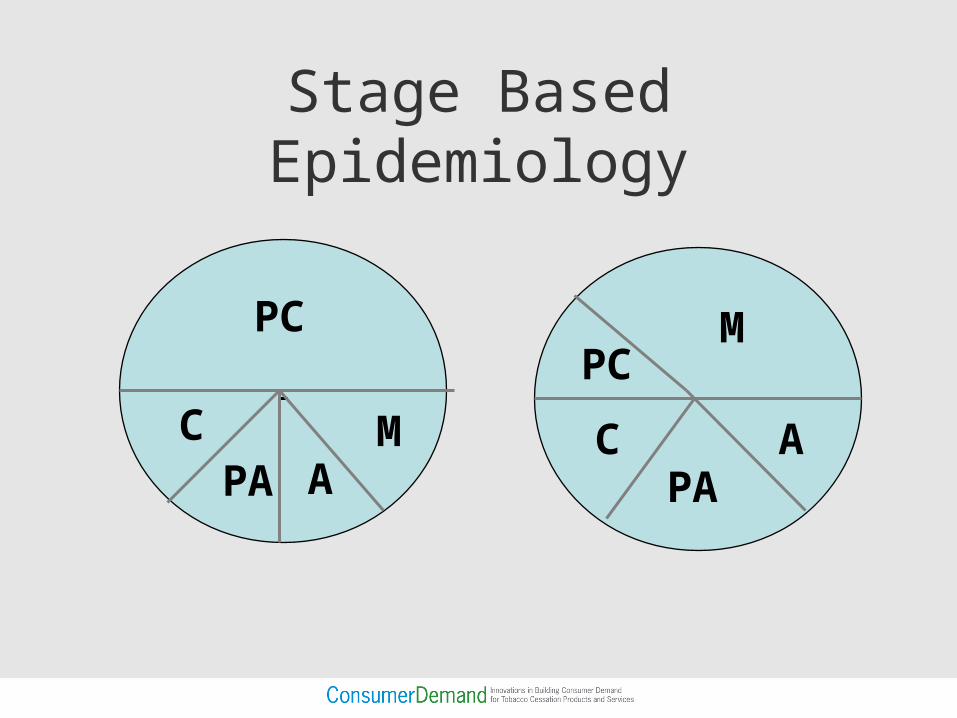
Stage Based Epidemiology
PC
CPA A
M
MPC
CPA
A
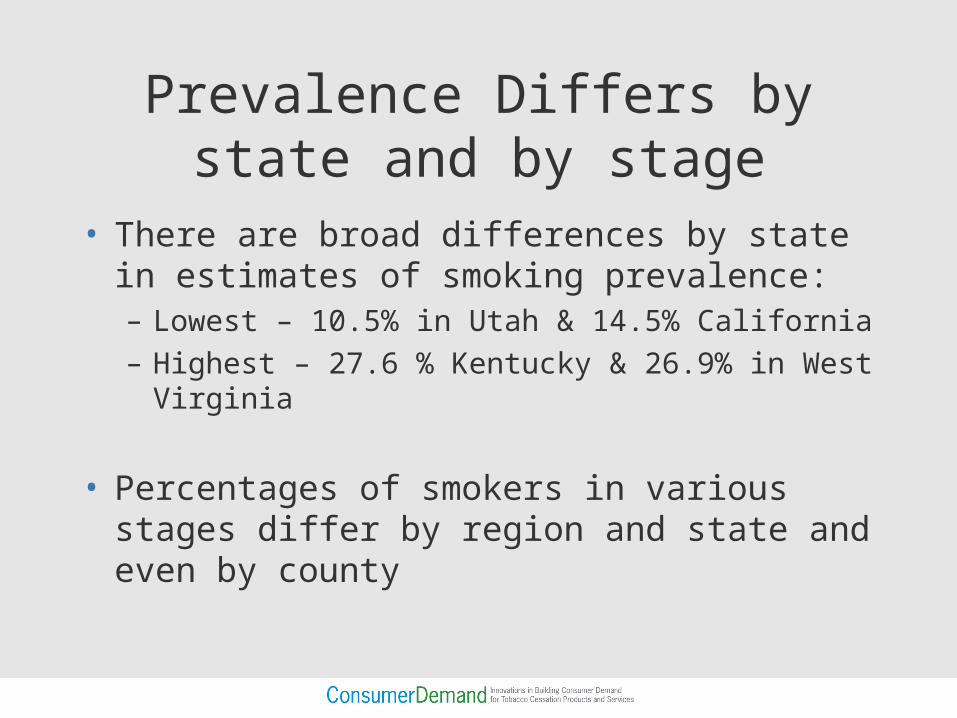
Prevalence Differs by state and by stage
• There are broad differences by state in estimates of smoking prevalence:– Lowest – 10.5% in Utah & 14.5% California– Highest – 27.6 % Kentucky & 26.9% in West
Virginia
• Percentages of smokers in various stages differ by region and state and even by county
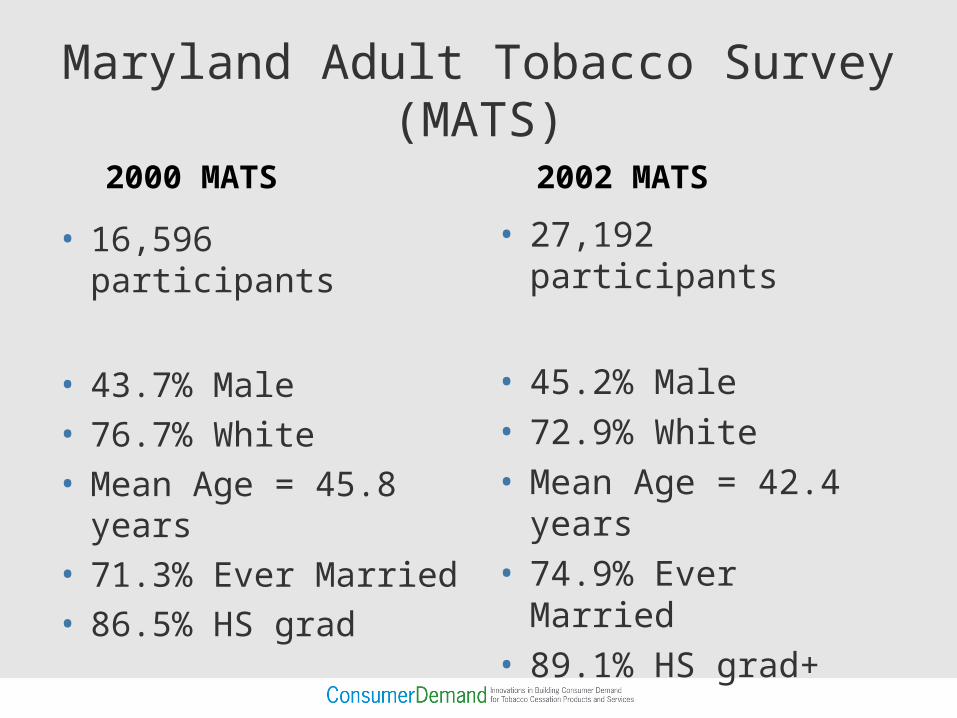
Maryland Adult Tobacco Survey (MATS)
• 16,596 participants
• 43.7% Male• 76.7% White• Mean Age = 45.8
years• 71.3% Ever Married• 86.5% HS grad
• 27,192 participants
• 45.2% Male• 72.9% White• Mean Age = 42.4
years• 74.9% Ever Married• 89.1% HS grad+
2000 MATS 2002 MATS
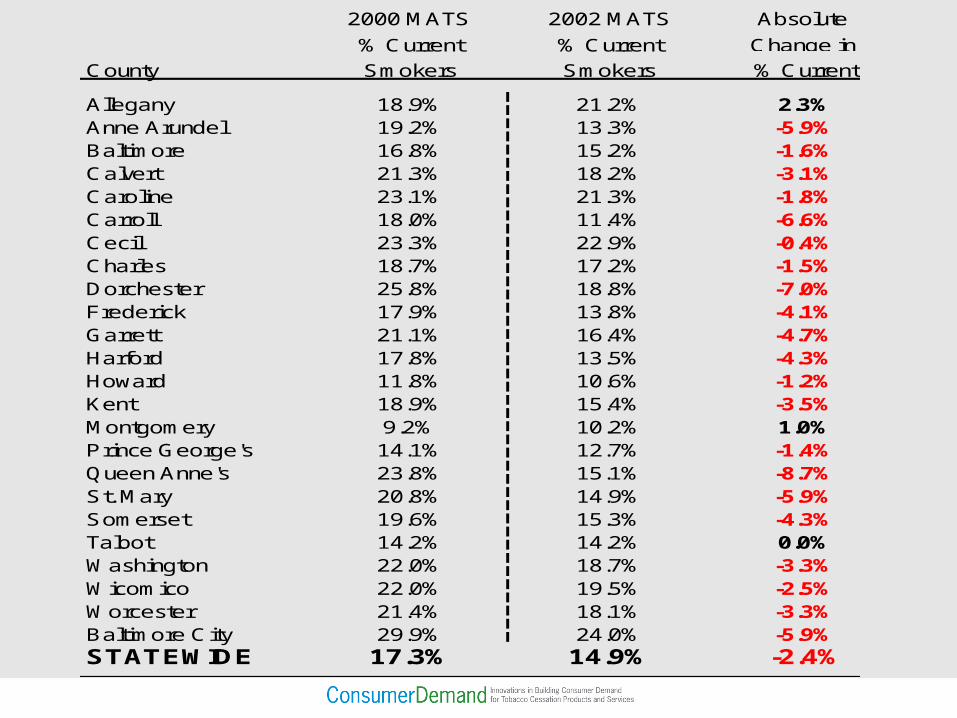
2000 MATS 2002 MATS Absolute
% Current % Current Change in
County Smokers Smokers % Current
Allegany 18.9% 21.2% 2.3%Anne Arundel 19.2% 13.3% -5.9%Baltimore 16.8% 15.2% -1.6%Calvert 21.3% 18.2% -3.1%Caroline 23.1% 21.3% -1.8%Carroll 18.0% 11.4% -6.6%Cecil 23.3% 22.9% -0.4%Charles 18.7% 17.2% -1.5%Dorchester 25.8% 18.8% -7.0%Frederick 17.9% 13.8% -4.1%Garrett 21.1% 16.4% -4.7%Harford 17.8% 13.5% -4.3%Howard 11.8% 10.6% -1.2%Kent 18.9% 15.4% -3.5%Montgomery 9.2% 10.2% 1.0%Prince George's 14.1% 12.7% -1.4%Queen Anne's 23.8% 15.1% -8.7%St. Mary 20.8% 14.9% -5.9%Somerset 19.6% 15.3% -4.3%Talbot 14.2% 14.2% 0.0%Washington 22.0% 18.7% -3.3%Wicomico 22.0% 19.5% -2.5%Worcester 21.4% 18.1% -3.3%Baltimore City 29.9% 24.0% -5.9%STATEWIDE 17.3% 14.9% -2.4%
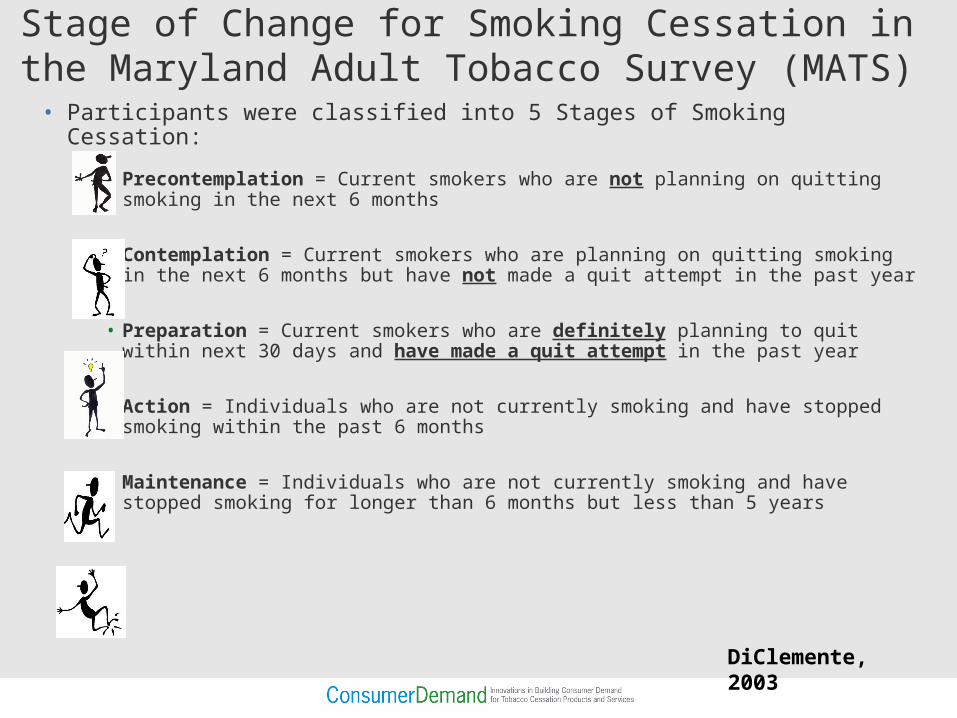
Stage of Change for Smoking Cessation in the Maryland Adult Tobacco Survey (MATS)
• Participants were classified into 5 Stages of Smoking Cessation:
• Precontemplation = Current smokers who are not planning on quitting smoking in the next 6 months
• Contemplation = Current smokers who are planning on quitting smoking in the next 6 months but have not made a quit attempt in the past year
• Preparation = Current smokers who are definitely planning to quit within next 30 days and have made a quit attempt in the past year
• Action = Individuals who are not currently smoking and have stopped smoking within the past 6 months
• Maintenance = Individuals who are not currently smoking and have stopped smoking for longer than 6 months but less than 5 years
DiClemente, 2003
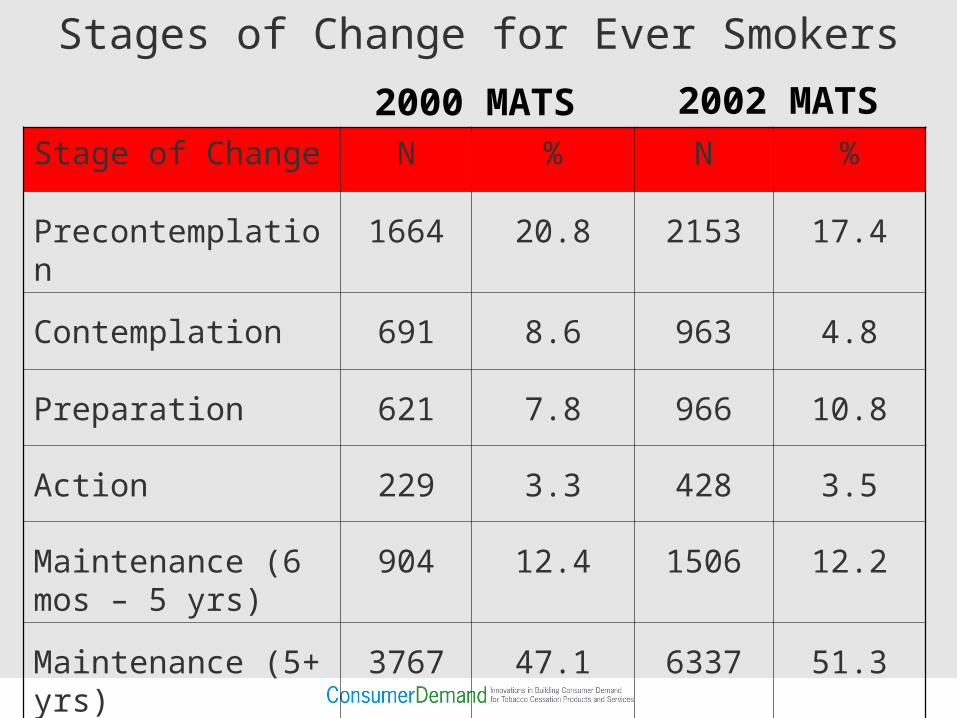
Stages of Change for Ever Smokers
Stage of Change N % N %
Precontemplation 1664 20.8 2153 17.4
Contemplation 691 8.6 963 4.8
Preparation 621 7.8 966 10.8
Action 229 3.3 428 3.5
Maintenance (6 mos – 5 yrs)
904 12.4 1506 12.2
Maintenance (5+ yrs) 3767 47.1 6337 51.3
2000 MATS 2002 MATS
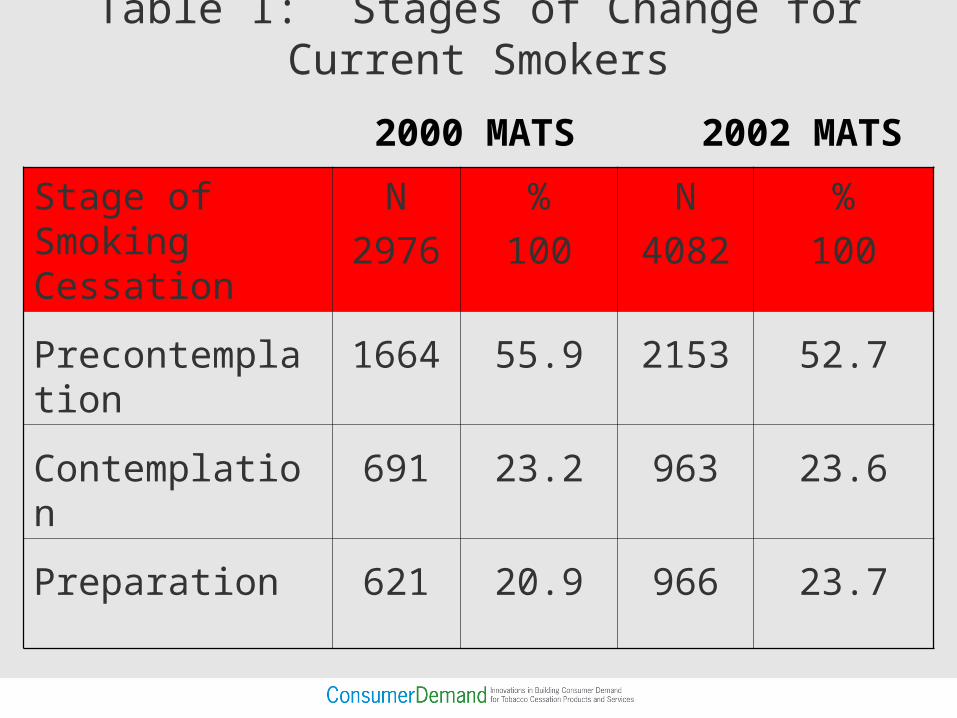
Table 1: Stages of Change for Current Smokers
Stage of Smoking Cessation
N
2976
%
100
N
4082
%
100
Precontemplation 1664 55.9 2153 52.7
Contemplation 691 23.2 963 23.6
Preparation 621 20.9 966 23.7
2000 MATS 2002 MATS
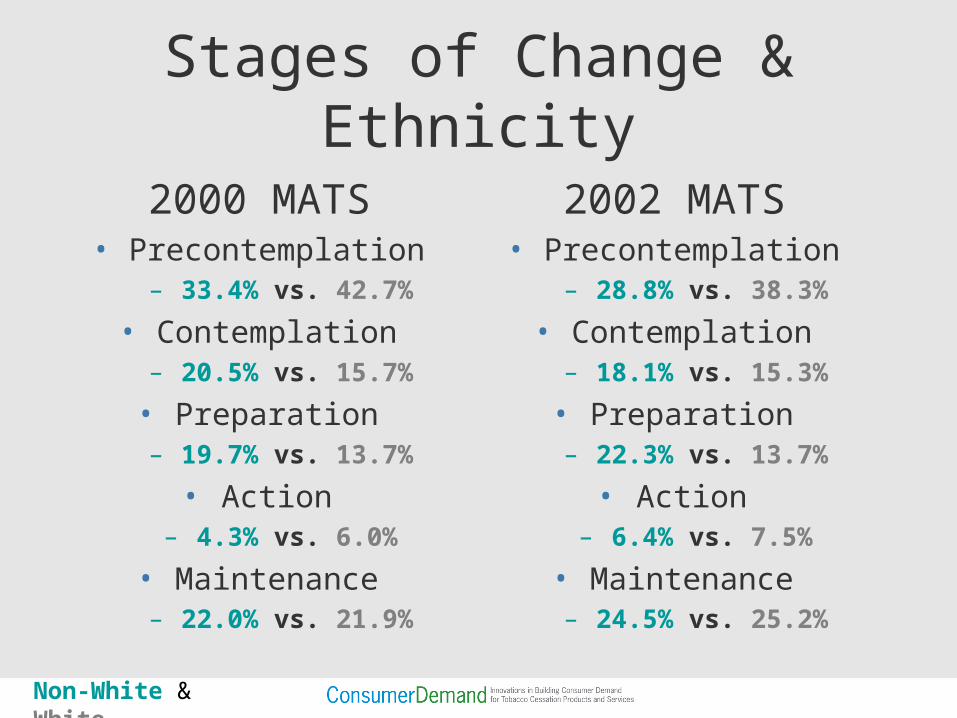
Stages of Change & Ethnicity
2000 MATS• Precontemplation
– 33.4% vs. 42.7%
• Contemplation– 20.5% vs. 15.7%
• Preparation– 19.7% vs. 13.7%
• Action– 4.3% vs. 6.0%
• Maintenance– 22.0% vs. 21.9%
2002 MATS• Precontemplation
– 28.8% vs. 38.3%
• Contemplation– 18.1% vs. 15.3%
• Preparation– 22.3% vs. 13.7%
• Action– 6.4% vs. 7.5%
• Maintenance– 24.5% vs. 25.2%
Non-White & White
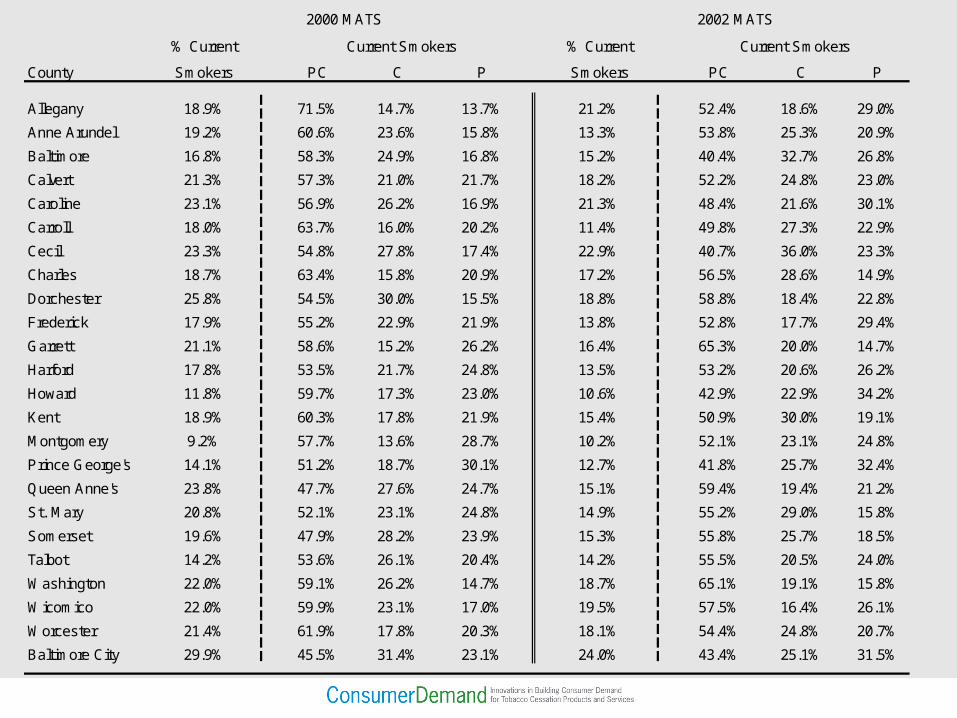
% Current % Current
County Smokers PC C P Smokers PC C P
Allegany 18.9% 71.5% 14.7% 13.7% 21.2% 52.4% 18.6% 29.0%
Anne Arundel 19.2% 60.6% 23.6% 15.8% 13.3% 53.8% 25.3% 20.9%
Baltimore 16.8% 58.3% 24.9% 16.8% 15.2% 40.4% 32.7% 26.8%
Calvert 21.3% 57.3% 21.0% 21.7% 18.2% 52.2% 24.8% 23.0%
Caroline 23.1% 56.9% 26.2% 16.9% 21.3% 48.4% 21.6% 30.1%
Carroll 18.0% 63.7% 16.0% 20.2% 11.4% 49.8% 27.3% 22.9%
Cecil 23.3% 54.8% 27.8% 17.4% 22.9% 40.7% 36.0% 23.3%
Charles 18.7% 63.4% 15.8% 20.9% 17.2% 56.5% 28.6% 14.9%
Dorchester 25.8% 54.5% 30.0% 15.5% 18.8% 58.8% 18.4% 22.8%
Frederick 17.9% 55.2% 22.9% 21.9% 13.8% 52.8% 17.7% 29.4%
Garrett 21.1% 58.6% 15.2% 26.2% 16.4% 65.3% 20.0% 14.7%
Harford 17.8% 53.5% 21.7% 24.8% 13.5% 53.2% 20.6% 26.2%
Howard 11.8% 59.7% 17.3% 23.0% 10.6% 42.9% 22.9% 34.2%
Kent 18.9% 60.3% 17.8% 21.9% 15.4% 50.9% 30.0% 19.1%
Montgomery 9.2% 57.7% 13.6% 28.7% 10.2% 52.1% 23.1% 24.8%
Prince George's 14.1% 51.2% 18.7% 30.1% 12.7% 41.8% 25.7% 32.4%
Queen Anne's 23.8% 47.7% 27.6% 24.7% 15.1% 59.4% 19.4% 21.2%
St. Mary 20.8% 52.1% 23.1% 24.8% 14.9% 55.2% 29.0% 15.8%
Somerset 19.6% 47.9% 28.2% 23.9% 15.3% 55.8% 25.7% 18.5%
Talbot 14.2% 53.6% 26.1% 20.4% 14.2% 55.5% 20.5% 24.0%
Washington 22.0% 59.1% 26.2% 14.7% 18.7% 65.1% 19.1% 15.8%
Wicomico 22.0% 59.9% 23.1% 17.0% 19.5% 57.5% 16.4% 26.1%
Worcester 21.4% 61.9% 17.8% 20.3% 18.1% 54.4% 24.8% 20.7%
Baltimore City 29.9% 45.5% 31.4% 23.1% 24.0% 43.4% 25.1% 31.5%
Current Smokers
2000 MATS 2002 MATS
Current Smokers
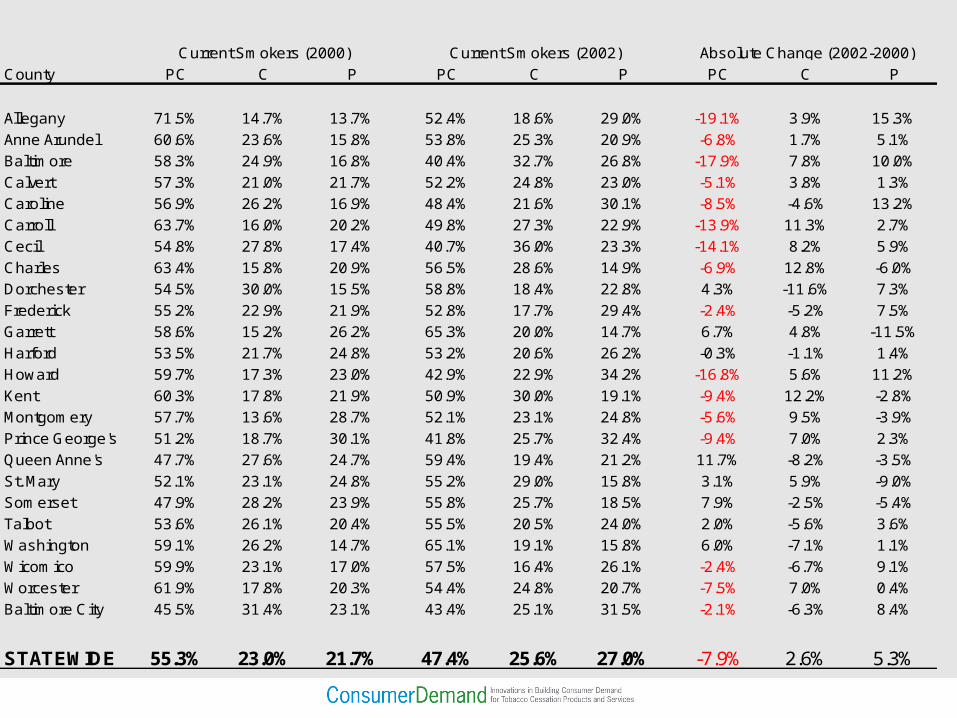
County PC C P PC C P PC C P
Allegany 71.5% 14.7% 13.7% 52.4% 18.6% 29.0% -19.1% 3.9% 15.3%
Anne Arundel 60.6% 23.6% 15.8% 53.8% 25.3% 20.9% -6.8% 1.7% 5.1%
Baltimore 58.3% 24.9% 16.8% 40.4% 32.7% 26.8% -17.9% 7.8% 10.0%
Calvert 57.3% 21.0% 21.7% 52.2% 24.8% 23.0% -5.1% 3.8% 1.3%
Caroline 56.9% 26.2% 16.9% 48.4% 21.6% 30.1% -8.5% -4.6% 13.2%
Carroll 63.7% 16.0% 20.2% 49.8% 27.3% 22.9% -13.9% 11.3% 2.7%
Cecil 54.8% 27.8% 17.4% 40.7% 36.0% 23.3% -14.1% 8.2% 5.9%
Charles 63.4% 15.8% 20.9% 56.5% 28.6% 14.9% -6.9% 12.8% -6.0%
Dorchester 54.5% 30.0% 15.5% 58.8% 18.4% 22.8% 4.3% -11.6% 7.3%
Frederick 55.2% 22.9% 21.9% 52.8% 17.7% 29.4% -2.4% -5.2% 7.5%
Garrett 58.6% 15.2% 26.2% 65.3% 20.0% 14.7% 6.7% 4.8% -11.5%
Harford 53.5% 21.7% 24.8% 53.2% 20.6% 26.2% -0.3% -1.1% 1.4%
Howard 59.7% 17.3% 23.0% 42.9% 22.9% 34.2% -16.8% 5.6% 11.2%
Kent 60.3% 17.8% 21.9% 50.9% 30.0% 19.1% -9.4% 12.2% -2.8%
Montgomery 57.7% 13.6% 28.7% 52.1% 23.1% 24.8% -5.6% 9.5% -3.9%
Prince George's 51.2% 18.7% 30.1% 41.8% 25.7% 32.4% -9.4% 7.0% 2.3%
Queen Anne's 47.7% 27.6% 24.7% 59.4% 19.4% 21.2% 11.7% -8.2% -3.5%
St. Mary 52.1% 23.1% 24.8% 55.2% 29.0% 15.8% 3.1% 5.9% -9.0%
Somerset 47.9% 28.2% 23.9% 55.8% 25.7% 18.5% 7.9% -2.5% -5.4%
Talbot 53.6% 26.1% 20.4% 55.5% 20.5% 24.0% 2.0% -5.6% 3.6%
Washington 59.1% 26.2% 14.7% 65.1% 19.1% 15.8% 6.0% -7.1% 1.1%
Wicomico 59.9% 23.1% 17.0% 57.5% 16.4% 26.1% -2.4% -6.7% 9.1%
Worcester 61.9% 17.8% 20.3% 54.4% 24.8% 20.7% -7.5% 7.0% 0.4%
Baltimore City 45.5% 31.4% 23.1% 43.4% 25.1% 31.5% -2.1% -6.3% 8.4%
STATEWIDE 55.3% 23.0% 21.7% 47.4% 25.6% 27.0% -7.9% 2.6% 5.3%
Current Smokers (2000) Current Smokers (2002) Absolute Change (2002-2000)
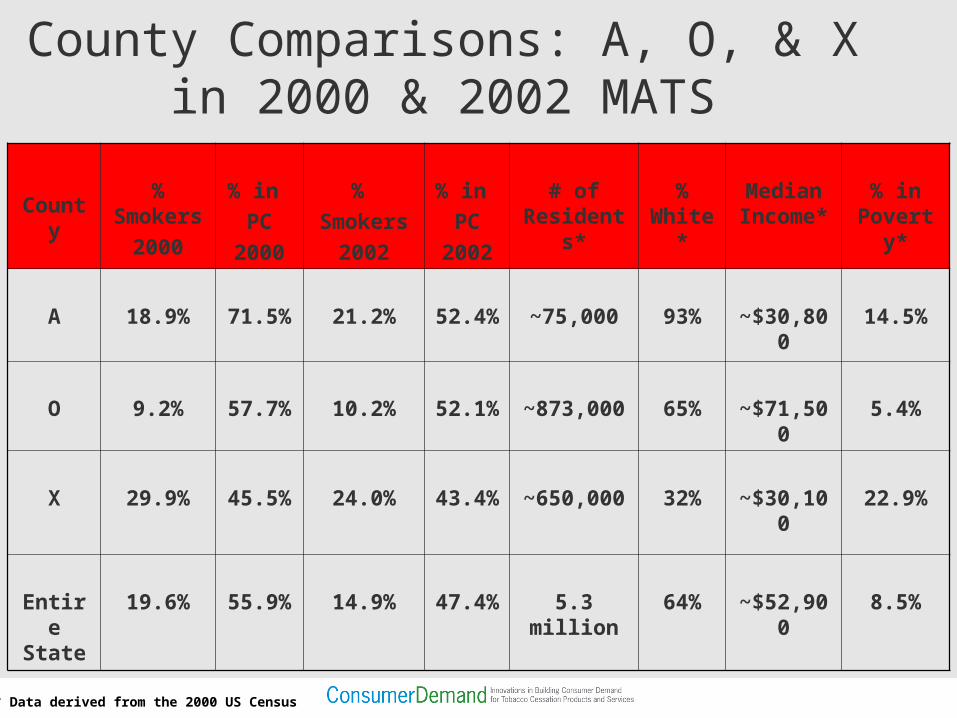
County
% Smoker
s2000
% in PC
2000
% Smoker
s2002
% in PC
2002
# of Resident
s*
% Whit
e*
Median Income
*
% in Povert
y*
A 18.9% 71.5%
21.2% 52.4%
~75,000 93% ~$30,800
14.5%
O 9.2% 57.7%
10.2% 52.1%
~873,000
65% ~$71,500
5.4%
X 29.9% 45.5%
24.0% 43.4%
~650,000
32% ~$30,100
22.9%
Entire State
19.6% 55.9%
14.9% 47.4%
5.3 million
64% ~$52,900
8.5%
County Comparisons: A, O, & X in 2000 & 2002 MATS
* Data derived from the 2000 US Census
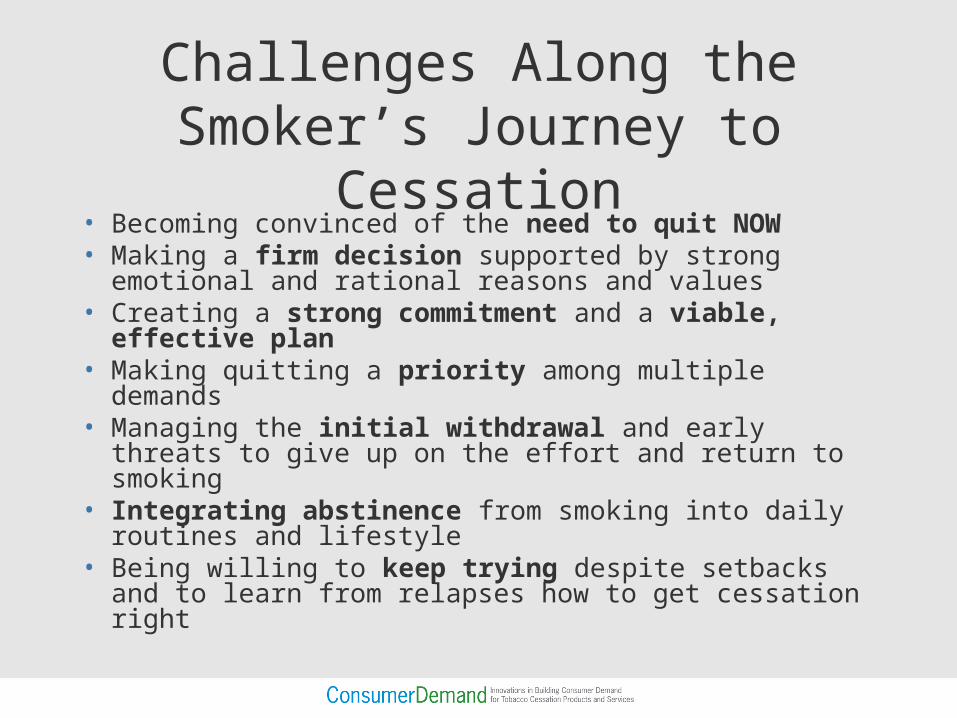
Challenges Along the Smoker’s Journey to
Cessation• Becoming convinced of the need to quit NOW• Making a firm decision supported by strong
emotional and rational reasons and values• Creating a strong commitment and a viable,
effective plan• Making quitting a priority among multiple demands• Managing the initial withdrawal and early threats
to give up on the effort and return to smoking• Integrating abstinence from smoking into daily
routines and lifestyle• Being willing to keep trying despite setbacks and to
learn from relapses how to get cessation right
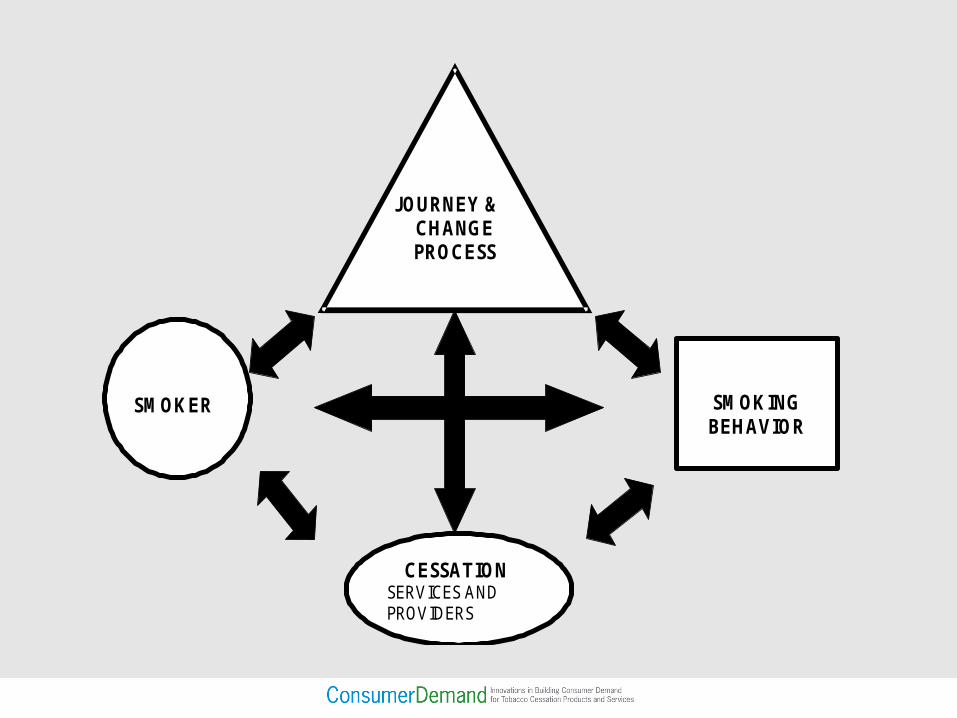
JOURNEY & CHANGE PROCESS JOURNES
SMOKER
CESSATION SERVICES AND PROVIDERS
SMOKING BEHAVIOR