Embed Size (px)
Citation preview

1
THE SMARTPHONE INDUSTRY TOWARDS A DOMINANT DESIGN: AN EMPIRICAL ANALYSIS
Riccardo David Battaglia

2
ESSAY INDEX
ABSTRACT ................................................................................................................................................ 3
REVIEW OF THE LITERATURE ................................................................................................................... 4
i. The idea of a Dominant Design ................................................................................................... 4
ii. How a dominant design arises: The Product Life Cycle Model by Abernathy and Utterback..... 5
The fluid phase or introduction ....................................................................................................... 6
The transitional phase ..................................................................................................................... 7
The Specific Phase or Maturity ........................................................................................................ 8
EMPIRICAL ANALYSIS ............................................................................................................................... 9
A. RESEARCH METHODOLOGY ......................................................................................................... 9
B. DATA DESCRIPTION ................................................................................................................... 10
C. DESCRIPTIVE STATISTICS & HYPOTHESES .................................................................................. 11
D. ANALYSIS OF THE RESULTS ........................................................................................................ 17
CONCLUSIONS ....................................................................................................................................... 19
REFERENCES .......................................................................................................................................... 20
3
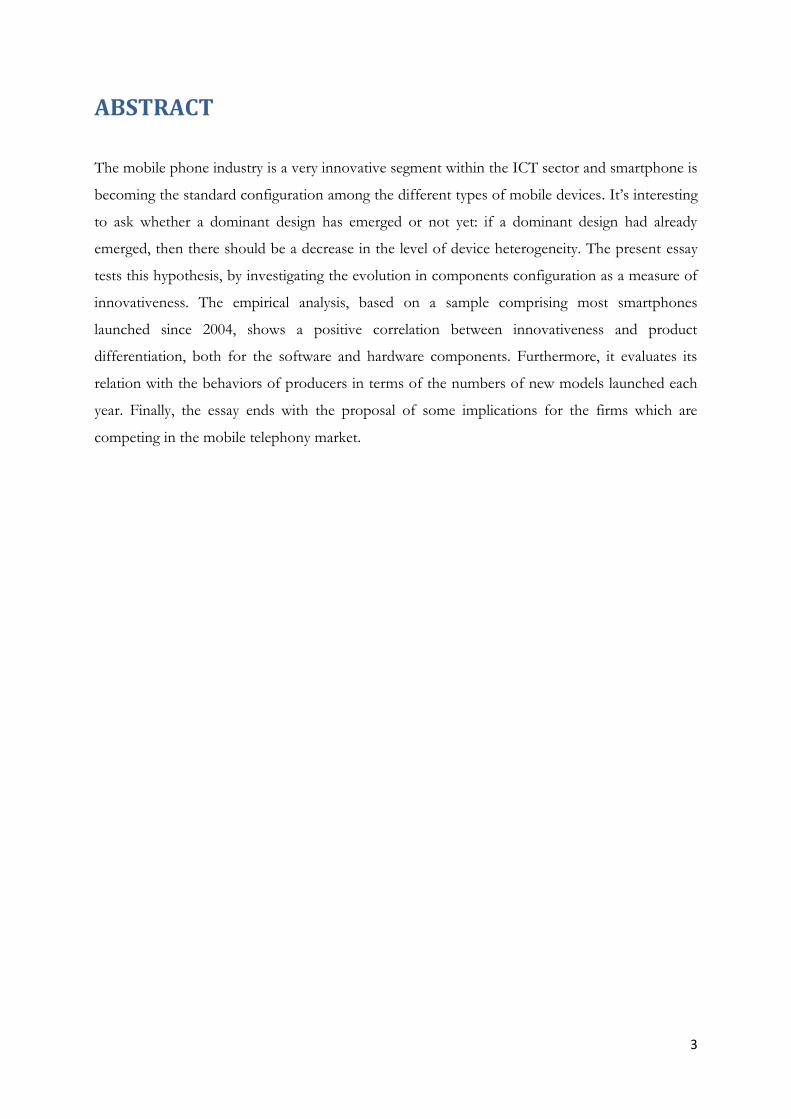
ABSTRACT
The mobile phone industry is a very innovative segment within the ICT sector and smartphone is
becoming the standard configuration among the different types of mobile devices. It’s interesting
to ask whether a dominant design has emerged or not yet: if a dominant design had already
emerged, then there should be a decrease in the level of device heterogeneity. The present essay
tests this hypothesis, by investigating the evolution in components configuration as a measure of
innovativeness. The empirical analysis, based on a sample comprising most smartphones
launched since 2004, shows a positive correlation between innovativeness and product
differentiation, both for the software and hardware components. Furthermore, it evaluates its
relation with the behaviors of producers in terms of the numbers of new models launched each
year. Finally, the essay ends with the proposal of some implications for the firms which are
competing in the mobile telephony market.

4
REVIEW OF THE LITERATURE
The most relevant literature for the analysis is about the concept of dominant design, which is
crucial to understand whether the idea that a standard has already emerged among smartphones
makes sense or not. The work by Abernathy and Utterback will be central for the review, with
the writings by Utterback with Suarez, Srinivasan with Lilien and Rangaswamy and Anderson
with Tushman.
Then, the focus would shift towards the conclusions by Koski and Kretschmer in their paper
‘Innovation and Dominant design in Mobile Telephony’, which represents a solid basis to build
updated considerations, valuating the recent patterns followed by the market as for the adoption
and production choices and strategies.
Figure 1. The technology cycle by Anderson and Tushman.
i. The idea of a Dominant Design
The concept of dominant design is the result of analyses on industrial innovation realized from
the 1970s on. The literature provides several definitions:
Authors Dominant Design Definition
Abernathy and Utterback (1978) A dominant design is a single architecture that
establishes dominance in a product category.
Utterback and Suarez (1993)
A specific path, along an industry's design
hierarchy, which establishes dominance among
competing design paths. A dominant design
usually takes the form of a new product (or set of

5
features) synthesized from individual
technological innovations introduced
independently in prior product variants.
Utterback (1994)
The dominant design is the one that wins the
allegiance of the marketplace; it’s the one that
competitors and innovators must adhere to if they
hope to command significant market following.
A dominant design is a product in a product
category that gains general acceptance as the
standard on technical features that other market
players must follow if they wish to acquire
significant market share.
Christensen, Suaréz, and Utterback (1998)
A dominant design emerges in a product category
when one product’s design specifications
(consisting of a single or a complement of design
features) define the product category’s
architecture.
Srinivasan, Lilien and Rangaswamy (2006)
A particular product’s design architecture as one
that defines the specifications for the entire
product category
ii. How a dominant design arises: The Product Life Cycle Model by
Abernathy and Utterback
Abernathy and Utterback analyzed the innovation dynamics in different industries1., with a
specific focus on the automotive.
Product and process innovation model draws the different evolution in the rates of product and
process innovation over time, anticipating a relationship between the two. They named three
phases in product life: the fluid, the transition and the specific phase.
All the stages show different patterns about some core characteristics of the good (or service),
namely the competitive emphasis, the innovative stimulus, the innovation focus (either on the
1 Abernathy and Utterback’s model well synthesizes all the literature descriptions of the product and
innovation life cycle, that is why I choose to go deep into it.

6
product or on the process), the product line, the equipment adopted in production, the material
chosen to produce, the dimensions of plants and, finally, the organization control.
The fluid phase or introduction
The competitive emphasis is on the functional aspects of the product; companies struggle to
increase their market share focusing on technical improvements, new features and any possible
attempt to make their good or service the best according to consumers’ perceptions. Such a
competition involves several actors (i.e. firms and producers), the number of which is the highest
at this stage.
What stimulates innovation is the set of information about potential customers and their needs.
Creativity must be very high, as well as the tendency to explore new solutions and to experiment
recent R&D findings, both on design and feature sides.
Product innovation intensity is higher, it’s the period in which a new product concept is
announced and launched into the market. In these stages, which for sure don’t have a specific
time length (this depends on the specific features of the product as well as on a series of other
considerations which regard the level of complexity, the number of competitors and the
acceptance by the market of such a new device), process innovation in either quite low or even
absent vice versa, because most resources are invested, and sometimes wasted, in product
innovation.
The industry is characterized by very different designs: heterogeneity in the offer is presumably
the highest, and this is reflected into non homogeneous prices because firms try to monetize as
much as possible their efforts to provide users with solutions unavailable on competitors’
technology.
Production process has to be very flexible to be adapted and quickly modified according to the
evidence from consumers’ reaction to producers’ offer. That explains the high inefficiency related
to the whole production system. It’s clear how the equipment cannot but be generalist, as well as
the material (which implies the necessity to have different suppliers, initially renouncing to
strategic supplies and agreements between the parts); plants show very small dimensions, and the
volume of production is kept low.
Finally, talking about organizational control, we can interpret the organization, or better the
business unit, as a startup inside the company: everything is pretty new, it has to be discovered
being aware that mistakes are very common, and accept the situation setting up an informal

7
control to help the system remain flexible enough to react to unexpected events and to solve
them quickly and as well as possible.
The transitional phase
The transitional phase shifts competitive emphasis on product variety. The innovation stimulus is
given by opportunities from the expansion of internal innovative and productive capabilities.
Such a configuration physiologically decreases firms number over time, because only best
performers, and overall big incumbents (thanks to their dimensions), are able to survive the harsh
competition that characterizes transitional phase. Obviously, variety runs down, and the rivalry
on producers side shifts towards price competition in the mass market (whilst some companies,
generally speaking the smaller ones which can’t serve a huge demand, prefer to focus on market
niches according to their peculiar talents and capabilities). As a matter of fact, the industry
becomes much more concentrated; firms which perform worse are pushed out of the market by
top ones.
When the trial and error approach is over (i.e. when product innovation slows down, due to the
fact that specific features of the product were recognized and assumed to be the preferred ones
according to innovators and early adopters’2 behavior and, as a consequence, diffusely imitated by
all producers), process innovation takes the lead over product innovation. At this point, usually at
least a widely accepted product line is entitled to become the dominant design in the market,
according to consumers’ acceptance of its design and most relevant features: it would be the
configuration primarily imitated and improved by competitors. Companies must increase their
margins at their best; this means they have to reduce wastes and to make their processes more
efficient. In terms of equipment, this turns into an higher automation of most production
processes whilst, at the same time, it requires more specialized raw materials and semi-finished
products, involved in a transformation process managed through bigger plants, if compared to
the ones of the initial phase. Organizational control grows towards higher formalization, even if
it’s not structural yet.
2 Henderson, R. and Clark, K. 1990. Architectural innovation: The reconfiguration of existing product
technologies and the failure of established firms. Administrative Science Quarterly, 35: 9-30.

8
It’s at this stage that process innovation overcomes product ones and, ideally as it’s shown in
figure 3, in Abernathy and Utterback’s perspective3 the emergence of a dominant design occurs
exactly in that very moment.
The Specific Phase or Maturity
The last stage of industry evolution is its Maturity, also known as specific phase in Abernathy and
Utterback’s words.
What allows a firm to beat the others is the price, that is the real competitive ground for
organizations to win and keep their economic results positive.
The market is incredibly concentrated, very few actors from the producers side are able to
leverage the economies of scale to keep the margin significant and positive: that is the reason why
those competitors are very big and produce huge volumes of goods (or services).
Any of this means that competitive emphasis is given to cost reduction, which is also the only
push towards innovation.
The predominant form of innovation is incremental, on both product and process sides, with a
slight preference for process one, because it’s easy to employ it as a mean to reduce costs.
The devices are almost the same; they are standardized and very little differences exist among
competitors’ versions of the product and, most importantly, these elements don’t add significant
value to the demand: differences are no longer a source of competitive advantage, if present.
Consumers are almost indifferent to the product per se; homogeneity is extreme.
The production process becomes very efficient and rigid, it’s as standardized as its output are.
Then, equipment is a specialized one, as well as the materials involved in the production.
Economies of scale and of scope are crucial for cost reduction. This requires companies to have
a very huge production capacity, and to glut it as much as possible to avoid wastes of any kind.
Finally, organizational control is structural, in the sense that the company have developed best
practices to apply when a problem occurs: this implies that the firm has already experienced the
same problems or equivalent and similar ones, from which to derive the most correct answer.
3 Authors never specify a precise moment of dominant design emergence. It’s not fixed and it depends on the
industry and product specific features. Anyway, to simplify the analysis, we accepted that emergence coincides
with the point in which product and process innovation lines coincide.
9
EMPIRICAL ANALYSIS
A. RESEARCH METHODOLOGY
To assess whether the smartphone industry is going towards a single dominant design, (or also
even if a dominant design has already materialized), or not, it will be fundamental to separate the
analyses between hardware and software innovation, since producers’ behavior in these two
opposite respects is significantly different, as well as the forecast output.
At the very beginning, there will be an overview of the market as it was when Apple disruption
came along in 2007, in order to see the passage from traditional mobile phones “S-Curve”, to the
smartphone one; there will be an evaluation supported by Henderson and Clark’s Model to fully
identify which type of innovation the market was dealing with, integrated by a few considerations
about customers based on Rogers’ curve.
Then, the focus will mainly shift towards market trends to establish where the industry is in this
very moment of its evolution, according to the traditional product life cycle drawn by Abernathy
and Utterback in 1978.
The result will be a set of theoretical considerations about what we should expect to happen to
the industry (i.e. the theoretical bases for answering the research question).
Then, I will perform an empirical analysis to verify theoretical expectations. I will use a
comprehensive dataset comprising information on mobile phone handsets introduced globally
between January 2004 and August 2012 to document the evolution on both the hardware and the
software sides, in order to verify empirically the initial hypotheses of absence of upcoming
dominant design at the hardware level on the one hand, and the presence of a tripoly at the
software level, on the other.
The results should help me driving the attention on the strategic implication for producers, both
regarding hardware and software sides, and which characteristics will be mainly looked for by
consumers during their future purchase decisions.

10
B. DATA DESCRIPTION
My analysis is based on a dataset created gathering all information from specialized websites
which are leaders in the mobile phones reviewing4, integrated with producers’ website and few
data directly given by some firms.
The initial dataset comprises 1309 smartphones produced between the beginning of January 2004
and the end of August 20125. Actually, this amount of observations had to be refined, because
the smartphone identification algorithm of the reference website, www.gsmarena.com6, considers
an all - comprehensive definition of smart devices (i.e. some feature phones are automatically
‘upgraded’ to the smartphone status by gsmarena.com). As anticipated at the very beginning of
the essay, such a description is not strict enough, and it would force to evaluate many products
which are more similar to feature phones, in the end. In this sense, the data was reduced
according to few guidelines, namely a conditioned7 presence of an Operative System, a Wi-Fi
system and the possibility to send and receive emails.
The dataset was built on a global-level basis: I had considered only players which serve different
markets worldwide, not simply niches, with a considerable capacity to attract consumers (i.e.
phone makers able to generate sales and profits that were significant for the analyses)8. The
sample comprised 60 companies, but only 55 were reckoned coherent with the above premise. I
took into the dataset complete pieces of information about several and heterogeneous variables.
Then, I split these characteristics into three subgroups:
- Hardware Features,
- Software Components,
- Other Relevant Elements.
4 Gsmarena.com has been the main source of data, then there were telefonino.net, phonearena.com,
amazon.com, ebay.com and few less relevant others.
5 Smartphones produced later on in the last months are not object of the current analysis.
6 This website was chosen in line with the analysis by Koski and Kretschmer (2007). Then, the missing values
were filled, whenever it was possible, taking the information required from producers’ website or in the other
websites listed in note 7.
7 Not necessarily required to show all these features.
8 A worldwide level player is assumed to be either a producer who offers its devices in several countries or a
player who sells in few countries (also in only one region, if this is a huge market: consider, for instance, the
case in which a player covers only the Indian market, like Celkon Mobiles does).

11
It would be neither possible nor useful to take all of them into account. The most important
hardware features in a today smart device depend on the SIM (type, number), connectivity (2G,
3G and 4G Networks, WLAN, DLNA, Infrared Port, Bluetooth, NFC), on the chipset, on the
CPU, on the GPU, on the sensors (i.e. Accelerometer, Proximity, Gyroscope), on the body
specifics (Length, Height, Width and Weight), on the writing solution tools (Keyboard versus
Touchscreen), on the display peculiarities (Display Type, Pixels, Inches), on the protection
systems, on the sound systems (MP3 Reader, Loudspeakers), on the memories (Card Slot Type,
Included Memory and External ones), on the USB port, on the cameras (primary and secondary
photo cameras, video camera), GPS system, battery, and radio.
Talking about the software components, a today smartphone must have a browser, messaging
solutions (SMS and MMS are compulsory, threaded view, Predictive Text Input, Email, Push
Email and Instant Messaging are becoming order qualifiers as well), an advanced9 operative
system, screen ‘multitouchability’ and JAVA system. The other relevant elements considered are
the market timing (entry, exit) and price (price group, last know price)10.
C. DESCRIPTIVE STATISTICS & HYPOTHESES
To test the initial hypotheses about dominant design occurrence, I have used the innovation
model developed by N. Corrocher and M. Guerzoni (2012) in their study about innovativeness in
ski industry, but shifting the core aspects of their indicator to adapt them to the different product
and, for sure, to the different data available, though retaining the approach adopted to select
regressors and to create my model.
The basic idea my reasoning is built on is that, if a dominant design occurs, then different
elements of the good (in the present case, the smartphone), are becoming themselves dominant
design or, better, they are now affirming themselves as real standard components per se.
A smartphone must own these six features:
9 The dataset was created excluding those OS which were poor in terms of contents and performance, like all
the Microsoft ones before the 5.0 release or Symbian before the 5th
edition of S60.
10 Market share was not available for every single model and for every year. The qualitative considerations
about market shares are reported above throughout the industry analysis, but such an amount of missing
values has suggest not to consider it for the analyses.

12
- A Wireless Local Area Network (represented by the variable Wi-Fi), evaluated as
a fundamental vehicle for connectivity. From the preliminary tests, it was easy to
see its high adoption by all the producers (88.38% of the sample owns a WLAN
system). It has been used a dummy called d_wifi for the calculi to be useful
information, which assumes values equal to 1, if the smartphone holds it, equals
to 0 otherwise.
- To stay connected also means that users want to enjoy the online capabilities of
their devices when they are far from any LAN apparatus they have got access to.
This is the reason why producers are continuously embedding global system
networks (i.e. 2G, 3G and 4G networks); the variable chosen as a proxy of
innovativeness in this regard was 3G network, because all the smartphones of the
sample have a 2G network (which would make no sense for the analysis in terms
of significance). As a matter of fact, 4G network is rising its importance and scale
(from no models with a 4G network in 2010, to 21 out of 310 in 2011, to 24,71%
in the first half of 2012), and it’s extremely likely that it would become a standard
as well, but unfortunately the present sample shows too few 4G models to
provide significance (5,81% of the total devices considered).
- A smartphone has to be user-friendly. It must react quickly to the inputs given by
his owner. Nowadays, most smartphones are designed with a touchscreen
(65.24% of the sample, 91.98% of 2012 devices); fewer and fewer are keeping
only keyboards (only 10.46% of the overall sample and only 1.42% of the 2012
devices considered, i.e. just 3 models), whilst there is a slowly growth of the
hybrid solutions (products with both a keyboard and a touchscreen). So, the ease
to use has been proxied through the multitouch variable. 61.04% of the models
embed multitouch technologies. This variable is a dummy (i.e. it assumes values
equal to 1, if such a technology is available, 0 otherwise).
- A Smartphone is a little pocket-hardware. It must be possible to connect it with a
personal computer or other bigger hardware sets to transfer files. The variable
choosen to analyze this aspect is USB_type; it doesn’t simply say if a USB port is
present or not, but also reports USB port type (i.e. miniUSB or microUSB port).
13
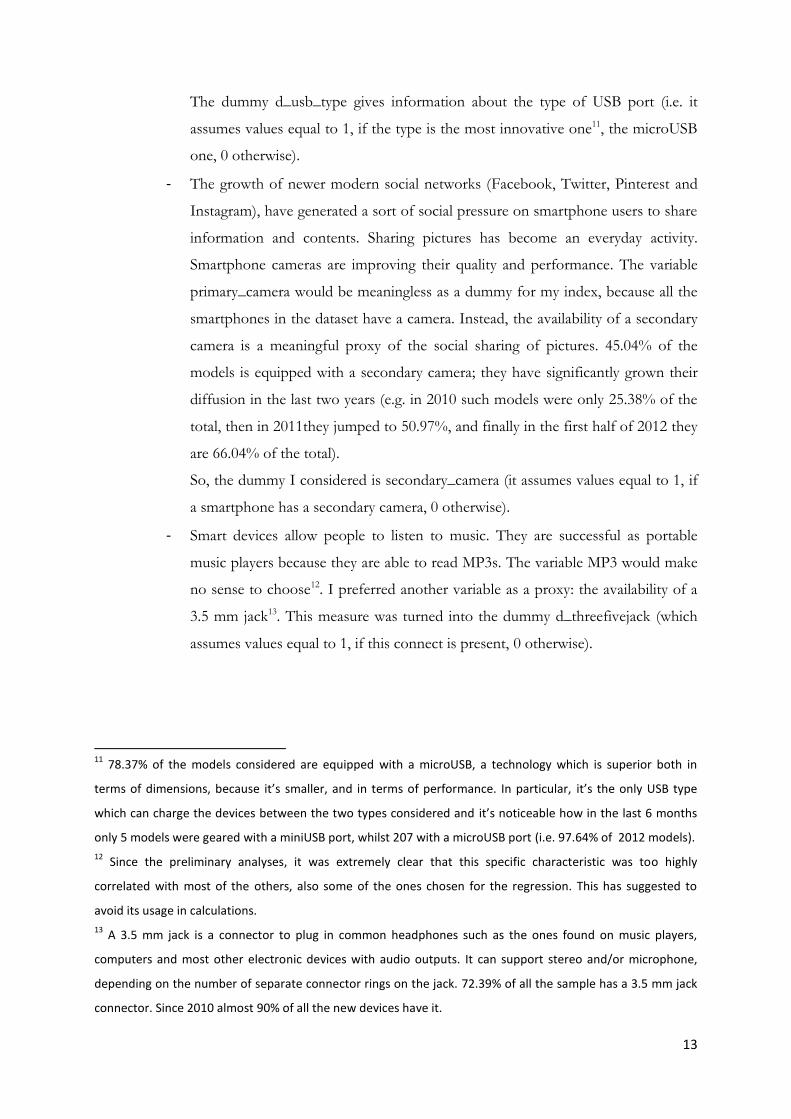
The dummy d_usb_type gives information about the type of USB port (i.e. it
assumes values equal to 1, if the type is the most innovative one11, the microUSB
one, 0 otherwise).
- The growth of newer modern social networks (Facebook, Twitter, Pinterest and
Instagram), have generated a sort of social pressure on smartphone users to share
information and contents. Sharing pictures has become an everyday activity.
Smartphone cameras are improving their quality and performance. The variable
primary_camera would be meaningless as a dummy for my index, because all the
smartphones in the dataset have a camera. Instead, the availability of a secondary
camera is a meaningful proxy of the social sharing of pictures. 45.04% of the
models is equipped with a secondary camera; they have significantly grown their
diffusion in the last two years (e.g. in 2010 such models were only 25.38% of the
total, then in 2011they jumped to 50.97%, and finally in the first half of 2012 they
are 66.04% of the total).
So, the dummy I considered is secondary_camera (it assumes values equal to 1, if
a smartphone has a secondary camera, 0 otherwise).
- Smart devices allow people to listen to music. They are successful as portable
music players because they are able to read MP3s. The variable MP3 would make
no sense to choose12. I preferred another variable as a proxy: the availability of a
3.5 mm jack13. This measure was turned into the dummy d_threefivejack (which
assumes values equal to 1, if this connect is present, 0 otherwise).
11
78.37% of the models considered are equipped with a microUSB, a technology which is superior both in
terms of dimensions, because it’s smaller, and in terms of performance. In particular, it’s the only USB type
which can charge the devices between the two types considered and it’s noticeable how in the last 6 months
only 5 models were geared with a miniUSB port, whilst 207 with a microUSB port (i.e. 97.64% of 2012 models).
12 Since the preliminary analyses, it was extremely clear that this specific characteristic was too highly
correlated with most of the others, also some of the ones chosen for the regression. This has suggested to
avoid its usage in calculations.
13 A 3.5 mm jack is a connector to plug in common headphones such as the ones found on music players,
computers and most other electronic devices with audio outputs. It can support stereo and/or microphone,
depending on the number of separate connector rings on the jack. 72.39% of all the sample has a 3.5 mm jack
connector. Since 2010 almost 90% of all the new devices have it.

14
All these 6 variables can assume a value either equal to 1 or 0. According to these features, and
considering the whole dataset, there will be 7 possible smartphone categories: there are
smartphones with none of the characteristics (that are grouped under the name of FEATURE0),
with only one of the features (FEATURE1), with two characteristics (FEATURE2), with three of
the selected variables (FEATURE3), with four of them (FEATURE4), with five of the mentioned
features (FEATURE5), and also smartphones with all these elements (FEATURE6).These groups
were sub-grouped according to the years, to evaluate the different behaviors of producers.
The innovativeness (i.e. the degree of heterogeneity of a smartphone model from another one)
was calculated as follows:
represents the dependent variable for the present analysis. I chose three explanatory
variables as regressors.
I have considered the number of new models launched into the market every year by producers,
generating the variable XYM (i.e. per year model), a variable to analyze the trends at the software
level (i.e. the tendency of software components to heterogeneity, named SOFTWARE
DOMINANCE, or S_DOM), and a variable to show the tendency towards a dominant design at
the hardware level (i.e. the HARDWARE DOMINANCE, called H_DOM).
I took XYM as a measure of innovativeness, in the sense that if innovation was still going up
significantly, we expected firms to try and launch several models per year, in order to test
customers’ reactions towards different versions. If such a scenario were the right one, we should
wait for a positive correlation between and XYM. However, has been built as
the opposite of homogeneity. So, if it stands the initial reasoning (according to which the product
innovativeness of the industry is reaching its natural peak), then firms should be now launching
less differentiated models to pursuit the standards in the different parts of an handset, and this
would result into a slightly negative correlation between the dependent variable and XYM,
because of more focused strategies by producers (H1).
SOFTWARE DOMINANCE. This variable has been created to test the innovativeness at the
software level. According to data, we notice how most players have decided to adopt different
OS, provided by always fewer producers. Basically, this means that they are converging towards

15
some specific OS type. These are three: Android, iOS and Windows Phone OS. In this very case,
the reason behind their behaviors relies upon the fact that these OS types are the most advanced
ones, assuming a technologic perspective. It’s reasonable to affirm that the most up-to-date
smartphone producers choose the most technologically advanced OS.
To understand the behavior of the producers at the software level, I decided to calculate an
average normalized Herfindahl – Hirschmann index (HHsoftware) for each year, which is supposed
to provide useful information about the tendencies and the evolution in the adoption of more
innovative OS. As a consequence, S_DOM = 1−HHsoftware was considered as an indicator of
company heterogeneity of choice at the software level. This leads to the second hypothesis (H2),
according to which we expect a slightly positive correlation between and S_DOM,
because there is still a scattered competition of the industry whilst some big producers (i.e. HTC,
SAMSUNG, LG), are choosing between the two most technically valid alternatives in OS, but
iOS (namely Android and Windows Phone OS).
The third regressor is the so-called HARDWARE DOMINANCE variable. H_DOM has been
built to provide information about the behaviors of smart devices producers at the hardware
level. As anticipated, there are several interesting components I could select for this variable. A
few considerations based both on firms choices and, in particular, customers’ purchase
preferences have driven my attentions towards five hardware pieces of information:
- Keyboard type (toukey). A smartphone can present three different solutions as
for the keyboard. The first is the traditional one, also known as physical keyboard,
based on keys (independently on the type; either QWERTY configuration or T9).
The second one is the more innovative touchscreen keyboard (also called as
virtual keyboard. Finally, there is a combination of the first two (usually the virtual
keyboard is QWERTY-based). Toukey is a dummy which can assume three
different values; it can be equal to 1 (if the smartphone has a T9 keyboard), or it’s
equal to 2 (if the device has a touchscreen), and also to 3 (if the phone has both a
T9 keyboard and a touchscreen).
- Battery standby time (standby). The quality of the battery is a fundamental feature
of a smartphone. Such a device can provide every kind of service, can run all the
possible apps, but it’s necessary that the device lasts long. The variable standby
was turned into the dummy p_standby (this variable assumes values equal to 1, if
standby time is no higher than 220 minutes, equal to 2, if standby is higher than
220 minutes but no higher than 430 minutes, equal to 3, if standby is higher than

16
430 minutes but less than 550 minutes, and equal to 4, if standby time is at least
550 minutes. This groups were created in accordance to the quantile distribution).
- Phone width (width). In order to perform most functions of a personal computer,
a smartphone is supposed to own a discretely big screen (in particular if it has a
touchscreen system). This is the reason why I considered width as a proxy for
phones dimensions. The variable width was turned into the dummy p_width
(assumes values equal to 1, if width is no more than 11.5 centimeters, equal to 2,
if width is wider than 11.5 cm but no more than 15 cm, equal to 3, if width is
wider than 15 cm but less than 18 cm, and equal to 4, if width is at least 18.1 cm).
- Phone weight (weight). A phone is not smart unless it’s comfortable. It can’t be
heavy. The variable weight was turned into the dummy p_weight (the lighter, the
better. It assumes values equal to 4, if weight is no heavier than 113 grams, equal
to 3, if weight is higher than 113 grams but no heavier than 144 grams, equal to 2,
if weight is heavier than 144 grams but less than 165 grams, and equal to 1, if
weight is at least 165 grams).
- Internal memory gigabytes (included_slot_gb). Smartphones must store much
data. The variable included_slot_gb was dummied into the p_included_slot (it
assumes values equal to 1, if GB included are no more than 2, equal to 2, if GB
included are more than 2 but no more than 8, equal to 3, if GB included are more
than 8 cm but less than 32, and equal to 4, if GB included are at least 32).
HARDWARE DOMINANCE. This variable has been created to test the innovativeness at the
hardware Most players have decided to increasingly adopt the same innovative features; they are
agreeing about the superiority of some specific characteristics, that are becoming order-qualifiers.
The analysis has firstly gone deeper into the behaviors of the single companies compared to their
evolution every year, and later on the different behaviors of the firms as a whole, always
considering their evolution form an year to another.
The reason why I did such a consideration is that I wanted and considered crucial to evaluate the
internal coherence of each producer and, only afterwards, the homogeneity of enterprises with
one another. In order to do this, it was useful to calculate a doubled average normalized
Herfindahl - Hirschmann index (HHhardware).

17
As a consequence, H_DOM = 1−HHhardware was considered as an indicator of company
heterogeneity of choice at the hardware level (firstly this index gives information about single
firms innovativeness at the hardware level, secondly of firms one another).
This leads to the third hypothesis (H3), according to which we expect a significantly positive
correlation between and H_DOM, because the most innovative companies are producing
newer smartphones with the selected and above mentioned order qualifying characteristics. In the
end, it would be used a control variable, more precisely the price one (euros), better it would be
considered its logarithm ln_euros.
D. ANALYSIS OF THE RESULTS
The objective of the analysis was to empirically verify the three theoretical hypotheses. For this
reason, I decided to run the following OLS regression:
,
Where is represented by XYM, is S_DOM, and is H_DOM. The following table (table
7), represents the results of the regression. The dependent variable is :
Dependent variable: INNOVATIVENESS (INNOφ)
OLS model
PER YEAR MODEL (XYM) -.0001652***
(-0.0000179)
SOFTWARE DOMINANCE (S_DOM) .0210041***
(-0.002246)
HARDWARE DOMINANCE (H_DOM) 1.301851***
(-0.1151543)
LN_EUROS .0021367***
(-0.0005768)
FIRM DUMMY VARIABLES YES
R-squared 0.782
Observations 1029
Significance level: * p<0.10, ** p<0.05, *** p<0.01

18
Table 7. Linear Regression.
The empirical evidence supports theoretical hypotheses. Firstly, as expected there is a negative
correlation between XYM and . Such a negative correlation doesn’t simply confirm that
industry is reaching its product innovativeness peak as stated above, but also that specifically big
producers are focusing their strategies on fewer attempts and on fewer and more similar products
(even though more innovative because they employ highly innovative features, as for the
construction of ), whilst there is a considerable contribution by the smaller producers
towards heterogeneity.
Hypotheses at the software level (H2), and at the hardware level (H3) also are confirmed by the
regression. On the software side I expected a positive correlation between S_DOM and
because firms haven’t chosen a single operative system to completely trust yet, and they are still
innovative in some models, adopting OS from different OS-producers as the most important
means of innovation. This correlation can’t be higher, due to the enormous amount of models
powered by Android that are part of the dataset, but it enforces the initial idea that there is still
room for innovation at the software level and that there is no dominant design yet.
On the hardware side, I supposed a positive correlation between H_DOM and , due to
the fact that most features employed to build the regressor for the hardware are the most recent
and up-to-date ones, so they were not available for most devices launched at the beginning of the
temporal horizon considered while gathering data about the smart devices. The results support
the hypothesis beyond HARDWARE DOMINANCE (H3); the resulting correlation is
considerably high. Also in this very case the initial idea is that not even the hardware side has
reached a dominant configuration yet.
If we considered a reduced time horizon, taking into account only the latest years, the results
would show a significantly lower correlation (nearer 0, but still positive), between H_DOM and
, and this enforces the belief according to which smartphones are adopting order-
qualifying hardware components which I supposed to be the most valuable for both the demand
and the offer.
To verify the consistency and robustness of the model, I checked the effect of price (represented
by the variable ln_euros), that has a positive correlation. This was expectable and not strange at
all, because innovativeness costs, which means that, until the emergence of the dominant design,
it’s clear that companies can (or at least are convinced that they can), charge for the newer and
19
more innovative features they embed their products with, before price competition takes the lead
when the standard emerges.
CONCLUSIONS
The aim of the present essay was to investigate the status of the mobile phone industry. In
particular, the objective has been to reject the hypothesis of a consistent part of the literature,
according to which smartphones have already reached their natural product innovation peak and,
as a consequence, that there is already a dominant design in the market (i.e. the iPhone). As a
matter of fact, since the evaluation of the industry trends, it was clear that the sector is still in the
fuzzy front end; this means that companies are going towards the same directions, and they have
already accomplished many attempts, in a trial and error logic, to come up with fewer and fewer,
more homogeneous but technologically advanced new devices.
To verify my hypotheses, I have created an original dataset comprising most smartphones
launched since 2004, taking into account only world scale producers, only firms which are either
present in several countries or, at least, which are serving few (maybe even simply one) markets,
provided that their dimensions are consistent enough for the analysis (e.g. for instance the case of
companies which are selling exclusively in India or in Australia, which are enormous niches).
I investigated two main dimensions, that actually are considered the most important ones by both
producers (in terms of investments for the R&D related to them), and customers (considering
their purchase preferences). The first one was the SOFTWARE DOMINANCE, which is an
indicator of firms innovativeness in Operative System choice. The second one was the
HARDWARE DOMINANCE, that states whether companies are equipping their devices with
the most technologically advanced order qualifying hardware components, or not.
The purpose was to verify the impact of these on smartphone innovativeness, that was my
dependent variable.
The results of the regression don’t simply confirm the hypothesis at the basis of the model (i.e.
no dominant design has emerged yet), but also provide readers with interesting pieces of
information about the status of the industry. Mobile telephony is definitely going towards an

20
almost complete smartphonization, where traditional and feature phones are doomed to serve
very small niches of the demand.
Smartphones are reaching the natural peak of product innovation, so we will assist to fewer
models launched each year by producers, with fewer OS providers, more similar designs, and an
increasingly higher price competition, together with process innovation meant to keep margins as
high as possible.
The number of firms will collapse: competitors that today are among the smallest are going to
either be set off the market, due to a failure, or to be acquired by the biggest players. Besides this,
major threats would come from firms operating in neighboring markets, like the television one
(e.g. this is what is happening with Sharp, which has announced its decision to start producing
five smartphone models between the end of 2012 and the beginning of 2013).
Another important implication for the industry and for the smartphone producers, is that
producers should decide to equip their outcomes with the most innovative features examined
throughout the essay, at the hardware level. They should wisely decide to reduce product
experiments and attempts focusing on comparisons among the most technically valuable OS
(Android versus Windows Mobile above all, something which does not apply to the Apple case),
to quickly make a choice. On a medium-long term perspective, their main efforts will have to be
dedicated to innovate around the latest incremental innovations (an example for all is the dual-
SIM technology), to understand sooner than competitors which characteristics might eventually
be the newer order winners for rising up their market shares, before the ineluctable end of
product innovation and the stiff price wars come along.
REFERENCES
Abernathy, W. J. (1978). The Productivity Dilemma: Roadblock to Innovation in the Automobile
Industry, Baltimore: Johns Hopkins University Press.
Abernathy, W. J. and Utterback, J. M. (1978). Patterns of Industrial Innovation, Technology Review,
8: 40 - 47.
Anderson, P. and Tushman, M. (1990). Technological discontinuities and dominant design: A
cyclical model of technology change. Administrative Science Quarterly, 35: 604 - 633.

21
Christensen, C., Suarez, A. and Utterback, J. (1998). Strategies for survival in fast-changing
industries. Management Science, 44: 207 - 220.
Corrocher, N. and M. Guerzoni (2009), Product Variety and Price Strategy in the Ski
Manufacturing Industry. Journal of Evolutionary Economics, 4: 471 - 486.
Gandal, N., Salant, D. and Waverman, L. (2003). Standards in wireless telephone networks.
Telecommunications Policy, 27: 325 - 332.
Henderson, R. and Clark, K. (1990). Architectural innovation: The reconfiguration of existing
product technologies and the failure of established firms. Administrative Science Quarterly, 35: 9 - 30.
Klepper, S. (1996). Entry, exit, growth, and innovation over the product life cycle. American
Economic Review, 86(3): 562 - 583.
Kline, S. and Rosenberg, N. (1985). An Overview of Innovation. In Landau, R., Rosenberg, N.
(eds. by). The Positive Sum Strategy: Harnessing Technology for Economic Growth, pp. 275 – 306.
Koski, H. and Kretschmer, T. (2005). Entry, standards and competition: Firm strategies and the
diffusion of mobile telephony. Review of Industrial Organization, 26(1), 89 - 113.
Koski, H. and Kretschmer, T. (2007). Innovation and dominant design in mobile telephony.
Industry and Innovation, 14: 305 - 324.
Kretschmer, T. and Grajek, M. (2008). Usage and diffusion of cellular telephony 1998 - 2004.
International Journal of Industrial Organization, 27(2): 238 - 249.
Rogers, E. M. (1976). New Product Adoption and Diffusion. Journal of Consumer Research, 2(4): 290
- 301.
Srinivasan, R. G., Lilien, L. and Rangaswamy, A. (2004). First in, First out? Effect of Network
Externalities on Pioneer Survival. Journal of Marketing, 68(1): 41 - 57.
Suaréz, F. F. and Utterback J. M. (1995) Dominant Designs and the Survival of Firms. Strategic
Management Journal, 16: 415 - 430.
Utterback, J. and Abernathy, W. (1975). A dynamic model of process and product innovation.
Omega, 3(6): 639 - 656.