Embed Size (px)
Citation preview
The SmarT Difference
2 0 1 2 A N N U A L R E P O R T

Financial Highlights 1
To Our Shareholders 4
The Emerson Difference 8
Financial Review 18
Financial Statements 31
Notes to Consolidated Financial Statements 36
Report of Independent Registered Public Accounting Firm 55
Eleven-Year Summary 56
Board of Directors & Management 58
Stockholders Information 60
2012 Annual Report | 1
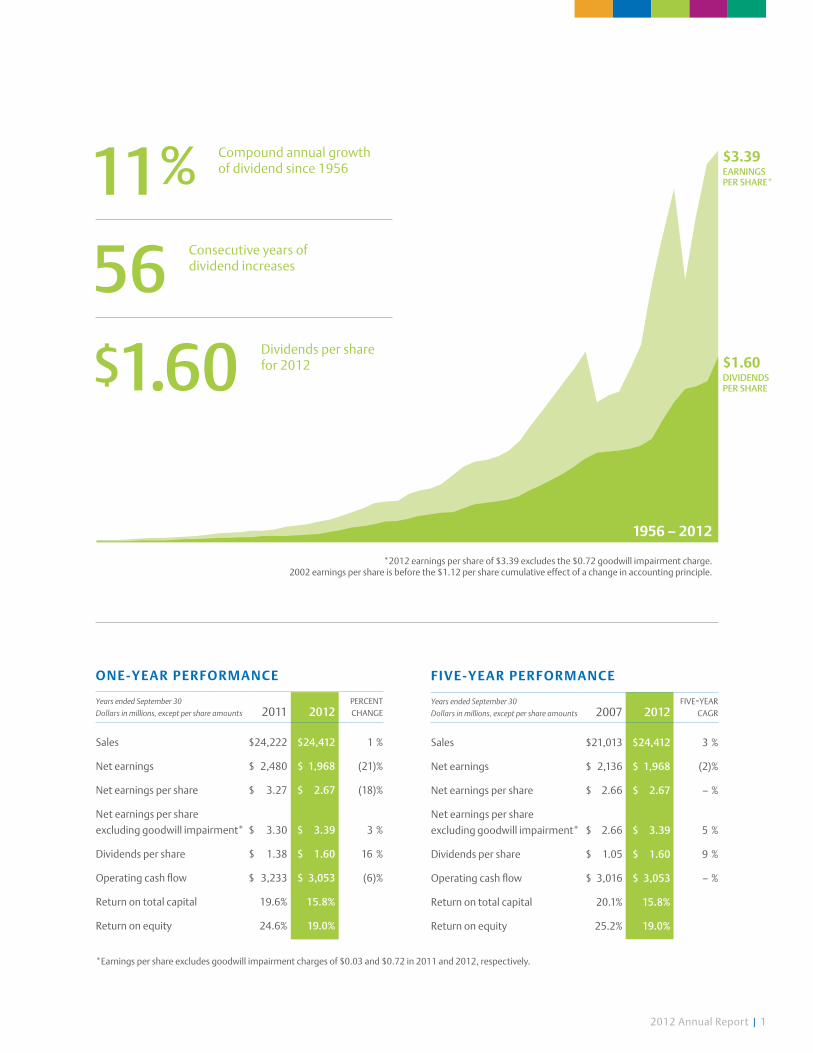
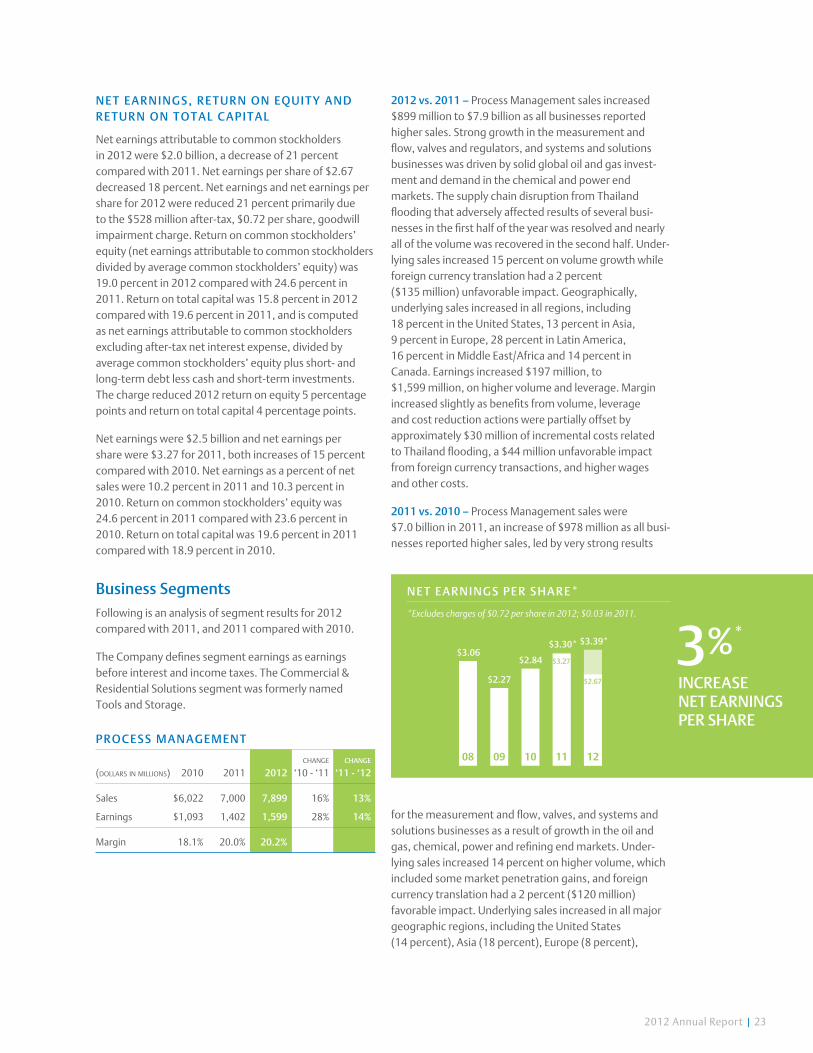
*2012 earnings per share of $3.39 excludes the $0.72 goodwill impairment charge.2002 earnings per share is before the $1.12 per share cumulative effect of a change in accounting principle.
O ne -Y e ar P erfOrmance
Years ended September 30 percent Dollars in millions, except per share amounts 2011 2012 change
Sales $24,222 $24,412 1 %
Net earnings $ 2,480 $ 1,968 (21)%
Net earnings per share $ 3.27 $ 2.67 (18)%
Net earnings per share
excluding goodwill impairment* $ 3.30 $ 3.39 3 %
Dividends per share $ 1.38 $ 1.60 16 %
Operating cash flow $ 3,233 $ 3,053 (6)%
Return on total capital 19.6% 15.8%
Return on equity 24.6% 19.0%
f ive-Y ear P erfOrmance
Years ended September 30 five-year Dollars in millions, except per share amounts 2007 2012 cagr
Sales $21,013 $24,412 3 %
Net earnings $ 2,136 $ 1,968 (2)%
Net earnings per share $ 2.66 $ 2.67 – %
Net earnings per share
excluding goodwill impairment* $ 2.66 $ 3.39 5 %
Dividends per share $ 1.05 $ 1.60 9 %
Operating cash flow $ 3,016 $ 3,053 – %
Return on total capital 20.1% 15.8%
Return on equity 25.2% 19.0%
11% Compound annual growth of dividend since 1956
56 Consecutive years of dividend increases
$1.60 Dividends per share for 2012
*Earnings per share excludes goodwill impairment charges of $0.03 and $0.72 in 2011 and 2012, respectively.
1956 – 2012
$3.39EarningspErsharE*
$1.60dividEndspErsharE

2 | 2012 Annual Report
The people of Emerson solve problems and create solutions that make our customers and the world better. They are THE SMART DIFFERENCE.

2012 Annual Report | 3
From left: Peter chin Emerson Process Management | Susan Hughes Emerson Process Management appal chintapalli Emerson Climate Technologies | enrique viseras Emerson Industrial Automation | Dave Bersaglini Emerson Climate Technologies
David n. farr Chairman and Chief Executive Officer | nathan Pettus Emerson Process Management | Katie chui Emerson Network Power Jay Wirts Emerson Industrial Automation | Gustavo menezes Emerson Climate Technologies

4 | 2012 Annual Report
to oursharEholdErs
As I reflect on 2012, I am encouraged and energized
by what Emerson accomplished in a dynamic
global environment. We overcame a number of
significant challenges during a year that did not
unfold as planned. I have learned over the years
that plans never go quite as expected, but the true
measure of an organization is how it reacts. I have
also come to appreciate and respect the ability
of Emerson’s global organization to effectively
respond to challenges and opportunities. The past
year has strengthened my belief in our employees’
capabilities to achieve and innovate in a rapidly
changing world. Emerson’s global leaders know
how to rise to the challenge and get the job done.
I thank them for their support and action.
Emerson delivered solid results in 2012, as sales
increased, profitability reached record levels,
and operating cash flow remained solid despite a
number of headwinds and global economic volatility.
Strong financial performance did not come easily.
In many respects, it was our most difficult year in
recent history. With that said, it was in the moments
of struggle and uncertainty that I recognized
exceptional perseverance and tireless effort to
overcome and win. It is in times like the past
year that the great depth and talent of our next
generation of leaders emerge, and we get to take
their true measure.
Sales in 2012 were $24.4 billion, up 1 percent
from $24.2 billion in 2011, reflecting slower global
economic growth and related foreign currency
volatility. Underlying sales (excluding acquisitions,
divestitures, and foreign currency translation)
increased 3 percent compared to 2011. Operating
profit margin improved to 17.7 percent – an all-time
high for Emerson. Net earnings per share, excluding
noncash goodwill impairment charges, were $3.39
in 2012, up 3 percent versus $3.30 in 2011.
Cash generation remained in sharp focus through the
year, resulting in operating cash flow of $3.1 billion.
We returned a substantial portion of this cash to
our shareholders in the form of dividends and share
repurchases, reflecting a 64 percent total payout ratio.
Emerson’s dividend grew for the 56th consecutive
year, underscoring our long-standing emphasis on
generating returns for shareholders. In November,
the Board of Directors further increased the dividend
by 3 percent to an annual rate of $1.64.
With another successful year completed, we now
look forward to creating additional value for our
shareholders. The pace of change in the world
today is extraordinary. The technology needs of our
customers are evolving with unprecedented speed,
requiring them to seek innovation and ingenuity that
enable them to compete and thrive in new ways.
When we look to the future at Emerson, our objective
is more than just anticipating change – we aim to
create it. Waiting on change to come to us puts
us and our customers critical steps behind. Our
customers expect us to take the first steps and to
lead them into the future, creating sustainable
value for our industries and markets.

2012 Annual Report | 5
Staying ahead of the emerging technologies and business trends that tomorrow will bring requires ExCEpTIoNAlly TAlENTED pEoplE who lead, problem solve, and innovate.

6 | 2012 Annual Report
Across the organization and around the world, we carefully recruit and develop HIgH-IMpACT EMployEES who make this vision for Emerson and our customers a reality.
2012 Annual Report | 7
Staying ahead of the emerging technologies and
business trends that tomorrow will bring requires
exceptionally talented people who lead, problem
solve, and innovate. Across the organization and
around the world, we carefully recruit and develop
high-impact employees who make this vision for
Emerson and our customers a reality. These people
are the next generation of leaders who will take
Emerson to even higher levels of performance and
create opportunities and value for our customers
and shareholders.
Emerson’s most differentiating asset is its dedicated
people. These remarkable people are in every
Emerson business, in every geography, in every
function. They are the heartbeat of Emerson and
the lifeblood of our future growth and leadership.
In the pages that follow, some of these high-impact
employees share aspects of Emerson’s story in their
words. The solutions they are helping to inspire for
our customers optimize oil and gas production,
maximize data center efficiency, and keep the
world’s food safe, to name just a few.
Emerson’s unique talent pool has accelerated our
ability to reinvent ourselves and the markets we
serve over and over through our 122-year history.
The people of Emerson are at their best when
uncertainty is high and the challenge has never
been seen before. Collectively they solve problems
and create solutions that make our customers, and
the world, better. They are the smart difference
and our future.
This annual report provides a glimpse into some of the
many talented individuals who represent the next
generation of leaders at Emerson. I am optimistic
about and invigorated by what the people of Emerson
have overcome and accomplished in the past year,
and it gives me confidence in what the future holds.
Their energy, passion, and commitment will transform
Emerson and continue to deliver shareholder value
and to make the world a better place.
The tremendous commitment and loyalty that our
global organization embodies also describes our
Board of Directors. Their leadership and support
serve as an invaluable and essential element to our
management process, which has been exemplified
by two Directors soon to step down. Rozanne Ridgway
will retire after 18 years of service on the Board.
Walter Galvin will retire after 13 years on the Board
and 40 years with Emerson, as highlighted on page 58.
Both “Roz” and “Walt” have provided exceptional
leadership to Emerson and its shareholders as we
have evolved and grown through their tenure, and
their integrity and passion for excellence will be
missed. On behalf of the rest of the Board and all
of Emerson, we wish them both good health and
much happiness in their retirements.
On behalf of the Board of Directors, thank you for
your support as we continue to create and deliver
sustainable value for generations to come.
Sincerely,
David N. FarrChairman and Chief Executive Officer

EmErsonnEtworkpowEr
Sonia Castellanos Telecom Network Reliability
Chile was rocked by an earthquake in 2010 that brought communications to a halt. People couldn’t communicate with their loved ones; governments couldn’t gather or share information with people in need. Emerson has helped Chile build a mobile communications network that will provide at least 48 hours of backup power at strategic cell sites in the event of a power outage.
Mitch Densley and Blake CarlsonData Center Infrastructure Management
Mitch: Emerson’s Trellis™ platform is making a big difference for businesses that want real-time information to manage their data centers. The Trellis platform enables the administrator to monitor the facility’s infrastructure and the information technology it hosts. Unlike anything else on the market, the Trellis platform displays this critical information in optimal formats that can be used to improve performance, energy efficiency, and cost.
Blake: Over the years, IT vendors have tried to deliver automation solutions for data centers. But they all failed because they didn’t bridge the gap between information technology hosted and the facility support infrastructure. With the Trellis platform, Emerson is building a platform solution that can now map every device in the data center and provide monitoring that shows both infrastructure and IT performance.

2012 Annual Report | 9
Jamie Froedge Hyperscale Data Centers
The companies driving today’s Internet-based economy are building massive data centers, on a hyperscale never seen before. They are turning to Emerson for grid-to-chip power conditioning and cooling technologies and data center information management solutions that ensure uptime, provide energy efficiency, and lower operating costs. Every 1 percent of efficiency enabled by Emerson technology means big cost savings for our customers.
Scan the QR Code to learn more.
70%Time savings possible by using Emerson’s Trellis™ platform.
600:1One new server is added for every 600 smartphones or 120 tablets in use.
Our grid-to-chip portfolio of products and services for
telecommunications and data center providers ensures
that these business-critical communications systems
are always available and operating efficiently.
THE SMART DIFFERENCE
$426B Estimated annual costs related to data center outages worldwide.

10 | 2012 Annual Report
EmErsonClimatEtEChnologiEs
Gustavo MenezesDelivering Integrated Solutions
Growth opportunities for Climate Technologies in Latin America over the next several years are going to come from our products and services that integrate electronics and software with our compressors for retail solutions and industrial refrigeration. The impact of these technologies on energy savings for our customers is huge. Our customers want to minimize their energy costs and be environmentally friendly – and our technologies are helping them get there.
Appal Chintapalli Improving Supermarket Energy Efficiency
Supermarkets are energy-intensive retail facilities. Regardless of size of the facility, supermarket owners have the same goals – to keep the refrigerated food safe, the shopping environment comfortable and well-lit, and control costs. Emerson’s Intelligent Store® solution integrates our technologies, controls, software, and monitoring services to help our customers operate more efficiently while keeping food safe and the shopping environment comfortable.

2012 Annual Report | 11
$100,000Annual energy cost savings per store achievable with use of Emerson’s Intelligent Store® technologies, services, and best practices.
Number of Copeland Scroll® compressors manufac-tured by Emerson since its 1987 product introduction.
100m
Our climate control technologies are helping the world’s
heating, air conditioning, and refrigeration manufacturers
develop systems that operate better, with lower energy
costs, and with less impact on the environment.
Scan the QR Code to learn more.
Dave Bersaglini Investing in Emerging Markets
Food spoilage is a significant issue in emerging markets. In China, 20 to 30 percent of food is wasted annually because of an inadequate cold-chain infrastructure to keep food at the proper temperature from where it’s produced until it’s consumed. Emerson technology has a tremendous opportunity, as developing countries invest in modern refrigeration systems for food transport, processing, distribution, and retailing.
50%Amount of fruits and vegetables that spoil in developing nations, in part due to an inadequate cold-chain infrastructure.
THE SMART DIFFERENCE

EmErsonproCEssmanagEmEnt
Susan Hughes Global Engineering Network
One of Emerson’s key initiatives is to locate our R&D centers closer to our customers. With R&D locations around the world, the company better understands customer needs in their local markets. Our facilities share information and learn from one another. This collective knowledge, insight, and our tremendous human talent are helping drive Emerson’s innovation and growth.
Nathan PettusTransformational Technologies
Our new electronic marshalling with CHARMs technology is changing the way customers have done process control wiring for the past 35 years. Electronic marshalling is less risky and much more simple and certain. It removes 75 percent of the work required to bring a measurement from the field to the control room compared to “conventional” marshalling.

2012 Annual Report | 13
50%Labor savings to install wiring and instrumentation that can be achieved by use of Emerson’s electronic marshalling with CHARMs technology.
Our plant automation and control technologies
enable process manufacturers, such as the oil
and gas industry, to achieve more efficient,
productive, and safer operations.
Phillip Bond Rebuilding Iraq’s Oil Industry
In Iraq, Emerson is helping to re-establish an oil industry damaged by war. There are massive oil projects going on with the national oil company and international oil companies and we’ve been involved in pretty much every single project. Emerson’s engineers are at customer sites every day of the week to get the oil production of the country up and running as quickly as possible.
Scan the QR Code to learn more.
1BHours of operation by 10,000 systems worldwide using Emerson’s Smart Wireless technology.
96%Portion of global energy demand growth from emerging economies by 2030.
THE SMART DIFFERENCE
14 | 2012 Annual Report
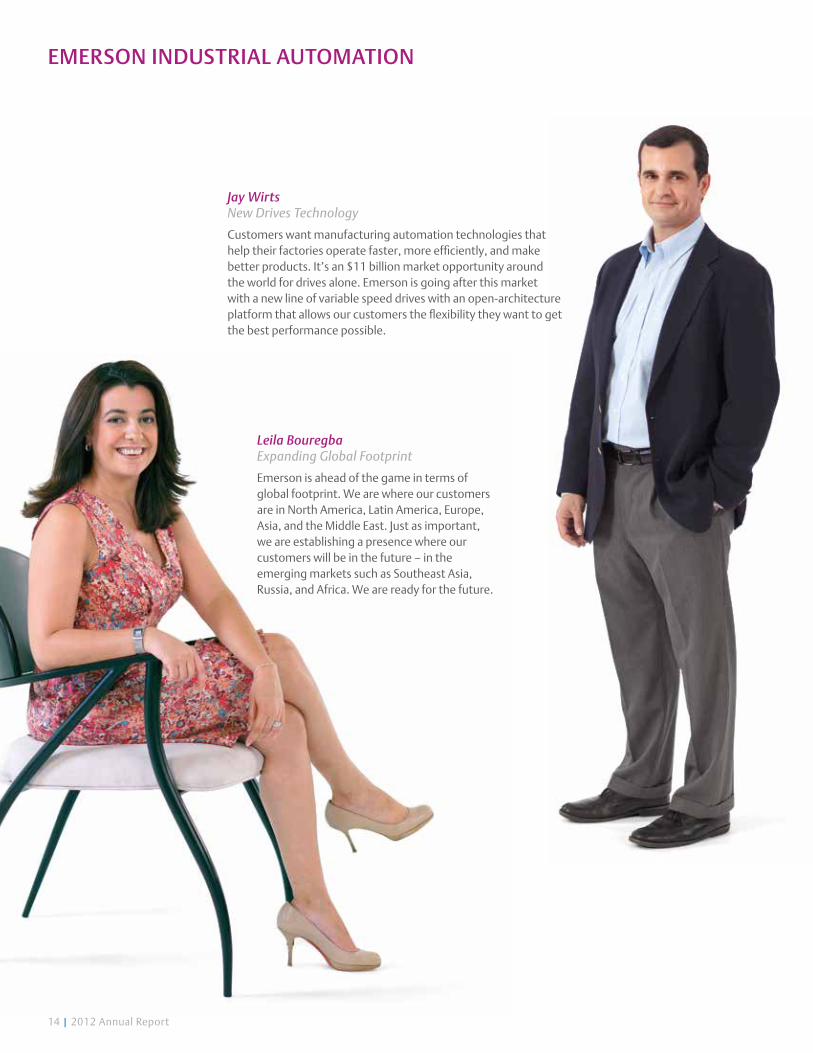
EmErsonindustrialautomation
Jay Wirts New Drives Technology
Customers want manufacturing automation technologies that help their factories operate faster, more efficiently, and make better products. It’s an $11 billion market opportunity around the world for drives alone. Emerson is going after this market with a new line of variable speed drives with an open-architecture platform that allows our customers the flexibility they want to get the best performance possible.
Leila Bouregba Expanding Global Footprint
Emerson is ahead of the game in terms of global footprint. We are where our customers are in North America, Latin America, Europe, Asia, and the Middle East. Just as important, we are establishing a presence where our customers will be in the future – in the emerging markets such as Southeast Asia, Russia, and Africa. We are ready for the future.

Global market opportunity for industrial automation.$85B
Our technologies provide increased machine
reliability, efficiency, and availability for
customers varying from heavy industry
to renewable energy providers.
Scan the QR Code to learn more.
Enrique ViserasGrowth Through Open Architecture
Emerson will revolutionize the industrial automation world with our new drives that offer the widest selection in the market. For the first time customers will be able to choose the right drive for their specific needs, with an open architecture to allow the use of any components. The litmus test for achievement is being able to say we did what has never been done before.
THE SMART DIFFERENCE
13%Expected annual minimum wage inflation in China through 2015. Rising wages in developing economies are propelling demand for manufacturing automation.
150Number of countries in which Emerson manufactures or sells its products to its broad, global customer base.

16 | 2012 Annual Report
EmErsonCommErCialandrEsidEntialsolutions
Jay Gatz Leveraging Information Technology
Emerson has evolved from just making products with nuts and bolts to a company that develops products with bolts and bytes – in other words, with technology. These are products with electronics and sensors that enrich the capabilities of the users. Emerson’s RIDGIDConnect® is a new-to-the-world solution that allows customers to use social media-like tools to share jobsite detail and video.
James McGregor New Software Solutions
California has Silicon Valley, but Emerson is creating its own hotbed of software development in northeast Ohio. The secret sauce for the success of our software solutions business is a group of passionate, talented people who collaborate and pull in the same direction to achieve a common goal: developing innovative products for Emerson that surpass expectations and surprise people.

2012 Annual Report | 17
33%Reduction in pipe and tube installation time possible with RIDGID® electrohydraulic pressing technology from Emerson.
Tons of food waste diverted from U.S. landfills and converted into fertilizer and/or renewable energy through use of food waste disposers.
8m
We are building an exciting foundation of
software development expertise that adds
new functionality to our tool products which
can be leveraged across Emerson.
Scan the QR Code to learn more.
Justin DawNew Product Development
The applications being built by our software solutions business are laying the foundation for exciting new products in the future. In the past, RIDGID® was known for making the best hand and power tools. Now we’re going to see tool products with sensors that are able to record their use in the workplace or at the jobsite, making projects easier and more predictable for our customers.
THE SMART DIFFERENCE
Reduction in miles walked by a nurse on a routine hospital shift enabled by Metro® networked point-of-care carts from Emerson.
1.8
18 | 2012 Annual Report
Report of ManagementThe Company’s management is responsible for the integrity and accuracy of the financial statements. Management believes that the financial statements for the three years ended September 30, 2012 have been prepared in conformity with U.S. generally accepted accounting principles appropriate in the circumstances. In preparing the financial statements, management makes informed judgments and estimates where necessary to reflect the expected effects of events and transactions that have not been completed. The Company’s disclosure controls and procedures ensure that material information required to be disclosed is recorded, processed, summa-rized and communicated to management and reported within the required time periods.
In meeting its responsibility for the reliability of the financial statements, management relies on a system of internal accounting control. This system is designed to provide reasonable assurance that assets are safeguarded and transactions are executed in accordance with management’s authorization and recorded properly to permit the preparation of financial statements in accordance with U.S. generally accepted accounting principles. The design of this system recognizes that errors or irregularities may occur and that estimates and judgments are required to assess the relative cost and expected benefits of the controls. Management believes that the Company’s internal accounting controls provide reasonable assurance that errors or irregularities that could be material to the financial statements are prevented or would be detected within a timely period.
The Audit Committee of the Board of Directors, which is composed solely of independent directors, is responsible for overseeing the Company’s financial reporting process. The Audit Committee meets with management and the Company’s internal auditors periodically to review the work of each and to monitor the discharge by each of its responsibilities. The Audit Committee also meets periodi-cally with the independent auditors, who have free access to the Audit Committee and the Board of Directors, to discuss the quality and acceptability of the Company’s financial reporting, internal controls, as well as non-audit- related services.
The independent auditors are engaged to express an opinion on the Company’s consolidated financial statements and on the Company’s internal control over financial reporting. Their opinions are based on procedures that they believe to be sufficient to provide reasonable assurance that the financial statements contain no material errors and that the Company’s internal controls are effective.
Management’s Report on Internal Control Over Financial ReportingThe Company’s management is responsible for estab-lishing and maintaining adequate internal control over financial reporting for the Company. With the participa-tion of the Chief Executive Officer and the Chief Financial Officer, management conducted an evaluation of the effectiveness of internal control over financial reporting based on the framework and the criteria established in Internal Control – Integrated Framework, issued by the Committee of Sponsoring Organizations of the Treadway Commission. Based on this evaluation, management has concluded that internal control over financial reporting was effective as of September 30, 2012.
The Company’s auditor, KPMG LLP, an independent registered public accounting firm, has issued an audit report on the effectiveness of the Company’s internal control over financial reporting.
Frank J. Dellaquila
Executive Vice President
and Chief Financial Officer
David N. Farr
Chairman of the Board
and Chief Executive Officer
FInanCIal RevIew
2012 Annual Report | 19
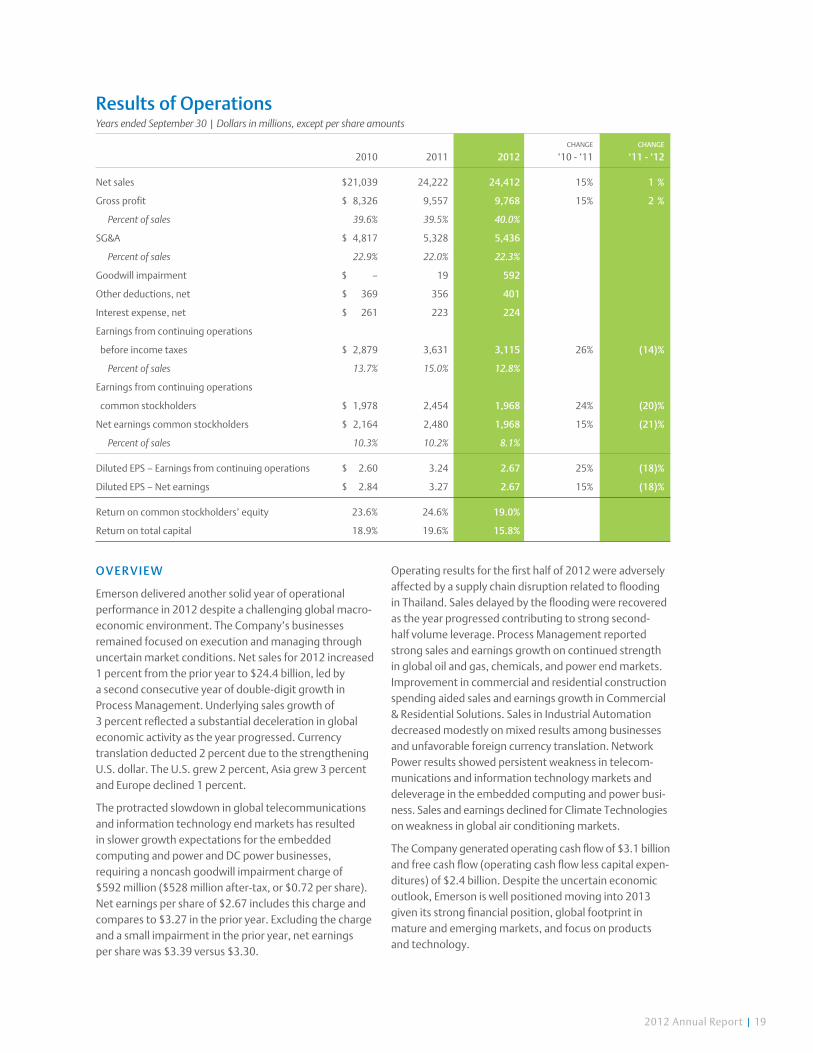
Results of OperationsYears ended September 30 | Dollars in millions, except per share amounts
change change 2010 2011 2012 ‘10-‘11 ‘11 - ‘12
Net sales $21,039 24,222 24,412 15% 1 %
Gross profit $ 8,326 9,557 9,768 15% 2 %
Percent of sales 39.6% 39.5% 40.0%
SG&A $ 4,817 5,328 5,436
Percent of sales 22.9% 22.0% 22.3%
Goodwill impairment $ – 19 592
Other deductions, net $ 369 356 401
Interest expense, net $ 261 223 224
Earnings from continuing operations
before income taxes $ 2,879 3,631 3,115 26% (14)%
Percent of sales 13.7% 15.0% 12.8%
Earnings from continuing operations
common stockholders $ 1,978 2,454 1,968 24% (20)%
Net earnings common stockholders $ 2,164 2,480 1,968 15% (21)%
Percent of sales 10.3% 10.2% 8.1%
Diluted EPS – Earnings from continuing operations $ 2.60 3.24 2.67 25% (18)%
Diluted EPS – Net earnings $ 2.84 3.27 2.67 15% (18)%
Return on common stockholders’ equity 23.6% 24.6% 19.0%
Return on total capital 18.9% 19.6% 15.8%
OveRvIew
Emerson delivered another solid year of operational performance in 2012 despite a challenging global macro-economic environment. The Company’s businesses remained focused on execution and managing through uncertain market conditions. Net sales for 2012 increased 1 percent from the prior year to $24.4 billion, led by a second consecutive year of double-digit growth in Process Management. Underlying sales growth of 3 percent reflected a substantial deceleration in global economic activity as the year progressed. Currency translation deducted 2 percent due to the strengthening U.S. dollar. The U.S. grew 2 percent, Asia grew 3 percent and Europe declined 1 percent.
The protracted slowdown in global telecommunications and information technology end markets has resulted in slower growth expectations for the embedded computing and power and DC power businesses, requiring a noncash goodwill impairment charge of $592 million ($528 million after-tax, or $0.72 per share). Net earnings per share of $2.67 includes this charge and compares to $3.27 in the prior year. Excluding the charge and a small impairment in the prior year, net earnings per share was $3.39 versus $3.30.
Operating results for the first half of 2012 were adversely affected by a supply chain disruption related to flooding in Thailand. Sales delayed by the flooding were recovered as the year progressed contributing to strong second-half volume leverage. Process Management reported strong sales and earnings growth on continued strength in global oil and gas, chemicals, and power end markets. Improvement in commercial and residential construction spending aided sales and earnings growth in Commercial & Residential Solutions. Sales in Industrial Automation decreased modestly on mixed results among businesses and unfavorable foreign currency translation. Network Power results showed persistent weakness in telecom-munications and information technology markets and deleverage in the embedded computing and power busi- ness. Sales and earnings declined for Climate Technologies on weakness in global air conditioning markets.
The Company generated operating cash flow of $3.1 billion and free cash flow (operating cash flow less capital expen-ditures) of $2.4 billion. Despite the uncertain economic outlook, Emerson is well positioned moving into 2013 given its strong financial position, global footprint in mature and emerging markets, and focus on products and technology.
20 | 2012 Annual Report
net Sa leS
Net sales for 2012 were $24.4 billion, an increase of $190 million, or 1 percent, from 2011. Consolidated results reflect a 3 percent ($616 million) increase in underlying sales (which exclude acquisitions, divestitures and foreign currency translation), a 2 percent ($411 million) unfavorable impact from foreign currency translation and a negligible ($15 million) negative impact from divesti-tures, net of acquisitions. Underlying sales reflect volume gains of 2 percent and an estimated 1 percent from price. Underlying sales increased 2 percent in the United States and 3 percent internationally, including Asia (3 percent), Latin America (13 percent), Middle East/Africa (7 percent) and Canada (9 percent), while sales in Europe decreased 1 percent. Segment results were mixed as sales in Process Management and Commercial & Residential Solutions increased $899 million and $40 million, respectively, while sales in Network Power, Climate Technologies and Industrial Automation decreased $412 million, $229 million and $106 million, respectively.
Net sales for 2011 were $24.2 billion, an increase of $3,183 million, or 15 percent from 2010. Sales grew in all segments, led by Industrial Automation, Network Power and Process Management, which were up $1,005 million, $983 million and $978 million, respectively. Consolidated results reflected an 11 percent ($2,216 million) increase in underlying sales, a 2 percent ($623 million) contribution
from acquisitions, and a 2 percent ($344 million) favorable impact from foreign currency translation. Underlying sales reflected volume gains of 10 percent and an estimated 1 percent from higher selling prices as sales increased 13 percent internationally, including Asia (11 percent), Europe (11 percent), Latin America (20 percent), Middle East/Africa (16 percent) and Canada (20 percent). Underlying sales increased 8 percent in the United States.
I nteRnatI Onal S al eS
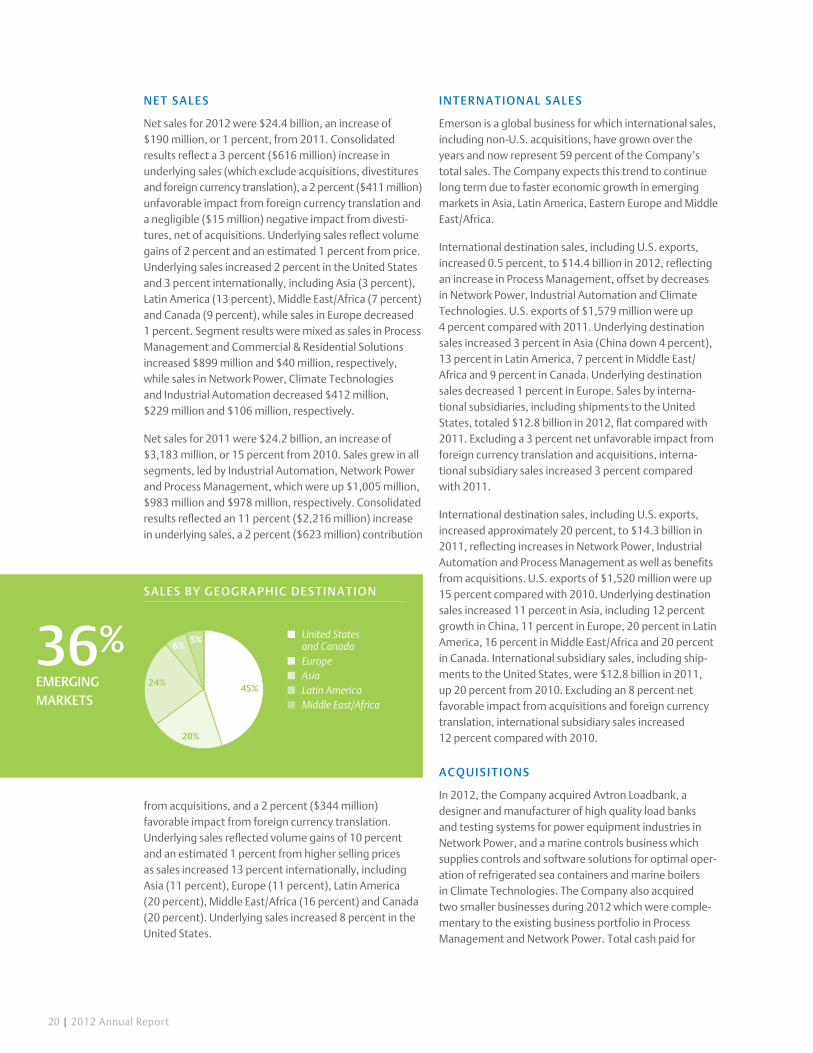
Emerson is a global business for which international sales, including non-U.S. acquisitions, have grown over the years and now represent 59 percent of the Company’s total sales. The Company expects this trend to continue long term due to faster economic growth in emerging markets in Asia, Latin America, Eastern Europe and Middle East/Africa.
International destination sales, including U.S. exports, increased 0.5 percent, to $14.4 billion in 2012, reflecting an increase in Process Management, offset by decreases in Network Power, Industrial Automation and Climate Technologies. U.S. exports of $1,579 million were up 4 percent compared with 2011. Underlying destination sales increased 3 percent in Asia (China down 4 percent), 13 percent in Latin America, 7 percent in Middle East/Africa and 9 percent in Canada. Underlying destination sales decreased 1 percent in Europe. Sales by interna-tional subsidiaries, including shipments to the United States, totaled $12.8 billion in 2012, flat compared with 2011. Excluding a 3 percent net unfavorable impact from foreign currency translation and acquisitions, interna-tional subsidiary sales increased 3 percent compared with 2011.
International destination sales, including U.S. exports, increased approximately 20 percent, to $14.3 billion in 2011, reflecting increases in Network Power, Industrial Automation and Process Management as well as benefits from acquisitions. U.S. exports of $1,520 million were up 15 percent compared with 2010. Underlying destination sales increased 11 percent in Asia, including 12 percent growth in China, 11 percent in Europe, 20 percent in Latin America, 16 percent in Middle East/Africa and 20 percent in Canada. International subsidiary sales, including ship-ments to the United States, were $12.8 billion in 2011, up 20 percent from 2010. Excluding an 8 percent net favorable impact from acquisitions and foreign currency translation, international subsidiary sales increased 12 percent compared with 2010.
aCquI S I tI OnS
In 2012, the Company acquired Avtron Loadbank, a designer and manufacturer of high quality load banks and testing systems for power equipment industries in Network Power, and a marine controls business which supplies controls and software solutions for optimal oper-ation of refrigerated sea containers and marine boilers in Climate Technologies. The Company also acquired two smaller businesses during 2012 which were comple-mentary to the existing business portfolio in Process Management and Network Power. Total cash paid for
SaleS BY G eOG R a PH IC D eSt In atI On
n United States and Canada
n Europen Asian Latin American Middle East/Africa
6%
45%
20%
24%
5%36%eMeRGInGMaRKetS
2012 Annual Report | 21
acquisitions in 2012 was approximately $187 million, and annualized sales for these businesses were approximately $115 million. See Note 3 for additional information.
The Company acquired several small businesses during 2011, mainly in the Process Management and Climate Technologies segments, all of which were complemen-tary to the existing business portfolio. Total cash paid for businesses in 2011 was approximately $232 million. Annualized sales for businesses acquired in 2011 were approximately $100 million.
COSt OF SaleS
Costs of sales for 2012 and 2011 were $14.6 billion and $14.7 billion, respectively, resulting in gross profit and gross margin of $9.8 billion and 40.0 percent, and $9.6 billion and 39.5 percent, respectively. Cost of sales was essentially flat due to savings from cost reduction actions offset by higher wage and other costs, and incremental costs related to the Thailand supply chain disruption. The increase in gross margin primarily reflects leverage on higher volume and selling prices. Additionally, gross profit was negatively impacted by foreign currency translation due to the stronger U.S. dollar.
Costs of sales for 2011 and 2010 were $14.7 billion and $12.7 billion, respectively. Gross profit of $9.6 billion and $8.3 billion, respectively, resulted in gross margins of 39.5 percent and 39.6 percent. The increase in gross profit primarily reflects higher volume and leverage, acquisitions, and savings from cost reduction actions in prior periods. Higher materials costs were only partially offset by price increases, diluting margins. Materials cost pressures persisted throughout 2011.
SellInG, Ge neR a l a n D aDMInIStRa t Ive exPen SeS
Selling, general and administrative (SG&A) expenses for 2012 were $5.4 billion, or 22.3 percent of net sales, an increase of $108 million and 0.3 percentage points compared with $5.3 billion and 22.0 percent for 2011. The increase in SG&A as a percent of sales was largely due to the business mix impact from higher Process Management volume and deleverage on lower volume in Network Power, Climate Technologies and Industrial Automation, partially offset by significant cost reduction actions. In addition, SG&A increased on costs associ-ated with incremental volume and a $17 million charge related to the elimination of post-65 supplemental retiree medical benefits for approximately 8,000 active employees, mostly offset by foreign currency translation and lower incentive stock compensation expense of $21 million.
SG&A expenses for 2011 were $5.3 billion, or 22.0 percent of net sales, compared with $4.8 billion, or 22.9 percent of net sales for 2010. The $511 million increase was primarily due to higher sales volume and the impact of acquisitions. The decrease as a percent of sales was due to volume leverage, cost reduction savings and a $96 million decrease in incentive stock compensation expense reflecting changes in the Company’s stock price and a reduced impact from incentive stock plans overlap compared to prior year, partially offset by acquisitions and higher wage and other costs.
GOODwI l l I MPaI RMent
In the fourth quarter of 2012, the Company’s annual goodwill impairment testing revealed that carrying value exceeded fair value for the embedded computing and power business and the DC power systems business, both of which are in the Network Power segment. The Company anticipates that growth in sales and earnings for these businesses will be slower than previously expected due to protracted weak demand and structural industry challenges in telecommunications and information technology end markets, and increased competition. As a consequence, the carrying value of these businesses was reduced by a noncash, pretax charge to earnings totaling $592 million ($528 million after-tax, or $0.72 per share). Management and the Board of Directors have discussed the unique market and technology challenges facing the embedded computing and power business and will pursue strategic alternatives, including a potential sale of this business with annual revenue of $1.4 billion. In 2011, the Company recorded a $19 million ($0.03 per share) noncash impairment charge related to the Industrial Automation wind turbine pitch control business. See Note 6 for additional information.
OtHeR DeDuCtI OnS , net
Other deductions, net were $401 million in 2012, a $45 million increase from 2011, primarily due to an unfavorable impact from foreign currency transactions reflecting volatile exchange rates, higher rationalization expense of $38 million and a small loss on the sale of the Knaack storage business. These items were partially offset by higher current year gains, including a $43 million gain on payments received related to dumping duties, and lower amortization expense of $20 million. Gains in 2011 included a $15 million Process Management India joint venture acquisition gain. See Notes 4 and 5 for further details regarding other deductions, net and rationalization costs, respectively.
22 | 2012 Annual Report
Other deductions, net were $356 million in 2011, a $13 million decrease from 2010 that primarily reflected a decrease in rationalization expense of $45 million, lower acquisition-related costs and the $15 million India joint venture acquisition gain, partially offset by higher amorti-zation expense of $85 million.
Inte R eSt exPenSe, net
Interest expense, net was $224 million, $223 million and $261 million in 2012, 2011 and 2010, respectively. The decrease of $38 million in 2011 was primarily due to lower average long-term borrowings.
InCOM e t a xeS
Income taxes were $1,091 million, $1,127 million and $848 million for 2012, 2011 and 2010, respectively, resulting in effective tax rates of 35 percent, 31 percent and 29 percent. The higher 2012 effective tax rate includes an unfavorable 4 percentage point impact from the goodwill impairment charge, as only a small portion of the charge was tax deductible. The higher 2011 effec-tive tax rate compared with 2010 primarily reflected a change in the mix of regional pretax income due to stronger earnings growth in the United States, where tax rates are generally higher than internationally, and lower tax benefits versus 2010, including non-U.S. tax holidays and a $30 million capital loss tax benefit from restruc-turing at a foreign subsidiary.
eaRnIn G S F R OM C Ont In u In G OPeRatI OnS
Earnings from continuing operations attributable to common stockholders were $2.0 billion in 2012, a 20 percent decrease compared with $2.5 billion in 2011. The decrease was primarily due to the $528 million after-tax goodwill impairment charge in 2012 which reduced earnings 21 percent. Earnings per share from continuing operations were $2.67, an 18 percent decrease versus $3.24 in the prior year. The decrease was primarily due to the $0.72 per share goodwill impairment charge in 2012
which reduced earnings per share 21 percent. Earnings increased $197 million in Process Management, $41 million in Industrial Automation and $21 million in Commercial & Residential Solutions. Earnings decreased $132 million in Network Power and $41 million in Climate Technologies. See the Business Segments discussion that follows and Note 16 for additional information.
Earnings from continuing operations were $2.5 billion in 2011, an increase of 24 percent compared with $2.0 billion in 2010. Earnings per share from continuing operations were $3.24 in 2011, an increase of 25 percent compared with $2.60 for 2010. Earnings improved $309 million in Process Management, $239 million in Industrial Automation, and $18 million in both Commercial & Residential Solutions and Climate Technologies, slightly offset by a $44 million decrease in Network Power.
DI S COntI nueD OPeRatI OnS
In the fourth quarter of 2011, the Company sold its heating elements unit for $73 million, resulting in an after-tax gain of $21 million. Fourth quarter 2011 sales and earnings for heating elements were $12 million and $1 million, respectively. The after-tax gain on divesti-ture and fourth quarter operating results for heating elements, and the impact of finalizing the 2010 Motors and LANDesk divestitures, were classified as discontinued operations for 2011. Prior fiscal 2011 quarters and prior year results of operations for heating elements were inconsequential and were not reclassified.
In the fourth quarter of 2010, the Company sold its appliance motors and U.S. commercial and industrial motors businesses (Motors) for proceeds of $622 million, resulting in an after-tax gain of $155 million ($126 million of income taxes). Motors had total annual sales of $827 million and net earnings, excluding the divestiture gain, of $38 million in 2010. Results of operations for Motors have been reclassified into discontinued operations for 2010 and prior. LANDesk (acquired with Avocent in 2010) was sold in the fourth quarter of 2010 for proceeds of approximately $230 million, resulting in an after-tax gain of $12 million ($10 million of income taxes). LANDesk was classified as discontinued operations throughout 2010.
Income from discontinued operations in 2011 included only the fourth quarter operating results and gain on disposition for heating elements. Income from discon-tinued operations in 2010 reflected the Motors and LANDesk divestitures and included both operating results for the year and the gains on disposition. See Acquisitions and Divestitures discussion in Note 3 for additional information regarding discontinued operations.
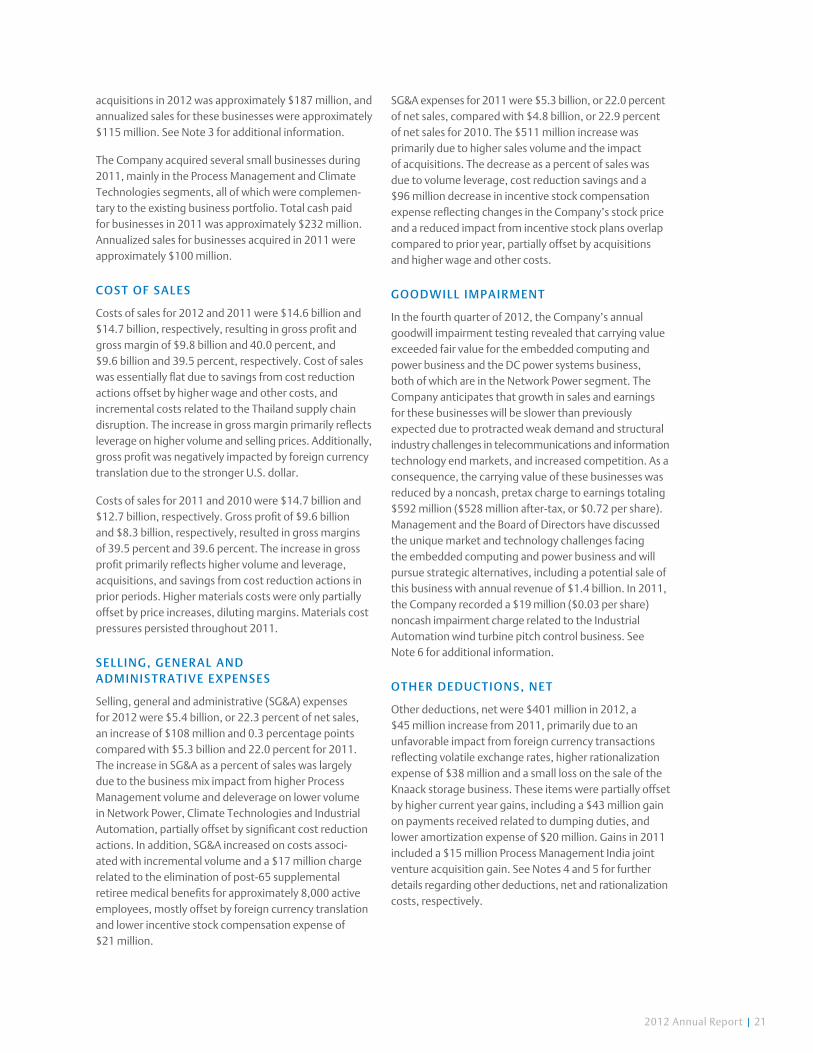
net ea R n InGS (Dollars in billions)
* Excludes charges of $528 million in 2012; $19 million in 2011.
08
$2.4
12111009
$1.7
$2.2
$2.5*$2.5*
BIllIOn net eaRnInGS In 2012
1211
$2.5*
$2.0
2012 Annual Report | 23
net eaRnInGS, R et u R n On equ It Y a nD RetuRn On t Ot a l C a PIt a l
Net earnings attributable to common stockholders in 2012 were $2.0 billion, a decrease of 21 percent compared with 2011. Net earnings per share of $2.67 decreased 18 percent. Net earnings and net earnings per share for 2012 were reduced 21 percent primarily due to the $528 million after-tax, $0.72 per share, goodwill impairment charge. Return on common stockholders’ equity (net earnings attributable to common stockholders divided by average common stockholders’ equity) was 19.0 percent in 2012 compared with 24.6 percent in 2011. Return on total capital was 15.8 percent in 2012 compared with 19.6 percent in 2011, and is computed as net earnings attributable to common stockholders excluding after-tax net interest expense, divided by average common stockholders’ equity plus short- and long-term debt less cash and short-term investments. The charge reduced 2012 return on equity 5 percentage points and return on total capital 4 percentage points.
Net earnings were $2.5 billion and net earnings per share were $3.27 for 2011, both increases of 15 percent compared with 2010. Net earnings as a percent of net sales were 10.2 percent in 2011 and 10.3 percent in 2010. Return on common stockholders’ equity was 24.6 percent in 2011 compared with 23.6 percent in 2010. Return on total capital was 19.6 percent in 2011 compared with 18.9 percent in 2010.
Business SegmentsFollowing is an analysis of segment results for 2012 compared with 2011, and 2011 compared with 2010.
The Company defines segment earnings as earnings before interest and income taxes. The Commercial & Residential Solutions segment was formerly named Tools and Storage.
PROCeSS Ma na G eMent
change change(dollarsinmillions) 2010 2011 2012 ‘10-‘11 ‘11 - ‘12
Sales $6,022 7,000 7,899 16% 13%
Earnings $1,093 1,402 1,599 28% 14%
Margin 18.1% 20.0% 20.2%
2012 vs. 2011 – Process Management sales increased $899 million to $7.9 billion as all businesses reported higher sales. Strong growth in the measurement and flow, valves and regulators, and systems and solutions businesses was driven by solid global oil and gas invest-ment and demand in the chemical and power end markets. The supply chain disruption from Thailand flooding that adversely affected results of several busi-nesses in the first half of the year was resolved and nearly all of the volume was recovered in the second half. Under-lying sales increased 15 percent on volume growth while foreign currency translation had a 2 percent ($135 million) unfavorable impact. Geographically, underlying sales increased in all regions, including 18 percent in the United States, 13 percent in Asia, 9 percent in Europe, 28 percent in Latin America, 16 percent in Middle East/Africa and 14 percent in Canada. Earnings increased $197 million, to $1,599 million, on higher volume and leverage. Margin increased slightly as benefits from volume, leverage and cost reduction actions were partially offset by approximately $30 million of incremental costs related to Thailand flooding, a $44 million unfavorable impact from foreign currency transactions, and higher wages and other costs.
2011 vs. 2010 – Process Management sales were $7.0 billion in 2011, an increase of $978 million as all busi-nesses reported higher sales, led by very strong results
for the measurement and flow, valves, and systems and solutions businesses as a result of growth in the oil and gas, chemical, power and refining end markets. Under-lying sales increased 14 percent on higher volume, which included some market penetration gains, and foreign currency translation had a 2 percent ($120 million) favorable impact. Underlying sales increased in all major geographic regions, including the United States (14 percent), Asia (18 percent), Europe (8 percent),
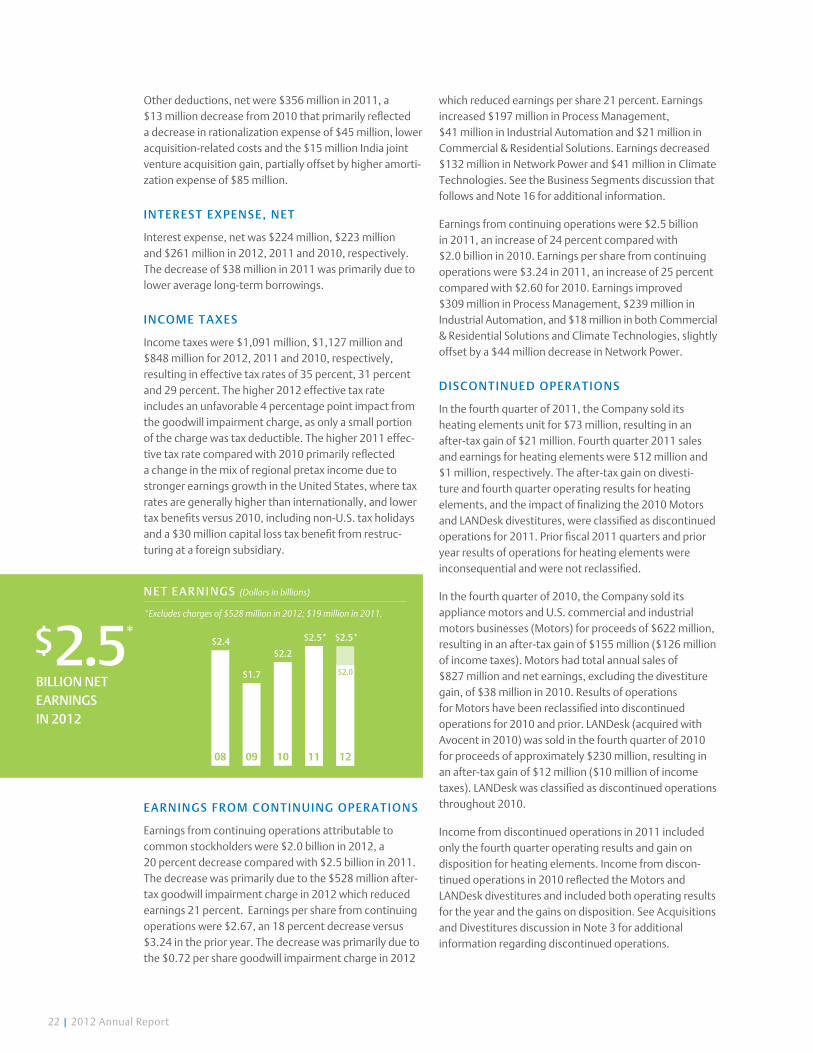
net eaRnI nGS PeR S HaRe*
* Excludes charges of $0.72 per share in 2012; $0.03 in 2011.
$3.06
08 12111009
$2.27
$2.84
$3.30* $3.39* 3%*
InCReaSe net eaRnInGS PeR SHaRe
1211
$3.27
$2.67
24 | 2012 Annual Report
Canada (38 percent), Latin America (15 percent) and Middle East/Africa (7 percent). Earnings increased 28 percent, to $1,402 million, and margin increased approximately 2 percentage points, primarily due to higher sales volume and resulting leverage, savings from prior period cost reductions, $24 million lower rational-ization expense, and an $8 million favorable impact from foreign currency transactions compared to prior year, partially offset by increased business development invest-ments, wages and other costs.
Indu st r Ia l a u t om a t Ion
change change(dollarsinmillions) 2010 2011 2012 ‘10-‘11 ‘11 - ‘12
Sales $4,289 5,294 5,188 23% (2)%
Earnings $ 591 830 871 40% 5 %
Margin 13.8% 15.7% 16.8%
2012 vs. 2011 – Industrial Automation sales decreased $106 million to $5.2 billion in 2012, reflecting solid growth in the electrical distribution and ultrasonic welding businesses offset by decreases in the electrical drives, solar and wind power, and power generating alternators and industrial motors businesses. First half softness in hermetic motors due to a global decline in compressor demand also affected results. Underlying
sales grew 1 percent, reflecting an estimated 3 percent benefit from price and 2 percent lower volume, while unfavorable foreign currency translation deducted 3 percent ($140 million). Underlying sales increased 3 percent in the United States, 6 percent in Latin America and 4 percent in Canada, while sales decreased 1 percent in Europe. Sales in Asia were flat (China down 3 percent). Earnings of $871 million were up $41 million and margin increased 1.1 percentage points, reflecting a $43 million gain on payments received by the power transmission
business related to dumping duties (see Note 4). Opera-tionally, pricing and cost reduction benefits were largely offset by lower volume and resulting deleverage, and higher materials and other costs.
2011 vs. 2010 – Industrial Automation sales increased $1,005 million to $5.3 billion in 2011, reflecting improve-ment in the capital goods end markets. Sales increased in all businesses led by very strong growth in the power generating alternators, fluid automation, electrical drives and power transmission businesses. Underlying sales increased 21 percent and foreign currency translation had a 2 percent ($92 million) favorable impact. The under-lying sales growth reflected approximately 18 percent higher volume and an estimated 3 percent benefit from higher selling prices. Underlying sales increased in all regions, including 19 percent in the United States, 21 percent in both Europe and Asia, 49 percent in Middle East/Africa and 36 percent in Latin America. Earnings increased $239 million, to $830 million, and margin increased approximately 2 percentage points, reflecting higher sales volume and resulting leverage, savings from prior period cost reductions, and lower rationaliza-tion costs of $16 million, slightly offset by a $9 million unfavorable impact from foreign currency transactions. Higher materials costs were substantially offset by higher selling prices.
network power
change change(dollarsinmillions) 2010 2011 2012 ‘10-‘11 ‘11 - ‘12
Sales $5,828 6,811 6,399 17 % (6)%
Earnings $ 800 756 624 (6)% (17)%
Margin 13.7% 11.1% 9.7%
2012 vs. 2011 – Sales for Network Power were $6.4 billion in 2012, a $412 million decrease reflecting protracted weakness in telecommunications and information technology end markets and product rationalization in the embedded computing and power business. A modest sales decrease in the network power systems business reflects weak demand in Europe and North America uninterruptible power supplies, data center infrastructure management products, and North America telecommunications-related DC power systems. This decrease was partially offset by strong growth in Asia, including the National Broadband Network contract in Australia, and modest growth in Latin America. Total sales decreased 6 percent, reflecting an underlying sales decrease of 5 percent on lower volume and a 1 percent ($83 million) unfavorable impact from foreign currency translation, while the Avtron acquisition had a $27 million
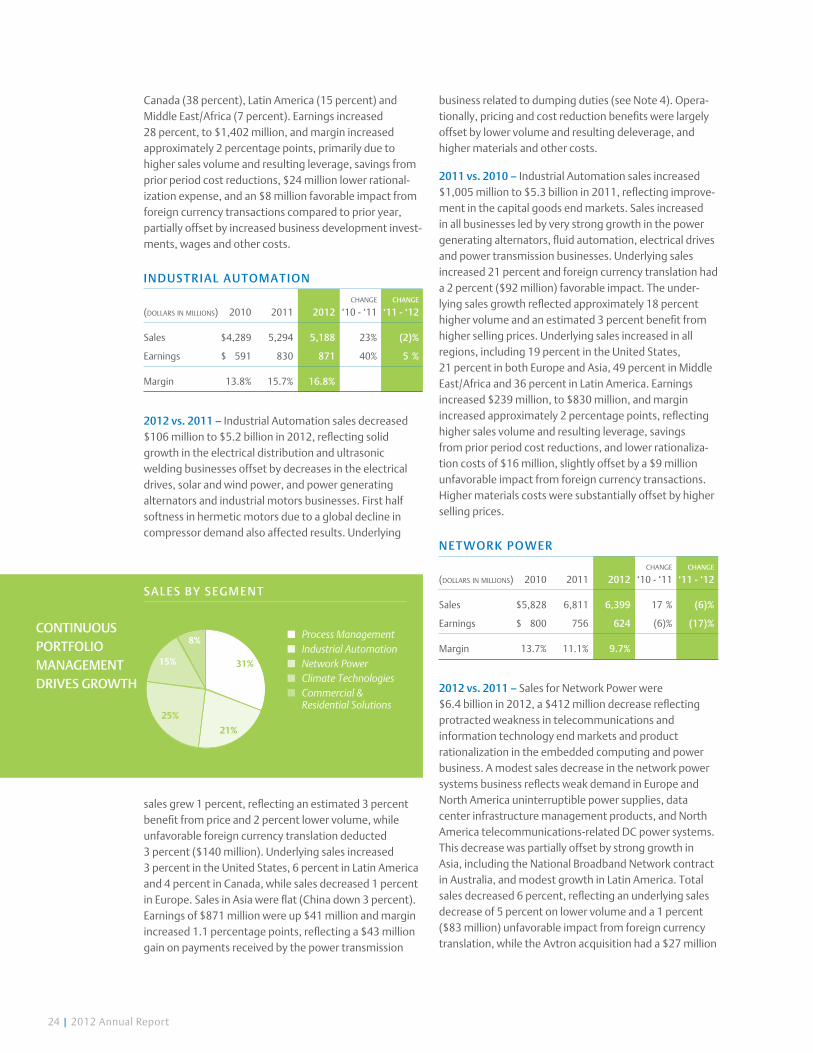
sales by segm ent
25%
21%
15%
8%
31%
n Process Managementn Industrial Automationn Network Powern Climate Technologiesn Commercial &
Residential Solutions
ContInuous portFolIo management drIVes growtH

2012 Annual Report | 25
favorable impact. Geographically, underlying sales decreased 10 percent in both the United States and Europe and 2 percent in Latin America, while sales increased 2 percent in Asia (down 4 percent in China) and 5 percent in Canada. Earnings of $624 million decreased $132 million and margin decreased 1.4 percentage points primarily due to lower volume and resulting deleverage, particularly in the embedded computing and power business, partially offset by cost reductions and materials cost containment. Segment margin was also affected by higher labor-related costs, unfavorable product mix, higher rationalization expense of $33 million and a $10 million unfavorable impact from foreign currency transactions. Additionally, Chloride acquisition-related costs were $24 million in 2011.
2011 vs. 2010 – Sales for Network Power increased $983 million to $6.8 billion, on underlying sales growth of 6 percent, a positive contribution from the Chloride and Avocent acquisitions of 10 percent ($598 million) and favorable foreign currency translation of 1 percent ($77 million). Led by strong results in the network power systems business worldwide, underlying sales grew 7 percent on higher volume, less an estimated 1 percent decline in pricing. Growth was strong in the North American uninterruptible power supply and precision cooling business and the embedded computing and power business. Underlying sales increased 6 percent in Asia, 3 percent in the United States, 19 percent in Latin America, 5 percent in Europe and 40 percent in Middle East/Africa. Earnings decreased $44 million to $756 million, and margin decreased 2.6 percentage points. Amortization of intangibles increased $67 million due to the Chloride and Avocent acquisitions, and other Chloride acquisition-related costs negatively impacted earnings $24 million. Margin was also reduced by higher labor-related costs in China, unfavorable product mix, higher materials cost, aggressive competitive pricing in the China telecommunications sector, and investment spending on next-generation data center technologies. Earnings benefited from volume leverage and savings from prior period cost reductions.
ClIMate teC H nOlOG IeS
change change(dollarsinmillions) 2010 2011 2012 ‘10-‘11 ‘11 - ‘12
Sales $3,801 3,995 3,766 5% (6)%
Earnings $ 691 709 668 3% (6)%
Margin 18.2% 17.8% 17.7%
2012 vs. 2011 – Climate Technologies sales decreased $229 million in 2012 to $3.8 billion. Sales decreased in the air conditioning, temperature controls and tempera-ture sensors businesses as global softness in residential markets and overall weakness in Europe adversely affected results. Air conditioning sales decreased in North America, China and Europe, slightly offset by growth in the rest of Asia (excluding China). Refrigeration sales were down significantly in Europe and Asia, partially offset by slight growth in the U.S. Underlying sales decreased 5 percent, including 7 percent lower volume, slightly offset by approximately 2 percent from price. Foreign currency had a 1 percent ($42 million) unfavorable impact and the marine controls acquisition had a negligible contribution ($21 million). Underlying sales decreased 4 percent in the United States, 10 percent in Asia (down 18 percent in China) and 9 percent in Europe, while sales increased 14 percent in Latin America and 3 percent in Canada. Earnings decreased $41 million on lower volume, while the margin was essentially flat as the impact of deleverage was minimized through savings from cost reduction actions and lower warranty costs. Price actions were offset by higher materials and other costs.
2011 vs. 2010 – Climate Technologies reported sales of $4.0 billion for 2011, a $194 million increase that reflected a strong increase in the compressor business, partially offset by share loss in the temperature controls business and a decrease in the temperature sensors business. The North American refrigeration and air conditioning end markets experienced solid growth while results in Asia were strong despite prior year growth that benefited from stimulus programs in China. Sales growth reflected a 3 percent underlying increase, including an estimated 2 percent from higher selling prices and approximately 1 percent from higher volume, a 1 percent ($42 million) favorable impact from foreign currency translation and a 1 percent ($28 million) positive contribution from acquisitions. Underlying sales increased 7 percent inter-nationally, including 7 percent in Asia, 26 percent in Latin America and 3 percent in Europe, while sales were flat in the United States due to the decline in the temperature controls business. Earnings increased 3 percent to $709 million, due to savings from prior period cost reduc-tions and higher sales volume in the compressor business. The margin was diluted by higher materials and other costs, which were partially offset by higher selling prices, and deleverage in the temperature controls business.
26 | 2012 Annual Report
COMM eR C Ia l & R eSID ent Ia l SOl utI OnS
change change(dollarsinmillions) 2010 2011 2012 ‘10-‘11 ‘11 - ‘12
Sales $1,755 1,837 1,877 5% 2%
Earnings $ 357 375 396 5% 6%
Margin 20.3% 20.4% 21.1%
2012 vs. 2011 – Commercial & Residential Solutions sales increased $40 million to $1.9 billion in 2012, reflecting a 6 percent ($103 million) increase in underlying sales, partially offset by an unfavorable 4 percent ($63 million) combined impact from the 2012 Knaack storage business and 2011 heating elements divestitures. Underlying sales growth reflects 4 percent higher volume and an estimated 2 percent from price. The sales increase was led by strong growth in both the storage and food waste disposers businesses and moderate growth in the profes-sional tools business, partially offset by a slight decrease in the wet/dry vacuums business. Underlying sales increased 4 percent in the United States and 9 percent internationally. Earnings of $396 million were up $21 million compared to the prior year. Higher volume and leverage increased margin 0.7 percentage points as pricing and cost containment actions were partially offset by higher materials, litigation and other costs, and unfavorable product mix. Earnings were also affected
by a $7 million unfavorable comparison with prior year from the divested heating elements business.
2011 vs. 2010 – Sales for Commercial & Residential Solutions were $1.8 billion in 2011, an $82 million increase. Sales growth reflected an underlying increase of 5 percent, including approximately 4 percent from higher volume and an estimated 1 percent from higher selling prices, and favorable foreign currency translation
of 1 percent ($13 million), partially offset by a nega-tive 1 percent ($21 million) impact from the heating elements unit divestiture. The sales increase was led by very strong growth in the professional tools and commercial storage businesses and modest growth in the food waste disposers business, partially offset by decreases in the consumer-related wet/dry vacuums and residential storage businesses due to continued weak U.S. residential construction markets. Underlying sales increased 5 percent in the United States and 11 percent internationally. Earnings for 2011 were $375 million, an increase of $18 million, reflecting earnings growth in the professional tools business partially offset by lower earnings in the wet/dry vacuums, residential storage and food waste disposers businesses. Margin increased on higher sales volume and resulting leverage in the profes-sional tools business as well as savings from prior period cost reductions, largely offset by higher freight costs and unfavorable product mix. Higher materials costs were substantially offset by price increases.
Financial Position, Capital Resources and liquidityThe Company continues to generate substantial cash from operations, is in a strong financial position with total assets of $24 billion and common stockholders’ equity of $10 billion, and has the resources available to reinvest for growth in existing businesses, pursue strategic acquisi-tions and manage its capital structure on a short- and long-term basis.
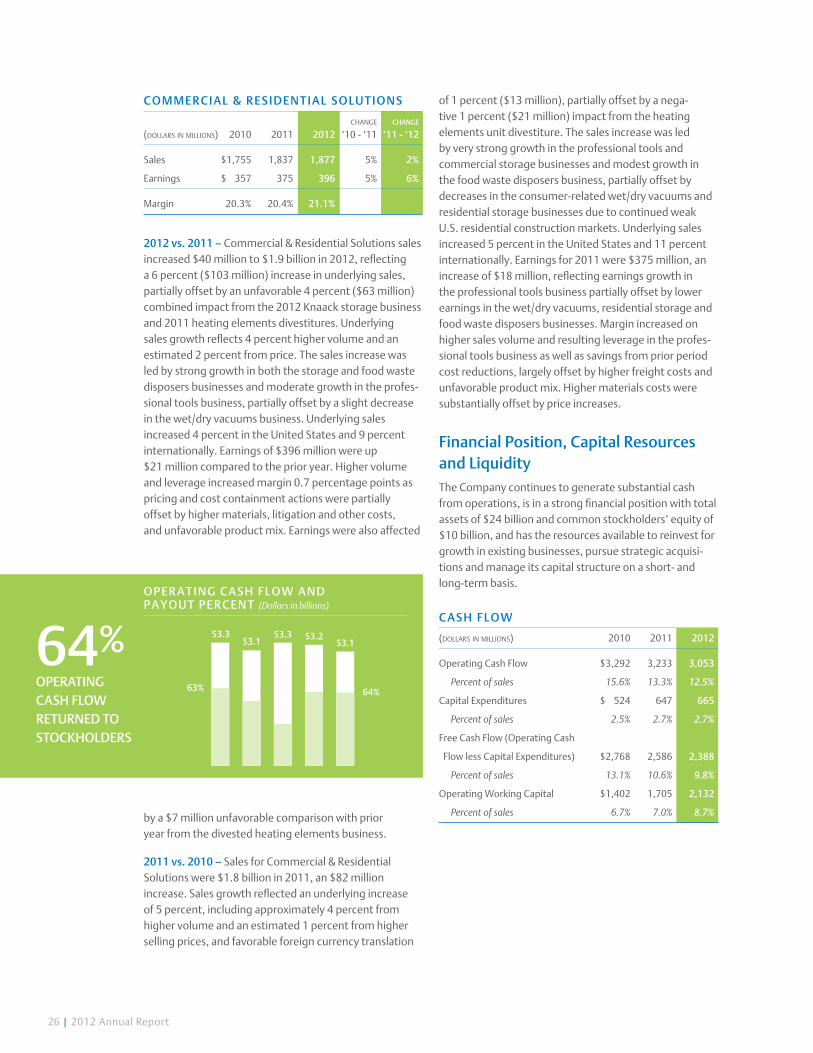
CaS H Fl Ow
(dollarsinmillions) 2010 2011 2012
Operating Cash Flow $3,292 3,233 3,053
Percent of sales 15.6% 13.3% 12.5%
Capital Expenditures $ 524 647 665
Percent of sales 2.5% 2.7% 2.7%
Free Cash Flow (Operating Cash
Flow less Capital Expenditures) $2,768 2,586 2,388
Percent of sales 13.1% 10.6% 9.8%
Operating Working Capital $1,402 1,705 2,132
Percent of sales 6.7% 7.0% 8.7%
08
$3.3
12111009
$3.1$3.3 $3.2
$3.1
63% 64%
OPeR a t InG C a SH F lOw a nD PaYOu t PeR C ent (Dollars in billions)
64%OPeRatInG CaSH FlOwRetuRneD tOStOCKHOlDeRS
2012 Annual Report | 27
Emerson generated operating cash flow of $3.1 billion in 2012, a 6 percent decrease compared to 2011, primarily reflecting an increase in operating working capital. Oper-ating cash flow of $3.2 billion in 2011 was a 2 percent decrease compared to $3.3 billion in 2010, reflecting an increase in operating working capital partially offset by higher net earnings. At September 30, 2012, operating working capital as a percent of sales was 8.7 percent, compared with 7.0 percent and 6.7 percent in 2011 and 2010, respectively. Operating working capital as a percent of sales increased in 2012 amidst the challenging operating environment due to volatility of served markets and the supply chain disruption. Pension contributions were $163 million, $142 million and $247 million in 2012, 2011 and 2010, respectively. Operating cash flow fully funded capital expenditures, dividends and share repurchases in all years presented and also fully funded acquisitions in 2012 and 2011.
Capital expenditures were $665 million, $647 million and $524 million in 2012, 2011 and 2010, respectively. The increase in capital expenditures in 2011 was primarily due to capacity expansion in the Process Management and Industrial Automation segments. Free cash flow decreased 8 percent to $2.4 billion in 2012, reflecting an increase in operating working capital and slightly higher capital expenditures. Free cash flow was $2.6 billion in 2011, compared with $2.8 billion in 2010, primarily reflecting the higher capital expenditures in 2011. The Company is targeting capital spending of approximately $700 million in 2013. Net cash paid in connection with acquisitions was $187 million, $232 million and $2,843 million in 2012, 2011 and 2010, respectively. Proceeds from divestitures in those years were $125 million, $103 million and $846 million, respectively.
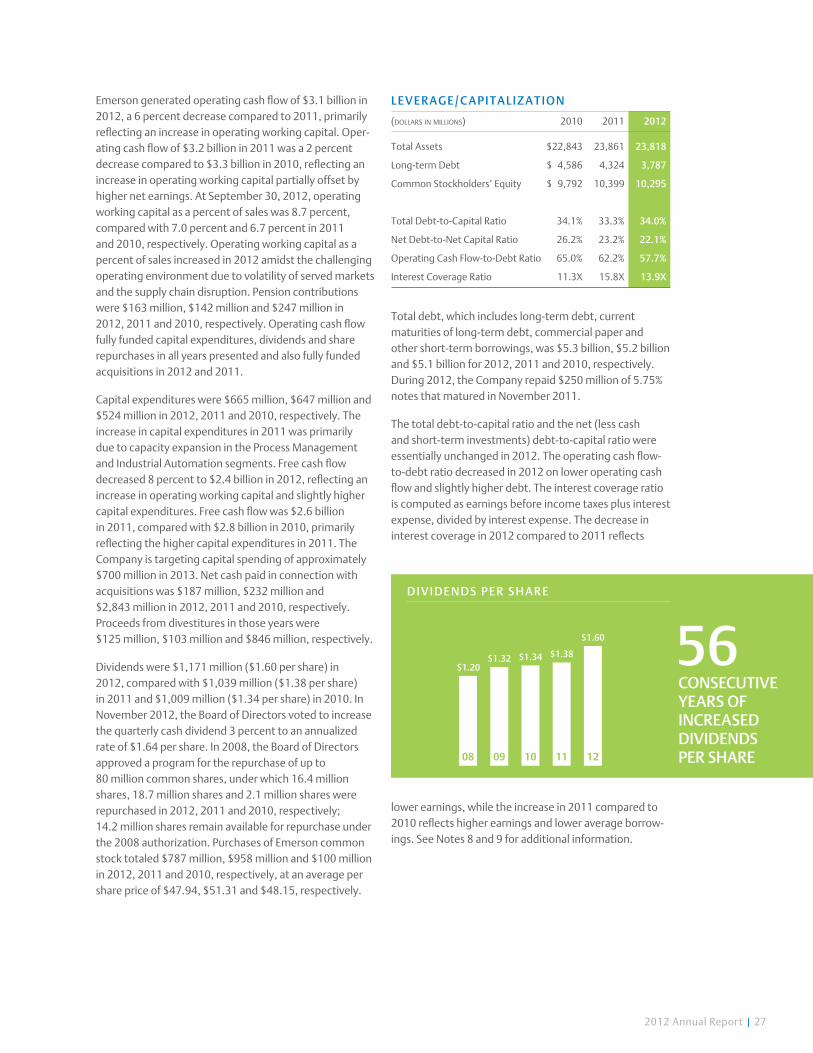
Dividends were $1,171 million ($1.60 per share) in 2012, compared with $1,039 million ($1.38 per share) in 2011 and $1,009 million ($1.34 per share) in 2010. In November 2012, the Board of Directors voted to increase the quarterly cash dividend 3 percent to an annualized rate of $1.64 per share. In 2008, the Board of Directors approved a program for the repurchase of up to 80 million common shares, under which 16.4 million shares, 18.7 million shares and 2.1 million shares were repurchased in 2012, 2011 and 2010, respectively; 14.2 million shares remain available for repurchase under the 2008 authorization. Purchases of Emerson common stock totaled $787 million, $958 million and $100 million in 2012, 2011 and 2010, respectively, at an average per share price of $47.94, $51.31 and $48.15, respectively.
l eveRaGe/CaPI tal I z atI On
(dollarsinmillions) 2010 2011 2012
Total Assets $22,843 23,861 23,818
Long-term Debt $ 4,586 4,324 3,787
Common Stockholders’ Equity $ 9,792 10,399 10,295
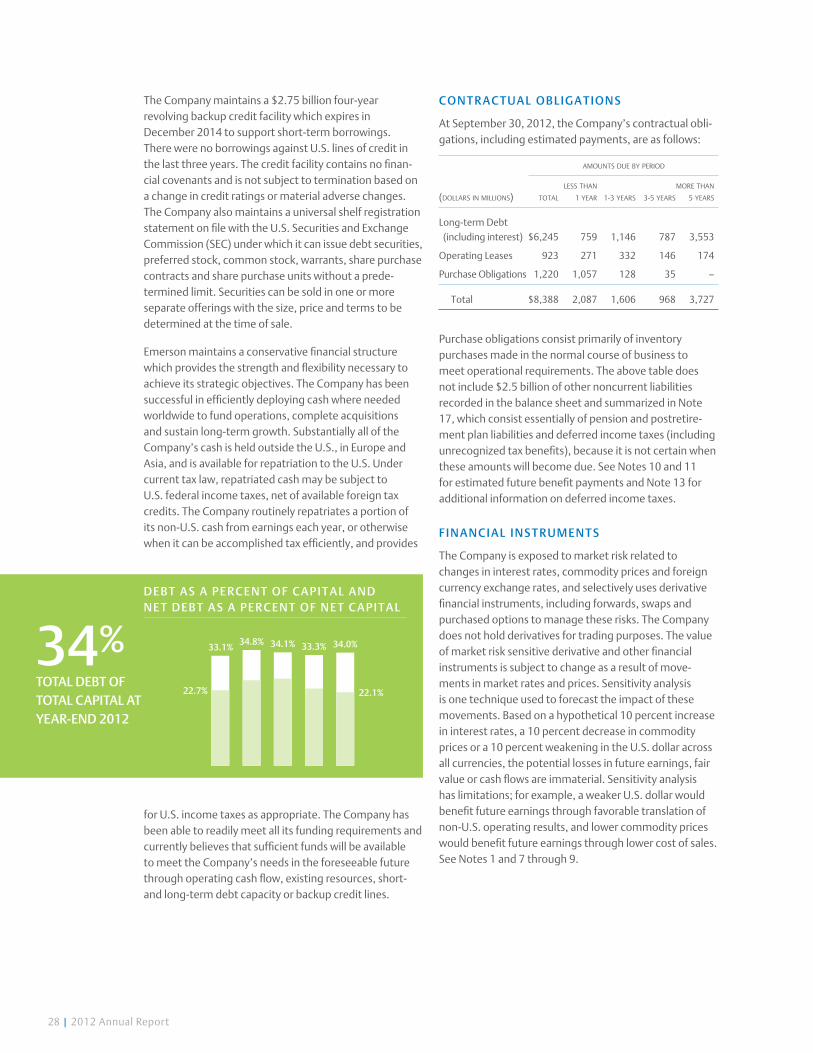
Total Debt-to-Capital Ratio 34.1% 33.3% 34.0%
Net Debt-to-Net Capital Ratio 26.2% 23.2% 22.1%
Operating Cash Flow-to-Debt Ratio 65.0% 62.2% 57.7%
Interest Coverage Ratio 11.3X 15.8X 13.9X
Total debt, which includes long-term debt, current maturities of long-term debt, commercial paper and other short-term borrowings, was $5.3 billion, $5.2 billion and $5.1 billion for 2012, 2011 and 2010, respectively. During 2012, the Company repaid $250 million of 5.75% notes that matured in November 2011.
The total debt-to-capital ratio and the net (less cash and short-term investments) debt-to-capital ratio were essentially unchanged in 2012. The operating cash flow-to-debt ratio decreased in 2012 on lower operating cash flow and slightly higher debt. The interest coverage ratio is computed as earnings before income taxes plus interest expense, divided by interest expense. The decrease in interest coverage in 2012 compared to 2011 reflects
lower earnings, while the increase in 2011 compared to 2010 reflects higher earnings and lower average borrow-ings. See Notes 8 and 9 for additional information.
$1.20
08 12111009
$1.32 $1.34 $1.38
$1.60 56COnSeCutIveYeaRS OFInCReaSeDDIvIDenDS PeR SHaRe
DI vI DenDS PeR S HaRe
28 | 2012 Annual Report
The Company maintains a $2.75 billion four-year revolving backup credit facility which expires in December 2014 to support short-term borrowings. There were no borrowings against U.S. lines of credit in the last three years. The credit facility contains no finan-cial covenants and is not subject to termination based on a change in credit ratings or material adverse changes. The Company also maintains a universal shelf registration statement on file with the U.S. Securities and Exchange Commission (SEC) under which it can issue debt securities, preferred stock, common stock, warrants, share purchase contracts and share purchase units without a prede-termined limit. Securities can be sold in one or more separate offerings with the size, price and terms to be determined at the time of sale.
Emerson maintains a conservative financial structure which provides the strength and flexibility necessary to achieve its strategic objectives. The Company has been successful in efficiently deploying cash where needed worldwide to fund operations, complete acquisitions and sustain long-term growth. Substantially all of the Company’s cash is held outside the U.S., in Europe and Asia, and is available for repatriation to the U.S. Under current tax law, repatriated cash may be subject to U.S. federal income taxes, net of available foreign tax credits. The Company routinely repatriates a portion of its non-U.S. cash from earnings each year, or otherwise when it can be accomplished tax efficiently, and provides
for U.S. income taxes as appropriate. The Company has been able to readily meet all its funding requirements and currently believes that sufficient funds will be available to meet the Company’s needs in the foreseeable future through operating cash flow, existing resources, short- and long-term debt capacity or backup credit lines.
COntRaCtual OB l I GatI OnS
At September 30, 2012, the Company’s contractual obli-gations, including estimated payments, are as follows:
amountsduebyperiod
lessthan morethan(dollarsinmillions) total 1year 1-3years 3-5years 5years
Long-term Debt (including interest) $6,245 759 1,146 787 3,553
Operating Leases 923 271 332 146 174
Purchase Obligations 1,220 1,057 128 35 –
Total $8,388 2,087 1,606 968 3,727
Purchase obligations consist primarily of inventory purchases made in the normal course of business to meet operational requirements. The above table does not include $2.5 billion of other noncurrent liabilities recorded in the balance sheet and summarized in Note 17, which consist essentially of pension and postretire-ment plan liabilities and deferred income taxes (including unrecognized tax benefits), because it is not certain when these amounts will become due. See Notes 10 and 11 for estimated future benefit payments and Note 13 for additional information on deferred income taxes.
FI nanCI al I nS tRuMentS
The Company is exposed to market risk related to changes in interest rates, commodity prices and foreign currency exchange rates, and selectively uses derivative financial instruments, including forwards, swaps and purchased options to manage these risks. The Company does not hold derivatives for trading purposes. The value of market risk sensitive derivative and other financial instruments is subject to change as a result of move-ments in market rates and prices. Sensitivity analysis is one technique used to forecast the impact of these movements. Based on a hypothetical 10 percent increase in interest rates, a 10 percent decrease in commodity prices or a 10 percent weakening in the U.S. dollar across all currencies, the potential losses in future earnings, fair value or cash flows are immaterial. Sensitivity analysis has limitations; for example, a weaker U.S. dollar would benefit future earnings through favorable translation of non-U.S. operating results, and lower commodity prices would benefit future earnings through lower cost of sales. See Notes 1 and 7 through 9.
DeBt a S a PeR C en t OF C a PIt a l anD net D eBt a S a PeR C ent OF n et CaPI tal
08
33.1%
12111009
34.8% 34.1% 33.3% 34.0%
22.7% 22.1%
34%tOtal DeBt OF tOtal CaPItal at YeaR-enD 2012
2012 Annual Report | 29
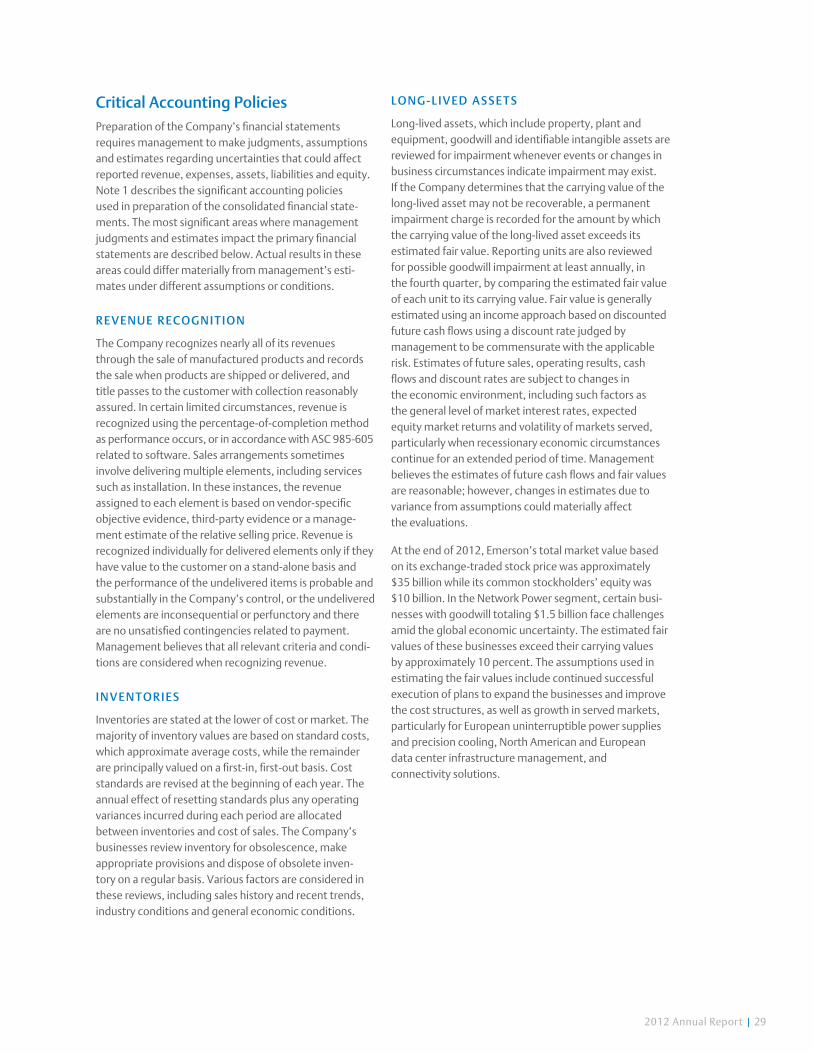
Critical accounting PoliciesPreparation of the Company’s financial statements requires management to make judgments, assumptions and estimates regarding uncertainties that could affect reported revenue, expenses, assets, liabilities and equity. Note 1 describes the significant accounting policies used in preparation of the consolidated financial state-ments. The most significant areas where management judgments and estimates impact the primary financial statements are described below. Actual results in these areas could differ materially from management’s esti-mates under different assumptions or conditions.
Revenue ReC OG n It IOn
The Company recognizes nearly all of its revenues through the sale of manufactured products and records the sale when products are shipped or delivered, and title passes to the customer with collection reasonably assured. In certain limited circumstances, revenue is recognized using the percentage-of-completion method as performance occurs, or in accordance with ASC 985-605 related to software. Sales arrangements sometimes involve delivering multiple elements, including services such as installation. In these instances, the revenue assigned to each element is based on vendor-specific objective evidence, third-party evidence or a manage-ment estimate of the relative selling price. Revenue is recognized individually for delivered elements only if they have value to the customer on a stand-alone basis and the performance of the undelivered items is probable and substantially in the Company’s control, or the undelivered elements are inconsequential or perfunctory and there are no unsatisfied contingencies related to payment. Management believes that all relevant criteria and condi-tions are considered when recognizing revenue.
InventORIeS
Inventories are stated at the lower of cost or market. The majority of inventory values are based on standard costs, which approximate average costs, while the remainder are principally valued on a first-in, first-out basis. Cost standards are revised at the beginning of each year. The annual effect of resetting standards plus any operating variances incurred during each period are allocated between inventories and cost of sales. The Company’s businesses review inventory for obsolescence, make appropriate provisions and dispose of obsolete inven-tory on a regular basis. Various factors are considered in these reviews, including sales history and recent trends, industry conditions and general economic conditions.
l OnG- l I veD aS S etS
Long-lived assets, which include property, plant and equipment, goodwill and identifiable intangible assets are reviewed for impairment whenever events or changes in business circumstances indicate impairment may exist. If the Company determines that the carrying value of the long-lived asset may not be recoverable, a permanent impairment charge is recorded for the amount by which the carrying value of the long-lived asset exceeds its estimated fair value. Reporting units are also reviewed for possible goodwill impairment at least annually, in the fourth quarter, by comparing the estimated fair value of each unit to its carrying value. Fair value is generally estimated using an income approach based on discounted future cash flows using a discount rate judged by management to be commensurate with the applicable risk. Estimates of future sales, operating results, cash flows and discount rates are subject to changes in the economic environment, including such factors as the general level of market interest rates, expected equity market returns and volatility of markets served, particularly when recessionary economic circumstances continue for an extended period of time. Management believes the estimates of future cash flows and fair values are reasonable; however, changes in estimates due to variance from assumptions could materially affect the evaluations.
At the end of 2012, Emerson’s total market value based on its exchange-traded stock price was approximately $35 billion while its common stockholders’ equity was $10 billion. In the Network Power segment, certain busi-nesses with goodwill totaling $1.5 billion face challenges amid the global economic uncertainty. The estimated fair values of these businesses exceed their carrying values by approximately 10 percent. The assumptions used in estimating the fair values include continued successful execution of plans to expand the businesses and improve the cost structures, as well as growth in served markets, particularly for European uninterruptible power supplies and precision cooling, North American and European data center infrastructure management, and connectivity solutions.

30 | 2012 Annual Report
RetI R eMent Pla n S
While the Company continues to focus on a prudent long-term investment strategy for its pension-related assets, the calculations of defined benefit plan expense and obligations are dependent on assumptions made, including the expected annual rate of return on plan assets, the discount rate and the rate of annual compensation increases. Management believes that the assumptions used are appropriate, however, actual experience may vary. In accordance with U.S. generally accepted accounting principles, actual results that differ from the assumptions are accumulated as deferred actuarial gains or losses and amortized in future periods. As of September 30, 2012, pension plans were underfunded by a total of $818 million (which includes $353 million of unfunded plans). The Company contributed $163 million to defined benefit plans in 2012 and expects to contribute approximately $150 million in 2013. For 2012 the discount rate for U.S. plans was 4.0 percent and the assumed investment return on plan assets was 7.75 percent, compared with 4.75 percent and 8.0 percent, respectively, in 2011. Deferred actuarial losses, which will be amortized into earnings in future years, were $1,982 million ($1,275 million after-tax) as of September 30, 2012. Defined benefit pension plan expense for 2013 is expected to be approximately $230 million, up from $173 million in 2012. See Notes 10 and 11.
InCOM e t a xeS
Income tax expense and tax assets and liabilities reflect management’s assessment of taxes paid or expected to be paid (received) on items included in the financial state-ments. Uncertainty exists regarding tax positions taken in previously filed tax returns still under examination and positions expected to be taken in future returns. Deferred tax assets and liabilities arise because of temporary differences between the consolidated financial state-ment carrying amounts of existing assets and liabilities and their respective tax bases, and operating loss and tax credit carryforwards. Deferred income taxes are measured using enacted tax rates in effect for the year in which the temporary differences are expected to be recovered or settled. The impact on deferred tax assets and liabilities of a change in tax rates is recognized in the period that includes the enactment date. The Company also pays U.S. federal income taxes, net of available foreign tax credits, on cash repatriated from non-U.S. locations. No provision is made for U.S. income taxes on the undistributed earnings of non-U.S. subsidiaries where these earnings are considered permanently invested or otherwise indefinitely retained for continuing interna-tional operations. Determination of the amount of taxes that might be paid on these undistributed earnings if eventually remitted is not practicable. See Notes 1 and 13.
new aCCOuntI nG PROnOunCeMentS
In June 2011, the FASB issued updates to ASC 220, Comprehensive Income, eliminating the option to present other comprehensive income in the statement of equity. These updates require an entity to present comprehen-sive income as part of one continuous financial statement that includes net earnings and other comprehensive income or as a separate financial statement immediately following the statement of earnings. There is no change to the items to be reported in other comprehensive income or when those items should be reclassified into net earnings. These updates are effective for the first quarter of fiscal 2013. Adoption will affect presentation only; there is no expected impact on the Company’s financial results.
2012 Annual Report | 31
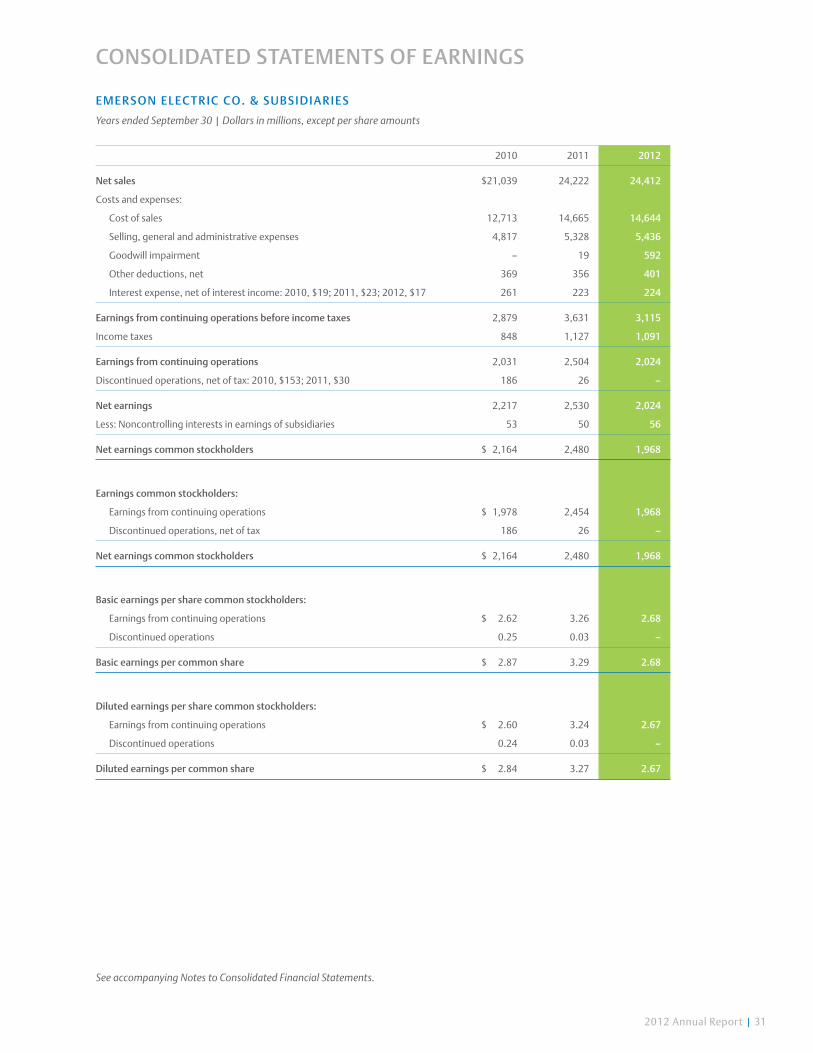
2010 2011 2012
Net sales $21,039 24,222 24,412
Costs and expenses:
Cost of sales 12,713 14,665 14,644
Selling, general and administrative expenses 4,817 5,328 5,436
Goodwill impairment – 19 592
Other deductions, net 369 356 401
Interest expense, net of interest income: 2010, $19; 2011, $23; 2012, $17 261 223 224
Earnings from continuing operations before income taxes 2,879 3,631 3,115
Income taxes 848 1,127 1,091
Earnings from continuing operations 2,031 2,504 2,024
Discontinued operations, net of tax: 2010, $153; 2011, $30 186 26 –
Net earnings 2,217 2,530 2,024
Less: Noncontrolling interests in earnings of subsidiaries 53 50 56
Net earnings common stockholders $ 2,164 2,480 1,968
Earnings common stockholders:
Earnings from continuing operations $ 1,978 2,454 1,968
Discontinued operations, net of tax 186 26 –
Net earnings common stockholders $ 2,164 2,480 1,968
Basic earnings per share common stockholders:
Earnings from continuing operations $ 2.62 3.26 2.68
Discontinued operations 0.25 0.03 –
Basic earnings per common share $ 2.87 3.29 2.68
Diluted earnings per share common stockholders:
Earnings from continuing operations $ 2.60 3.24 2.67
Discontinued operations 0.24 0.03 –
Diluted earnings per common share $ 2.84 3.27 2.67
EmErsoN ElEc t r ic c o. & su BsiD ia r iEs
Years ended September 30 | Dollars in millions, except per share amounts
See accompanying Notes to Consolidated Financial Statements.
coNsoliDatED statEmENts of EarNiNgs
32 | 2012 Annual Report
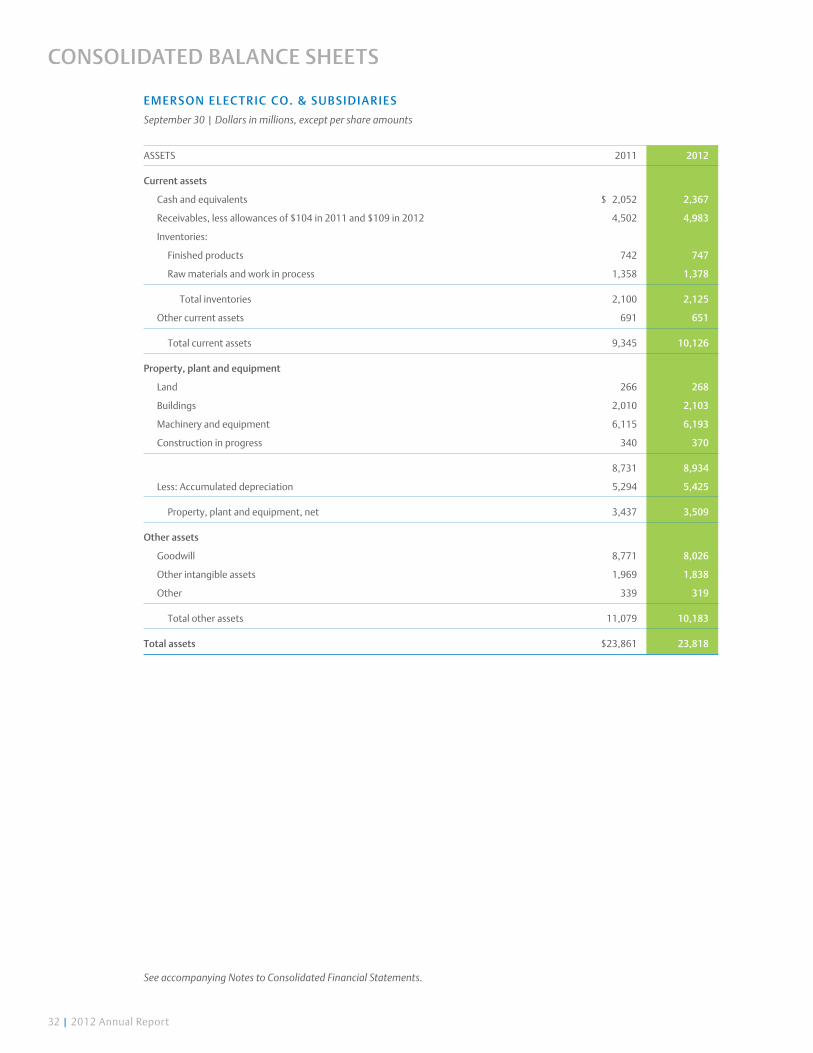
ASSETS 2011 2012
current assets
Cash and equivalents $ 2,052 2,367
Receivables, less allowances of $104 in 2011 and $109 in 2012 4,502 4,983
Inventories:
Finished products 742 747
Raw materials and work in process 1,358 1,378
Total inventories 2,100 2,125
Other current assets 691 651
Total current assets 9,345 10,126
Property, plant and equipment
Land 266 268
Buildings 2,010 2,103
Machinery and equipment 6,115 6,193
Construction in progress 340 370
8,731 8,934
Less: Accumulated depreciation 5,294 5,425
Property, plant and equipment, net 3,437 3,509
other assets
Goodwill 8,771 8,026
Other intangible assets 1,969 1,838
Other 339 319
Total other assets 11,079 10,183
total assets $23,861 23,818
EmErsoN ElEc t r ic c o. & su Bs i Di ari Es
September 30 | Dollars in millions, except per share amounts
coNsoliDatED BalaNcE shEEts
See accompanying Notes to Consolidated Financial Statements.
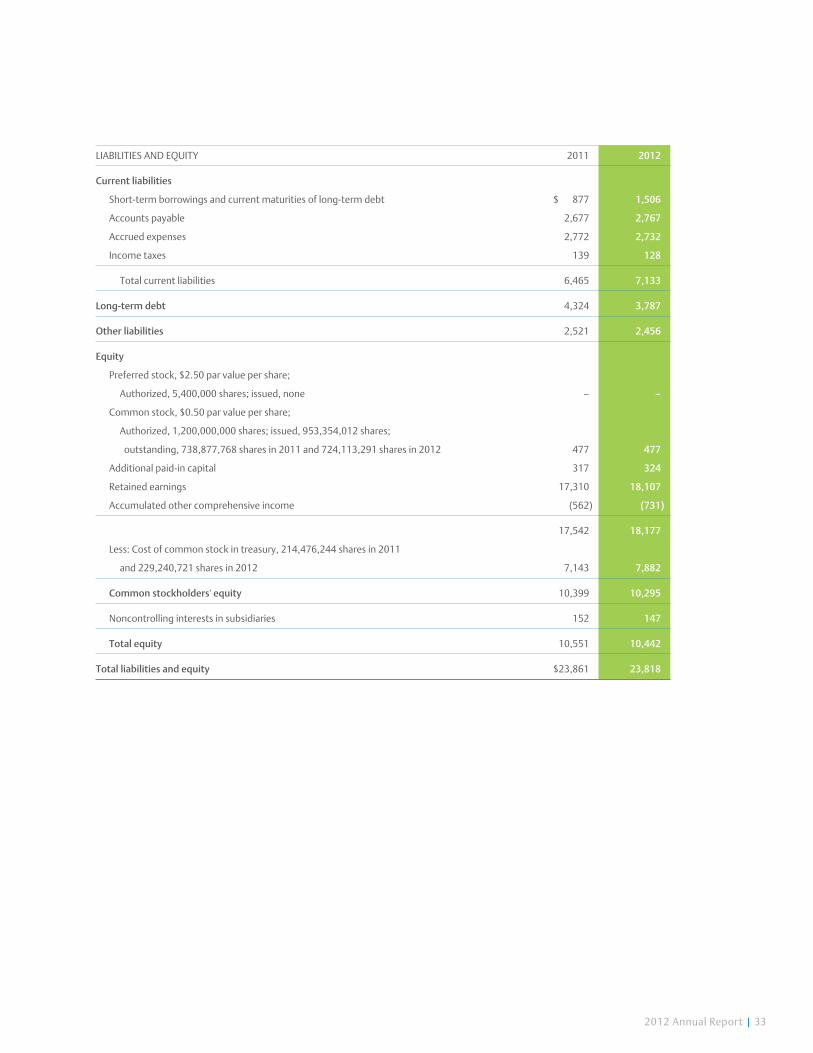
2012 Annual Report | 33
LIABILITIESANDEQUITY 2011 2012
current liabilities
Short-term borrowings and current maturities of long-term debt $ 877 1,506
Accounts payable 2,677 2,767
Accrued expenses 2,772 2,732
Income taxes 139 128
Total current liabilities 6,465 7,133
long-term debt 4,324 3,787
other liabilities 2,521 2,456
Equity
Preferred stock, $2.50 par value per share;
Authorized, 5,400,000 shares; issued, none – –
Common stock, $0.50 par value per share;
Authorized, 1,200,000,000 shares; issued, 953,354,012 shares;
outstanding, 738,877,768 shares in 2011 and 724,113,291 shares in 2012 477 477
Additional paid-in capital 317 324
Retained earnings 17,310 18,107
Accumulated other comprehensive income (562) (731)
17,542 18,177
Less: Cost of common stock in treasury, 214,476,244 shares in 2011
and 229,240,721 shares in 2012 7,143 7,882
common stockholders' equity 10,399 10,295
Noncontrolling interests in subsidiaries 152 147
total equity 10,551 10,442
total liabilities and equity $23,861 23,818
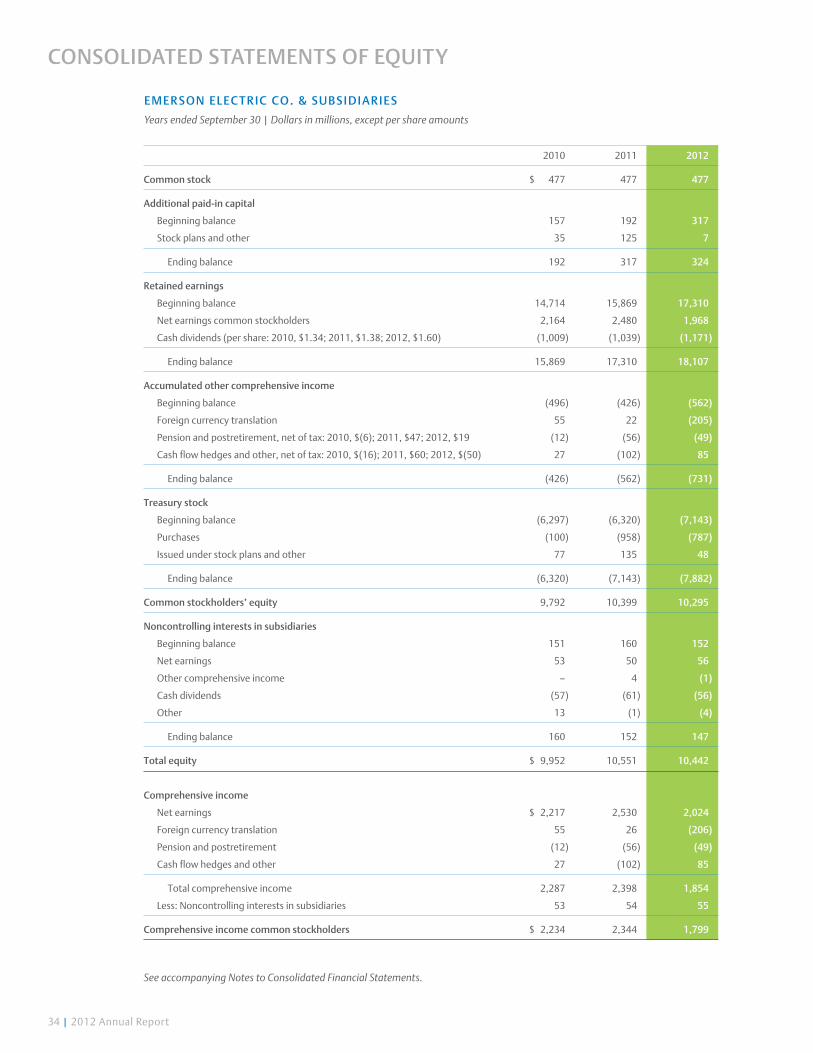
34 | 2012 Annual Report
2010 2011 2012
common stock $ 477 477 477
additional paid-in capital
Beginning balance 157 192 317
Stock plans and other 35 125 7
Ending balance 192 317 324
retained earnings
Beginning balance 14,714 15,869 17,310
Net earnings common stockholders 2,164 2,480 1,968
Cash dividends (per share: 2010, $1.34; 2011, $1.38; 2012, $1.60) (1,009) (1,039) (1,171)
Ending balance 15,869 17,310 18,107
accumulated other comprehensive income
Beginning balance (496) (426) (562)
Foreign currency translation 55 22 (205)
Pension and postretirement, net of tax: 2010, $(6); 2011, $47; 2012, $19 (12) (56) (49)
Cash flow hedges and other, net of tax: 2010, $(16); 2011, $60; 2012, $(50) 27 (102) 85
Ending balance (426) (562) (731)
treasury stock
Beginning balance (6,297) (6,320) (7,143)
Purchases (100) (958) (787)
Issued under stock plans and other 77 135 48
Ending balance (6,320) (7,143) (7,882)
common stockholders’ equity 9,792 10,399 10,295
Noncontrolling interests in subsidiaries
Beginning balance 151 160 152
Net earnings 53 50 56
Other comprehensive income – 4 (1)
Cash dividends (57) (61) (56)
Other 13 (1) (4)
Ending balance 160 152 147
total equity $ 9,952 10,551 10,442
comprehensive income
Net earnings $ 2,217 2,530 2,024
Foreign currency translation 55 26 (206)
Pension and postretirement (12) (56) (49)
Cash flow hedges and other 27 (102) 85
Total comprehensive income 2,287 2,398 1,854
Less: Noncontrolling interests in subsidiaries 53 54 55
comprehensive income common stockholders $ 2,234 2,344 1,799
EmE r soN ElEc t r ic c o. & su Bs i Di ari Es
Years ended September 30 | Dollars in millions, except per share amounts
coNsoliDatED statEmENts of Equity
See accompanying Notes to Consolidated Financial Statements.
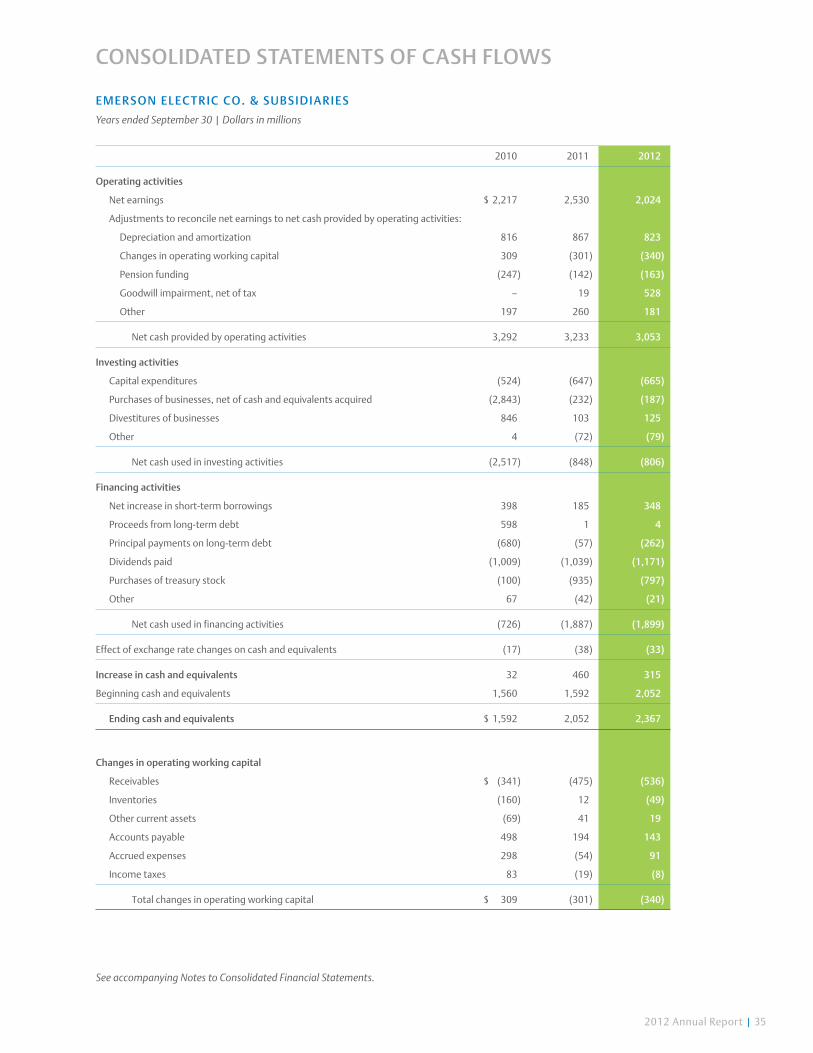
2012 Annual Report | 35
EmErsoN ElEc t r ic c o. & su BsiD ia r iEs
Years ended September 30 | Dollars in millions
2010 2011 2012
operating activities
Net earnings $ 2,217 2,530 2,024
Adjustments to reconcile net earnings to net cash provided by operating activities:
Depreciation and amortization 816 867 823
Changes in operating working capital 309 (301) (340)
Pension funding (247) (142) (163)
Goodwill impairment, net of tax – 19 528
Other 197 260 181
Net cash provided by operating activities 3,292 3,233 3,053
investing activities
Capital expenditures (524) (647) (665)
Purchases of businesses, net of cash and equivalents acquired (2,843) (232) (187)
Divestitures of businesses 846 103 125
Other 4 (72) (79)
Net cash used in investing activities (2,517) (848) (806)
financing activities
Net increase in short-term borrowings 398 185 348
Proceeds from long-term debt 598 1 4
Principal payments on long-term debt (680) (57) (262)
Dividends paid (1,009) (1,039) (1,171)
Purchases of treasury stock (100) (935) (797)
Other 67 (42) (21)
Net cash used in financing activities (726) (1,887) (1,899)
Effect of exchange rate changes on cash and equivalents (17) (38) (33)
increase in cash and equivalents 32 460 315
Beginning cash and equivalents 1,560 1,592 2,052
Ending cash and equivalents $ 1,592 2,052 2,367
changes in operating working capital
Receivables $ (341) (475) (536)
Inventories (160) 12 (49)
Other current assets (69) 41 19
Accounts payable 498 194 143
Accrued expenses 298 (54) 91
Income taxes 83 (19) (8)
Total changes in operating working capital $ 309 (301) (340)
coNsoliDatED statEmENts of cash flows
See accompanying Notes to Consolidated Financial Statements.
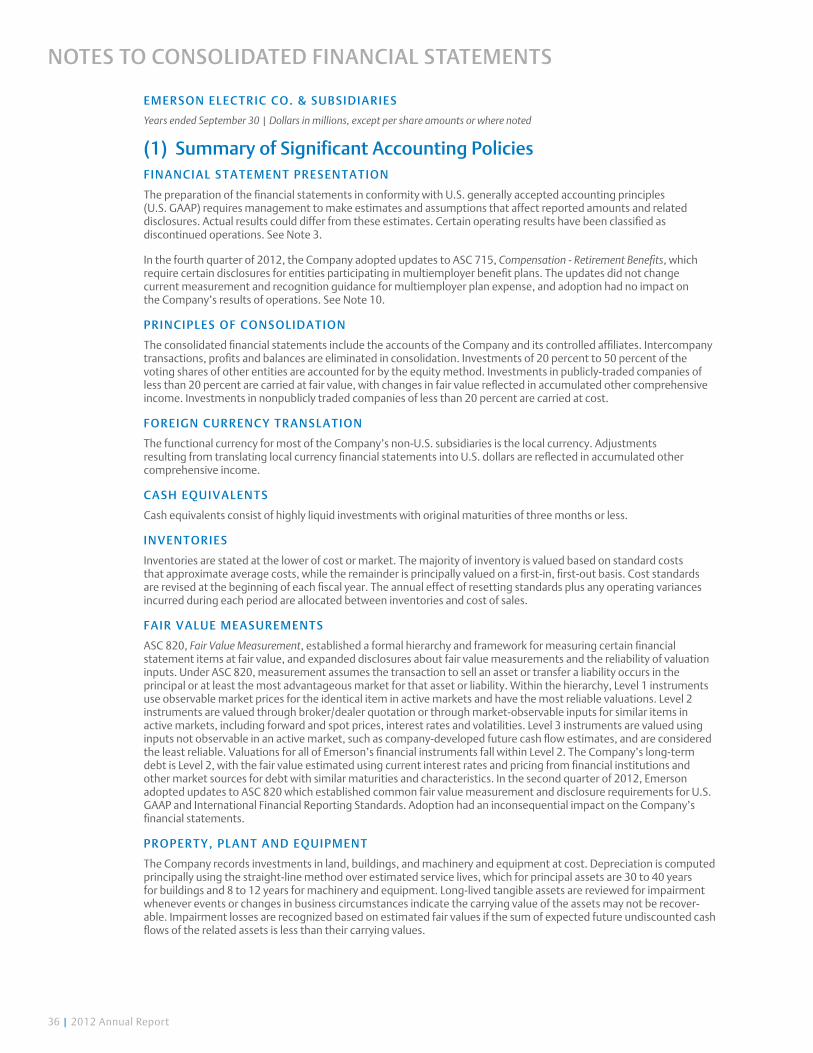
36 | 2012 Annual Report
emerson elec t r ic c o. & su bs i di ari es
Years ended September 30 | Dollars in millions, except per share amounts or where noted
(1) summary of significant accounting PoliciesFina n c ia l st a t em ent Pr esentati on
The preparation of the financial statements in conformity with U.S. generally accepted accounting principles (U.S. GAAP) requires management to make estimates and assumptions that affect reported amounts and related disclosures. Actual results could differ from these estimates. Certain operating results have been classified as discontinued operations. See Note 3.
In the fourth quarter of 2012, the Company adopted updates to ASC 715, Compensation - Retirement Benefits, which require certain disclosures for entities participating in multiemployer benefit plans. The updates did not change current measurement and recognition guidance for multiemployer plan expense, and adoption had no impact on the Company’s results of operations. See Note 10.
Princ iPles oF c on solid a t ion
The consolidated financial statements include the accounts of the Company and its controlled affiliates. Intercompany transactions, profits and balances are eliminated in consolidation. Investments of 20 percent to 50 percent of the voting shares of other entities are accounted for by the equity method. Investments in publicly-traded companies of less than 20 percent are carried at fair value, with changes in fair value reflected in accumulated other comprehensive income. Investments in nonpublicly traded companies of less than 20 percent are carried at cost.
Foreig n c u r r enc y t r a n sla t i on
The functional currency for most of the Company’s non-U.S. subsidiaries is the local currency. Adjustments resulting from translating local currency financial statements into U.S. dollars are reflected in accumulated other comprehensive income.
cash equ iva len t s
Cash equivalents consist of highly liquid investments with original maturities of three months or less.
inve nt or ies
Inventories are stated at the lower of cost or market. The majority of inventory is valued based on standard costs that approximate average costs, while the remainder is principally valued on a first-in, first-out basis. Cost standards are revised at the beginning of each fiscal year. The annual effect of resetting standards plus any operating variances incurred during each period are allocated between inventories and cost of sales.
Fair va lu e m ea su r em ent s
ASC 820, Fair Value Measurement, established a formal hierarchy and framework for measuring certain financial statement items at fair value, and expanded disclosures about fair value measurements and the reliability of valuation inputs. Under ASC 820, measurement assumes the transaction to sell an asset or transfer a liability occurs in the principal or at least the most advantageous market for that asset or liability. Within the hierarchy, Level 1 instruments use observable market prices for the identical item in active markets and have the most reliable valuations. Level 2 instruments are valued through broker/dealer quotation or through market-observable inputs for similar items in active markets, including forward and spot prices, interest rates and volatilities. Level 3 instruments are valued using inputs not observable in an active market, such as company-developed future cash flow estimates, and are considered the least reliable. Valuations for all of Emerson’s financial instruments fall within Level 2. The Company’s long-term debt is Level 2, with the fair value estimated using current interest rates and pricing from financial institutions and other market sources for debt with similar maturities and characteristics. In the second quarter of 2012, Emerson adopted updates to ASC 820 which established common fair value measurement and disclosure requirements for U.S. GAAP and International Financial Reporting Standards. Adoption had an inconsequential impact on the Company’s financial statements.
ProP er t y, Pla n t a n d equ iPment
The Company records investments in land, buildings, and machinery and equipment at cost. Depreciation is computed principally using the straight-line method over estimated service lives, which for principal assets are 30 to 40 years for buildings and 8 to 12 years for machinery and equipment. Long-lived tangible assets are reviewed for impairment whenever events or changes in business circumstances indicate the carrying value of the assets may not be recover-able. Impairment losses are recognized based on estimated fair values if the sum of expected future undiscounted cash flows of the related assets is less than their carrying values.
notes to consolidated Financial statements

2012 Annual Report | 37
goodwill and ot h er int a n g ible a s s ets
Assets and liabilities acquired in business combinations are accounted for using the acquisition method and recorded at their respective fair values. Substantially all goodwill is assigned to the reporting unit that acquires a business. A reporting unit is an operating segment as defined in ASC 280, Segment Reporting, or a business one level below an operating segment if discrete financial information for that business unit is prepared and regularly reviewed by the segment manager. The Company conducts impairment tests of goodwill on an annual basis in the fourth quarter and between annual tests if events or circumstances indicate the fair value of a reporting unit may be less than its carrying value. If a reporting unit’s carrying amount exceeds its estimated fair value, goodwill impairment is recognized to the extent that recorded goodwill exceeds the implied fair value of that goodwill. Estimated fair values of reporting units are Level 3 measures and are developed primarily under an income approach that discounts estimated future cash flows using risk-adjusted interest rates. In 2012, the Company adopted updates to ASC 350, Intangibles - Goodwill and Other, that allow in certain cases for an initial qualitative assessment of whether fair value exceeds carrying value for goodwill impairment testing.
All of the Company’s identifiable intangible assets are subject to amortization. Identifiable intangibles consist of intel-lectual property such as patents and trademarks, customer relationships and capitalized software, and are amortized on a straight-line basis over their estimated useful lives. These intangibles are also subject to evaluation for potential impairment if events or circumstances indicate the carrying amount may not be recoverable. See Note 6.
Product w a r r a nt y
Warranties vary by product line and are competitive for the markets in which the Company operates. Warranties gener-ally extend for a period of one to two years from the date of sale or installation. Provisions for warranty are determined primarily based on historical warranty cost as a percentage of sales or a fixed amount per unit sold based on failure rates, adjusted for specific problems that may arise. Product warranty expense is less than one percent of sales.
revenue rec ognit ion
The Company recognizes nearly all of its revenues through the sale of manufactured products and records the sale when products are shipped or delivered, and title passes to the customer with collection reasonably assured. In certain limited circumstances, revenue is recognized using the percentage-of-completion method as performance occurs, or in accordance with ASC 985-605 related to software. Management believes that all relevant criteria and conditions are considered when recognizing revenue.
Sales arrangements sometimes involve delivering multiple elements, including services such as installation. In these instances, the revenue assigned to each element is based on vendor-specific objective evidence, third-party evidence or a management estimate of the relative selling price. Revenue is recognized individually for delivered elements only if they have value to the customer on a stand-alone basis and the performance of the undelivered items is probable and substantially in the Company’s control, or the undelivered elements are inconsequential or perfunctory and there are no unsatisfied contingencies related to payment. Approximately ten percent of the Company’s revenues arise from qualifying sales arrangements that include the delivery of multiple elements, principally in the Network Power and Process Management segments. The vast majority of these deliverables are tangible products, with a small portion attributable to installation, service and maintenance. Selling prices are primarily determined using vendor-specific objective evidence. Generally, contract duration is short-term and cancellation, termination or refund provisions apply only in the event of contract breach and have historically not been invoked. The use of management estimated selling prices to allocate consideration in multiple deliverables arrangements became effective for the Company October 1, 2010. The impact of this change was inconsequential.
derivative s a nd h ed gin g
In the normal course of business, the Company is exposed to changes in interest rates, foreign currency exchange rates and commodity prices due to its worldwide presence and diverse business profile. Emerson’s foreign currency exposures primarily relate to transactions denominated in euros, Mexican pesos, Canadian dollars and Chinese renminbi. Primary commodity exposures are price fluctuations on forecasted purchases of copper and aluminum and related products. As part of the Company’s risk management strategy, derivative instruments are selectively used in an effort to minimize the impact of these exposures. Foreign exchange forwards and options are utilized to hedge foreign currency exposures impacting sales or cost of sales transactions, firm commitments and the fair value of assets and liabilities, while swap and option contracts are used to minimize the effect of commodity price fluctuations on the cost of sales. All derivatives are associated with specific underlying exposures and the Company does not hold deriva-tives for trading or speculative purposes. The duration of hedge positions is generally two years or less and amounts currently hedged beyond 18 months are not significant.

38 | 2012 Annual Report
All derivatives are accounted for under ASC 815, Derivatives and Hedging, and recognized at fair value. For derivatives hedging variability in future cash flows, the effective portion of any gain or loss is deferred in stockholders’ equity and recognized in earnings when the underlying hedged transaction impacts earnings. The majority of the Company’s derivatives that are designated as hedges and qualify for deferral accounting are cash flow hedges. For derivatives hedging the fair value of existing assets or liabilities, both the gain or loss on the derivative and the offsetting loss or gain on the hedged item are recognized in earnings each period. Currency fluctuations on non-U.S. dollar obli-gations that have been designated as hedges of non-U.S. dollar net asset exposures are reported in equity. To the extent that any hedge is not fully effective at offsetting cash flow or fair value changes in the underlying hedged item, there could be a net earnings impact. The Company also uses derivatives to hedge economic exposures that do not receive deferral accounting under ASC 815. The underlying exposures for these hedges relate primarily to purchases of commodity-based components used in the Company’s manufacturing processes, and the revaluation of certain foreign-currency-denominated assets and liabilities. Gains or losses from the ineffective portion of any hedge, as well as any gains or losses on derivative instruments not designated as hedges, are recognized in the income statement immediately.
The Company has bilateral collateral arrangements with derivatives counterparties for which credit rating-based posting thresholds vary depending on the arrangement. If credit ratings on the Company’s debt fall below preestab-lished levels, counterparties can require immediate full collateralization on all instruments in net liability positions. Similarly, Emerson can demand full collateralization should any of the Company’s counterparties’ credit ratings fall below certain thresholds. Counterparties to derivative arrangements are companies with high credit ratings. Risk from credit loss when derivatives are in asset positions is considered immaterial. The Company has master netting arrange-ments in place with its counterparties that allow the offsetting of certain derivative-related amounts receivable and payable when settlement occurs in the same period. Accordingly, counterparty balances are netted in the consoli-dated balance sheet. Net values of contracts are reported in other current assets or accrued expenses as appropriate depending on positions with counterparties as of the balance sheet date. See Note 7.
incom e t a xes
The provision for income taxes is based on pretax income reported in the consolidated statements of earnings and tax rates currently enacted in each jurisdiction. Certain income and expense items are recognized in different time periods for financial reporting and income tax filing purposes, and deferred income taxes are provided for the effect of temporary differences. The Company also provides for U.S. federal income taxes, net of available foreign tax credits, on earnings intended to be repatriated from non-U.S. locations. No provision has been made for U.S. income taxes on approximately $6.3 billion of undistributed earnings of non-U.S. subsidiaries as of September 30, 2012, as these earnings are considered permanently invested or otherwise indefinitely retained for continuing international opera-tions. Recognition of U.S. taxes on undistributed non-U.S. earnings would be triggered by a management decision to repatriate those earnings, although there is no current intention to do so. Determination of the amount of taxes that might be paid on these undistributed earnings if eventually remitted is not practicable. See Note 13.
comPr eh ensive inc ome
Comprehensive income is primarily composed of net earnings plus changes in foreign currency translation, pension and postretirement adjustments, and the effective portion of changes in the fair value of cash flow hedges. Accumu-lated other comprehensive income, net of tax (a component of equity), consists of foreign currency translation credits of $466 and $671, deferred pension and postretirement charges of $1,213 and $1,164 and cash flow hedges and other credits of $16 and charges of $69, respectively, at September 30, 2012 and 2011. Accumulated other comprehensive income attributable to noncontrolling interests in subsidiaries consists primarily of earnings, plus foreign currency translation.
(2) weighted average common sharesBasic earnings per common share consider only the weighted average of common shares outstanding while diluted earnings per common share consider the dilutive effects of stock options and incentive shares. Options to purchase approximately 7.7 million, 4.6 million and 3.9 million shares of common stock were excluded from the computation of diluted earnings per share in 2012, 2011 and 2010, respectively, as the effect would have been antidilutive. Earnings allocated to participating securities were inconsequential for all years presented. Reconciliations of weighted average shares for basic and diluted earnings per common share follow:
(shares in millions) 2010 2011 2012
Basic shares outstanding 750.7 748.5 730.6Dilutive shares 6.3 5.0 4.0
Diluted shares outstanding 757.0 753.5 734.6
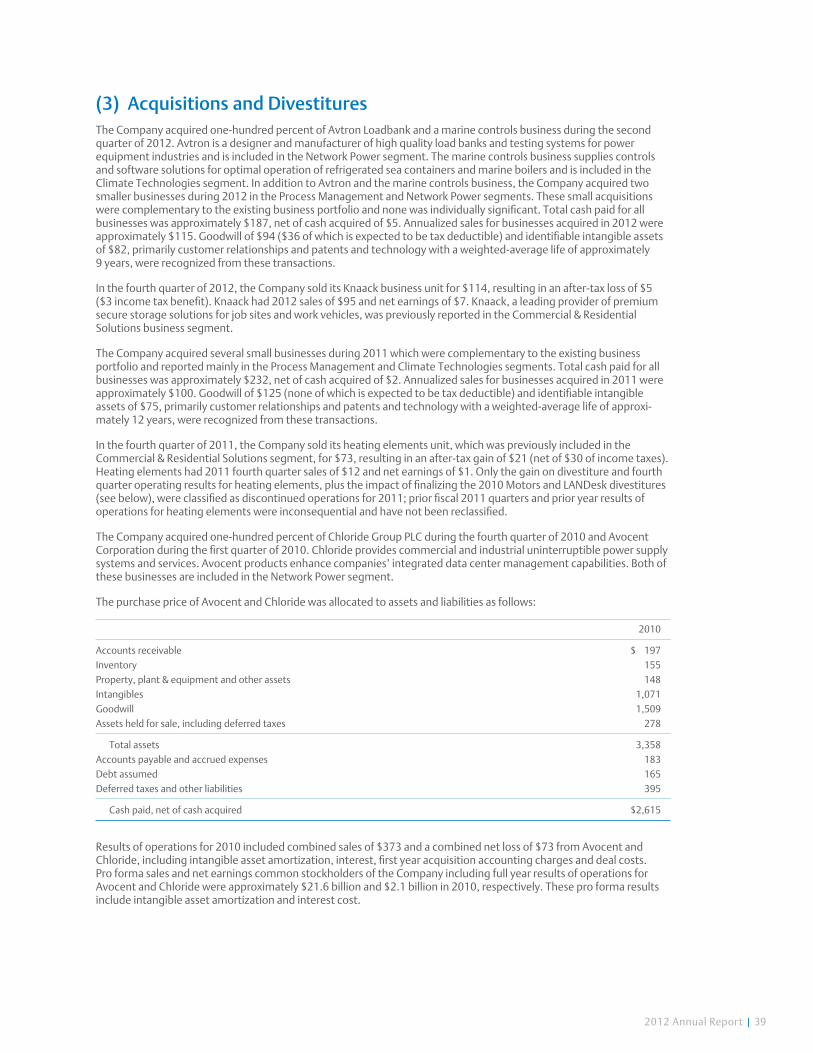
2012 Annual Report | 39
(3) acquisitions and divestituresThe Company acquired one-hundred percent of Avtron Loadbank and a marine controls business during the second quarter of 2012. Avtron is a designer and manufacturer of high quality load banks and testing systems for power equipment industries and is included in the Network Power segment. The marine controls business supplies controls and software solutions for optimal operation of refrigerated sea containers and marine boilers and is included in the Climate Technologies segment. In addition to Avtron and the marine controls business, the Company acquired two smaller businesses during 2012 in the Process Management and Network Power segments. These small acquisitions were complementary to the existing business portfolio and none was individually significant. Total cash paid for all businesses was approximately $187, net of cash acquired of $5. Annualized sales for businesses acquired in 2012 were approximately $115. Goodwill of $94 ($36 of which is expected to be tax deductible) and identifiable intangible assets of $82, primarily customer relationships and patents and technology with a weighted-average life of approximately 9 years, were recognized from these transactions.
In the fourth quarter of 2012, the Company sold its Knaack business unit for $114, resulting in an after-tax loss of $5 ($3 income tax benefit). Knaack had 2012 sales of $95 and net earnings of $7. Knaack, a leading provider of premium secure storage solutions for job sites and work vehicles, was previously reported in the Commercial & Residential Solutions business segment.
The Company acquired several small businesses during 2011 which were complementary to the existing business portfolio and reported mainly in the Process Management and Climate Technologies segments. Total cash paid for all businesses was approximately $232, net of cash acquired of $2. Annualized sales for businesses acquired in 2011 were approximately $100. Goodwill of $125 (none of which is expected to be tax deductible) and identifiable intangible assets of $75, primarily customer relationships and patents and technology with a weighted-average life of approxi-mately 12 years, were recognized from these transactions.
In the fourth quarter of 2011, the Company sold its heating elements unit, which was previously included in the Commercial & Residential Solutions segment, for $73, resulting in an after-tax gain of $21 (net of $30 of income taxes). Heating elements had 2011 fourth quarter sales of $12 and net earnings of $1. Only the gain on divestiture and fourth quarter operating results for heating elements, plus the impact of finalizing the 2010 Motors and LANDesk divestitures (see below), were classified as discontinued operations for 2011; prior fiscal 2011 quarters and prior year results of operations for heating elements were inconsequential and have not been reclassified.
The Company acquired one-hundred percent of Chloride Group PLC during the fourth quarter of 2010 and Avocent Corporation during the first quarter of 2010. Chloride provides commercial and industrial uninterruptible power supply systems and services. Avocent products enhance companies’ integrated data center management capabilities. Both of these businesses are included in the Network Power segment.
The purchase price of Avocent and Chloride was allocated to assets and liabilities as follows:
2010
Accounts receivable $ 197Inventory 155Property, plant & equipment and other assets 148Intangibles 1,071Goodwill 1,509Assets held for sale, including deferred taxes 278
Total assets 3,358Accounts payable and accrued expenses 183Debt assumed 165Deferred taxes and other liabilities 395
Cash paid, net of cash acquired $2,615
Results of operations for 2010 included combined sales of $373 and a combined net loss of $73 from Avocent and Chloride, including intangible asset amortization, interest, first year acquisition accounting charges and deal costs. Pro forma sales and net earnings common stockholders of the Company including full year results of operations for Avocent and Chloride were approximately $21.6 billion and $2.1 billion in 2010, respectively. These pro forma results include intangible asset amortization and interest cost.

40 | 2012 Annual Report
In addition to Chloride and Avocent, the Company acquired several smaller businesses during 2010 reported mainly in the Process Management and Industrial Automation segments. Total cash paid for all businesses acquired was approximately $2,843, net of cash acquired of $150. Additionally, the Company assumed debt of $169. Annualized sales for businesses acquired in 2010 were approximately $1.1 billion. Identifiable intangible assets of $1,166, primarily customer relationships and intellectual property with a weighted-average life of approximately 10 years, were recog-nized along with goodwill of $1,633, of which only a small amount is tax deductible.
In the fourth quarter of 2010, the Company sold the LANDesk business unit, which was acquired as part of Avocent and was not a strategic fit with Emerson, for $230, resulting in an after-tax gain of $12 ($10 of income taxes). Additionally, LANDesk incurred operating losses of $19. This business was classified as discontinued operations throughout 2010. Also in the fourth quarter of 2010, the Company sold its appliance motors and U.S. commercial and industrial motors businesses (Motors) which had slower growth profiles and were formerly reported in the Commercial & Residential Solutions segment. Proceeds from the sale were $622 resulting in an after-tax gain of $155 ($126 of income taxes). The Motors disposition included working capital of $98, property, plant and equipment of $152, goodwill of $44, and other of $47. The Motors businesses had total annual sales of $827 and net earnings (excluding the divestiture gain) of $38 in 2010. Results of operations for Motors have been reclassified into discontinued operations for 2010 and earlier periods.
The results of operations of the businesses discussed above have been included in the Company’s consolidated results of operations since the respective dates of acquisition.
(4) other deductions, netOther deductions, net are summarized as follows:
2010 2011 2012
Amortization of intangibles (intellectual property and customer relationships) $176 261 241Rationalization of operations 126 81 119Other 71 38 91Gains, net (4) (24) (50)
Total $369 356 401
Other is composed of several items that are individually immaterial, including foreign currency transaction gains and losses, bad debt expense, equity investment income and losses, as well as one-time items such as litigation and disputed matters and insurance recoveries. Other increased in 2012 primarily because of higher foreign currency trans-action losses and the loss on the sale of Knaack. Other decreased in 2011 primarily because of lower acquisition-related costs. Gains, net for 2012 reflect $43 for payments received related to dumping duties collected by U.S. Customs for 2006 through 2010, but not distributed to affected domestic producers pending resolution of certain legal challenges to the U.S. Continued Dumping and Subsidy Offset Act. Gains, net for 2011 included $15 related to the acquisition of full ownership of a Process Management joint venture in India.
(5) rationalization of operationsRationalization of operations expense reflects costs associated with the Company’s efforts to continually improve oper-ational efficiency and deploy assets globally to remain competitive on a worldwide basis. Each year the Company incurs costs to size its businesses to levels appropriate for current economic conditions and to improve its cost structure for future growth. Rationalization expenses result from numerous individual actions implemented across the Company’s various operating units on an ongoing basis and include costs for moving facilities to best-cost locations, starting up plants after relocation or geographic expansion to serve local markets, exiting certain product lines, curtailing/downsizing operations because of changing economic conditions and other costs resulting from asset redeploy-ment decisions. Shutdown costs include severance, benefits, stay bonuses, lease and contract terminations and asset write-downs. In addition to the costs of moving fixed assets, start-up and moving costs include employee training and relocation. Vacant facility costs include security, maintenance, utilities and other costs.
The Company reported rationalization expenses of $119, $81 and $126, respectively, for 2012, 2011 and 2010. The Company currently expects to incur rationalization expense in 2013 in the range of approximately $70 to $80, including the costs to complete actions initiated before the end of 2012 and actions anticipated to be approved and initiated during 2013.

2012 Annual Report | 41
The change in the liability for the rationalization of operations during the years ended September 30 follows:
2011 expense paid / utilized 2012
Severance and benefits $24 58 59 23Lease and other contract terminations 3 10 8 5Fixed asset write-downs – 9 9 –Vacant facility and other shutdown costs 2 12 11 3Start-up and moving costs 1 30 30 1
Total $30 119 117 32
2010 expense paid/utilized 2011
Severance and benefits $57 17 50 24Lease and other contract terminations 8 3 8 3Fixed asset write-downs – 12 12 –Vacant facility and other shutdown costs 4 11 13 2Start-up and moving costs – 38 37 1
Total $69 81 120 30
Rationalization of operations expense by segment is summarized as follows:
2010 2011 2012
Process Management $ 35 11 19Industrial Automation 48 32 27Network Power 25 20 53Climate Technologies 13 11 11Commercial & Residential Solutions 5 7 9
Total $126 81 119
Costs incurred during 2012, 2011 and 2010 included actions to exit approximately 20 to 25 production, distribution or office facilities each year and eliminate approximately 2,700, 2,800 and 3,500 positions, respectively, as well as costs related to facilities exited in previous periods. Severance and benefits costs were concentrated in Network Power for Asia, Europe and North America and Industrial Automation for Europe and North America in 2012, were not significant for any single segment in 2011, and were primarily incurred in Process Management and Industrial Automation for Europe and North America in 2010. Start-up and moving costs to redeploy assets to best cost locations and expand geographically to directly serve local markets were incurred in all segments in 2012, with the majority in Process Management in Europe and Commercial & Residential Solutions in North America. In 2011, these costs were substantially incurred in Industrial Automation, including most of the fixed-asset write downs, and in Network Power, and were not material for any segment in 2010. The Company also incurred shutdown costs, including vacant facility, lease termination, and other costs as a result of the consolidation or geographic relocation of facilities. In 2012, these costs were incurred primarily in Asia and Europe for Network Power, Europe for Industrial Automation and North America for Climate Technologies, and in North America and Europe for essentially all segments in 2011 and 2010.

42 | 2012 Annual Report
(6) goodwill and other intangiblesPurchases of businesses are accounted for under the acquisition method, with substantially all goodwill assigned to the reporting unit that acquires the business. Under an impairment test performed annually, if the carrying amount of a reporting unit’s goodwill exceeds its estimated fair value, impairment is recognized to the extent that the carrying amount exceeds the implied fair value of the goodwill. Fair values of reporting units are Level 3 measures, estimated primarily with an income approach that discounts future cash flows using risk-adjusted interest rates, and are subject to change due to changes in underlying economic conditions. See Note 3 for further discussion of changes in goodwill related to acquisitions and divestitures.
In prior periods, the Company discussed certain businesses for which the estimated fair value did not significantly exceed carrying value. Assumptions used in estimating fair value included successful execution of business plans and recovery in served markets. In the fourth quarter of 2012, the Company’s annual goodwill impairment testing revealed that carrying value exceeded fair value for the embedded computing and power business and the DC power systems business, both in the Network Power segment. These businesses have been unable to meet their operating objectives and the Company anticipates that growth in sales and earnings for these businesses will be slower than previously expected, reflecting protracted weak demand and structural industry challenges in telecommunications and informa-tion technology end markets, and increased competition. As a consequence, the carrying value of these businesses was reduced by a noncash, pretax charge to earnings totaling $592 ($528 after-tax, or $0.72 per share). Management and the Board of Directors have discussed the unique market and technology challenges facing the embedded computing and power business and will pursue strategic alternatives, including a potential sale of this business with annual revenue of $1.4 billion. In 2011, the Company recorded a $19 ($0.03 per share) noncash, pretax impairment charge related to the Industrial Automation wind turbine pitch control business, reflecting a slowdown in investment for alternative energy.
The change in the carrying value of goodwill by business segment follows:
process industrial network climate commercial & management automation power technologies residential solutions total
Balance, September 30, 2010 $2,274 1,379 3,997 464 542 8,656 Acquisitions 110 15 125 Divestitures (1) (8) (6) (15) Impairment (19) (19) Foreign currency translation and other (16) 34 1 4 1 24
Balance, September 30, 2011 $2,368 1,393 3,990 483 537 8,771
Acquisitions 5 62 27 94 Divestitures (102) (102) Impairment (592) (592) Foreign currency translation and other 6 (55) (93) (9) 6 (145)
balance, september 30, 2012 $2,379 1,338 3,367 501 441 8,026
The gross carrying amount and accumulated amortization of identifiable intangible assets by major class follow:
customer relationships intellectual property capitalized software total
2011 2012 2011 2012 2011 2012 2011 2012
Gross carrying amount $1,499 1,537 1,110 1,125 971 1,046 3,580 3,708Less: Accumulated amortization 330 459 518 606 763 805 1,611 1,870
Net carrying amount $1,169 1,078 592 519 208 241 1,969 1,838
Total intangible asset amortization expense for 2012, 2011 and 2010 was $318, $345 and $254, respectively. Based on intangible asset balances as of September 30, 2012, amortization expense is expected to approximate $308 in 2013, $274 in 2014, $244 in 2015, $197 in 2016 and $175 in 2017.
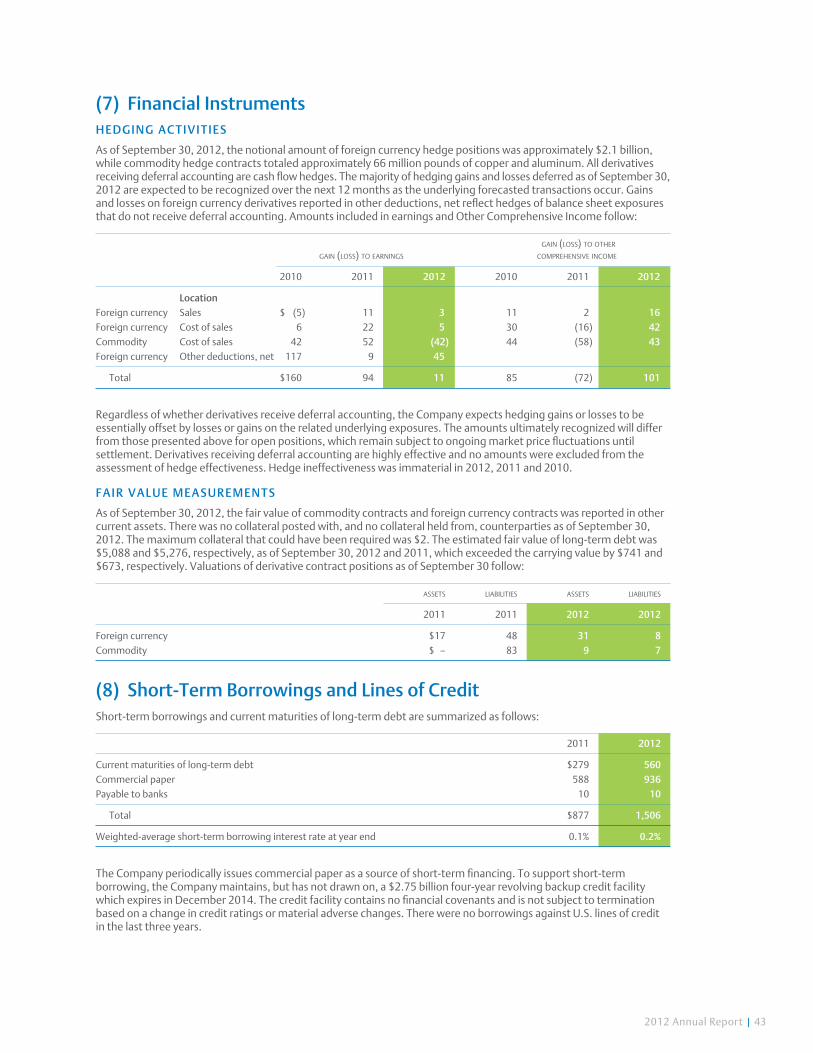
2012 Annual Report | 43
(7) Financial instrumentshedging ac t ivit ies
As of September 30, 2012, the notional amount of foreign currency hedge positions was approximately $2.1 billion, while commodity hedge contracts totaled approximately 66 million pounds of copper and aluminum. All derivatives receiving deferral accounting are cash flow hedges. The majority of hedging gains and losses deferred as of September 30, 2012 are expected to be recognized over the next 12 months as the underlying forecasted transactions occur. Gains and losses on foreign currency derivatives reported in other deductions, net reflect hedges of balance sheet exposures that do not receive deferral accounting. Amounts included in earnings and Other Comprehensive Income follow:
gain (loss) to other gain (loss) to earnings comprehensive income
2010 2011 2012 2010 2011 2012
locationForeign currency Sales $ (5) 11 3 11 2 16Foreign currency Cost of sales 6 22 5 30 (16) 42Commodity Cost of sales 42 52 (42) 44 (58) 43Foreign currency Other deductions, net 117 9 45
Total $160 94 11 85 (72) 101
Regardless of whether derivatives receive deferral accounting, the Company expects hedging gains or losses to be essentially offset by losses or gains on the related underlying exposures. The amounts ultimately recognized will differ from those presented above for open positions, which remain subject to ongoing market price fluctuations until settlement. Derivatives receiving deferral accounting are highly effective and no amounts were excluded from the assessment of hedge effectiveness. Hedge ineffectiveness was immaterial in 2012, 2011 and 2010.
Fair value m ea su r em ent s
As of September 30, 2012, the fair value of commodity contracts and foreign currency contracts was reported in other current assets. There was no collateral posted with, and no collateral held from, counterparties as of September 30, 2012. The maximum collateral that could have been required was $2. The estimated fair value of long-term debt was $5,088 and $5,276, respectively, as of September 30, 2012 and 2011, which exceeded the carrying value by $741 and $673, respectively. Valuations of derivative contract positions as of September 30 follow:
assets liabilities assets liabilities
2011 2011 2012 2012
Foreign currency $17 48 31 8Commodity $ – 83 9 7
(8) short-term borrowings and lines of creditShort-term borrowings and current maturities of long-term debt are summarized as follows:
2011 2012
Current maturities of long-term debt $279 560Commercial paper 588 936Payable to banks 10 10
Total $877 1,506
Weighted-average short-term borrowing interest rate at year end 0.1% 0.2%
The Company periodically issues commercial paper as a source of short-term financing. To support short-term borrowing, the Company maintains, but has not drawn on, a $2.75 billion four-year revolving backup credit facility which expires in December 2014. The credit facility contains no financial covenants and is not subject to termination based on a change in credit ratings or material adverse changes. There were no borrowings against U.S. lines of credit in the last three years.
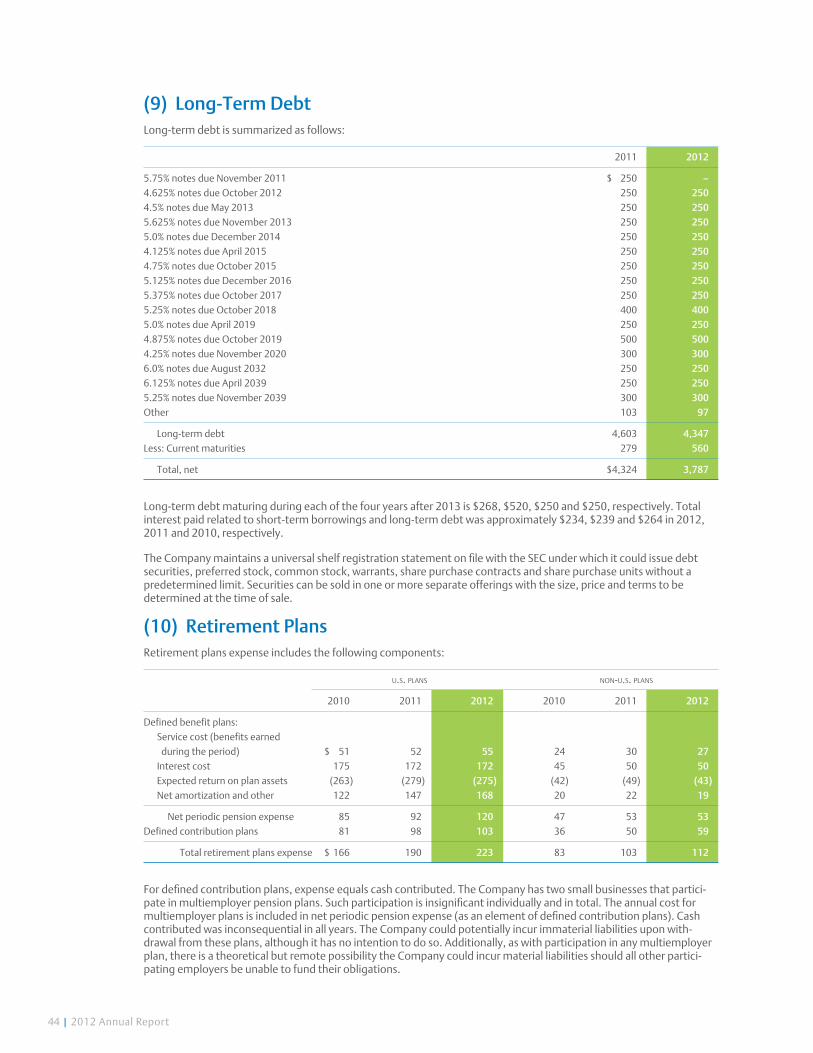
44 | 2012 Annual Report
(9) long-term debtLong-term debt is summarized as follows:
2011 2012
5.75% notes due November 2011 $ 250 –4.625% notes due October 2012 250 2504.5% notes due May 2013 250 2505.625% notes due November 2013 250 2505.0% notes due December 2014 250 2504.125% notes due April 2015 250 2504.75% notes due October 2015 250 2505.125% notes due December 2016 250 2505.375% notes due October 2017 250 2505.25% notes due October 2018 400 4005.0% notes due April 2019 250 2504.875% notes due October 2019 500 5004.25% notes due November 2020 300 3006.0% notes due August 2032 250 2506.125% notes due April 2039 250 2505.25% notes due November 2039 300 300Other 103 97
Long-term debt 4,603 4,347Less: Current maturities 279 560
Total, net $4,324 3,787
Long-term debt maturing during each of the four years after 2013 is $268, $520, $250 and $250, respectively. Total interest paid related to short-term borrowings and long-term debt was approximately $234, $239 and $264 in 2012, 2011 and 2010, respectively.
The Company maintains a universal shelf registration statement on file with the SEC under which it could issue debt securities, preferred stock, common stock, warrants, share purchase contracts and share purchase units without a predetermined limit. Securities can be sold in one or more separate offerings with the size, price and terms to be determined at the time of sale.
(10) retirement PlansRetirement plans expense includes the following components:
u.s. plans non-u.s. plans
2010 2011 2012 2010 2011 2012
Defined benefit plans: Service cost (benefits earned during the period) $ 51 52 55 24 30 27 Interest cost 175 172 172 45 50 50 Expected return on plan assets (263) (279) (275) (42) (49) (43) Net amortization and other 122 147 168 20 22 19
Net periodic pension expense 85 92 120 47 53 53Defined contribution plans 81 98 103 36 50 59
Total retirement plans expense $ 166 190 223 83 103 112
For defined contribution plans, expense equals cash contributed. The Company has two small businesses that partici-pate in multiemployer pension plans. Such participation is insignificant individually and in total. The annual cost for multiemployer plans is included in net periodic pension expense (as an element of defined contribution plans). Cash contributed was inconsequential in all years. The Company could potentially incur immaterial liabilities upon with-drawal from these plans, although it has no intention to do so. Additionally, as with participation in any multiemployer plan, there is a theoretical but remote possibility the Company could incur material liabilities should all other partici-pating employers be unable to fund their obligations.

2012 Annual Report | 45
Reconciliations of the actuarial present value of the projected benefit obligations and of the fair value of plan assets for defined benefit pension plans follow:
u.s. plans non-u.s. plans
2011 2012 2011 2012
Projected benefit obligation, beginning $ 3,466 3,644 1,061 960 Service cost 52 55 30 27 Interest cost 172 172 50 50 Actuarial (gain) loss 114 502 (125) 137 Benefits paid (167) (173) (53) (41) Foreign currency translation and other 7 3 (3) 10
Projected benefit obligation, ending $ 3,644 4,203 960 1,143
Fair value of plan assets, beginning $ 3,206 3,182 714 690 Actual return on plan assets 29 595 – 100 Employer contributions 112 113 30 50 Benefits paid (167) (173) (53) (41) Foreign currency translation and other 2 2 (1) 10
Fair value of plan assets, ending $ 3,182 3,719 690 809
Net amount recognized in the balance sheet $ (462) (484) (270) (334)
Amounts recognized in the balance sheet:Noncurrent liability $ (462) (484) (270) (334)Accumulated other comprehensive pretax loss $(1,659) (1,674) (240) (308)
Approximately $244 of the $1,982 of losses deferred in accumulated other comprehensive income at September 30, 2012, will be amortized into earnings in 2013. As of September 30, 2012, retirement plans in total were underfunded by $818, which includes $353 of unfunded plans.
As of the plans’ September 30, 2012 and 2011 measurement dates, the total accumulated benefit obligation was $5,010 and $4,345, respectively. Also, as of the plans’ respective measurement dates, the projected benefit obligation, accumulated benefit obligation and fair value of plan assets for retirement plans with accumulated benefit obligations in excess of plan assets were $4,763, $4,504 and $3,947, respectively, for 2012, and $4,093, $3,907 and $3,380, respectively, for 2011.
Future benefit payments by U.S. plans are estimated to be $181 in 2013, $191 in 2014, $200 in 2015, $209 in 2016, $218 in 2017 and $1,212 in total over the five years 2018 through 2022. Based on foreign currency exchange rates as of September 30, 2012, future benefit payments by non-U.S. plans are estimated to be $45 in 2013, $47 in 2014, $51 in 2015, $53 in 2016, $56 in 2017 and $309 in total over the five years 2018 through 2022. The Company expects to contribute approximately $150 to its retirement plans in 2013.
The weighted-average assumptions used in the valuation of pension benefits were as follows:
u.s. plans non-u.s. plans
2010 2011 2012 2010 2011 2012
Net pension expense:Discount rate 5.50% 5.00% 4.75% 5.3% 4.6% 5.2%Expected return on plan assets 8.00% 8.00% 7.75% 5.9% 5.9% 5.9%Rate of compensation increase 3.00% 3.00% 3.00% 3.9% 3.5% 3.5%
Benefit obligations:Discount rate 5.00% 4.75% 4.00% 4.6% 5.2% 4.1%Rate of compensation increase 3.00% 3.00% 3.25% 3.5% 3.5% 3.4%
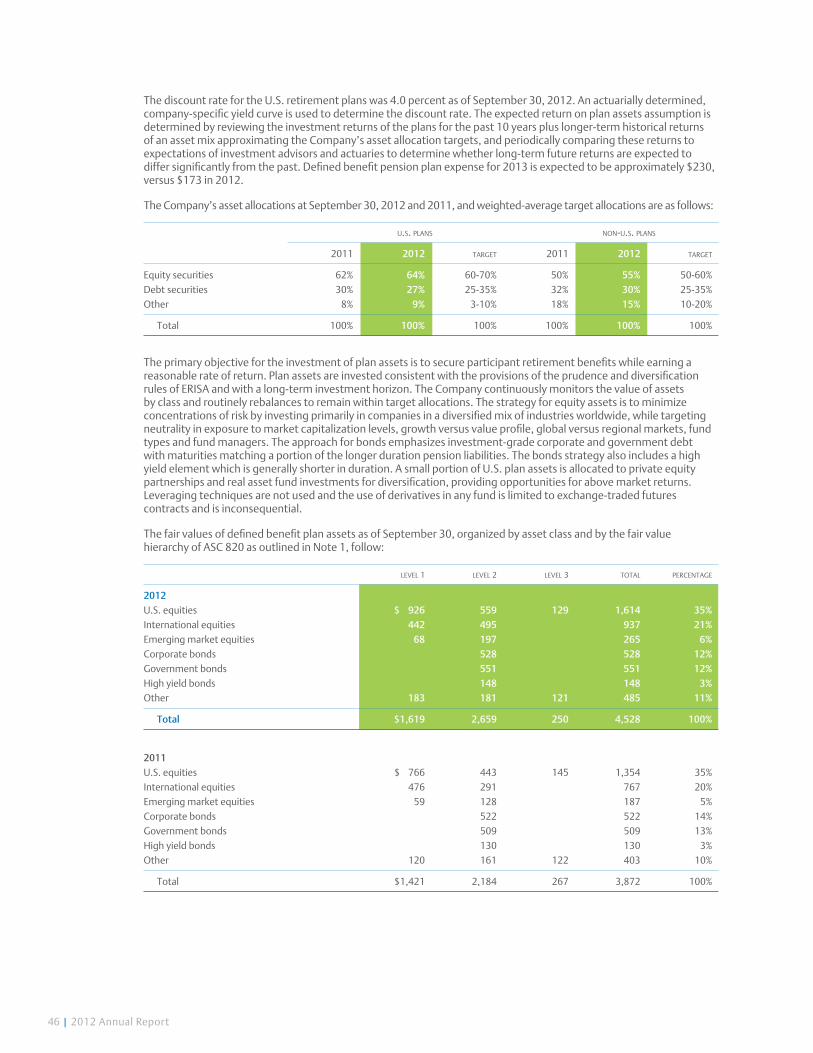
46 | 2012 Annual Report
The discount rate for the U.S. retirement plans was 4.0 percent as of September 30, 2012. An actuarially determined, company-specific yield curve is used to determine the discount rate. The expected return on plan assets assumption is determined by reviewing the investment returns of the plans for the past 10 years plus longer-term historical returns of an asset mix approximating the Company’s asset allocation targets, and periodically comparing these returns to expectations of investment advisors and actuaries to determine whether long-term future returns are expected to differ significantly from the past. Defined benefit pension plan expense for 2013 is expected to be approximately $230, versus $173 in 2012.
The Company’s asset allocations at September 30, 2012 and 2011, and weighted-average target allocations are as follows:
u.s. plans non-u.s. plans
2011 2012 target 2011 2012 target
Equity securities 62% 64% 60-70% 50% 55% 50-60%Debt securities 30% 27% 25-35% 32% 30% 25-35%Other 8% 9% 3-10% 18% 15% 10-20%
Total 100% 100% 100% 100% 100% 100%
The primary objective for the investment of plan assets is to secure participant retirement benefits while earning a reasonable rate of return. Plan assets are invested consistent with the provisions of the prudence and diversification rules of ERISA and with a long-term investment horizon. The Company continuously monitors the value of assets by class and routinely rebalances to remain within target allocations. The strategy for equity assets is to minimize concentrations of risk by investing primarily in companies in a diversified mix of industries worldwide, while targeting neutrality in exposure to market capitalization levels, growth versus value profile, global versus regional markets, fund types and fund managers. The approach for bonds emphasizes investment-grade corporate and government debt with maturities matching a portion of the longer duration pension liabilities. The bonds strategy also includes a high yield element which is generally shorter in duration. A small portion of U.S. plan assets is allocated to private equity partnerships and real asset fund investments for diversification, providing opportunities for above market returns. Leveraging techniques are not used and the use of derivatives in any fund is limited to exchange-traded futures contracts and is inconsequential.
The fair values of defined benefit plan assets as of September 30, organized by asset class and by the fair value hierarchy of ASC 820 as outlined in Note 1, follow:
level 1 level 2 level 3 total percentage
2012U.S. equities $ 926 559 129 1,614 35%International equities 442 495 937 21%Emerging market equities 68 197 265 6%Corporate bonds 528 528 12%Government bonds 551 551 12%High yield bonds 148 148 3%Other 183 181 121 485 11%
total $1,619 2,659 250 4,528 100%
2011U.S. equities $ 766 443 145 1,354 35%International equities 476 291 767 20%Emerging market equities 59 128 187 5%Corporate bonds 522 522 14%Government bonds 509 509 13%High yield bonds 130 130 3%Other 120 161 122 403 10%
Total $1,421 2,184 267 3,872 100%

2012 Annual Report | 47
asset classes
U.S. Equities reflects companies domiciled in the U.S., including multinational companies. International Equities is comprised of companies domiciled in developed nations outside the U.S. Emerging Market Equities is comprised of companies domiciled in portions of Asia, Eastern Europe and Latin America. Corporate Bonds represent investment-grade debt of issuers primarily from the U.S. Government Bonds include investment-grade instruments issued by federal, state and local governments, primarily in the U.S. High Yield Bonds include non-investment-grade debt from a diverse group of developed market issuers. Other includes cash, interests in mixed asset funds investing in commodi-ties, natural resources, agriculture and exchange-traded real estate funds, life insurance contracts (U.S.), and shares in certain general investment funds of financial institutions or insurance arrangements (non-U.S.) that typically ensure no market losses or provide for a small minimum return guarantee.
Fair value h ier a r c h y c a t eg or ies
Valuations of Level 1 assets for all classes are based on quoted closing market prices from the principal exchanges where the individual securities are traded. Cash is valued at cost, which approximates fair value. Equity securities categorized as Level 2 assets are primarily non-exchange-traded commingled or collective funds where the underlying securities have observable prices available from active markets. Valuation is based on the net asset value of fund units held as derived from the fair value of the underlying assets. Debt securities categorized as Level 2 assets are generally valued based on independent broker/dealer bids or by comparison to other debt securities having similar durations, yields and credit ratings. Other Level 2 assets are valued based on a net asset value of fund units held, which is derived from either market-observed pricing for the underlying assets or broker/dealer quotation. U.S. equity securities clas-sified as Level 3 are fund investments in private companies. Valuation techniques and inputs for these assets include discounted cash flow analysis, earnings multiple approaches, recent transactions, transferability restrictions, prevailing discount rates, volatilities, credit ratings and other factors. In the Other class, interests in mixed assets funds are Level 2, and U.S. life insurance contracts and non-U.S. general fund investments and insurance arrangements are Level 3.
A reconciliation of the change in value for Level 3 assets follows:
2011 2012
Beginning balance, October 1 $249 267 Gains (Losses) on assets held 34 9 Gains (Losses) on assets sold (9) (16) Purchases, sales and settlements, net (7) (10)
Ending balance, September 30 $267 250
(11) Postretirement PlansThe Company sponsors unfunded postretirement benefit plans (primarily health care) for U.S. retirees and their dependents. The components of net postretirement benefits expense for the years ended September 30 follow:
2010 2011 2012
Service cost $ 5 3 2Interest cost 24 17 16Net amortization 1 (7) (11)
Net postretirement expense $30 13 7
Reconciliations of the actuarial present value of accumulated postretirement benefit obligations follow:
2011 2012
Benefit obligation, beginning $417 392 Service cost 3 2 Interest cost 17 16 Actuarial (gain) loss (25) (10) Benefits paid (20) (17) Plan amendments – (16)
Benefit obligation, ending (recognized in balance sheet) $392 367
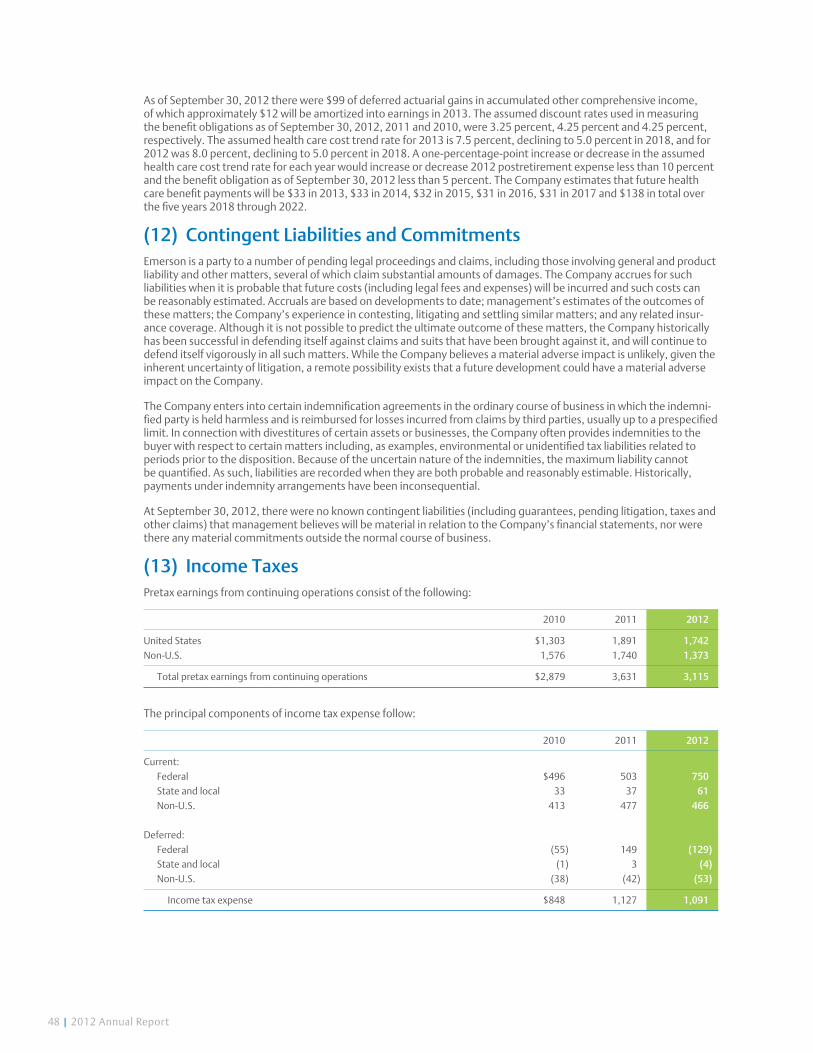
48 | 2012 Annual Report
As of September 30, 2012 there were $99 of deferred actuarial gains in accumulated other comprehensive income, of which approximately $12 will be amortized into earnings in 2013. The assumed discount rates used in measuring the benefit obligations as of September 30, 2012, 2011 and 2010, were 3.25 percent, 4.25 percent and 4.25 percent, respectively. The assumed health care cost trend rate for 2013 is 7.5 percent, declining to 5.0 percent in 2018, and for 2012 was 8.0 percent, declining to 5.0 percent in 2018. A one-percentage-point increase or decrease in the assumed health care cost trend rate for each year would increase or decrease 2012 postretirement expense less than 10 percent and the benefit obligation as of September 30, 2012 less than 5 percent. The Company estimates that future health care benefit payments will be $33 in 2013, $33 in 2014, $32 in 2015, $31 in 2016, $31 in 2017 and $138 in total over the five years 2018 through 2022.
(12) contingent liabilities and commitmentsEmerson is a party to a number of pending legal proceedings and claims, including those involving general and product liability and other matters, several of which claim substantial amounts of damages. The Company accrues for such liabilities when it is probable that future costs (including legal fees and expenses) will be incurred and such costs can be reasonably estimated. Accruals are based on developments to date; management’s estimates of the outcomes of these matters; the Company’s experience in contesting, litigating and settling similar matters; and any related insur-ance coverage. Although it is not possible to predict the ultimate outcome of these matters, the Company historically has been successful in defending itself against claims and suits that have been brought against it, and will continue to defend itself vigorously in all such matters. While the Company believes a material adverse impact is unlikely, given the inherent uncertainty of litigation, a remote possibility exists that a future development could have a material adverse impact on the Company.
The Company enters into certain indemnification agreements in the ordinary course of business in which the indemni-fied party is held harmless and is reimbursed for losses incurred from claims by third parties, usually up to a prespecified limit. In connection with divestitures of certain assets or businesses, the Company often provides indemnities to the buyer with respect to certain matters including, as examples, environmental or unidentified tax liabilities related to periods prior to the disposition. Because of the uncertain nature of the indemnities, the maximum liability cannot be quantified. As such, liabilities are recorded when they are both probable and reasonably estimable. Historically, payments under indemnity arrangements have been inconsequential.
At September 30, 2012, there were no known contingent liabilities (including guarantees, pending litigation, taxes and other claims) that management believes will be material in relation to the Company’s financial statements, nor were there any material commitments outside the normal course of business.
(13) income taxesPretax earnings from continuing operations consist of the following:
2010 2011 2012
United States $1,303 1,891 1,742Non-U.S. 1,576 1,740 1,373
Total pretax earnings from continuing operations $2,879 3,631 3,115
The principal components of income tax expense follow:
2010 2011 2012
Current: Federal $496 503 750 State and local 33 37 61 Non-U.S. 413 477 466
Deferred: Federal (55) 149 (129) State and local (1) 3 (4) Non-U.S. (38) (42) (53)
Income tax expense $848 1,127 1,091
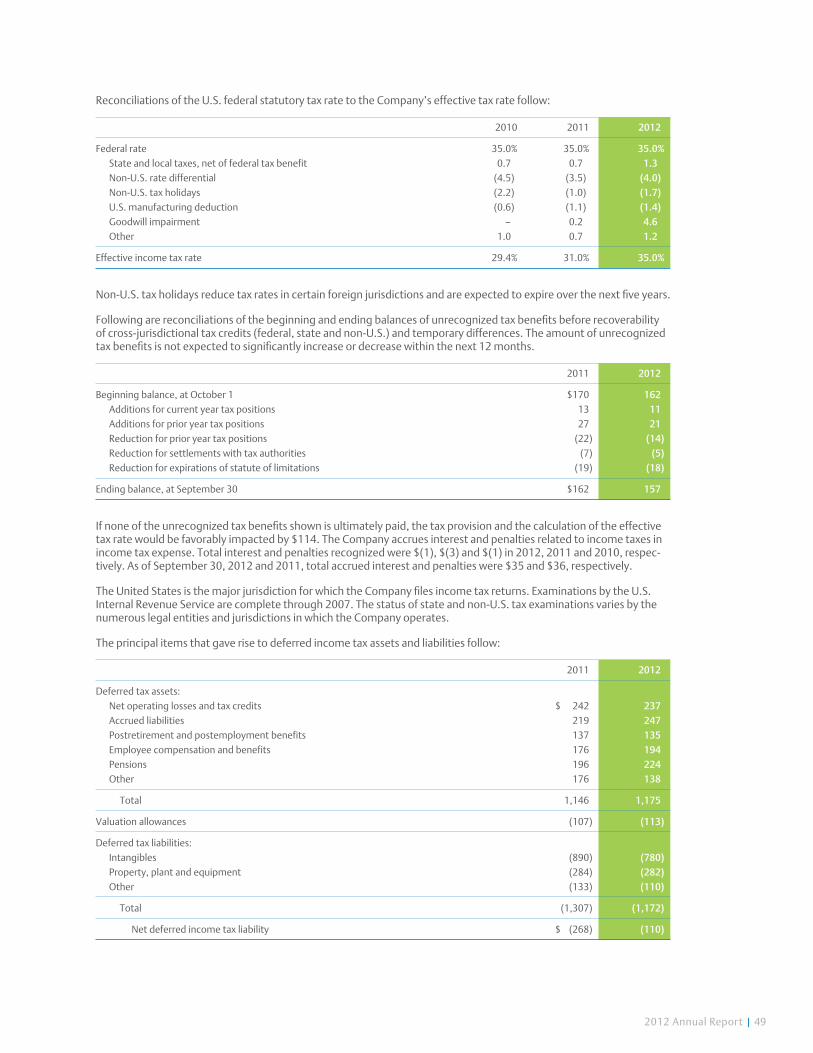
2012 Annual Report | 49
Reconciliations of the U.S. federal statutory tax rate to the Company’s effective tax rate follow:
2010 2011 2012
Federal rate 35.0% 35.0% 35.0% State and local taxes, net of federal tax benefit 0.7 0.7 1.3 Non-U.S. rate differential (4.5) (3.5) (4.0) Non-U.S. tax holidays (2.2) (1.0) (1.7) U.S. manufacturing deduction (0.6) (1.1) (1.4) Goodwill impairment – 0.2 4.6 Other 1.0 0.7 1.2
Effective income tax rate 29.4% 31.0% 35.0%
Non-U.S. tax holidays reduce tax rates in certain foreign jurisdictions and are expected to expire over the next five years.
Following are reconciliations of the beginning and ending balances of unrecognized tax benefits before recoverability of cross-jurisdictional tax credits (federal, state and non-U.S.) and temporary differences. The amount of unrecognized tax benefits is not expected to significantly increase or decrease within the next 12 months.
2011 2012
Beginning balance, at October 1 $170 162 Additions for current year tax positions 13 11 Additions for prior year tax positions 27 21 Reduction for prior year tax positions (22) (14) Reduction for settlements with tax authorities (7) (5) Reduction for expirations of statute of limitations (19) (18)
Ending balance, at September 30 $162 157
If none of the unrecognized tax benefits shown is ultimately paid, the tax provision and the calculation of the effective tax rate would be favorably impacted by $114. The Company accrues interest and penalties related to income taxes in income tax expense. Total interest and penalties recognized were $(1), $(3) and $(1) in 2012, 2011 and 2010, respec-tively. As of September 30, 2012 and 2011, total accrued interest and penalties were $35 and $36, respectively.
The United States is the major jurisdiction for which the Company files income tax returns. Examinations by the U.S. Internal Revenue Service are complete through 2007. The status of state and non-U.S. tax examinations varies by the numerous legal entities and jurisdictions in which the Company operates.
The principal items that gave rise to deferred income tax assets and liabilities follow:
2011 2012
Deferred tax assets: Net operating losses and tax credits $ 242 237 Accrued liabilities 219 247 Postretirement and postemployment benefits 137 135 Employee compensation and benefits 176 194 Pensions 196 224 Other 176 138
Total 1,146 1,175
Valuation allowances (107) (113)
Deferred tax liabilities: Intangibles (890) (780) Property, plant and equipment (284) (282) Other (133) (110)
Total (1,307) (1,172)
Net deferred income tax liability $ (268) (110)

50 | 2012 Annual Report
At September 30, 2012 and 2011, respectively, net current deferred tax assets were $377 and $400, and net noncur-rent deferred tax liabilities were $487 and $668. Total income taxes paid were approximately $1,300, $1,030 and $890 in 2012, 2011 and 2010, respectively. Approximately half of the $237 net operating losses and tax credits can be carried forward indefinitely, while the remainder expire over varying periods.
(14) stock-based compensationThe Company’s stock-based compensation plans include stock options, performance shares, restricted stock and restricted stock units. Although the Company has discretion, shares distributed under these plans are issued from treasury stock.
stoc k oPt ion s
The Company’s stock option plans permit key officers and employees to purchase common stock at specified prices. Awards from the 2011 plan were granted at 100 percent of the closing market price of the Company’s common stock on the date of grant, while prior awards were granted at 100 percent of the average of the high and low market prices on the date of grant. Options generally vest one-third each year and expire 10 years from the date of grant. Compen-sation expense is recognized ratably over the vesting period based on the number of options expected to vest. As of September 30, 2012, 19.7 million options were available for grant under the plans.
Changes in shares subject to option during the year ended September 30, 2012 follow:
average total average exercise price intrinsic value remaining (shares in thousands) per share shares of awards life (years)
Beginning of year $43.16 15,952 Options granted $44.03 945 Options exercised $29.62 (1,844) Options canceled $49.08 (450)
End of year $44.75 14,603 $93 6.0
Exercisable at year end $42.34 10,540 $87 5.1
The weighted-average grant date fair value per option was $7.53, $11.00 and $8.51 for 2012, 2011 and 2010, respec-tively. Cash received for option exercises was $42 in 2012, $65 in 2011 and $53 in 2010. The total intrinsic value of options exercised was $38, $49 and $59 in 2012, 2011 and 2010, respectively, and the actual tax benefit realized from tax deductions related to option exercises was $11, $16 and $4, respectively.
The grant date fair value of options is estimated using the Black-Scholes option-pricing model. Weighted-average assumptions used in valuations for 2012, 2011 and 2010 follow: risk-free interest rate, based on U.S. Treasury yields, 1.3 percent, 1.9 percent and 3.0 percent; dividend yields, 3.7 percent, 2.6 percent and 3.2 percent; and expected volatility, based on historical volatility, 27 percent, 25 percent and 25 percent. The expected life of an option is 7 years based on historical experience and expected future exercise patterns.
PerF or ma n c e sh a r es, r est r icted s tock and res tri cted s tock uni ts
The Company’s incentive shares plans include performance share awards which distribute the value of common stock to key management employees subject to certain operating performance conditions and other restrictions. Distribu-tion is primarily in shares of common stock and partially in cash. Compensation expense is recognized over the service period based on the number of awards expected to be ultimately earned. Performance share awards are accounted for as liabilities in accordance with ASC 718, Compensation - Stock Compensation, with compensation expense adjusted at the end of each reporting period to reflect the change in fair value of the awards.
As a result of the Company achieving the performance objective at the end of 2010 for performance shares primarily awarded in 2007, and employees providing an additional year of service, 4,777,248 rights to receive common shares vested and were distributed to participants in 2011 as follows: 2,841,534 issued in shares, 1,661,045 withheld for income taxes and 274,669 paid in cash. As of September 30, 2012 and 2011, 5,273,566 and 5,367,146 rights to receive common shares (awarded primarily in 2010) were outstanding, contingent on the Company achieving the perfor-mance objective through 2013 plus the provision of service by the employees.
Incentive shares plans also include restricted stock awards, which involve distribution of common stock to key manage-ment employees subject to cliff vesting at the end of service periods ranging from three to ten years. The fair value of restricted stock awards is determined based on the average of the high and low market prices of the Company’s common stock on the date of grant, with compensation expense recognized ratably over the applicable service period.
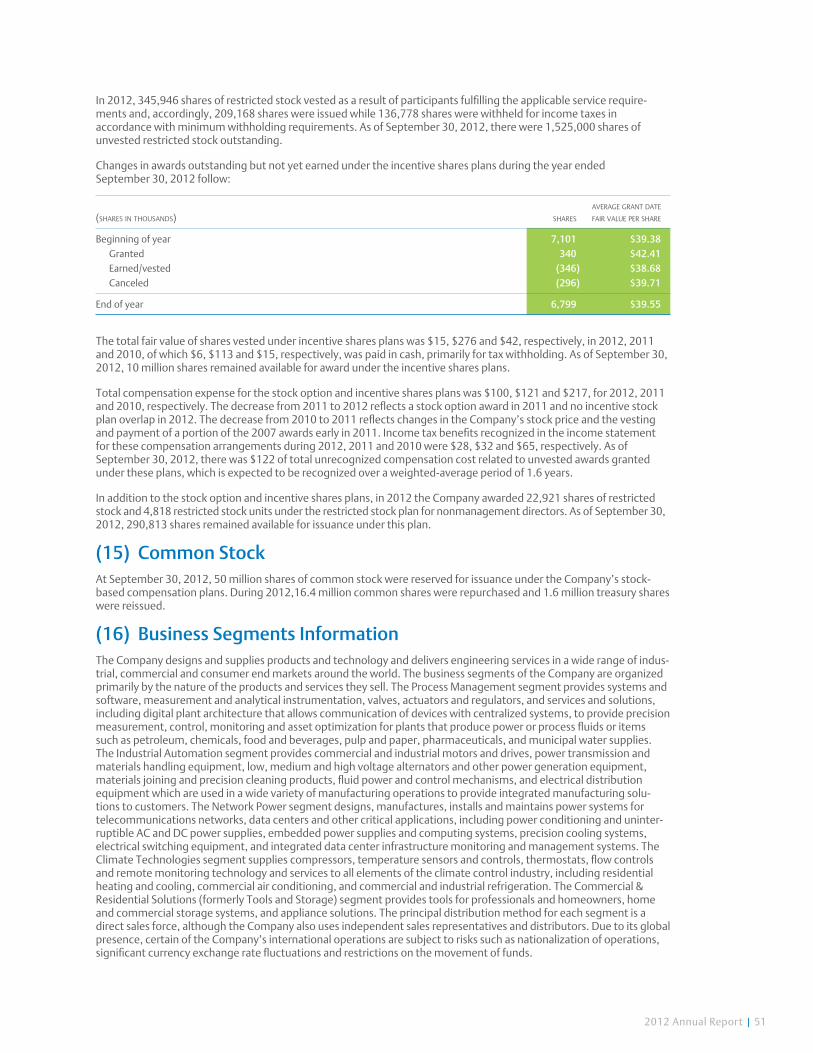
2012 Annual Report | 51
In 2012, 345,946 shares of restricted stock vested as a result of participants fulfilling the applicable service require-ments and, accordingly, 209,168 shares were issued while 136,778 shares were withheld for income taxes in accordance with minimum withholding requirements. As of September 30, 2012, there were 1,525,000 shares of unvested restricted stock outstanding.
Changes in awards outstanding but not yet earned under the incentive shares plans during the year ended September 30, 2012 follow:
average grant date (shares in thousands) shares fair value per share
Beginning of year 7,101 $39.38 Granted 340 $42.41 Earned/vested (346) $38.68 Canceled (296) $39.71
End of year 6,799 $39.55
The total fair value of shares vested under incentive shares plans was $15, $276 and $42, respectively, in 2012, 2011 and 2010, of which $6, $113 and $15, respectively, was paid in cash, primarily for tax withholding. As of September 30, 2012, 10 million shares remained available for award under the incentive shares plans.
Total compensation expense for the stock option and incentive shares plans was $100, $121 and $217, for 2012, 2011 and 2010, respectively. The decrease from 2011 to 2012 reflects a stock option award in 2011 and no incentive stock plan overlap in 2012. The decrease from 2010 to 2011 reflects changes in the Company’s stock price and the vesting and payment of a portion of the 2007 awards early in 2011. Income tax benefits recognized in the income statement for these compensation arrangements during 2012, 2011 and 2010 were $28, $32 and $65, respectively. As of September 30, 2012, there was $122 of total unrecognized compensation cost related to unvested awards granted under these plans, which is expected to be recognized over a weighted-average period of 1.6 years.
In addition to the stock option and incentive shares plans, in 2012 the Company awarded 22,921 shares of restricted stock and 4,818 restricted stock units under the restricted stock plan for nonmanagement directors. As of September 30, 2012, 290,813 shares remained available for issuance under this plan.
(15) common stockAt September 30, 2012, 50 million shares of common stock were reserved for issuance under the Company’s stock-based compensation plans. During 2012,16.4 million common shares were repurchased and 1.6 million treasury shares were reissued.
(16) business segments informationThe Company designs and supplies products and technology and delivers engineering services in a wide range of indus-trial, commercial and consumer end markets around the world. The business segments of the Company are organized primarily by the nature of the products and services they sell. The Process Management segment provides systems and software, measurement and analytical instrumentation, valves, actuators and regulators, and services and solutions, including digital plant architecture that allows communication of devices with centralized systems, to provide precision measurement, control, monitoring and asset optimization for plants that produce power or process fluids or items such as petroleum, chemicals, food and beverages, pulp and paper, pharmaceuticals, and municipal water supplies. The Industrial Automation segment provides commercial and industrial motors and drives, power transmission and materials handling equipment, low, medium and high voltage alternators and other power generation equipment, materials joining and precision cleaning products, fluid power and control mechanisms, and electrical distribution equipment which are used in a wide variety of manufacturing operations to provide integrated manufacturing solu-tions to customers. The Network Power segment designs, manufactures, installs and maintains power systems for telecommunications networks, data centers and other critical applications, including power conditioning and uninter-ruptible AC and DC power supplies, embedded power supplies and computing systems, precision cooling systems, electrical switching equipment, and integrated data center infrastructure monitoring and management systems. The Climate Technologies segment supplies compressors, temperature sensors and controls, thermostats, flow controls and remote monitoring technology and services to all elements of the climate control industry, including residential heating and cooling, commercial air conditioning, and commercial and industrial refrigeration. The Commercial & Residential Solutions (formerly Tools and Storage) segment provides tools for professionals and homeowners, home and commercial storage systems, and appliance solutions. The principal distribution method for each segment is a direct sales force, although the Company also uses independent sales representatives and distributors. Due to its global presence, certain of the Company’s international operations are subject to risks such as nationalization of operations, significant currency exchange rate fluctuations and restrictions on the movement of funds.
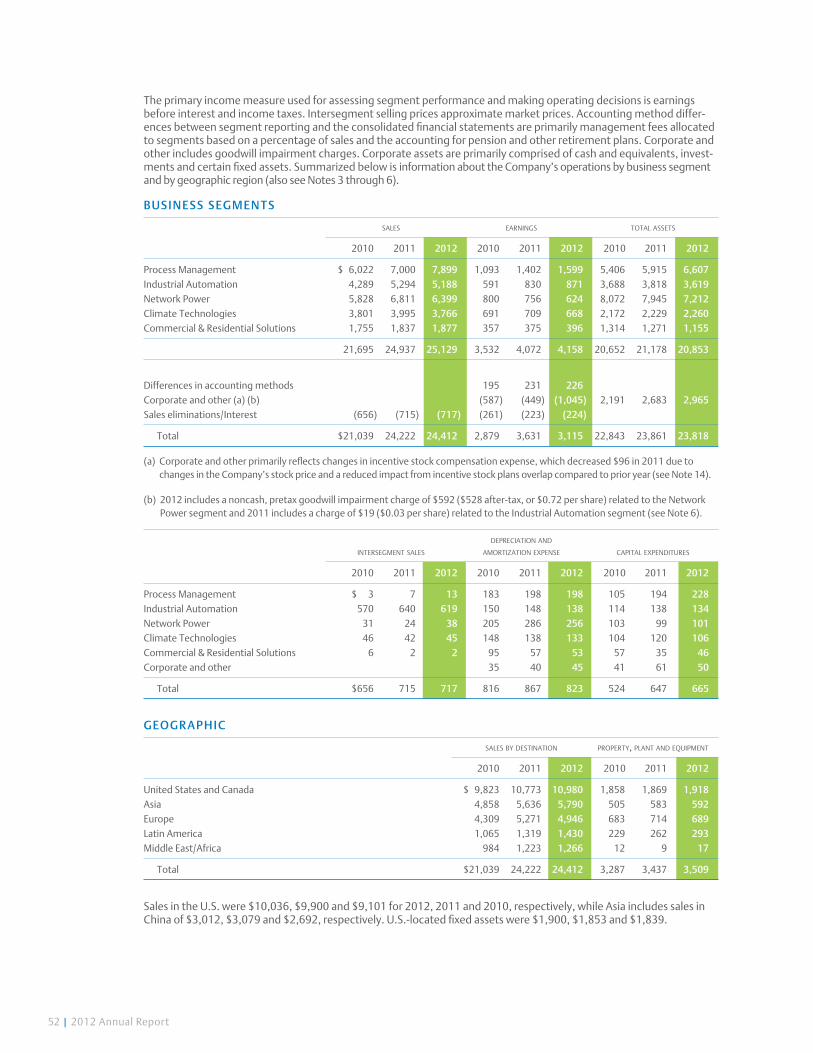
52 | 2012 Annual Report
The primary income measure used for assessing segment performance and making operating decisions is earnings before interest and income taxes. Intersegment selling prices approximate market prices. Accounting method differ-ences between segment reporting and the consolidated financial statements are primarily management fees allocated to segments based on a percentage of sales and the accounting for pension and other retirement plans. Corporate and other includes goodwill impairment charges. Corporate assets are primarily comprised of cash and equivalents, invest-ments and certain fixed assets. Summarized below is information about the Company’s operations by business segment and by geographic region (also see Notes 3 through 6).
business seg ment s
sales earnings total assets
2010 2011 2012 2010 2011 2012 2010 2011 2012
Process Management $ 6,022 7,000 7,899 1,093 1,402 1,599 5,406 5,915 6,607Industrial Automation 4,289 5,294 5,188 591 830 871 3,688 3,818 3,619Network Power 5,828 6,811 6,399 800 756 624 8,072 7,945 7,212Climate Technologies 3,801 3,995 3,766 691 709 668 2,172 2,229 2,260Commercial & Residential Solutions 1,755 1,837 1,877 357 375 396 1,314 1,271 1,155
21,695 24,937 25,129 3,532 4,072 4,158 20,652 21,178 20,853
Differences in accounting methods 195 231 226Corporate and other (a) (b) (587) (449) (1,045) 2,191 2,683 2,965Sales eliminations/Interest (656) (715) (717) (261) (223) (224)
Total $21,039 24,222 24,412 2,879 3,631 3,115 22,843 23,861 23,818
(a) Corporate and other primarily reflects changes in incentive stock compensation expense, which decreased $96 in 2011 due to changes in the Company’s stock price and a reduced impact from incentive stock plans overlap compared to prior year (see Note 14).
(b) 2012 includes a noncash, pretax goodwill impairment charge of $592 ($528 after-tax, or $0.72 per share) related to the Network Power segment and 2011 includes a charge of $19 ($0.03 per share) related to the Industrial Automation segment (see Note 6).
depreciation and intersegment sales amortization expense capital expenditures
2010 2011 2012 2010 2011 2012 2010 2011 2012
Process Management $ 3 7 13 183 198 198 105 194 228Industrial Automation 570 640 619 150 148 138 114 138 134Network Power 31 24 38 205 286 256 103 99 101Climate Technologies 46 42 45 148 138 133 104 120 106Commercial & Residential Solutions 6 2 2 95 57 53 57 35 46Corporate and other 35 40 45 41 61 50
Total $656 715 717 816 867 823 524 647 665
geogr a Ph ic
sales by destination property, plant and equipment
2010 2011 2012 2010 2011 2012
United States and Canada $ 9,823 10,773 10,980 1,858 1,869 1,918Asia 4,858 5,636 5,790 505 583 592 Europe 4,309 5,271 4,946 683 714 689Latin America 1,065 1,319 1,430 229 262 293Middle East/Africa 984 1,223 1,266 12 9 17
Total $21,039 24,222 24,412 3,287 3,437 3,509
Sales in the U.S. were $10,036, $9,900 and $9,101 for 2012, 2011 and 2010, respectively, while Asia includes sales in China of $3,012, $3,079 and $2,692, respectively. U.S.-located fixed assets were $1,900, $1,853 and $1,839.
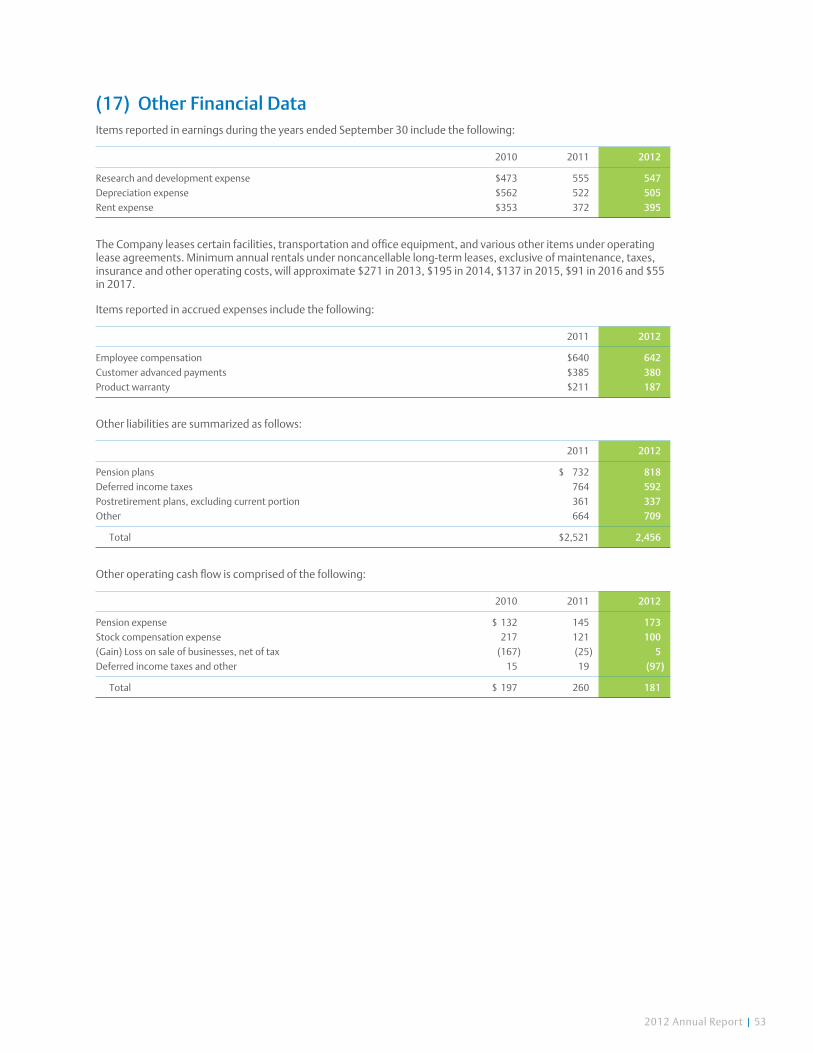
2012 Annual Report | 53
(17) other Financial dataItems reported in earnings during the years ended September 30 include the following:
2010 2011 2012
Research and development expense $473 555 547Depreciation expense $562 522 505Rent expense $353 372 395
The Company leases certain facilities, transportation and office equipment, and various other items under operating lease agreements. Minimum annual rentals under noncancellable long-term leases, exclusive of maintenance, taxes, insurance and other operating costs, will approximate $271 in 2013, $195 in 2014, $137 in 2015, $91 in 2016 and $55 in 2017.
Items reported in accrued expenses include the following:
2011 2012
Employee compensation $640 642Customer advanced payments $385 380Product warranty $211 187
Other liabilities are summarized as follows:
2011 2012
Pension plans $ 732 818Deferred income taxes 764 592Postretirement plans, excluding current portion 361 337Other 664 709
Total $2,521 2,456
Other operating cash flow is comprised of the following:
2010 2011 2012
Pension expense $ 132 145 173Stock compensation expense 217 121 100(Gain) Loss on sale of businesses, net of tax (167) (25) 5Deferred income taxes and other 15 19 (97)
Total $ 197 260 181
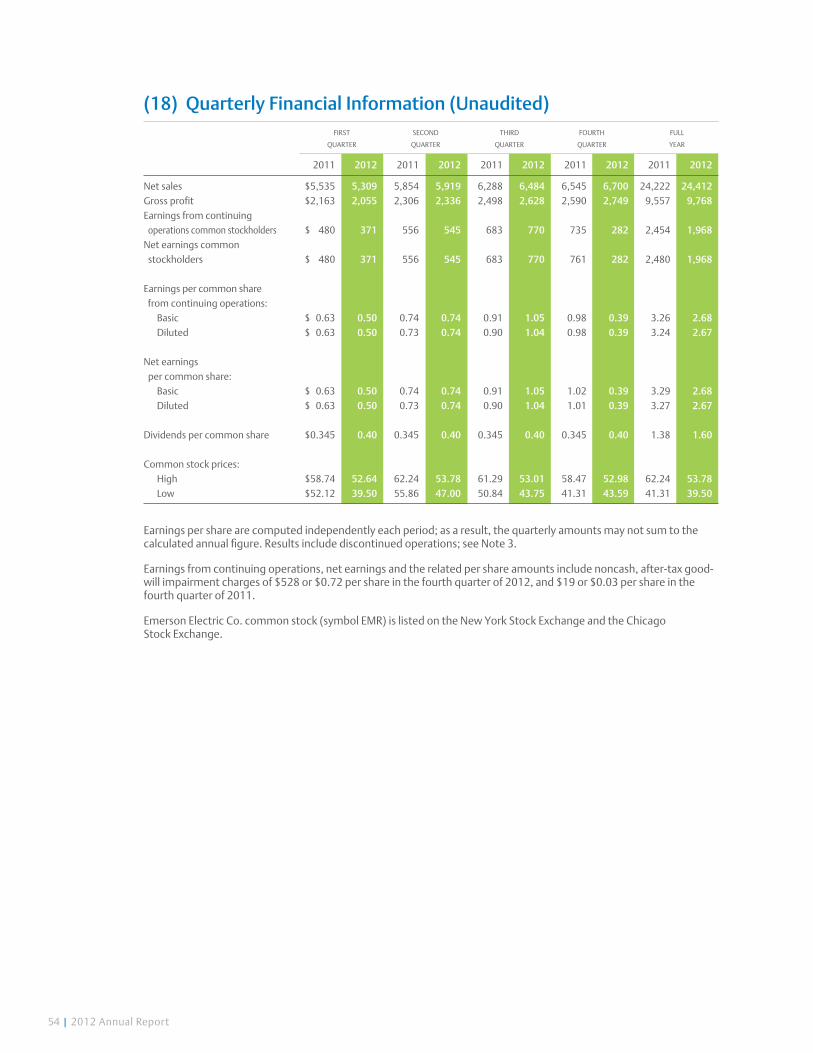
54 | 2012 Annual Report
(18) quarterly Financial information (unaudited) first second third fourth full quarter quarter quarter quarter year
2011 2012 2011 2012 2011 2012 2011 2012 2011 2012
Net sales $5,535 5,309 5,854 5,919 6,288 6,484 6,545 6,700 24,222 24,412Gross profit $2,163 2,055 2,306 2,336 2,498 2,628 2,590 2,749 9,557 9,768Earnings from continuing operations common stockholders $ 480 371 556 545 683 770 735 282 2,454 1,968Net earnings common stockholders $ 480 371 556 545 683 770 761 282 2,480 1,968 Earnings per common share from continuing operations: Basic $ 0.63 0.50 0.74 0.74 0.91 1.05 0.98 0.39 3.26 2.68 Diluted $ 0.63 0.50 0.73 0.74 0.90 1.04 0.98 0.39 3.24 2.67
Net earnings per common share: Basic $ 0.63 0.50 0.74 0.74 0.91 1.05 1.02 0.39 3.29 2.68 Diluted $ 0.63 0.50 0.73 0.74 0.90 1.04 1.01 0.39 3.27 2.67
Dividends per common share $0.345 0.40 0.345 0.40 0.345 0.40 0.345 0.40 1.38 1.60
Common stock prices: High $58.74 52.64 62.24 53.78 61.29 53.01 58.47 52.98 62.24 53.78 Low $52.12 39.50 55.86 47.00 50.84 43.75 41.31 43.59 41.31 39.50
Earnings per share are computed independently each period; as a result, the quarterly amounts may not sum to the calculated annual figure. Results include discontinued operations; see Note 3.
Earnings from continuing operations, net earnings and the related per share amounts include noncash, after-tax good-will impairment charges of $528 or $0.72 per share in the fourth quarter of 2012, and $19 or $0.03 per share in the fourth quarter of 2011.
Emerson Electric Co. common stock (symbol EMR) is listed on the New York Stock Exchange and the Chicago Stock Exchange.
2012 Annual Report | 55
report of independent registered Public accounting Firm The Board of Directors and Stockholders Emerson Electric Co.:
We have audited the accompanying consolidated balance sheets of Emerson Electric Co. and subsidiaries as of September 30, 2012 and 2011, and the related consolidated statements of earnings, equity, and cash flows for each of the years in the three-year period ended September 30, 2012. We also have audited Emerson Electric Co.’s internal control over financial reporting as of September 30, 2012, based on criteria established in Internal Control – Integrated Framework issued by the Committee of Sponsoring Organizations of the Treadway Commission (COSO). Emerson Electric Co.’s management is responsible for these consolidated financial statements, for maintaining effective internal control over financial reporting, and for its assessment of the effectiveness of internal control over financial reporting, included in the accompanying Management’s Report on Internal Control over Financial Reporting. Our responsibility is to express an opinion on these consolidated financial statements and an opinion on the Company’s internal control over financial reporting based on our audits.
We conducted our audits in accordance with the standards of the Public Company Accounting Oversight Board (United States). Those standards require that we plan and perform the audits to obtain reasonable assurance about whether the financial statements are free of material misstatement and whether effective internal control over finan-cial reporting was maintained in all material respects. Our audits of the consolidated financial statements included examining, on a test basis, evidence supporting the amounts and disclosures in the financial statements, assessing the accounting principles used and significant estimates made by management, and evaluating the overall financial statement presentation. Our audit of internal control over financial reporting included obtaining an understanding of internal control over financial reporting, assessing the risk that a material weakness exists, and testing and evalu-ating the design and operating effectiveness of internal control based on the assessed risk. Our audits also included performing such other procedures as we considered necessary in the circumstances. We believe that our audits provide a reasonable basis for our opinions.
A company’s internal control over financial reporting is a process designed to provide reasonable assurance regarding the reliability of financial reporting and the preparation of financial statements for external purposes in accordance with generally accepted accounting principles. A company’s internal control over financial reporting includes those policies and procedures that (1) pertain to the maintenance of records that, in reasonable detail, accurately and fairly reflect the transactions and dispositions of the assets of the company; (2) provide reasonable assurance that transactions are recorded as necessary to permit preparation of financial statements in accordance with generally accepted accounting principles, and that receipts and expenditures of the company are being made only in accordance with authorizations of management and directors of the company; and (3) provide reasonable assurance regarding prevention or timely detection of unauthorized acquisition, use, or disposition of the company’s assets that could have a material effect on the financial statements.
Because of its inherent limitations, internal control over financial reporting may not prevent or detect misstatements. Also, projections of any evaluation of effectiveness to future periods are subject to the risk that controls may become inadequate because of changes in conditions, or that the degree of compliance with the policies or procedures may deteriorate.
In our opinion, the consolidated financial statements referred to above present fairly, in all material respects, the financial position of Emerson Electric Co. and subsidiaries as of September 30, 2012 and 2011, and the results of its operations and its cash flows for each of the years in the three-year period ended September 30, 2012, in conformity with U.S. generally accepted accounting principles. Also in our opinion, Emerson Electric Co. maintained, in all material respects, effective internal control over financial reporting as of September 30, 2012, based on criteria established in Internal Control – Integrated Framework issued by the Committee of Sponsoring Organizations of the Treadway Commission.
St. Louis, Missouri November 19, 2012
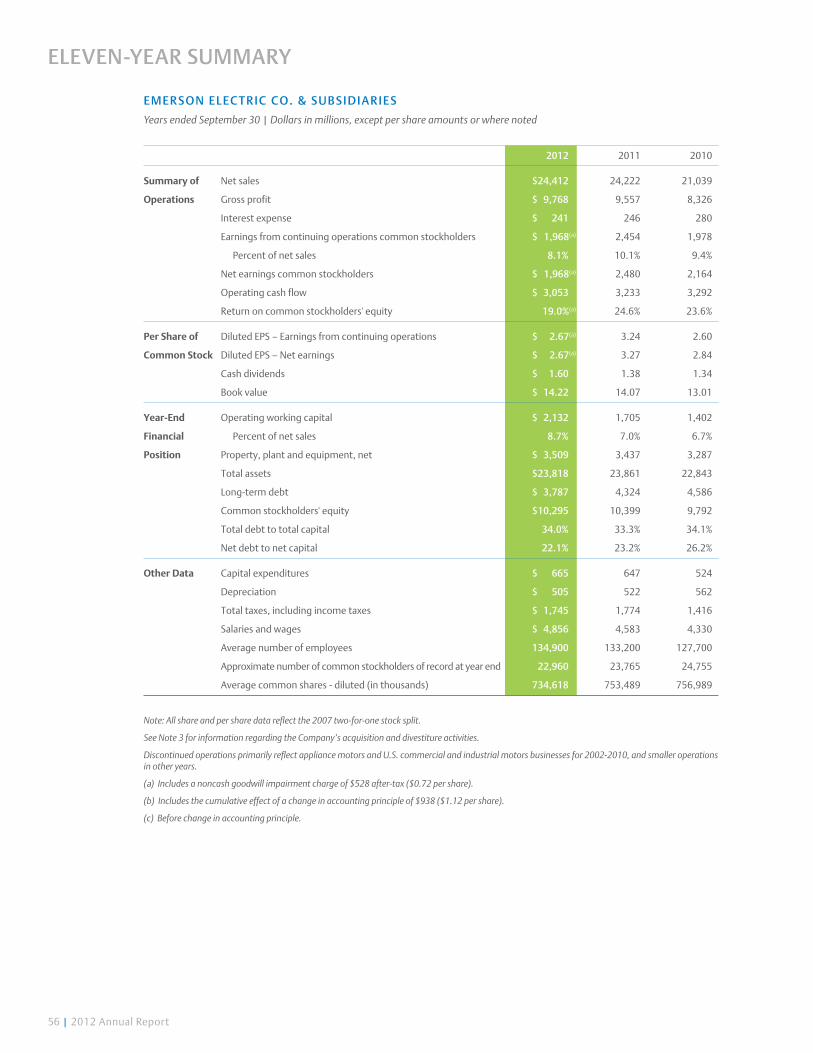
56 | 2012 Annual Report
emerson elec t r ic c o. & su bs i di ari es
Years ended September 30 | Dollars in millions, except per share amounts or where noted
2012 2011 2010
Summary of Net sales $24,412 24,222 21,039
Operations Gross profit $ 9,768 9,557 8,326
Interest expense $ 241 246 280
Earnings from continuing operations common stockholders $ 1,968(a) 2,454 1,978
Percent of net sales 8.1% 10.1% 9.4%
Net earnings common stockholders $ 1,968(a) 2,480 2,164
Operating cash flow $ 3,053 3,233 3,292
Return on common stockholders' equity 19.0%(a) 24.6% 23.6%
Per Share of Diluted EPS – Earnings from continuing operations $ 2.67(a) 3.24 2.60
Common Stock Diluted EPS – Net earnings $ 2.67(a) 3.27 2.84
Cash dividends $ 1.60 1.38 1.34
Book value $ 14.22 14.07 13.01
Year-End Operating working capital $ 2,132 1,705 1,402
Financial Percent of net sales 8.7% 7.0% 6.7%
Position Property, plant and equipment, net $ 3,509 3,437 3,287
Total assets $23,818 23,861 22,843
Long-term debt $ 3,787 4,324 4,586
Common stockholders' equity $10,295 10,399 9,792
Total debt to total capital 34.0% 33.3% 34.1%
Net debt to net capital 22.1% 23.2% 26.2%
Other Data Capital expenditures $ 665 647 524
Depreciation $ 505 522 562
Total taxes, including income taxes $ 1,745 1,774 1,416
Salaries and wages $ 4,856 4,583 4,330
Average number of employees 134,900 133,200 127,700
Approximate number of common stockholders of record at year end 22,960 23,765 24,755
Average common shares - diluted (in thousands) 734,618 753,489 756,989
Note: All share and per share data reflect the 2007 two-for-one stock split.
See Note 3 for information regarding the Company’s acquisition and divestiture activities.
Discontinued operations primarily reflect appliance motors and U.S. commercial and industrial motors businesses for 2002-2010, and smaller operations in other years.
(a) Includes a noncash goodwill impairment charge of $528 after-tax ($0.72 per share).
(b) Includes the cumulative effect of a change in accounting principle of $938 ($1.12 per share).
(c) Before change in accounting principle.
eleven-year summary
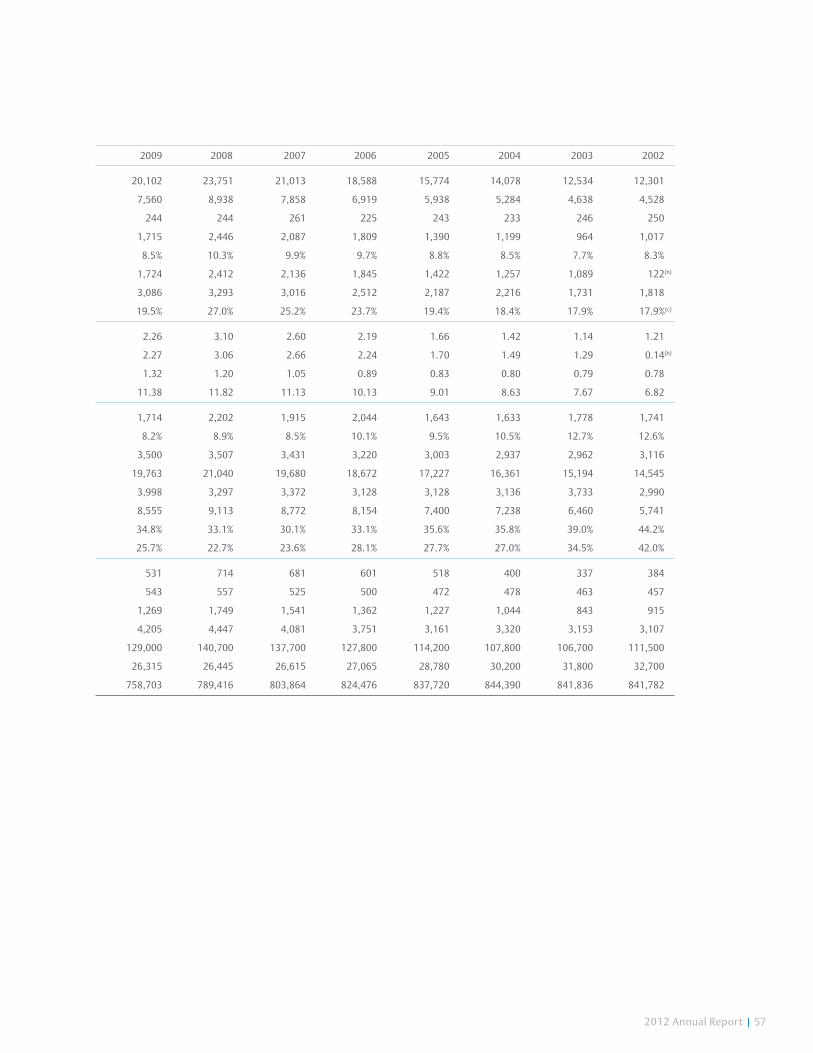
2012 Annual Report | 57
2009 2008 2007 2006 2005 2004 2003 2002
20,102 23,751 21,013 18,588 15,774 14,078 12,534 12,301
7,560 8,938 7,858 6,919 5,938 5,284 4,638 4,528
244 244 261 225 243 233 246 250
1,715 2,446 2,087 1,809 1,390 1,199 964 1,017
8.5% 10.3% 9.9% 9.7% 8.8% 8.5% 7.7% 8.3%
1,724 2,412 2,136 1,845 1,422 1,257 1,089 122(b)
3,086 3,293 3,016 2,512 2,187 2,216 1,731 1,818
19.5% 27.0% 25.2% 23.7% 19.4% 18.4% 17.9% 17.9%(c)
2.26 3.10 2.60 2.19 1.66 1.42 1.14 1.21
2.27 3.06 2.66 2.24 1.70 1.49 1.29 0.14(b)
1.32 1.20 1.05 0.89 0.83 0.80 0.79 0.78
11.38 11.82 11.13 10.13 9.01 8.63 7.67 6.82
1,714 2,202 1,915 2,044 1,643 1,633 1,778 1,741
8.2% 8.9% 8.5% 10.1% 9.5% 10.5% 12.7% 12.6%
3,500 3,507 3,431 3,220 3,003 2,937 2,962 3,116
19,763 21,040 19,680 18,672 17,227 16,361 15,194 14,545
3,998 3,297 3,372 3,128 3,128 3,136 3,733 2,990
8,555 9,113 8,772 8,154 7,400 7,238 6,460 5,741
34.8% 33.1% 30.1% 33.1% 35.6% 35.8% 39.0% 44.2%
25.7% 22.7% 23.6% 28.1% 27.7% 27.0% 34.5% 42.0%
531 714 681 601 518 400 337 384
543 557 525 500 472 478 463 457
1,269 1,749 1,541 1,362 1,227 1,044 843 915
4,205 4,447 4,081 3,751 3,161 3,320 3,153 3,107
129,000 140,700 137,700 127,800 114,200 107,800 106,700 111,500
26,315 26,445 26,615 27,065 28,780 30,200 31,800 32,700
758,703 789,416 803,864 824,476 837,720 844,390 841,836 841,782

58 | 2012 Annual Report
Clemens A.H. BoersigFrankfurt, Germany Retired Chairman of the Supervisory Board, Deutsche Bank AG
Joshua B. BoltenWashington, District of Columbia Managing Director, Rock Creek Global Advisors LLC
August A. Busch IIISt. Louis, Missouri Retired Chairman of the Board, Anheuser-Busch Companies, Inc.
David N. FarrSt. Louis, Missouri Chairman and Chief Executive Officer, Emerson
Carlos Fernandez G.Del. Alvaro Obregón, Mexico Chairman of the Board and Chief Executive Officer, Grupo Modelo, S.A.B. de C.V.
Walter J. GalvinSt. Louis, Missouri Vice Chairman, Emerson
Arthur F. GoldenNew York, New York Partner, Davis Polk & Wardwell
Harriet GreenLondon, United Kingdom Group Chief Executive Officer, Thomas Cook Group plc
William R. JohnsonPittsburgh, Pennsylvania Chairman, President and Chief Executive Officer, H.J. Heinz Company
Matthew S. LevatichMilwaukee, Wisconsin President and Chief Operating Officer, Harley-Davidson Motor Company, Inc.
Charles A. PetersSt. Louis, Missouri Senior Executive Vice President, Emerson
Joseph W. PrueherVirginia Beach, Virginia Admiral, USN (Ret) Former U.S. Ambassador to the People’s Republic of China
Rozanne L. RidgwayArlington, Virginia Chairman of the Board of CNA (formerly Center for Naval Analyses)
Randall L. StephensonDallas, Texas Chairman, Chief Executive Officer and President, AT&T Inc.
CHAI RMAN EMERI tuS
C.F. KnightRetired Chairman and Chief Executive Officer, Emerson
ADvI S oRy DI RECtoRS
E.K. FeeneyChairman, Emerson Network Power Systems
J.L. GeldmacherExecutive Vice President, Emerson
J.J. LindemannExecutive Vice President, Emerson
E.L. MonserPresident and Chief Operating Officer, Emerson
J-P.L. MontupetChairman, Emerson Industrial Automation
E.M. Purvis Jr.Executive Vice President, Emerson
P.J. SlyExecutive Vice President, Emerson
S.A. SonnenbergExecutive Vice President, Emerson
CoMMI ttEES
Executive CommitteeD.N. Farr, Chair C.A.H. Boersig A.A. Busch III A.F. Golden R.L. Ridgway R.L. Stephenson
Audit CommitteeA.A. Busch III, Chair J.B. Bolten H. Green R.L. Ridgway
Compensation CommitteeR.L. Stephenson, Chair C.A.H. Boersig W.R. Johnson M.S. Levatich J.W. Prueher
Corporate Governance and Nominating CommitteeR.L. Ridgway, Chair J.B. Bolten C. Fernandez G. H. Green R.L. Stephenson
Finance CommitteeC.A.H. Boersig, Chair A.A. Busch III A.F. Golden J.W. Prueher
W A Lt ER J . GAL vI N , having served Emerson with distinction and honor for 40 years, has decided to retire from his post as vice chairman in February 2013. Walter’s steady hand as chief financial officer for 17 years guided the company and the Board of Directors as we charted our investments in global growth and technology innovation. Walter joined Emerson in 1973, and over the years held many positions of increased responsibility in our businesses and at the corporate level. He became CFO in 1993, and in 2000 was named executive vice president and a management member of the board. Walter was named senior executive vice president in 2004 and vice chairman in 2009. We wish you, Nancy and your entire family all the best. Thank you for all you have done for this company and for our shareholders.
BoARD oF DIRECtoRS

2012 Annual Report | 59
SENIoR MANAGEMEN t
D.N. FarrChairman and Chief Executive Officer
W.J. GalvinVice Chairman
E.L. MonserPresident and Chief Operating Officer
C.A. PetersSenior Executive Vice President
C.W. AshmoreExecutive Vice President Planning and Development
F.J. DellaquilaExecutive Vice President and Chief Financial Officer
F.L. SteevesExecutive Vice President, Secretary and General Counsel
oPERAtING MANAGEMEN t
D.S. BarbourExecutive Vice President
M.J. BulandaExecutive Vice President
J.L. GeldmacherExecutive Vice President
J.J. LindemannExecutive Vice President
E.M. Purvis Jr.Executive Vice President
P.J. SlyExecutive Vice President
S.A. SonnenbergExecutive Vice President
W.t. BoswayGroup Vice President
t.D. BuzbeeGroup Vice President
L.W. FlattGroup Vice President
R.S. KerstetterGroup Vice President
J.A. NyquistGroup Vice President
P.E. SarrePresident- Emerson Europe and Group Vice President
J.N. vinceGroup Vice President
J-P.D. yaouancGroup Vice President
C oR PoR A t E M A N A GEM ENt
J.L. BanschVice President- Benefits
A. BlochteinVice President- Emerson Latin America Shared Services
E.M. BooneVice President- Asia Pacific Supply Chain
S.y. BoscoPresident- Emerson Asia Pacific
R.E. BrowningVice President- Development
K. Button BellVice President and Chief Marketing Officer
J.R. CariusVice President and Chief Employment Counsel
P.G. ConradVice President- Tax Planning
M.J. CousineauPresident- Emerson Canada
P.t. FitzgeraldAssistant Treasurer and Director- Investor Relations
L.A. FlavinVice President- Audit and Chief Compliance Officer
G.A. FromknechtVice President- Global Logistics
C.G. HeathVice President- Executive Compensation
S.L. KarsanbhaiVice President- Planning
M.J. KeatingVice President and Associate General Counsel
C.P. KelaartVice President- Supply Chain
J.F. KellyVice President- Financial Services
H.J. Lamboley Jr.Vice President and General Counsel- Asia Pacific
v.A. LazzarettiVice President and Deputy General Counsel
A.E. LebonVice President- Labor Relations
R.D. LedfordSenior Vice President and Chief Technology Officer
R.M. LevyVice President- Development
R.W. LockwoodVice President- International Trade Compliance
R.D. McDonaldVice President- Government Affairs
K.D. McElligottVice President and Chief Information Officer
P.E. McKnightSenior Advisor- Organization Planning
D.A. MeadeVice President- Pension Investments
C.G. MerkelVice President- Development
A.D. MielcusznyVice President- Development
D.C. MoonVice President- Tax
P.C. PalsenVice President- International Tax
S.J. PelchVice President- Organization Planning
D.J. RabeVice President and Treasurer
S.C. RoemerVice President- Financial Planning
M.G. RohretSenior Vice President- Human Resources
R.J. SchlueterVice President, Controller and Chief Accounting Officer
P. SenPresident- Emerson India, Middle East and Africa
R.t. SharpVice President- Profit Planning
t. vermillionVice President- Global Security
t.M. volkVice President- Employee Relations
S.E. von GrubenVice President- Aviation
t.G. WestmanVice President and General Counsel- Latin America
MANAGEMENt
60 | 2012 Annual Report
StoC K H oLD ER INqu IR IES AND SER vIC ES
Inquiries regarding dividend payments, loss or nonreceipt of a dividend check, stock transfers (including name changes, gifts, and inheritances), lost stock certificates, Form 1099 information, and address changes should be directed to the Registrar and Transfer Agent.
REGISt R A R A ND t R A N SF ER A GENt
By Mail: Computershare Shareowner Services LLC Attention: Emerson Electric Co. P.O. Box 358015 Pittsburgh, PA 15252-8015
or
Computershare Shareowner Services LLC Attention: Emerson Electric Co. 480 Washington Blvd., 27th Floor Jersey City, NJ 07310-1900
By Phone: Toll-Free: (888) 213-0970 TDD for Hearing Impaired: (800) 231-5469 Foreign Shareholders: (201) 680-6578 TDD Foreign Shareholders: (201) 680-6610
By Internet: www.cpushareownerservices.com
All other inquiries should be addressed to: Investor Relations Department, Station 2197 Emerson 8000 W. Florissant Ave. P.O. Box 4100 St. Louis, MO 63136-8506 Telephone: (314) 553-2197
DIvI D EN D R EINvESt MENt A ND StoC K Pu R C H A SE PLA N
The Plan is administered by Computershare, to individual investors who want a convenient, low-cost way to purchase or sell Emerson Electric Co. common stock (NYSE:EMR). You can participate in the Plan if you are a registered holder of Emerson common stock. If you do not own Emerson common stock, you can make your initial purchase directly through the Plan. The Plan provides you with the opportunity to reinvest dividends and is an alternative to traditional methods of buying, holding, and selling Emerson common stock. The Plan is not sponsored or administered by Emerson. For further information and an authorization form, contact the Registrar and Transfer Agent.
DI RECt DEPoS I t oF DI vI DENDS
Stockholders may elect to have dividends electronically deposited into a checking or savings account at a bank, savings and loan institution, or credit union. For details, contact the Registrar and Transfer Agent.
ANNuAL MEEtI NG
The annual meeting of stockholders will be held at 10 a.m. CST, Tuesday, February 5, 2013 in Emerson’s World Headquarters Building, 8000 W. Florissant Ave., St. Louis, Missouri 63136. Notice of the meeting, proxy statement, and proxy were sent to stockholders with this annual report.
1 0 - K REPoRt
A copy of the Company’s 2012 Annual Report on Form 10-K filed with the Securities and Exchange Commission is available to stockholders without charge. To obtain a copy, please contact the Investor Relations Department. The Company’s chief executive officer and chief financial officer have furnished the certifications required with the Form 10-K.
I NtERNEt ACCES S
Corporate news releases, Forms 10-K, 10-Q, and 8-K, the Annual Report, and other information about the Company are available through Emerson’s website on the Internet. It may be accessed as follows: www.Emerson.com
DuPL I CAtE MAI L I NGS
When stockholders own shares in more than one account or when several stockholders live at the same address, they may receive multiple copies of the annual report. To eliminate multiple copies, write to the Registrar and Transfer Agent.
ENvI RoNMENtAL PRoGRAMS
Information on Emerson’s environmental programs may be obtained by contacting: Environmental Affairs Department, Station 3800 Emerson 8000 W. Florissant Ave. P.O. Box 4100 St. Louis, MO 63136-8506
StoCKHoLDERS INFoRMAtIoN

_$150
_$100
_$50
_$0
2007 2012
reconcilia t ion of n on -ga a p f in a nci al measures (Dollars in millions, except per share amounts)
2011 2012
Underlying sales (non-GAAP) 3 %Foreign currency translation (2)% Acquisitions and divestitures, net – %
Net sales 1 %
Operating profit (non-GAAP) $4,332Operating profit margin % (non-GAAP) 17.7%Goodwill impairment, interest expense and other deductions, net 1,217
Pretax earnings $3,115Pretax earnings margin % 12.8%
Net earnings per share $ 3.27 2.67Goodwill impairment 0.03 0.72
Net earnings per share excluding goodwill impairment charge (non-GAAP) $ 3.30 3.39
comparison of f ive-yea r cumulative sh a r eh old er r et u r n
sept sept sept sept sept sept 2007 2008 2009 2010 2011 2012 CAGR
emerson 100 78 80 108 87 105 1.0%
S&P 500 Index 100 78 73 80 81 105 1.1%
Dow Jones US Electrical Components & Equipment Index 100 75 78 89 84 112 2.2%
$100 invested on 9/30/07 in stock or index, including reinvestment of dividends. Fiscal year ending September 30.
Copyright© 2012 Standard & Poor’s, a division of The McGraw-Hill Companies Inc. All rights reserved. (www.researchdatagroup.com/ standards-poors)
Copyright© 2012 Dow Jones & Company. All rights reserved.
s a f e h a r b o r s t a t e m e n t
This Annual Report contains various forward-looking statements and includes assumptions concerning Emerson’s operations, future results and prospects. These forward-looking statements are based on current expectations, are subject to risk and uncertainties, and Emerson undertakes no obligation to update any such statements to reflect later developments. In connection with the “safe harbor” provisions of the Private Securities Litigation Reform Act of 1995, Emerson provides the following cautionary statement identifying important economic, political and technological factors, among others, changes in which could cause the actual results or events to differ materially from those set forth in or implied by the forward-looking statements and related assumptions.
Such factors include, but are not limited to, the following: (1) current and future business environment, including interest rates, currency exchange rates and capital and consumer spending; (2) competitive factors and compet-itor responses to Emerson initiatives; (3) development and market introduction of anticipated new products; (4) ability to defend or protect our intellectual property rights; (5) favorable environment for acquisitions, domestic and foreign, including regulatory requirements and market values of candidates; (6) integration of acquisitions; (7) favorable access to capital markets; (8) availability of raw materials and purchased components; (9) stability of governments and business conditions in foreign countries, including emerging economies, which could result in nationalization of facilities or disruption of operations; (10) potential volatility of the end markets served; (11) outcome of pending and future litigation, including environmental compliance; (12) U.S. and foreign government laws and regulations, including taxes and restrictions; (13) penetration of emerging economies; and (14) execution of cost-reduction efforts.
; Emerson; Emerson Network Power; Emerson Industrial Automation; Emerson Process Management; Emerson Climate Technologies; Emerson Commercial & Residential Solutions; Trellis; Intelligent Store; Copeland Scroll; CHARMS; Smart Wireless; RIDGIDConnect; RIDGID; Metro; and their related designs and logo-types are trademarks, service marks and/or trade names of Emerson, its subsidiaries, affiliates, investments or joint ventures.
© Emerson Electric Co. 2012. All Rights Reserved

Emerson
World Headquarters
8000 W. Florissant Ave.
P.O. Box 4100
St. Louis, MO 63136
Emerson.com