Embed Size (px)
Citation preview

The smallest massive black holes in nearby galaxy nuclei
Aaron Barth (UC Irvine)
Jenny Greene (Harvard)Luis Ho (OCIW)
Carol Thornton (UC Irvine)Bob Rutledge (McGill)

(Tremaine et al. 2002)
The census of massive black holes is mainly being carried out for masses of 106.5 - 109.5 M⊙
?What can we learn about black hole
demographics below 106 M⊙?

Black holes below 106 M⊙: Open questions
• How massive are the initial seeds of SMBH?
• Can black holes form and grow in bulgeless galaxies?
• Event rates for LISA?
• Event rates for stellar tidal disruptions?
• Role of gravity-wave recoil kicks in BH evolution?

Nuclear star clusters in dwarf ellipticals
• Correlation of nuclear star cluster mass with host galaxy mass for dE galaxies follows the MBH-Mbulge relationCentral Massive Objects 3
Fig. 2.— Log of the mass of the central massive object (dEnucleus or central black hole) versus the log of the mass of the oldspheroidal component, both in Solar masses. The linear regression(solid) yields a slope of 1.04, supporting the idea that the directcorrelation between MBH !Mbulge continues to lower masses. Theaverage of the fits in X and Y is indicated by the dashed line.The dotted line marks the transitional potential-well mass, belowwhich central SBH formation is inhibited. The globular clusterdata (open circles) were taken from Kawakatu & Umemura (2005)and references therein.
the bulge of a bigger galaxy. This scaling then impliesthat the dE spheroid mass including the dark matterscales as Msph ! L0.7, which is parallel to the relationbetween MCMO and L in Fig. 1 above. This result im-mediately implies MCMO ! M1.0
sph for the dwarf galaxies.A straightforward linear regression fit of MCMO versus
Msph to the combined data in Fig. 2 yields
logMCMO = (1.04 ± 0.06)logMsph " (3.10 ± 0.60) (1)
whereas a fit assuming the scatter to be distributedequally between the two quantities yields the dashed linein Figure 2, given by
logMCMO = (1.18 ± 0.10)logMsph " (4.43 ± 0.81) (2)
The quoted uncertainties represent minimum 1! er-rors. These fits are mutually consistent to well withintheir 2! uncertainty. In summary, we find that theCMO mass in all these galaxies, defined either as thecentral black hole or the stellar-system nucleus, scalesaccurately in direct proportion to the surrounding massof the spheroid over 4 orders of magnitude. We notethat this trend has also been independently and simulta-neously identified by Cote et al. (2006); Ferrarese et al.(2006).
For sake of completeness, we also include in Fig. 2the upper limits for the suggested black hole massesin the globular clusters " Cen, M15, and M31-G1(Kawakatu & Umemura 2005, and references therein).As suggested by Gebhardt, Rich & Ho (2002) andGurkan, Freitag, & Rasio (2004), they lie close to the! 103"104M! black hole mass regime that would be ex-pected from an extreme downward extrapolation of theSBH relation. As noted above, however, it is unclearwhether they belong generically to the same sequence.
3. DISCUSSION
Although the connection we propose between SBHsand dE,N nuclei rests on some indirect argument, theunbroken continuum shown in the Figures, regardlessof modest slope changes, is highly suggestive that both
types of objects may represent two possible endpoints ofa similar initial formation process. Both types of objectsare at the deepest points in their surrounding large-scalepotential wells, and both are suggested to be quite old;that is, they were among the first substructures to haveformed within the initial spheroid of the host galaxy (e.g.Lotz, Miller & Ferguson 2004; Ferrarese 2002).
We suggest that the key factor deciding whether aCMO would end up as either a supermassive black holeor a globular-cluster-like stellar system may have beenthe rapidity of the initial gas infall rate to the center.This, in turn, will be driven by the depth of the large-scale potential well of the young host galaxy. For gasgravitating within the dark-matter halo of the spheroid,Haehnelt, Natarajan, & Rees (1998) find that the massdeposition rate at the center will increase with the halocircular velocity as M ! v3, or equivalently (Ferrarese2002) M ! MDM . Evidently, for the highest-massbulges, gas falls in rapidly and violently, favoring the for-mation of a black hole and quick initial growth. It seemsreasonable then to speculate that for smaller galaxieswith slower central accumulation rates, say timescalesvery roughly longer than ! 106 years, the central gasmass would have time to make stars, halt any further in-ward dissipation and collapse of the gas, and settle into asubsystem strongly resembling a massive globular clusteror UCD.
If this speculation is essentially correct, then Figures1 and 2 empirically identify the transition point wherethe CMO changes from a dE,N nucleus to a SBH. Thismass occurs at approximately MCMO # 107M! or equiv-alently Msph # 1010M!. Above that limit, formationof a SBH is strongly favored. Contrarily, galactic po-tential wells much smaller than this appear less likelyto support the formation and growth of a central blackhole; instead, the infalling gas generates a more familiar,though still very compact, stellar system. In this respect,the suggestions of Ferrarese (2002) that potential wells“... of mass smaller than ! 5 $ 1011M! are increasinglyless e!cient at forming SBHs – perhaps even unable toform them”, and of Haehnelt, Natarajan, & Rees (1998)that “there might be a physically determined lower limit[above 106M!] to the mass of a supermassive black hole”seem prescient. On the basis of the preceding arguments,we speculate that when it becomes possible to modelthis rapid central formation process more completely, theaccumulation of ! 107M! of gas within a “transition”bulge mass of ! 5 $ 109M! will be found to take 106
years or less.Our results are also more consistent with dE,N models
in which the formation of the dwarf galaxy and its mas-sive, distinct nucleus are linked and coeval. Lastly, wepoint out that this link may provide a physical reasonfor the long-observed upper mass limit of about 107M!
for old globular clusters (e.g. Harris et al. 2006).
EHW and WEH thank the Natural Sciences and En-gineering Research Council of Canada for financial sup-port. We are grateful to Pat Cote and Laura Ferraresefor comments on an early version, and for cooperatingwith the publication process.
– 11 –
Fig. 2.— (Left Panel) Mass of the Central Massive Object (CMO) plotted against absoluteblue magnitude of the host galaxy (or bulge for spiral galaxies). Nuclei from the ACSVCS
are shown as red squares. The supermassive black holes (SBHs) in early-type and spiralgalaxies are shown as filled and open circles respectively. Upper limits on the SBH mass are
shown for NGC205 and M33. (Middle Panel) CMO mass as a function of velocity dispersionof the host galaxy, measured within Re. (Right Panel) CMO mass plotted against galaxymass, defined as Mgal ! !Re"2/G with ! = 5 (Cappellari et al. 2006). In all panels, the
solid red and black lines show the least squares line of best fit to the nuclei and early-typeSBH samples respectively, with 1" confidence levels on the slope shown by the dotted lines.
In the middle panel, the dashed line is the best fit MSBH-" relation of Tremaine et al.(2002). In the right panel, the dashed line is the fit obtained for the combined nuclei+SBH
sample. Coe!cients for all fits are listed in Table 1.
(Wehner & Harris 2006) (Ferrarese et al. 2006)

M33: MBH < 1500 M⊙ (Gebhardt et al. 2001,
Merritt et al 2001)
NGC 205: MBH < 3.8 × 10⁴ M⊙(Valluri et al. 2005)
Are there BHs in late-type spirals and dEs?Upper limits in Local Group galaxies from HST
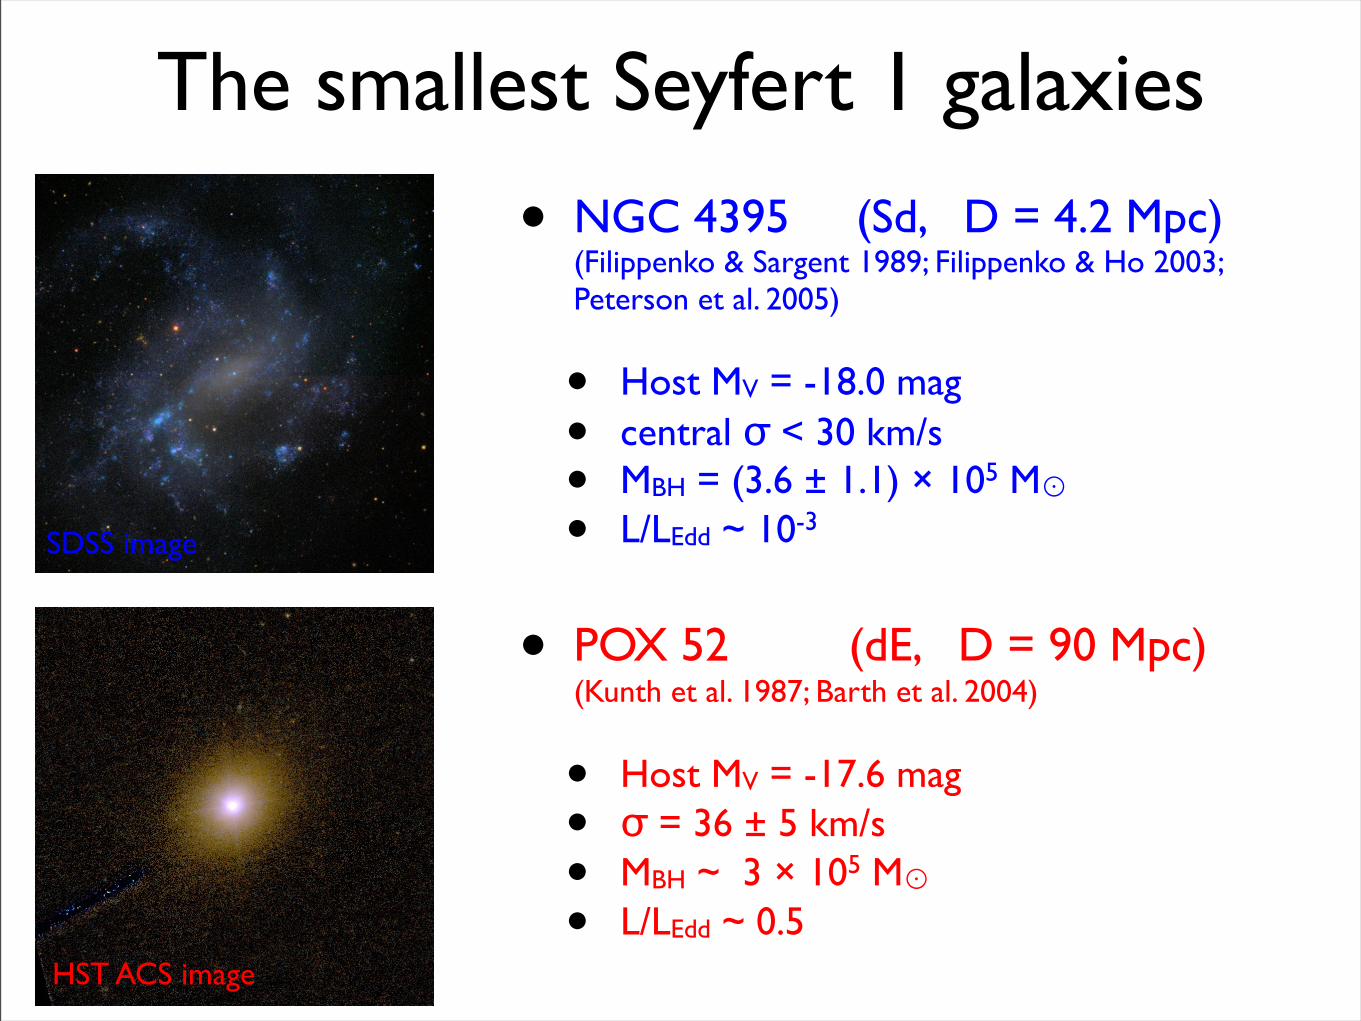
The smallest Seyfert 1 galaxies
• NGC 4395 (Sd, D = 4.2 Mpc) (Filippenko & Sargent 1989; Filippenko & Ho 2003; Peterson et al. 2005)
• Host MV = -18.0 mag
• central σ < 30 km/s
• MBH = (3.6 ± 1.1) × 105 M⊙• L/LEdd ~ 10-3
• POX 52 (dE, D = 90 Mpc) (Kunth et al. 1987; Barth et al. 2004)
• Host MV = -17.6 mag
• σ = 36 ± 5 km/s
• MBH ~ 3 × 10⁵ M⊙• L/LEdd ~ 0.5
SDSS image
HST ACS image

(SDSS data points from Kauffmann et al. 2003)
NGC 4395
H II
Seyfert
LINER
POX 52 NGC 4395 and POX 52 are AGNs
with subsolar metallicity
(Kraemer et al. 1999)

X-ray variability
2 Vaughan et al.
of its X-ray variability (Shih et al. 2003) using ASCA suggested the
expected power spectral break was present (at fbr ! 3"10!4 Hz),
but this was poorly determined due to the interrupted sampling of
the data (caused by the periodic Earth occulations and SAA pas-
sages of the low Earth orbit). XMM-Newton, with its ! 2 day orbitand high throughput, does not suffer from this problem and has
been providing the best constraints on the high frequency power
spectra of Seyferts (Vaughan et al. 2003a; Vaughan & Fabian 2003;
McHardy et al. 2004). The present paper describes a time series
analysis of the data from a long ! 100-ks XMM-Newton observa-tion of NGC 4395 designed to confirm the break timescale and test
the MBH # fbr scaling hypothesis. A future paper (Iwasawa et al.
in prep.) will discuss other aspects of this observation.
2 XMM-Newton OBSERVATION
NGC 4395 was observed by XMM-Newton (Jansen et al. 2001)
over 2003-November-30 and 2003-December-01 for a duration of
113, 384 s. This paper will concentrate on the results from the EPICpn camera which provided the highest signal-to-noise X-ray data.
Extraction of science products from the Observation Data
Files (ODFs) followed standard procedures using the XMM-
Newton Science Analysis System v5.6.0 (SAS). The data were
taken with the EPIC cameras in full-frame mode. The field of
NGC 4395 contains several other bright X-ray sources, although
the nucleus itself is not confused by these in the EPIC pn image.
Source data were therefore extracted from the pn image using a
circular region (of radius 45 arcsec) around the centroid of the nu-clear source. Only events corresponding to patterns 0 # 4 (singleand double pixel events) were used for the pn analysis. Background
events were extracted from a region on the same CCD unaffected
by source photons. These showed the background to be relatively
low and stable throughout the first 90 ks of the observation. Duringthe final ! 15 ks (as the spacecraft approached the radiation beltsat perigee) the background rate increased dramatically; these data
were ignored for the present analysis. The final extracted dataset
contained $ 9.85 " 104 source counts. The source count rate was
low enough that pile-up effects were negligible.
Light curves were extracted from the EPIC pn data in four
different energy bands: 0.2 # 10.0 keV (full band), 0.2 # 0.7 keV(soft band), 0.7#2.0 keV (medium band) and 2.0#10.0 keV (hardband). These were corrected for telemetry drop outs (less than 1 percent of the total time), background subtracted and binned to 50 stime resolution. The errors on the light curves were calculated by
propagating the Poisson noise. The light curves were not corrected
for the ! 71 per cent ‘live time’ of the pn camera (which is only ascaling factor). The full band light curve is shown in Fig. 1. During
the XMM-Newton observation the average 2 # 10 keV flux was
$ 5.6 " 10!12 erg s!1 , similar to the flux during the long ASCA
observation taken in 2001 ($ 4.7 " 10!12 erg s!1 ; Shih et al.
2003), indicating the source was in a fairly typical flux state.
3 TIME SERIES ANALYSIS
The average source (background subtracted) and background count
rates are shown in Table 1 along with the fractional excess rms
variability amplitude of the source (Fvar; Vaughan et al. 2003b) in
each energy band. The variability amplitude is remarkably high,
as can clearly be seen in the light curve (Fig. 1). A fractional rms
in excess of unity is extremely rare and only occurs in the most
Figure 1. EPIC pn light curve of NGC 4395 (0.2 ! 10 keV with 100 s
bins). The upper panel shows the light curve with the ordinate plotted on a
linear scale. The lower panel shows the same time series using a logarithmic
scale for the ordinate.
Table 1. Basic properties of the light curves. Mean source and background
count rates and fractional excess rms variability amplitudes (Fvar) in each
of the four energy bands (full = 0.2 ! 10.0 keV; soft = 0.2 ! 0.7 keV;medium = 0.7 ! 2.0 keV; hard = 2.0 ! 10.0 keV).
Band source (ct s!1) background (ct s!1) Fvar (%)
full 1.11 1.9 " 10!2 70.4 ± 1.2soft 0.28 5.9 " 10!3 105.9 ± 1.9medium 0.34 5.0 " 10!3 83.8 ± 1.5hard 0.49 7.8 " 10!3 43.2 ± 0.9
variable AGN known (NGC 4051, Green, McHardy & Done 1999;
IRAS 13224–3809, Boller et al. 1997). Thus NGC 4395 clearly
deserves to be compared to the most variable AGN. The maximum-
to-minimum variation through the length of the observation is a
factor ! 27.
3.1 Rms-flux correlation
As can clearly be seen in the light curve, the distribution of fluxes
seems asymmetric, with a skewed tail of very high fluxes, inter-
spersed between periods of low and stable flux. (As a crude test,
examine the light curve upside down. It appears qualitatively dif-
ferent when viewed this way indicating an asymmetry.) One might
be tempted to naively interpret the high points as individual events
(‘flares’ or ‘shots’) occurring between relatively quiescent periods.
However, there is a more straightforward interpretation in terms of
the ‘rms-flux’ relation known to exist in both Galactic X-ray bi-
naries (Uttley & McHardy 2001) and Seyfert galaxies (Vaughan
et al. 2003a; Vaughan et al. 2003b; McHardy et al. 2004). Fig. 2
demonstrates this relation operates in NGC 4395. As discussed by
Uttley, McHardy & Vaughan (2004) this is a natural artifact of
a non-linear transformation of some underlying linear variability
process. At high fluxes the rms amplitude is proportionally higher,
hence the light curve appears more erratic, while at low fluxes the
rms is lower and the light curve smoother. In effect the non-linear
transformation is a ‘stretching’ at high fluxes and a ‘compression’
at low fluxes. The effect on the light curve is more apparent in
Exceptional variability of NGC 4395 5
Figure 6. Time delay between energy bands. The three panels show, for
each combination of the three energy bands, the time delay between the
variations as a function of frequency. The data were binned into logarith-
mic frequency intervals ensuring each bin contained ! 10 cross-spectrum
estimates. There are no clearly detected delays.
Seyferts, such as NGC 7469 (Papadakis et al. 2001), MCG–6-30-15
(Vaughan et al. 2003a) and NGC 4051 (McHardy et al. 2004), the
delays are typically ! 1 per cent. The limits of the time delays forNGC 4395 therefore did not rule out typical time delay character-
istics. Although the variations in these relatively broad-band light
curves were highly coherent, there is a strong energy-dependence
to the amplitude of the variations. This will be discussed in a forth-
coming paper (Iwasawa et al. in prep).
4.2 TheMBH " fbr relation
Fig. 7 shows the MBH " fbr relation for ten Seyfert galaxies
using measurements from the literature (see also Markowitz et
al. 2003; McHardy et al. 2004; Papadakis 2004), together with
the new break frequency determined for NGC 4395. The power
spectral break frequencies from the other ten Seyferts were col-
lected from the following papers: Ark 564 (Papadakis et al.
2002); NGC 4051 (McHardy et al. 2004); NGC 3516, NGC 3783,
NGC 4151, NGC 5548, Fairall 9 (Markowitz et al. 2003); Mrk 766
(Vaughan & Fabian 2003); MCG–6-30-15 (Vaughan et al. 2003a)
and NGC 5506 (Uttley et al. 2002). Black hole mass estimates
were taken from the reverberation mapping studies where possible:
Ark 564 (upper limit from Collier et al. 2002); NGC 4051 (Shem-
mer et al. 2003); NGC 3516 (Wandel et al. 1999); NGC 3783,
NGC 4151, NGC 5548, Fairall 9 (Kaspi et al. 2000). For NGC 5506
the mass was estimated using the MBH " !! relation (section 2.3
of Papadakis 2004). For Mrk 766 and MCG–6-30-15 the mass es-
timates are very uncertain. Based on its bulge luminosity, Uttley et
al. (2002) argued for MBH ! 106 in MCG–6-30-15. Due to the
ambiguities in this method the error bars were taken to span an or-
der of magnitude in each direction. For Mrk 766, Wandel (2002)
estimated MBH ! 107 M" based on the optical luminosity and
line widths, while Woo & Urry (2002) estimated! 3.5# 106 M"
using the same reasoning. For the purpose of comparison a value of
6.8#106 M" (the mean of these two estimates) was used, again as-
suming an order of magnitude uncertainty in either direction. Also
shown are the typical frequencies of the high frequency break in
Cyg X-1 in both the low/hard and high/soft states.
Figure 7. The MBH ! fbr relation for 11 Seyfert galaxies including
NGC 4395. The masses are from reverberation mapping experiments ex-
cept for the four objects marked using dotted error bars. Also shown are
typical break frequencies for Cyg X-1 in both its low/hard and high/soft
states. The dotted lines show example MBH " 1/fbr relations consistent
with the Cyg X-1 points.
For NGC 4395 the break frequency fbf = 1.9+0.8#1.5 #10#3 Hz
was used together with a mass estimate ofMBH = 104"105 M".
This is the ‘best guess’ of Filippenko & Ho (2003) consistent with
the available estimates: they measured a firm upper limit on the
mass of!< 6.2 # 106 M" from stellar velocity measurements.
Based on photoionisation modelling of optical emission lines,
Kraemer et al. (1999) derived an estimate of ! 1.2 # 105 M",
while Filippenko & Ho (2003) estimated ! 1.3 # 104 M" based
on the relationship between optical luminosity and broad line re-
gion size. These are consistent with the mass estimated from the
MBH " !! relation (Tremaine et al. 2002): ! 6.6 # 104 M". It is
clear that, given the significant uncertainties in the mass estimates,
there is no glaring inconsistency between the new NGC 4395 mea-
surement and the hypothesisedMBH $ f#1br relation. However, the
details (such as whether the index of the relation is "1 and which,if any, state of Cyg X-1 provides the best comparison) remain to be
investigated as more Seyfert power spectra are measured.
Hayashida et al. (1998) estimated the black hole masses for
Seyferts by directly comparing their X-ray power spectra with that
of Cyg X-1. They measured the frequency fc at which the power
spectrum reaches the level fc # P (fc) = 10#3 and compared
this to the corresponding frequency in Cyg X-1. The motivation
for using this frequency, instead of the break frequency, is that the
break is often harder to measure and (in certain states at least) is
known to change frequency in Cyg X-1. There are a number of
underlying assumptions to this method. The first is that both the
slope and the (relative) normalisation of the high frequency power
spectra are similar for Seyferts and Cyg X-1, but the frequencies
scale inversely with the black hole mass. Implicit in this is the as-
sumption that we are using comparable energy bands in the two
types of source (the power spectrum is energy dependent). Fur-
thermore, the original value of fc for Cyg X-1 used by Hayashida
et al. (1998) was taken from an observation of the source in the
low/hard state. This method therefore also assumes that Seyferts
most closely resemble GBHs in the low/hard state, which may not
be the case (Vaughan et al. 2003a; McHardy et al. 2004). In the
case of NGC 4395 the frequency fc is not directly observed; the
power spectrum lies well above f # P (f) = 10#3 at all measured
NGC 4395
POX 52Chandra light curve
(Vaughan et al. 2005)
Thornton, Barth, et al, in progress...
NGC 4395

Finding more:Search strategies for SDSS
• What are the smallest black holes that can be identified from spectra of broad-lined AGNs?
• What are the smallest host galaxies that can be identified for objects with unambiguous AGN spectra?
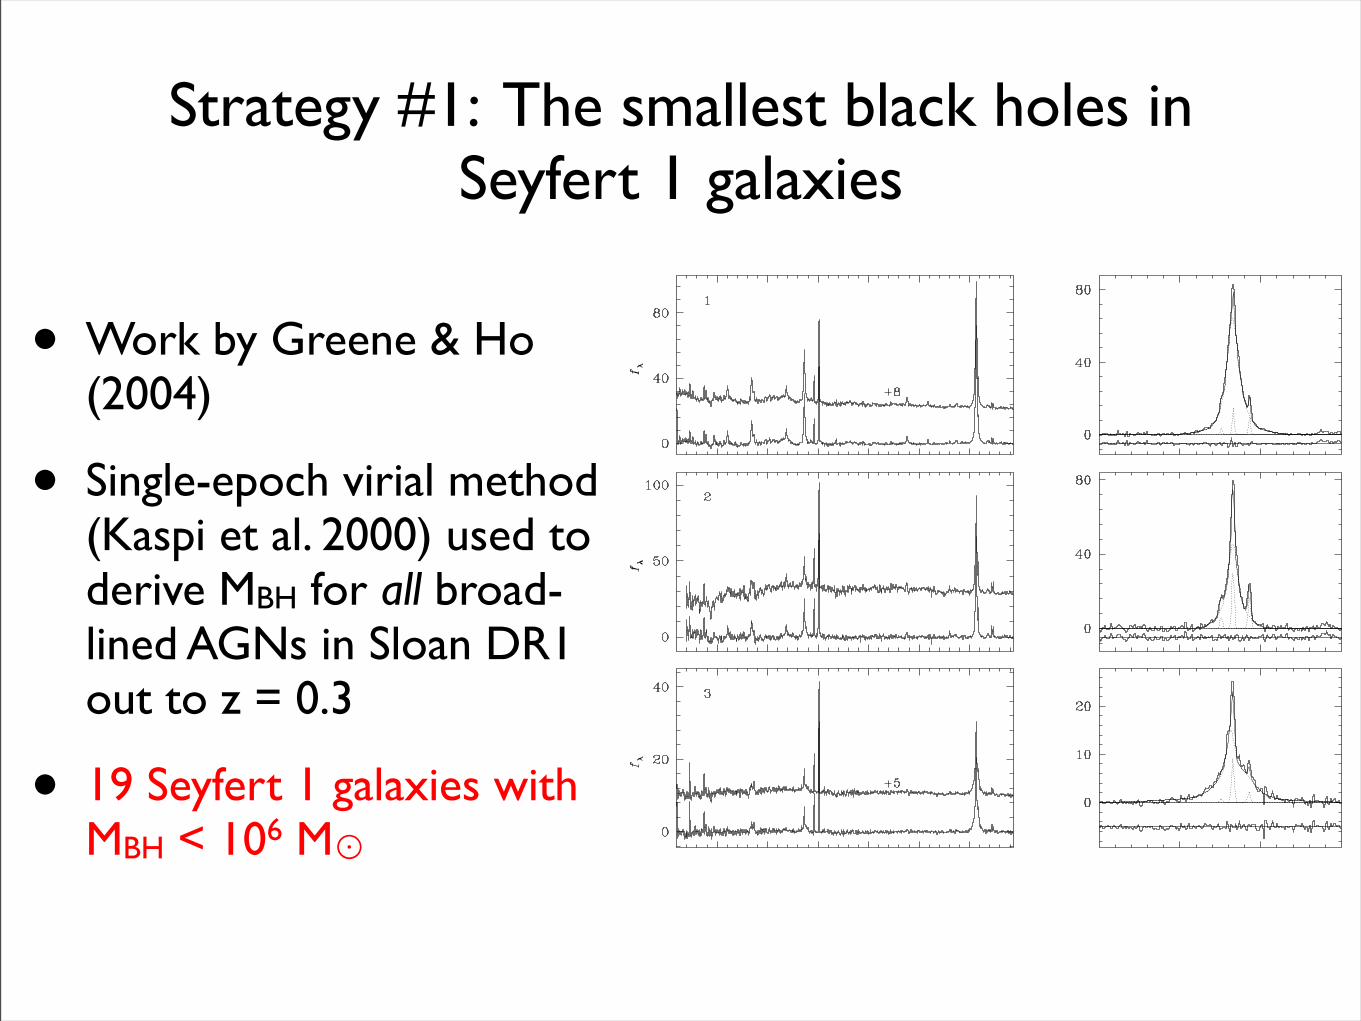
Strategy #1: The smallest black holes in Seyfert 1 galaxies
• Work by Greene & Ho (2004)
• Single-epoch virial method (Kaspi et al. 2000) used to derive MBH for all broad-lined AGNs in Sloan DR1 out to z = 0.3
• 19 Seyfert 1 galaxies with MBH < 106 M⊙

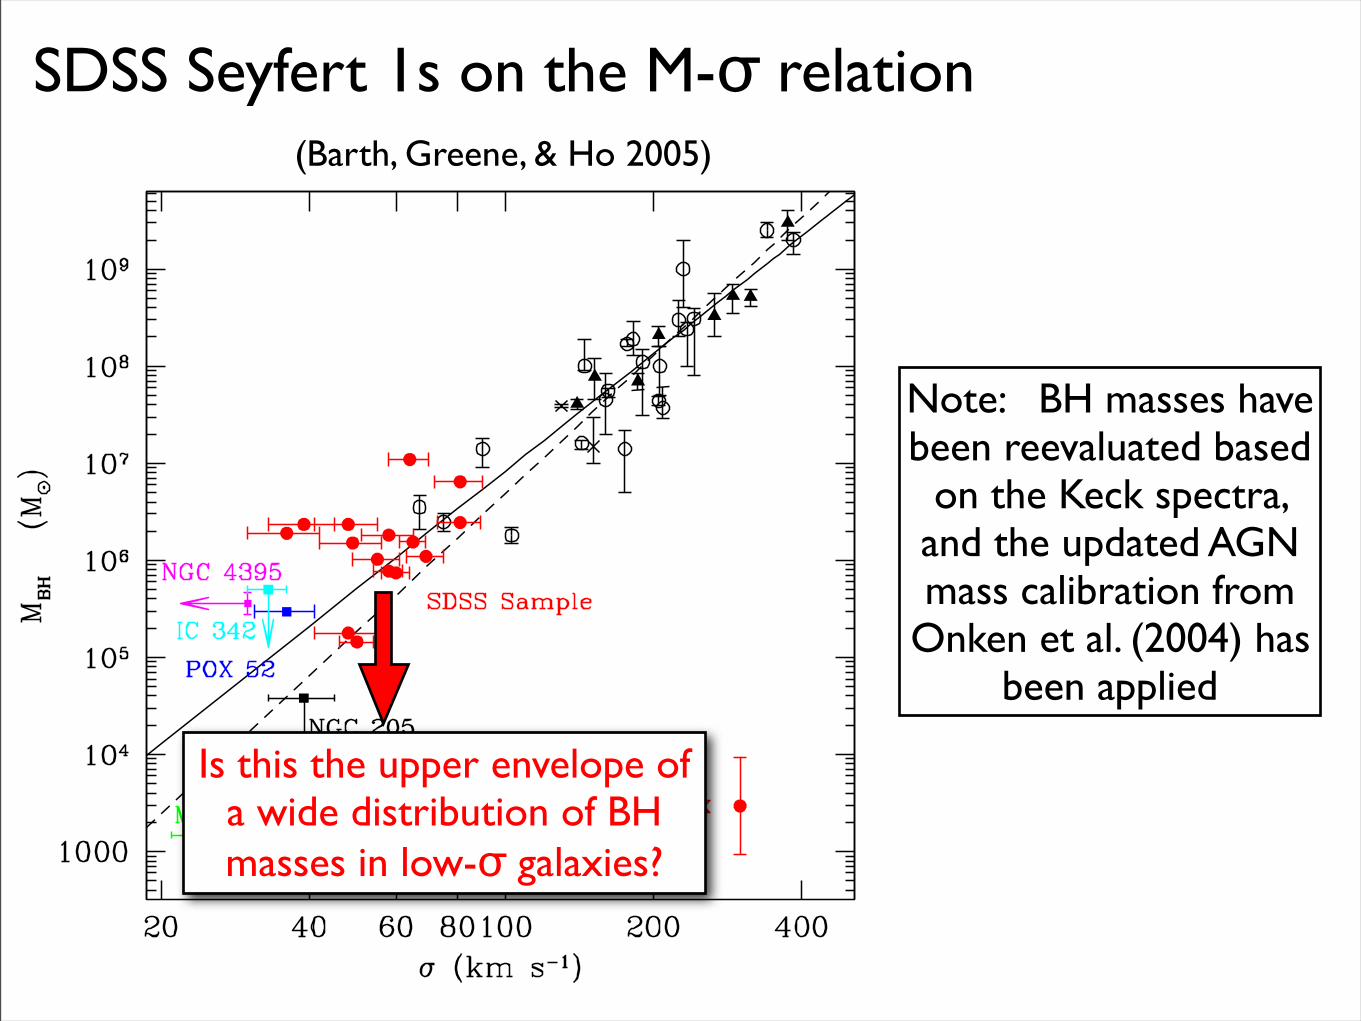
SDSS Seyfert 1s on the M-σ relation
±
(Barth, Greene, & Ho 2005)
Note: BH masses have been reevaluated based
on the Keck spectra, and the updated AGN mass calibration from
Onken et al. (2004) has been applied
SDSS Seyfert 1s on the M-σ relation
±
(Barth, Greene, & Ho 2005)
Note: BH masses have been reevaluated based
on the Keck spectra, and the updated AGN mass calibration from
Onken et al. (2004) has been applied
Is this the upper envelope of a wide distribution of BH masses in low-σ galaxies?
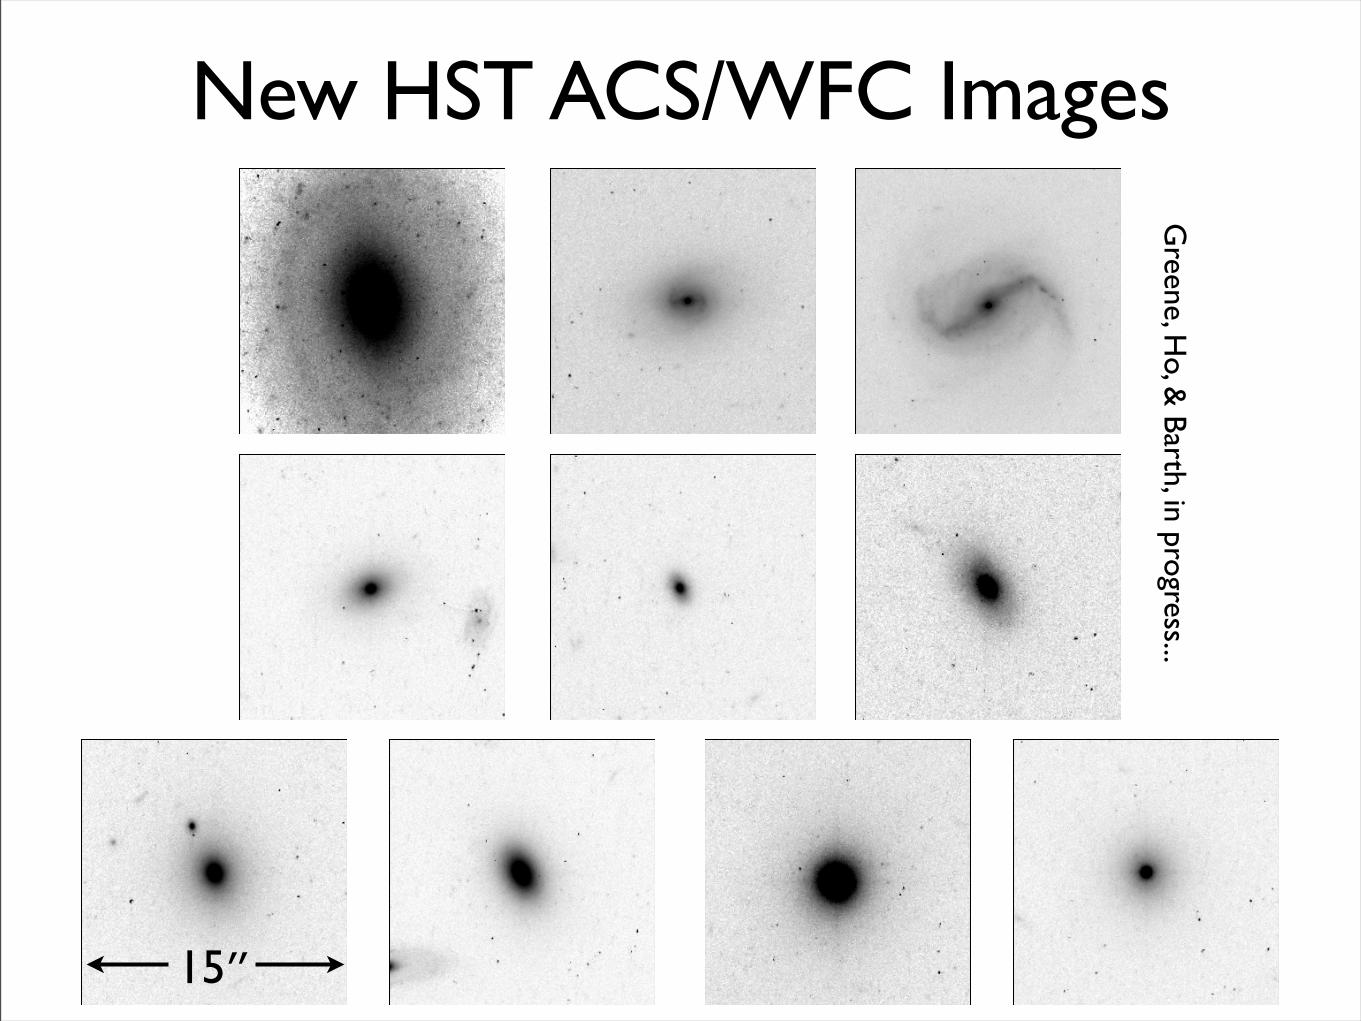
New HST ACS/WFC ImagesG
reene, Ho, &
Barth, in progress...
15″

Strategy #2: The smallest AGN host galaxies
(Compiled from the Kauffmann et al.
SDSS DR4 catalog)
Fraction of galaxies hosting “Type 2” AGNs, as a function
of host galaxy stellar mass

Strategy #2: The smallest AGN host galaxies
• From SDSS DR2 AGN catalog of Kauffmann et al. (2003), select a sample of the faintest Seyfert 2 host galaxies with unresolved velocity dispersions
• Mg > -19.5 mag
• New Keck observations of 29 galaxies so far
• 13 Seyfert 2s now identified with σ < 60 km/s

Are these really AGNs?
Coronal lines detected in Keck spectra
[Ne V] 3426
SDSS 1440+0247(σ = 47 ± 3 km/s)

• Mg = −16.8 mag
• Stellar mass 108.1 M⊙ (Kauffmann et al. 2003)
• σ([O III]) = 28 km/s
The smallest Seyfert host galaxy?
NGC 4395
SDSS 1109+6123
XMM & Spitzer observations coming soon...
SDSS 1109+6123

Conclusions
• AGNs do occur in host galaxies with velocity dispersions down to ~25-30 km/s, but:
• SDSS selection finds very few black holes below ~3×10⁵ M⊙
• unambiguous AGNs are extremely rare in galaxies with stellar mass below 109 M⊙
• There is tentative evidence for a flattening in the M-σ slope below σ = 100 km/s
• Next steps: Reverberation mapping to better constrain the black hole masses in the smallest AGNs