Embed Size (px)
DESCRIPTION
tesla model S
Citation preview

.086 comparo
Five slippery cars enter a wind tunnel;
one slinks out a winner.
by don shermanphotography by marK BramLeY
D Rag Queens
087
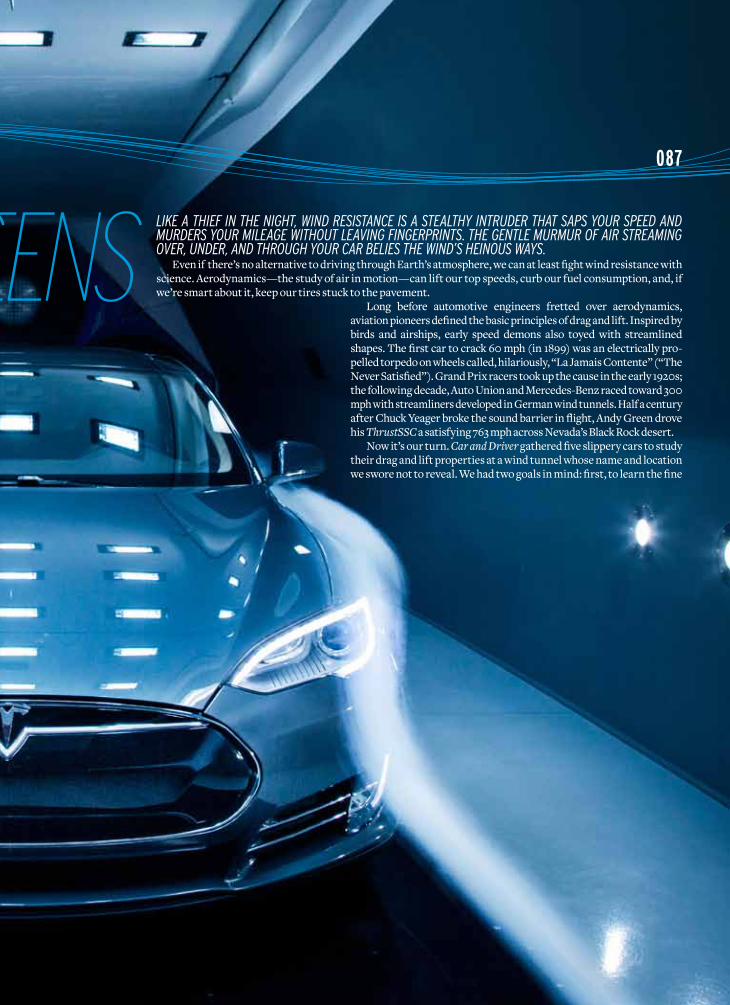
Like a thief in the night, wind resistance is a steaLthy intruder that saps your speed and murders your miLeage without Leaving fingerprints. the gentLe murmur of air streaming over, under, and through your car beLies the wind’s heinous ways.
Even if there’s no alternative to driving through Earth’s atmosphere, we can at least fight wind resistance with science. Aerodynamics—the study of air in motion—can lift our top speeds, curb our fuel consumption, and, if we’re smart about it, keep our tires stuck to the pavement.
Long before automotive engineers fretted over aerodynamics, aviation pioneers defined the basic principles of drag and lift. Inspired by birds and airships, early speed demons also toyed with streamlined shapes. The first car to crack 60 mph (in 1899) was an electrically pro-pelled torpedo on wheels called, hilariously, “La Jamais Contente” (“The Never Satisfied”). Grand Prix racers took up the cause in the early 1920s; the following decade, Auto Union and Mercedes-Benz raced toward 300 mph with streamliners developed in German wind tunnels. Half a century after Chuck Yeager broke the sound barrier in flight, Andy Green drove his ThrustSSC a satisfying 763 mph across Nevada’s Black Rock desert.
Now it’s our turn. Car and Driver gathered five slippery cars to study their drag and lift properties at a wind tunnel whose name and location we swore not to reveal. We had two goals in mind: first, to learn the fine
D Rag Queens
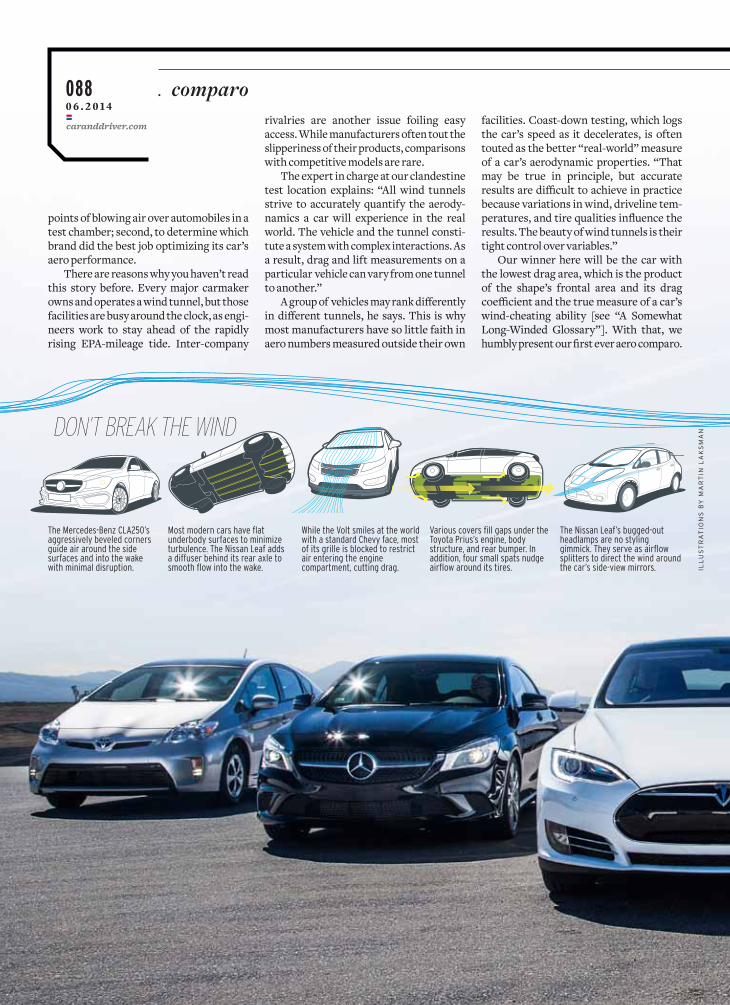
Most modern cars have flat underbody surfaces to minimize turbulence. The Nissan Leaf adds a diffuser behind its rear axle to smooth flow into the wake.
The Nissan Leaf’s bugged-out headlamps are no styling gimmick. They serve as airflow splitters to direct the wind around the car’s side-view mirrors.
Various covers fill gaps under the Toyota Prius’s engine, body structure, and rear bumper. In addition, four small spats nudge airflow around its tires.
While the Volt smiles at the world with a standard Chevy face, most of its grille is blocked to restrict air entering the engine compartment, cutting drag.
The Mercedes-Benz CLA250’s aggressively beveled corners guide air around the side surfaces and into the wake with minimal disruption.
0 6 . 2 0 1 4088 comparo
caranddriver.com
.
points of blowing air over automobiles in a test chamber; second, to determine which brand did the best job optimizing its car’s aero performance.
There are reasons why you haven’t read this story before. Every major carmaker owns and operates a wind tunnel, but those facilities are busy around the clock, as engi-neers work to stay ahead of the rapidly rising EPA-mileage tide. Inter-company
rivalries are another issue foiling easy access. While manufacturers often tout the slipperiness of their products, comparisons with competitive models are rare.
The expert in charge at our clandestine test location explains: “All wind tunnels strive to accurately quantify the aerody-namics a car will experience in the real world. The vehicle and the tunnel consti-tute a system with complex interactions. As a result, drag and lift measurements on a particular vehicle can vary from one tunnel to another.”
A group of vehicles may rank differently in different tunnels, he says. This is why most manufacturers have so little faith in aero numbers measured outside their own
facilities. Coast-down testing, which logs the car’s speed as it decelerates, is often touted as the better “real-world” measure of a car’s aerodynamic properties. “That may be true in principle, but accurate results are difficult to achieve in practice because variations in wind, driveline tem-peratures, and tire qualities influence the results. The beauty of wind tunnels is their tight control over variables.”
Our winner here will be the car with the lowest drag area, which is the product of the shape’s frontal area and its drag coefficient and the true measure of a car’s wind-cheating ability [see “A Somewhat Long-Winded Glossary”]. With that, we humbly present our first ever aero comparo.
DOn’T BReaK THe WInD
ILL
US
TR
AT
ION
S b
y M
AR
TIN
LA
KS
MA
N
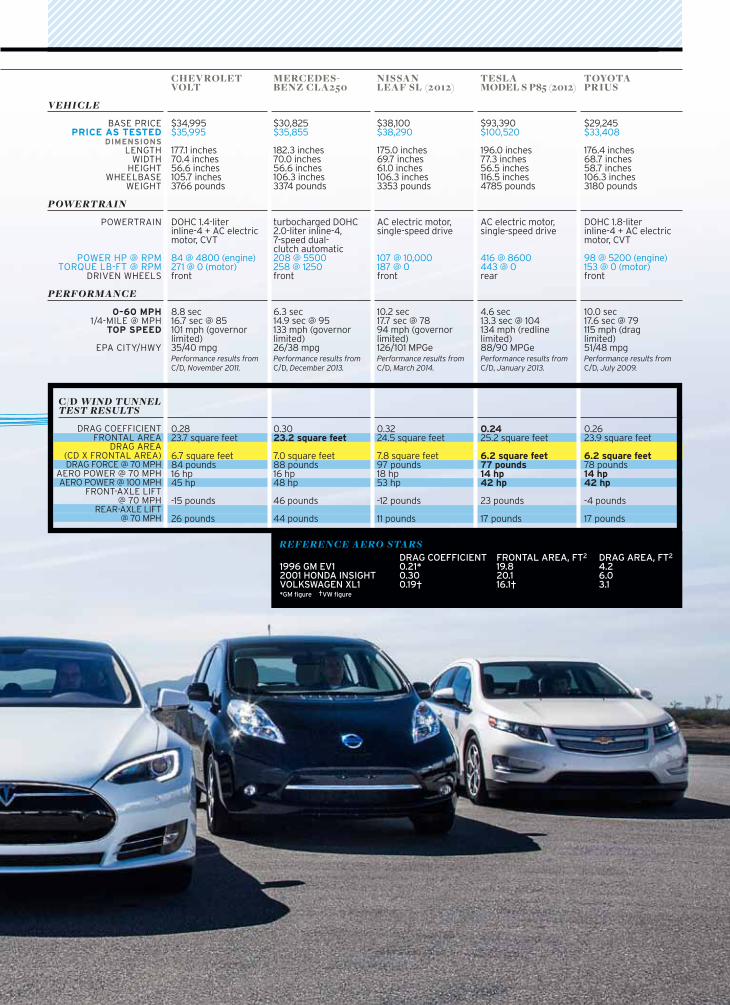
DRAG COEFFICIENT FRONTAL AREA, FT2 DRAG AREA, FT2
1996 GM EV1 0.21* 19.8 4.22001 HONDA INSIGHT 0.30 20.1 6.0VOLKSWAGEN XL1 0.19† 16.1† 3.1*GM figure †VW figure
REFERENCE AERO STARS
merCedes-BenZ CLa250
$30,825 $35,855 182.3 inches70.0 inches56.6 inches 106.3 inches 3374 pounds
turbocharged DOHC 2.0-liter inline-4, 7-speed dual-clutch automatic 208 @ 5500258 @ 1250front
6.3 sec 14.9 sec @ 95133 mph (governor limited) 26/38 mpg Performance results from C/D, December 2013.
0.30 23.2 square feet
7.0 square feet 88 pounds 16 hp 48 hp
46 pounds
44 pounds
nIssan LeaF sL (2012)
$38,100 $38,290 175.0 inches69.7 inches61.0 inches 106.3 inches 3353 pounds
AC electric motor, single-speed drive
107 @ 10,000187 @ 0front
10.2 sec 17.7 sec @ 7894 mph (governor limited) 126/101 Mpge Performance results from C/D, March 2014.
0.32 24.5 square feet
7.8 square feet 97 pounds 18 hp 53 hp
-12 pounds
11 pounds
TesLa modeL s P85 (2012)
$93,390 $100,520 196.0 inches77.3 inches56.5 inches 116.5 inches 4785 pounds
AC electric motor, single-speed drive
416 @ 8600443 @ 0rear
4.6 sec 13.3 sec @ 104134 mph (redline limited) 88/90 Mpge Performance results from C/D, January 2013.
0.24 25.2 square feet
6.2 square feet 77 pounds 14 hp 42 hp
23 pounds
17 pounds
ToYoTa PrIUs
$29,245 $33,408 176.4 inches68.7 inches58.7 inches 106.3 inches 3180 pounds
DOHC 1.8-liter inline-4 + AC electric motor, CVT
98 @ 5200 (engine) 153 @ 0 (motor)front
10.0 sec 17.6 sec @ 79115 mph (drag limited) 51/48 mpg Performance results from C/D, July 2009.
0.26 23.9 square feet
6.2 square feet 78 pounds 14 hp 42 hp
-4 pounds
17 pounds
CheVroLeT VoLT
$34,995 $35,995 177.1 inches70.4 inches56.6 inches 105.7 inches 3766 pounds
DOHC 1.4-liter inline-4 + AC electric motor, CVT
84 @ 4800 (engine) 271 @ 0 (motor)front
8.8 sec 16.7 sec @ 85 101 mph (governor limited) 35/40 mpg Performance results from C/D, November 2011.
0.28 23.7 square feet
6.7 square feet 84 pounds 16 hp 45 hp
-15 pounds
26 pounds
VEHICLE
bASe pRICeprice as tested
dimensionsLeNgTH
wIDTHHeIgHT
wHeeLbASeweIgHT
POWERTRAIN
pOweRTRAIN
pOweR Hp @ RpMTORqUe Lb-fT @ RpM
DRIVeN wHeeLS
PERFORMANCE
0–60 mph1/4-MILe @ MpH
top speed
epA CITy/Hwy
C/d WIND TUNNEL TEST RESULTS
DRAg COeffICIeNTfRONTAL AReA
DRAg AReA (CD x fRONTAL AReA)DRAg fORCe @ 70 MpH
AeRO pOweR @ 70 MpHAeRO pOweR @ 100 MpH
fRONT-AxLe LIfT @ 70 MpH
ReAR-AxLe LIfT @ 70 MpH
comparo090 .
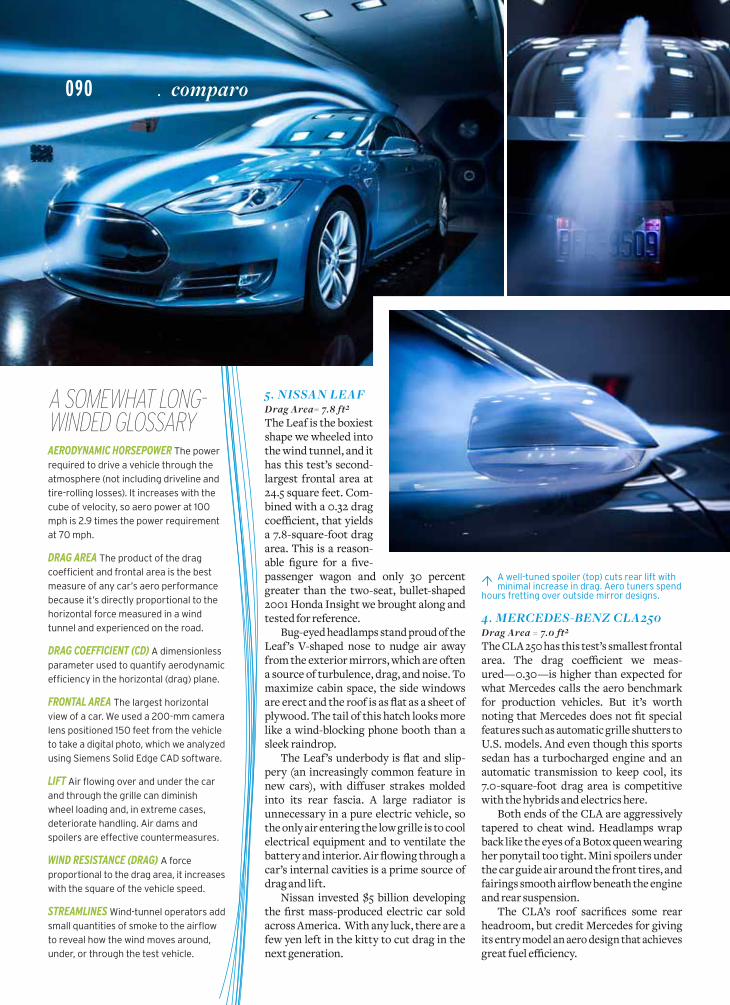
5. NISSAN LEAF Drag Area= 7.8 ft2
The Leaf is the boxiest shape we wheeled into the wind tunnel, and it has this test’s second-largest frontal area at 24.5 square feet. Com-bined with a 0.32 drag coefficient, that yields a 7.8-square-foot drag area. This is a reason-able figure for a five-passenger wagon and only 30 percent greater than the two-seat, bullet-shaped 2001 Honda Insight we brought along and tested for reference.
Bug-eyed headlamps stand proud of the Leaf’s V-shaped nose to nudge air away from the exterior mirrors, which are often a source of turbulence, drag, and noise. To maximize cabin space, the side windows are erect and the roof is as flat as a sheet of plywood. The tail of this hatch looks more like a wind-blocking phone booth than a sleek raindrop.
The Leaf’s underbody is flat and slip-pery (an increasingly common feature in new cars), with diffuser strakes molded into its rear fascia. A large radiator is unnecessary in a pure electric vehicle, so the only air entering the low grille is to cool electrical equipment and to ventilate the battery and interior. Air flowing through a car’s internal cavities is a prime source of drag and lift.
Nissan invested $5 billion developing the first mass-produced electric car sold across America. With any luck, there are a few yen left in the kitty to cut drag in the next generation.
AerodynAmic horsepower The power required to drive a vehicle through the atmosphere (not including driveline and tire-rolling losses). It increases with the cube of velocity, so aero power at 100 mph is 2.9 times the power requirement at 70 mph.
drAg AreA The product of the drag coefficient and frontal area is the best measure of any car’s aero performance because it’s directly proportional to the horizontal force measured in a wind tunnel and experienced on the road.
drAg coefficient (cd) A dimensionless parameter used to quantify aerodynamic efficiency in the horizontal (drag) plane.
frontAl AreA The largest horizontal view of a car. we used a 200-mm camera lens positioned 150 feet from the vehicle to take a digital photo, which we analyzed using Siemens Solid edge CAD software.
lift Air flowing over and under the car and through the grille can diminish wheel loading and, in extreme cases, deteriorate handling. Air dams and spoilers are effective countermeasures.
wind resistAnce (drAg) A force proportional to the drag area, it increases with the square of the vehicle speed.
streAmlines wind-tunnel operators add small quantities of smoke to the airflow to reveal how the wind moves around, under, or through the test vehicle.
A well-tuned spoiler (top) cuts rear lift with minimal increase in drag. Aero tuners spend
hours fretting over outside mirror designs.
a sOMeWHaT LOng-WInDeD gLOssaRY
4. MERCEDES-BENZ CLA250 Drag Area = 7.0 ft2
The CLA 250 has this test’s smallest frontal area. The drag coefficient we meas-ured—0.30—is higher than expected for what Mercedes calls the aero benchmark for production vehicles. But it’s worth noting that Mercedes does not fit special features such as automatic grille shutters to U.S. models. And even though this sports sedan has a turbocharged engine and an automatic transmission to keep cool, its 7.0-square-foot drag area is competitive with the hybrids and electrics here.
Both ends of the CLA are aggressively tapered to cheat wind. Headlamps wrap back like the eyes of a Botox queen wearing her ponytail too tight. Mini spoilers under the car guide air around the front tires, and fairings smooth airflow beneath the engine and rear suspension.
The CLA’s roof sacrifices some rear headroom, but credit Mercedes for giving its entry model an aero design that achieves great fuel efficiency.
flow-strAightening grid
comparo
caranddriver.com
0 6 . 2 0 1 4092 .
ILL
US
TR
AT
ION
by
MA
RT
IN L
AK
SM
AN
3. CHEVROLET VOLT Drag Area = 6.7 ft2
The Volt’s midpack drag coefficient (0.28) and frontal area (23.7 square feet) earn it a drag-area score that’s, well, midpack. This plug-in hybrid’s conventional-looking grille is almost entirely blocked to divert air over the top and around the sides. That yields a 15-pound increase in front-axle loading at 70 mph, beneficial for highway stability.
The Volt’s front lamps extend all the way back to the wheels, and there’s a nicely shaped ski mogul from the top of the grille to the hatch’s trailing edge, providing a smooth course for slipstreams. Strut-mounted side mirrors make way for the wind. GM sculpted the Volt to keep airflow attached to the side surfaces as long as pos-sible to reduce turbulence. The flat hatch extension helps to stabilize the car’s wake.
But even if the Prius and Volt tails look about the same, we measured 50 percent more rear lift in the Chevy. The 26-pound reduction in the Volt’s rear-wheel loading isn’t alarming, but it’s the kind of difference that tells you to trust the wind tunnel over your visual assessment of any car’s shape.
2. TOYOTA PRIUS Drag Area = 6.2 ft2
Toyota’s long-running poster boy for hybrid technology finished a close second in our testing, with a tidy 23.9-square-foot frontal area and a clean 0.26 drag coeffi-cient. The third-generation Prius, Prius C, and Prius plug-in are the most efficient hybrids on the market, in large part because they surrender so little energy to the wind. That results in 50 mpg in the EPA’s combined fuel-economy ratings and only 42 horsepower (versus the Volt’s already low 45) needed to overcome aero-dynamic drag at 100 mph.
This car’s upper surface mimics an air-foil, one of the most efficient shapes for punching a clean hole in the atmosphere. The windshield blends into the roof with no extra moldings to trip airflow. Egg-shaped mirrors are well separated from the nearly flat side surfaces. The wheel-cover spokes are smooth to minimize churn.
A steeply inclined hood and controlled airflow through the engine/motor com-partment yield 4 pounds of front down-force at 70 mph. Rear lift is only 17 pounds.
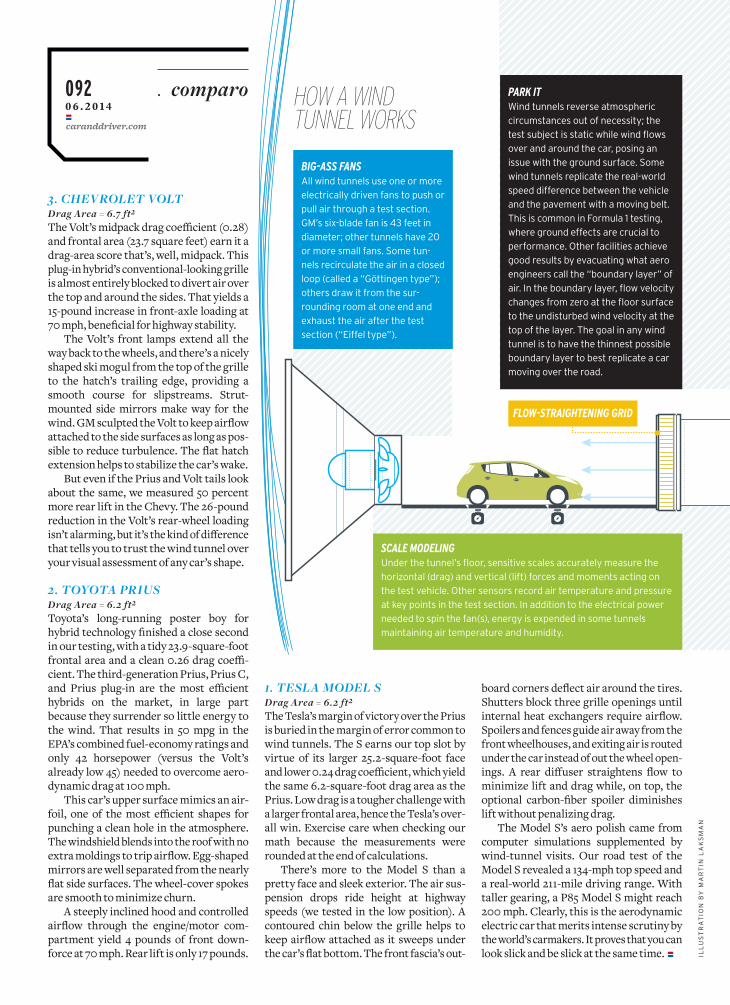
HOW a WInD TunneL WORKs
pArK itwind tunnels reverse atmospheric circumstances out of necessity; the test subject is static while wind flows over and around the car, posing an issue with the ground surface. Some wind tunnels replicate the real-world speed difference between the vehicle and the pavement with a moving belt. This is common in formula 1 testing, where ground effects are crucial to performance. Other facilities achieve good results by evacuating what aero engineers call the “boundary layer” of air. In the boundary layer, flow velocity changes from zero at the floor surface to the undisturbed wind velocity at the top of the layer. The goal in any wind tunnel is to have the thinnest possible boundary layer to best replicate a car moving over the road.
Big-Ass fAnsAll wind tunnels use one or more electrically driven fans to push or pull air through a test section. gM’s six-blade fan is 43 feet in diameter; other tunnels have 20 or more small fans. Some tun-nels recirculate the air in a closed loop (called a “göttingen type”); others draw it from the sur-rounding room at one end and exhaust the air after the test section (“eiffel type”).
scAle modelingUnder the tunnel’s floor, sensitive scales accurately measure the horizontal (drag) and vertical (lift) forces and moments acting on the test vehicle. Other sensors record air temperature and pressure at key points in the test section. In addition to the electrical power needed to spin the fan(s), energy is expended in some tunnels maintaining air temperature and humidity.
1. TESLA MODEL S Drag Area = 6.2 ft2
The Tesla’s margin of victory over the Prius is buried in the margin of error common to wind tunnels. The S earns our top slot by virtue of its larger 25.2-square-foot face and lower 0.24 drag coefficient, which yield the same 6.2-square-foot drag area as the Prius. Low drag is a tougher challenge with a larger frontal area, hence the Tesla’s over-all win. Exercise care when checking our math because the measurements were rounded at the end of calculations.
There’s more to the Model S than a pretty face and sleek exterior. The air sus-pension drops ride height at highway speeds (we tested in the low position). A contoured chin below the grille helps to keep airflow attached as it sweeps under the car’s flat bottom. The front fascia’s out-
board corners deflect air around the tires. Shutters block three grille openings until internal heat exchangers require airflow. Spoilers and fences guide air away from the front wheelhouses, and exiting air is routed under the car instead of out the wheel open-ings. A rear diffuser straightens flow to minimize lift and drag while, on top, the optional carbon-fiber spoiler diminishes lift without penalizing drag.
The Model S’s aero polish came from computer simulations supplemented by wind-tunnel visits. Our road test of the Model S revealed a 134-mph top speed and a real-world 211-mile driving range. With taller gearing, a P85 Model S might reach 200 mph. Clearly, this is the aerodynamic electric car that merits intense scrutiny by the world’s carmakers. It proves that you can look slick and be slick at the same time.