Embed Size (px)
Citation preview

The SKF GroupYear-end result, 2005
Tom Johnstone, President and CEO

3
2006-01-26
Areas in focus 2005 Performance 2005
• Operating margin level
Maintain a positive price/mix
Recovery of raw material cost increase
• Continued sales growth
Maintain organic growth pace
Acquisition/divestment (mainly Ovako)
• Strengthen the platform/segment offer
• Cash flow after investments before financing and acquisitions
3.4%
Done
8.4%
-1.1%
Ongoing
MSEK 2 848
4
2006-01-26
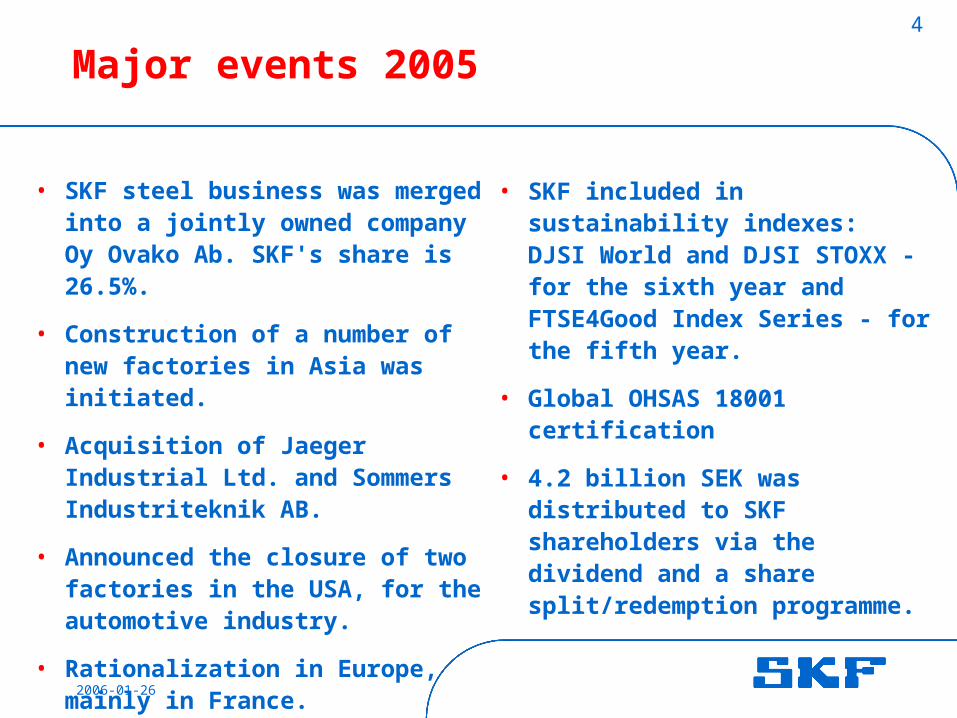
Major events 2005
• SKF steel business was merged into a jointly owned company Oy Ovako Ab. SKF's share is 26.5%.
• Construction of a number of new factories in Asia was initiated.
• Acquisition of Jaeger Industrial Ltd. and Sommers Industriteknik AB.
• Announced the closure of two factories in the USA, for the automotive industry.
• Rationalization in Europe, mainly in France.
• SKF included in sustainability indexes:DJSI World and DJSI STOXX - for the sixth year and FTSE4Good Index Series - for the fifth year.
• Global OHSAS 18001 certification
• 4.2 billion SEK was distributed to SKF shareholders via the dividend and a share split/redemption programme.

5
2006-01-26
New divisional structure in 2006
Industrial Division
Service Division
Automotive Division
-Sales to the industrialaftermarket, mainlythrough a network ofsome 7 000 distributors-Knowledge basedsolutions to optimiseasset efficiency.-Logistic services.
Sales - some 33%*.
-Sales to the industrial OEMcustomers and the develop-ment and manufacturing of a wide range of bearings, linear motion and mecha-tronics products, couplings, related products andlubrication systems.
Sales - some 31% of theGroup's sales*.
-Sales, development andmanufacturing of bearings,seals and components toautomotive, two-wheelers,household appliances andpower tools OEM manu-facturers.-Vehicle Service Market.
Sales - some 36%*
Restated financial figures will be published on the Group's website during March 2006.

6
2006-01-26
MSEK 2005 2004
Net sales 12 648 11 536
Operating profit 1 268 1 183
Operating margin 10.0% 10.3%
Profit before taxes 1 275 1 113
Net profit 862 845
Earnings per share, SEK 1.85 1.67
Cash flow after investments before
financing 529 543
Fourth quarter 2005

7
2006-01-26
MSEK 2005 2004
Net sales 49 285 44 826
Operating profit 5 327 4 434
Operating margin 10.8% 9.9%
Profit before taxes 5 253 4 087
Net profit 3 607 2 976
Earnings per share, SEK 7.73 5.90
Cash flow after investments before
financing
2 430 2 153
Year-end result 2005
8
2006-01-26
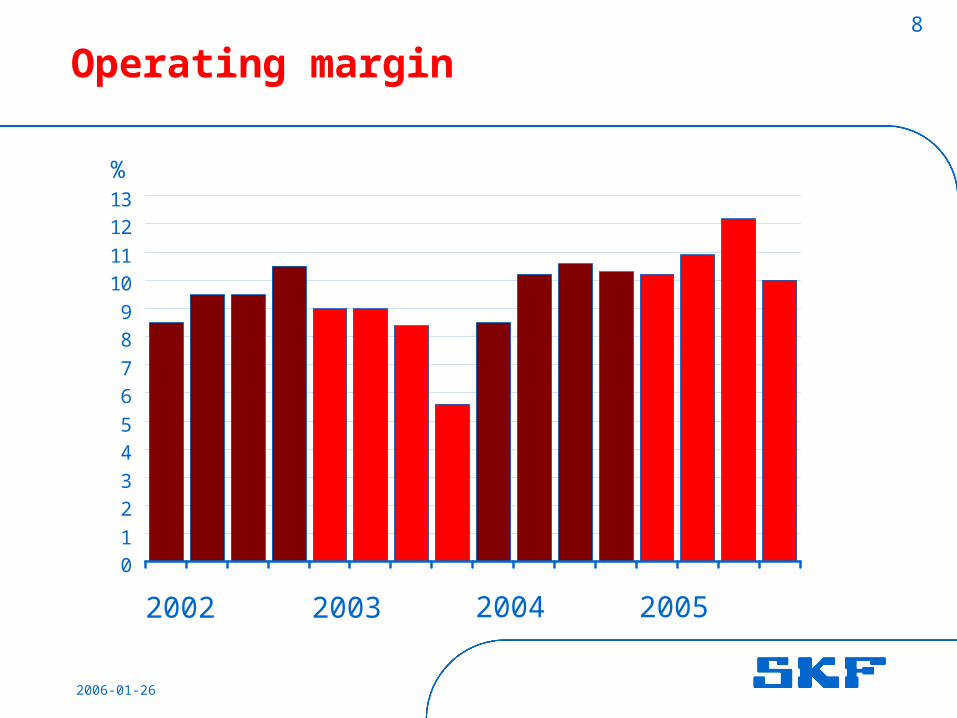
Operating margin
%
2002 2003 2004
0
1
2
3
4
5
6
7
8
9
10
11
12
13
2005

9
2006-01-26
0
2
4
6
8
10
12
14
Q1 Q2 Q3 Q4 Q1 Q2 Q3 Q4 Q1 Q2 Q3 Q4
Operating margin per division
Industrial
Service
Aero and Steel excl. OvakoElectrical
Automotive
%
2003 2004 2005

10
2006-01-26
Sales in local currencies (excl. structural changes)
-6-4-202468
1012141618
% change y-o-y
2002 2003 2004 2005

11
2006-01-26
Net sales development per quarter
Q1 Q2 Q3 Q4 Q1 Q2 Q3 Q4 Q1 Q2 Q3 Q4
6.2 3.2 4.2 3.1 4.8 8.9 9.6 10.2 8.3 7.6 5.1 1.3
0.7 0.1 0.2 0.3 0.1 0.0 2.2 2.0 2.3 0.2 -2.9 -3.7
1.2 0.6 1.2 0.1 1.1 1.8 2.3 4.2 3.6 3.6 2.1 2.6
8.1 3.9 5.6 3.5 6.0 10.7
14.1
16.4 14.2 11.4
4.3 0.2
-9.3 -8.6 -5.5 -7.4 -4.6 -2.3 -2.9 -3.8 -3.2 0.2 3.2 9.4
-1.2 -4.7 0.1 -3.9 1.4 8.4 11.2
12.6 11.0 11.6
7.5 9.6
Percent y-o-y
2003 2004
Volume
Structure
Price / Mix
Sales in local currency Currency
Net sales
2005

12
2006-01-26
Group sales volume vs Industrial production
0
2
4
6
8
10
12
14
03Q1 03Q2 03Q3 03Q4 04Q1 04Q2 04Q3 04Q4 05Q1 05Q2 05Q3 05Q4
in %
oya
Group Sales Volume Global Industrial Production (Source: JP Morgan)

13
2006-01-26
Growth development / local currency6% annual growth rate (whereof 4% organic)
% Y-o-Y
0
2
4
6
8
10
12
2002 2003 2004 2005
Acquisitions / Divestments
Organic growth
(Organic 8.4, Net acq/div -1,1)
3.0
7.3
5.2
11.8

14
2006-01-26
Net sales per geography, 2005 (2004)
North America, 20% (20)
Latin America, 5% (5)
Sweden, 4% (5)
Western Europe excl. Sweden, 47% (48)
Central and Eastern Europe, 4% (4)
Asia, 17% (15)
Middle East and Africa, 3% (3)

15
2006-01-26
Cash flow, after investments before financing
-200
0
200
400
600
800
1 000
1 200
1 400
1 600MSEK
2002 2003 2004 2005

16
2006-01-26
Net cash
-1 500
-500
500
1 500
2 500
3 500
4 500
5 500
MSEK
2002 2003
Dividend paid:
2001 Q2, MSEK 598
2002 Q2, MSEK 683
2003 Q2, MSEK 911
2004 Q2, MSEK 1 138
2005 Q2, MSEK 1 366
2004 Q2, Pension: MSEK 3 100
2005 Q2, Redemption, MSEK 2 846
2004
(Short-term financial assets - loans)
2005

17
2006-01-26
Inventories as % of annual sales
%
2002 2003 2004
18
19
20
21
22
23
Q1 Q2 Q3 Q4 Q1 Q2 Q3 Q4 Q1 Q2 Q3 Q4 Q1 Q2 Q3 Q4
2005
Target, end 2007 - 18%

18
2006-01-26
Currency management and net currency flows
-6000
-4000
-2000
0
2000
4000
6000USD Euro Others
SEK
• 75% of net currency flows in USD will be hedged 3-12 months, all other currency flows and also translation are not hedged.
• Negative effect for 2005 vs 2004: MSEK 150
• Estimated positive effect for 2006 vs 2005,
based on current assumptions and exchange rates:
Q1, 2006:MSEK 100
Full year, 2006:MSEK 400
Currency management 2006: Net currency flows 2005 excl. Ovako:
CAD

19
2006-01-26
January 2006: Outlook for the first quarter 2006
The market demand for SKF's products and services in the first quarter of 2006, compared to the previous quarter, is expected to remain on a high level in Europe, to be slightly higher in North America, significantly higher in Asia and to remain on a high level in Latin America. This is in addition to normal seasonality.
The manufacturing level will be unchanged for the first quarter of 2006, compared to the fourth quarter of 2005, while higher in absolute terms due to normal seasonality.

20
2006-01-26
Volume trend for the first quarter 2006
Europe 55%
20%
17%
5%
North America
Asia Pacific
Latin America
Net sales 2005 October 2005
Total
Note: This is the sequentialdevelopment
January 2006

21
2006-01-26
SKF Group targets
• 10% Operating margin level
• 6% Growth per annum
• 20% ROCE
• 18% Inventory / sales
2006
2007

22
2006-01-26
Guidance 2006
• Taxes, annual level: around 32%
• Financial net, for the year: approximately MSEK 200
• Currency, based on current assumptions and exchange rates: a positive MSEK 100 for Q1, 2006 and a positive MSEK 400 for the year
• Addition to tangible assets: in line with depreciations
23
2006-01-26
SKF capital structure 2006
The AB SKF Board proposes the AGM to decide on:
• a 33% increase in the dividend, SEK 4 per share, in total SEK 1.8 billion
• a mandate to the Board to repurchase up to 5% of the company's share

24
2006-01-26
Cautionary statement
This report contains forward-looking statements that are based on the current expectations of the management of SKF.
Although management believes that the expectations reflected in such forward-looking statements are reasonable, no assurance can be given that such expectations will prove to have been correct. Accordingly, results could differ materially from those implied in the forward-looking statements as a result of, among other factors, changes in economic, market and competitive conditions, changes in the regulatory environment and other government actions, fluctuations in exchange rates and other factors mentioned in SKF's latest 20-F report on file with the SEC (United States Securities and Exchange Commission) under "Forward-Looking Statements" and "Risk Factors".