Embed Size (px)
Citation preview

The Six Characteristics of Our Safest Schools
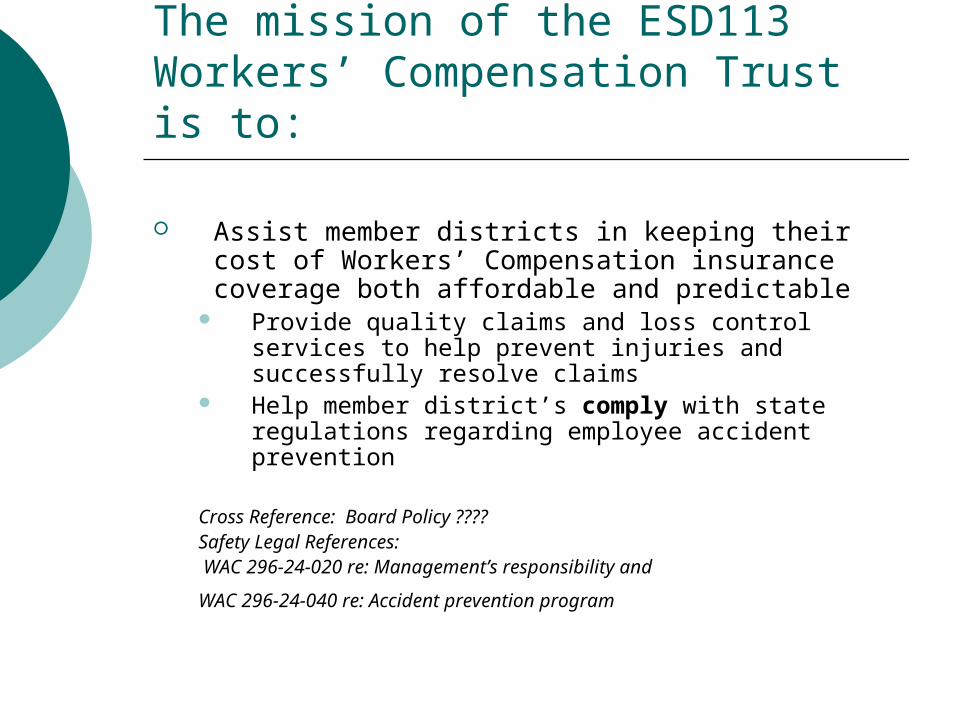
The mission of the ESD113 Workers’ Compensation Trust is to:
Assist member districts in keeping their cost of Workers’ Compensation insurance coverage both affordable and predictable
Provide quality claims and loss control services to help prevent injuries and successfully resolve claims
Help member district’s comply with state regulations regarding employee accident prevention
Cross Reference: Board Policy ????Safety Legal References: WAC 296-24-020 re: Management’s responsibility and
WAC 296-24-040 re: Accident prevention program
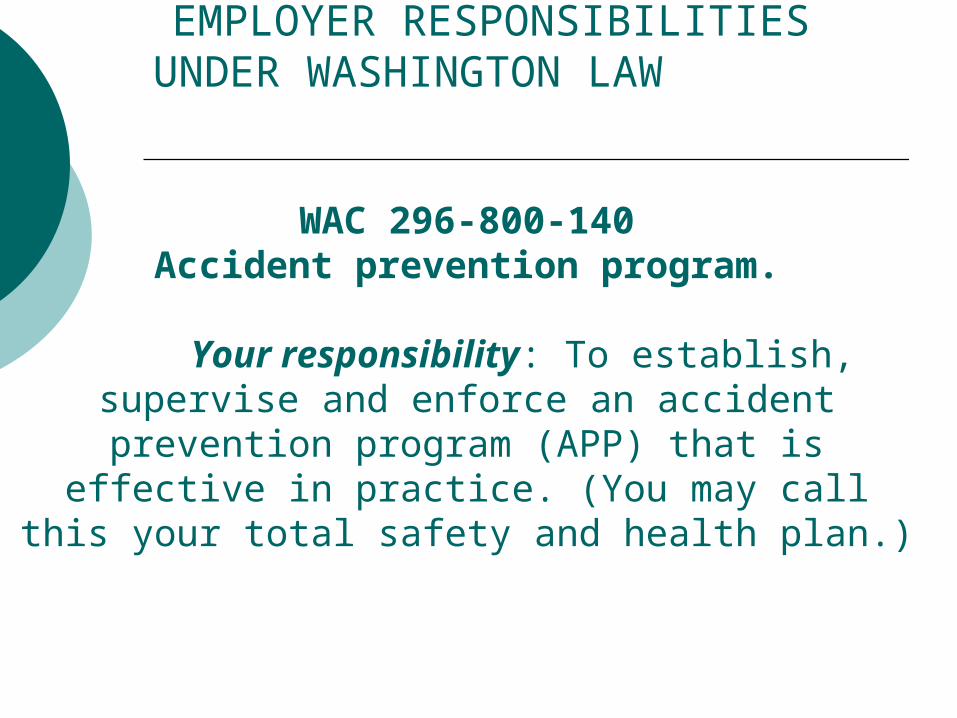
EMPLOYER RESPONSIBILITIES UNDER WASHINGTON LAW
WAC 296-800-140Accident prevention program.
Your responsibility: To establish, supervise and enforce an accident prevention program (APP) that is
effective in practice. (You may call this your total safety and health plan.)
ADDITIONAL LEGAL REQUIREMENTS UNDER WASHINGTON LAW
WAC 296-800-14005. Develop, supervise, implement, and enforce safety and health training programs that are effective in practice. WAC 296-800-14020. Make sure your Accident Prevention Program (APP) is effective in practice. WAC 296-800-14025.
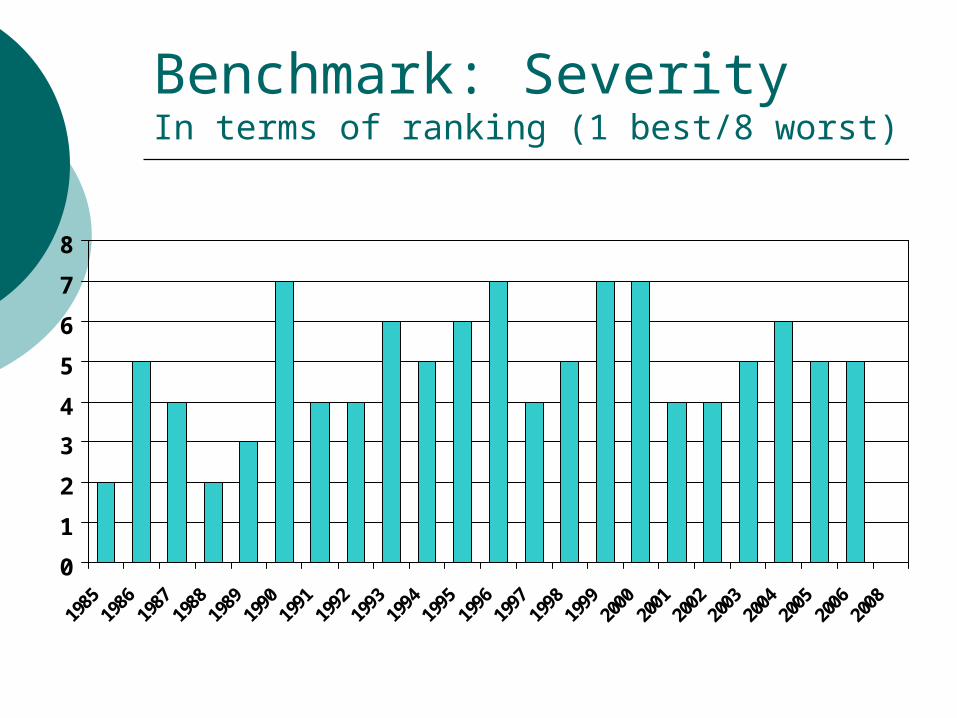
Benchmark: SeverityIn terms of ranking (1 best/8 worst)
0
1
2
3
4
5
6
7
8
1985
1986
1987
1988
1989
1990
1991
1992
1993
1994
1995
1996
1997
1998
1999
2000
2001
2002
2003
2004
2005
2006
2008
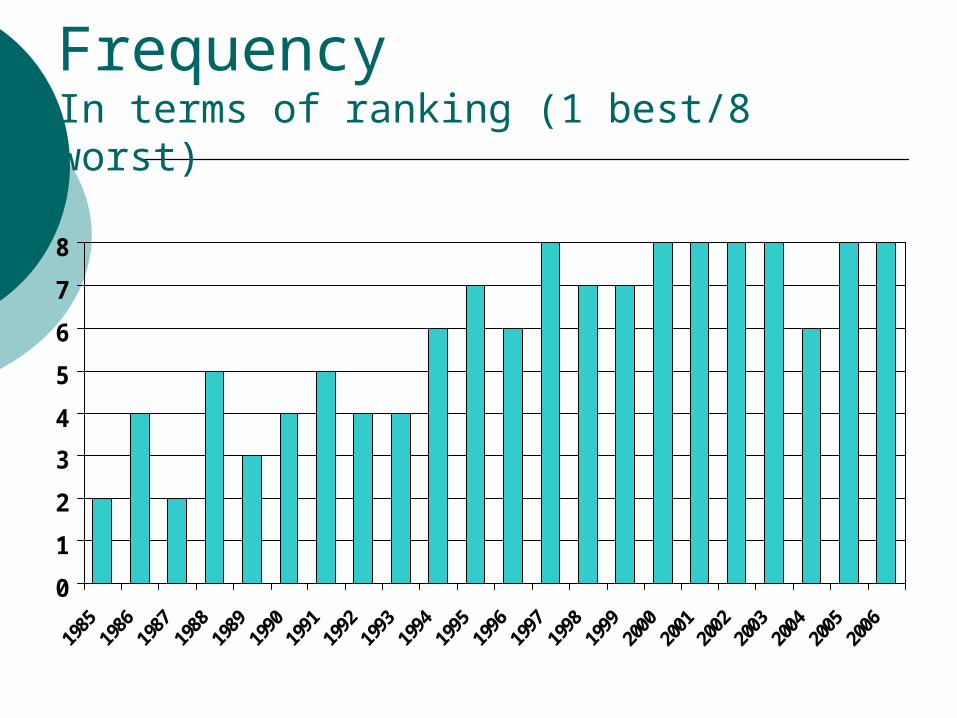
Benchmark: Claim FrequencyIn terms of ranking (1 best/8 worst)
0
1
2
3
4
5
6
7
8
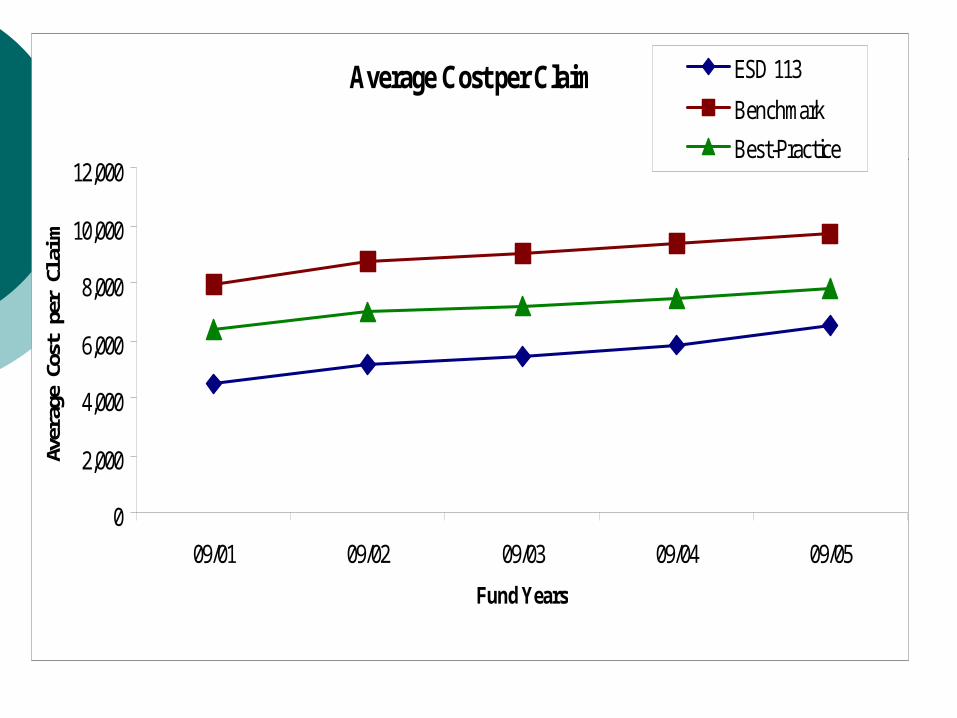
Average Cost per Claim
0
2,000
4,000
6,000
8,000
10,000
12,000
09/01 09/02 09/03 09/04 09/05
Fund Years
Aver
age C
ost p
er C
laim
ESD 113
Benchmark
Best-Practice
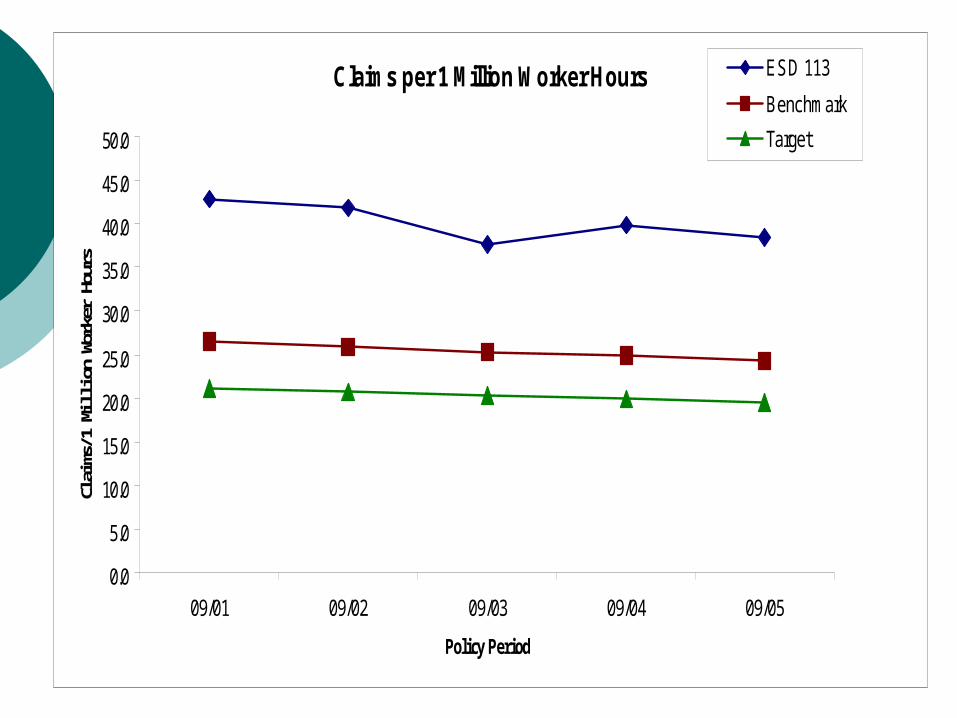
Claims per 1 Million Worker Hours
0.0
5.0
10.0
15.0
20.0
25.0
30.0
35.0
40.0
45.0
50.0
09/01 09/02 09/03 09/04 09/05
Policy Period
Claim
s/1 M
illion
Wor
ker H
ours
ESD 113
Benchmark
Target
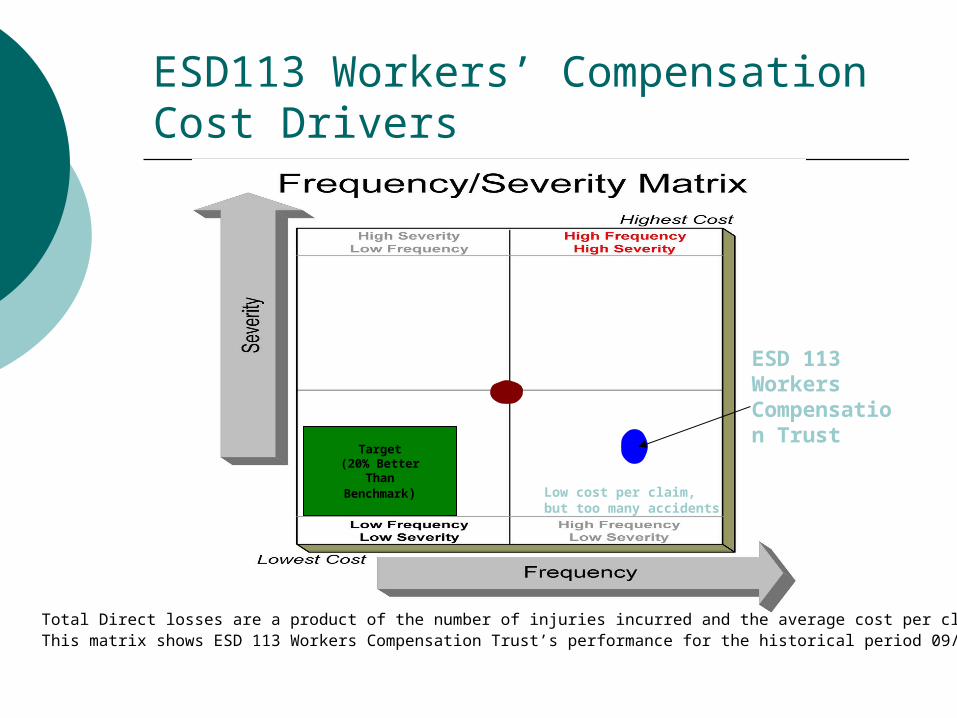
ESD113 Workers’ Compensation Cost Drivers
Target(20% Better
ThanBenchmark)
ESD 113 Workers Compensation Trust
Total Direct losses are a product of the number of injuries incurred and the average cost per claim incurred. This matrix shows ESD 113 Workers Compensation Trust’s performance for the historical period 09/01/01-08/31/06
Low cost per claim, but too many accidents
sub for slide 8.ppt
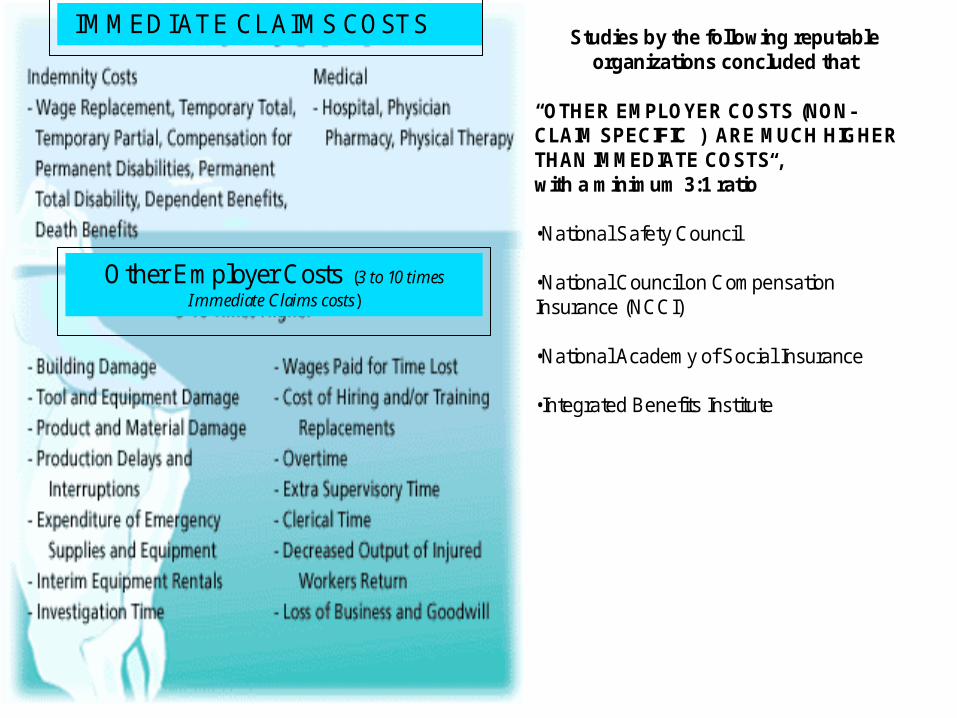
Studies by the following reputable organizations concluded that
“OTHER EMPLOYER COSTS (NON-CLAIM SPECIFIC ) ARE MUCH HIGHER THAN IMMEDIATE COSTS , with a minimum 3:1 ratio”
•National Safety Council
•National Council on Compensation Insurance (NCCI)
•National Academy of Social Insurance
•Integrated Benefits Institute
Other Employer Costs (3 to 10 times Immediate Claims costs)
IMMEDIATE CLAIMS COSTS
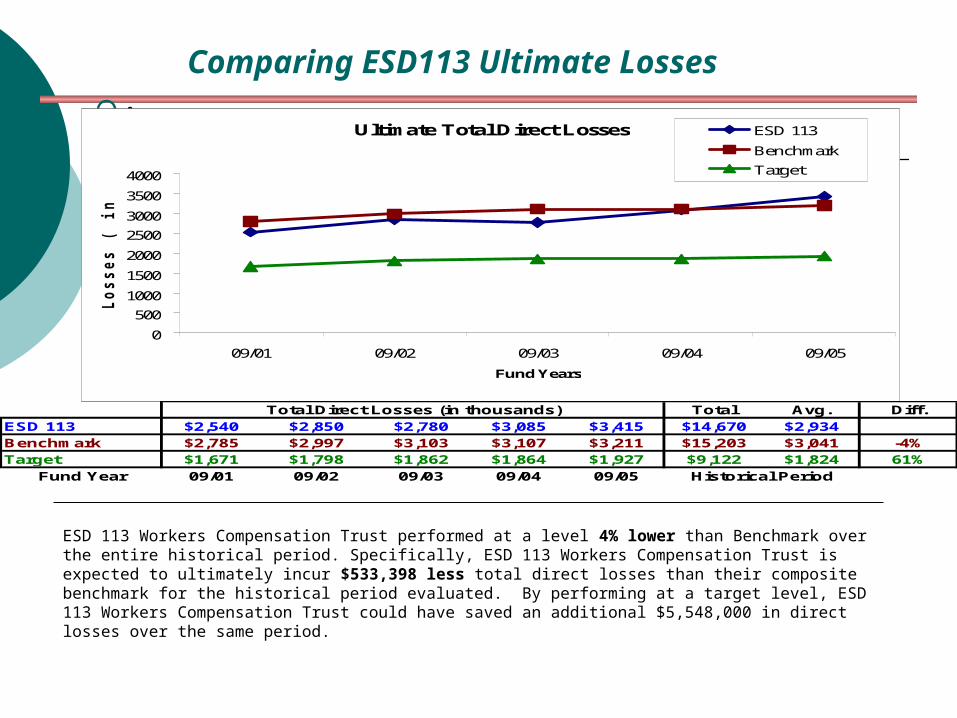
Comparing ESD113 Ultimate Losses
:
ESD 113 Workers Compensation Trust performed at a level 4% lower than Benchmark over the entire historical period. Specifically, ESD 113 Workers Compensation Trust is expected to ultimately incur $533,398 less total direct losses than their composite benchmark for the historical period evaluated. By performing at a target level, ESD 113 Workers Compensation Trust could have saved an additional $5,548,000 in direct losses over the same period.
Ultimate Total Direct Losses
0
500
1000
1500
2000
2500
3000
3500
4000
09/01 09/02 09/03 09/04 09/05
Fund Years
Losses (
in
th
ou
san
ds)
ESD 113
Benchmark
Target
Total Avg. Diff.ESD 113 $2,540 $2,850 $2,780 $3,085 $3,415 $14,670 $2,934Benchmark $2,785 $2,997 $3,103 $3,107 $3,211 $15,203 $3,041 -4%Target $1,671 $1,798 $1,862 $1,864 $1,927 $9,122 $1,824 61%
Fund Year 09/01 09/02 09/03 09/04 09/05
Total Direct Losses (in thousands)
Historical Period
0
100
200
300
400
500
600
700
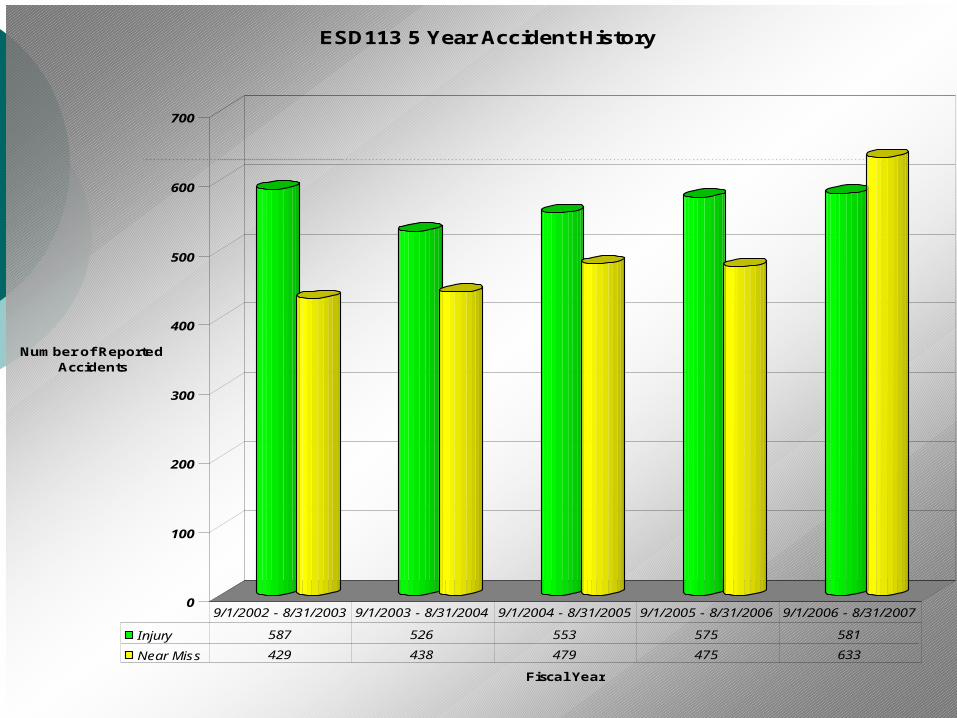
Number of Reported Accidents
Fiscal Year
ESD113 5 Year Accident History
Injury 587 526 553 575 581
Near Miss 429 438 479 475 633
9/1/2002 - 8/31/2003 9/1/2003 - 8/31/2004 9/1/2004 - 8/31/2005 9/1/2005 - 8/31/2006 9/1/2006 - 8/31/2007
Characteristic #1
Policy: District priority for safety is evidenced by each school integrating an “Accident Prevention Best Practices Model” into their school improvement planning process. Principals communicate with all staff; by setting a high standard themselves that safety takes high priority and will be part of their school culture. With each supervisor understanding their responsibility for employee safety.
Characteristic #2
Accountability: Supervisors communicate with staff that safe working practices are expectations and not options. With each supervisor understanding their own responsibility for employee safety.
Characteristic #3
Trust: Employees are comfortable raising questions or concerns about employee safety & health. Employees feel empowered either directly or through their safety committee to affect the safety climate in their schools in a positive way. The role and importance of the safety committee is mutually understood at all levels of the organization.
Characteristic #4
Communication: A system for reporting potentially unsafe conditions or hazards is in place with a priority set on work orders addressing safety concerns.
Characteristic #5
Leadership: Supervisors take the lead in investigating all workplace accidents, communicating results with staff and in a collaborative effort identify and implement solutions that will prevent workplace injuries. Continual follow up is essential to determine the effectiveness in preventing accidents.
Characteristic #6
Assessment: Principals have established in-house monthly safety committee meetings; safety committees are visibly and actively supported by Management. Safety committees determine staff training needs and safety training will target hazards associated with specific jobs. Supervisors make it clear to any behavioral expectations presented in the training sessions.

Thank you for Listening
Any Questions?