Embed Size (px)
Citation preview

THE SITUATION ANALYSIS OF WOMEN AND CHILDREN IN TANZANIA
By
Research on Poverty Alleviation (REPOA)
Report submitted to UNICEF, Dar es Salaam
November 2000

i
Contents Executive Summary iv 1. Introduction 1 2. Objectives of the Study 3 3. Analytical Framework 4 4. Situation Analysis 7
4.1 Major Manifestations 7 4.2 Immediate Causes 17
4.2.1 Institutional Arrangement 17 4.2.2 Institutional Environment 33
4.3 Underlying Causes 35 4.3.1 Social-cultural Causes 35 4.3.2 Political Causes 37 4.3.3 Economic Causes 38
5. Summary of Conclusions 39 References 45
ii
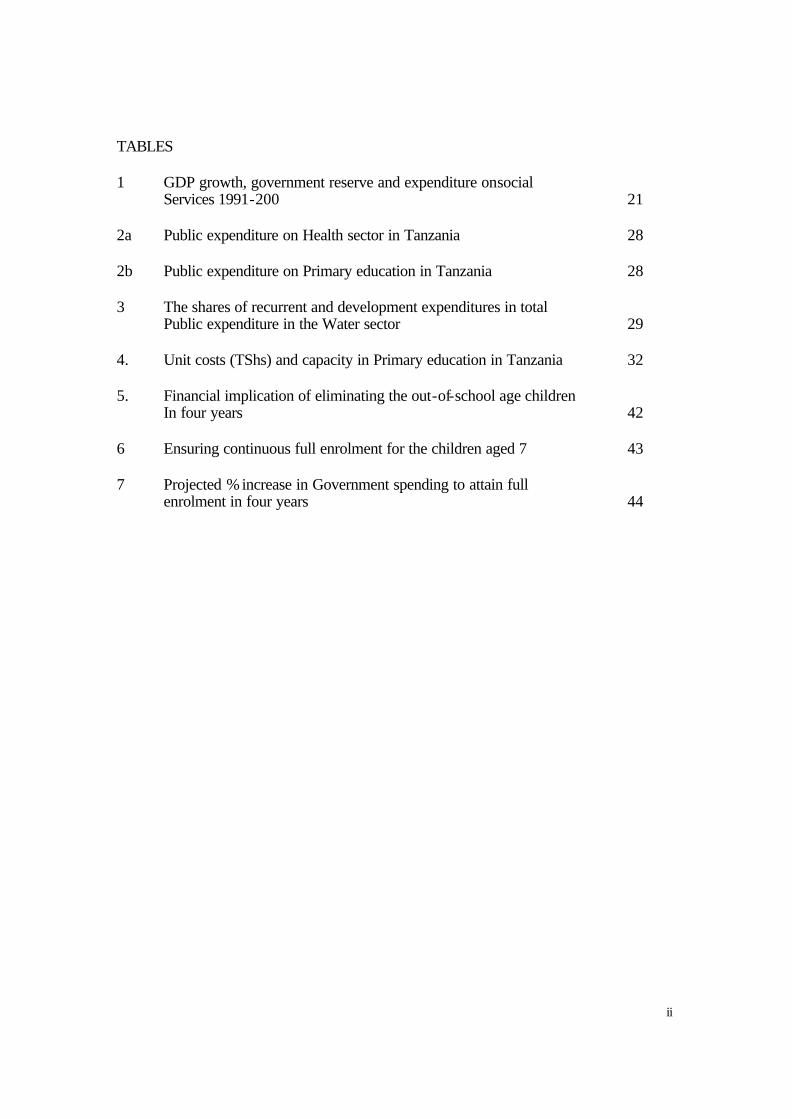
TABLES 1 GDP growth, government reserve and expenditure on social
Services 1991-200 21 2a Public expenditure on Health sector in Tanzania 28 2b Public expenditure on Primary education in Tanzania 28 3 The shares of recurrent and development expenditures in total
Public expenditure in the Water sector 29 4. Unit costs (TShs) and capacity in Primary education in Tanzania 32 5. Financial implication of eliminating the out-of-school age children
In four years 42 6 Ensuring continuous full enrolment for the children aged 7 43 7 Projected % increase in Government spending to attain full enrolment in four years 44
iii
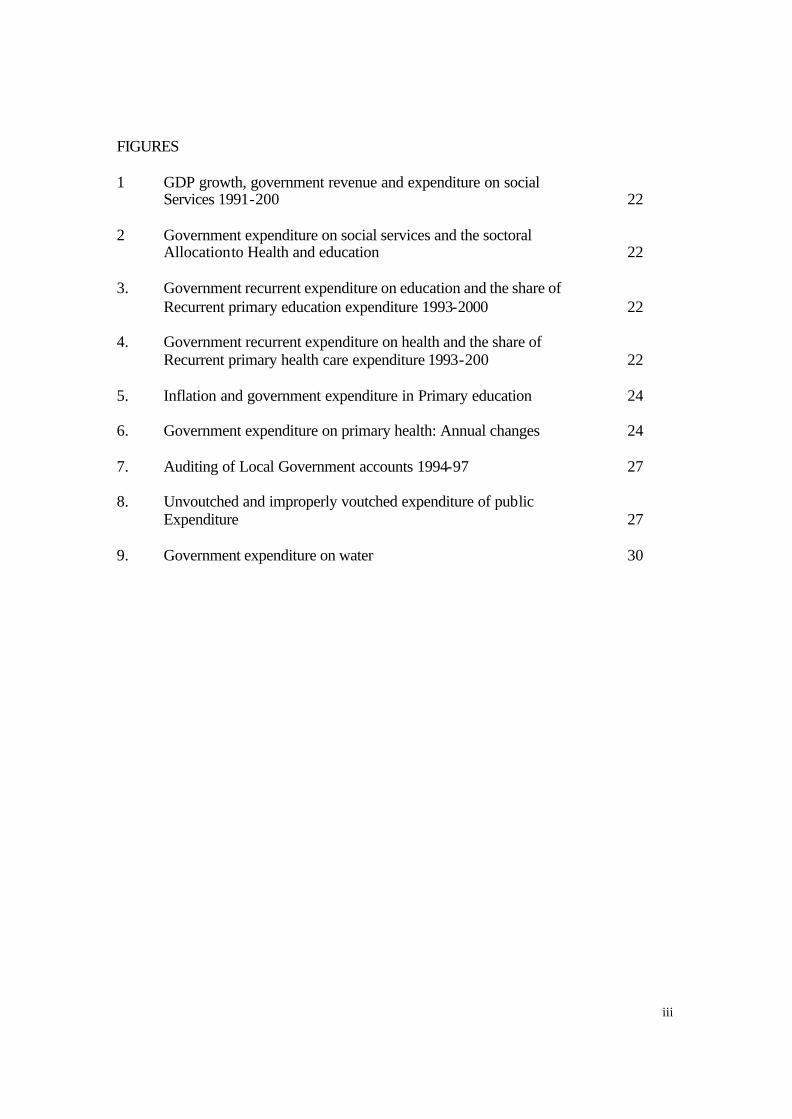
FIGURES 1 GDP growth, government revenue and expenditure on social
Services 1991-200 22 2 Government expenditure on social services and the soctoral
Allocation to Health and education 22 3. Government recurrent expenditure on education and the share of
Recurrent primary education expenditure 1993-2000 22 4. Government recurrent expenditure on health and the share of
Recurrent primary health care expenditure 1993-200 22 5. Inflation and government expenditure in Primary education 24 6. Government expenditure on primary health: Annual changes 24 7. Auditing of Local Government accounts 1994-97 27 8. Unvoutched and improperly voutched expenditure of public
Expenditure 27 9. Government expenditure on water 30

iv
The Situation Analysis of Women and Children in Tanzania
Executive Summary Introduction The review of the situation of women and children is made in relation to the international development targets (IDT) which Tanzania has endorsed and the more ambitious national targets that are based on the IDT. In addition, it is guided by a human rights and gender perspective to address UNICEF’s main concerns, namely, survival, development, protection and participation of children, as provided in the Convention for the Rights of Children (CRC).
This review is made to provide the basis for identifying priority concerns to be addressed in the strategic approach for UNICEF’s new country programme of cooperation with the government of Tanzania. The Situation Analysis In order to provide direction for policy action, the situation analysis is made to reflect UNICEF’s four main concerns (survival, development, protection and participation) at three levels. They are the manifestations (observables), the immediate and the underlying causes. This framework will facilitate the policy interpretations of the situation analysis. Manifestations Children have the right to survive, develop, be protected and participate in activities and decisions that affect their lives. What do these mean in real life and what is the existing situation? Survival The right to survive implies that children should not die, that is, the rates of infant, under-five and maternal mortality should be low. Table ES1 below shows that based on previous performance, for all variables (except immunization) the targets are unlikely to be achieved. Development Children’s development covers the physical, cognitive, social, emotional and spiritual aspects. It is an outcome of a combination of factors that include nutrition, health, cognitive and emotional and education (formal and informal). Table ES2 gives a summary (of selected indicators) on the situation in relation to IDT and national targets. It shows that, based on previous performance, for all the variables (except gender equality in primary education) the targets are unlikely to be achieved. However, although gender equality has been achieved in primary education, significant gender inequalities are appearing in examination results as boys perform better than girls. Therefore, efforts have to shift to address the qualitative aspects of inequality

v
Table ES1: Performance of Selected Survival Targets Status Manifestation
Previous Current Target Comment on
the Target Infant Mortality 105/1000
(1992) 99/1000 (1999)
50/1000 (2010)
Unachievable
Under-5 Mortality
141/1000 (1992
150/1000 (1999)
75/1000 (2010)
Unachievable
Maternal Mortality
340/100,000 (1994)
529/100,000 (1999)
265/100,000 (2010)
Unachievable
HIV/AIDS High rates High rates Awareness Campaigns
Achievable
Immunization (Measles and DPT)
74% (1991 71% 85% (2003) Needs serious campaigns
. Table ES2: Performance of Selected Development Targets
Status Manifestation Previous Current
Target Comment on the Target
Severe Underweight 7.1% (1991/92
6.5% (1999)
2% (2010)
Unachievable
Moderate Underweight
28.8% (1991/92)
29.4% (1999)
22% (2010)
Unachievable
Mobidity High High N/A Adult Literacy 84%
(1992) 70%
(1999) 100% (2010)
Unachievable
Women Literacy 81% (1992)
64% (1999)
100% (2010)
Unachievable
Gender Equality in Primary Education
1:1 1:1 (2005)
Achieved
%passing Examination
20% (2000)
50% (2003)
Unachievable
Gross Enrolment 73% (1989)
76% (1999)
- N/A
Net Enrolment 54% (1991)
57% (1999)
- N/A
Std. 5 Retention 82% (1992)
77% (1999)
- N/A
Protection Inadequate protection of children is often manifested in street children, child labour, children headed households, rape, early pregnancies, etc. Data and information in these areas are lacking. However, anecdote information suggests that the number of orphans currently stands at 1.2 million, representing 9% of the children in year 2000; deliveries to

vi
young mothers are on the increase, as pregnancy accounts for a high percentage of drop outs among primary school girls; there exists about 2000 street children, located in both urban and rural areas; the worst form of child labour is extending fast from domestic workers to the mining sector and; most of the defilement and sodomy cases are on children below 15 years, they are not reported and are done by close relatives or friends. Unfortunately, no trend analysis can be made to determine performance in this area because no baseline data exists and no targets have been set on which comparison can be made. However, protection of human rights requires to be assessed. Therefore, there is an urgent need to establish baseline data on this variable. Participation Data and information in this area is even more problematic. However, it is a known fact that children and adolescents are regularly denied their right to participation – at the household level, at the school setting, in key decision making institutions – e.g. government, etc. But some groups of children are affected than others – girls, children with disabilities, child domestic workers, orphans, etc.
Slowly, positive changes are taking place to promote children participation. The government has currently revised child policy to take into account children’s right to participation. But it is in the NGO sector that these issues have come out strongly and forcefully – e.g. Kuleana, TAMWA, etc.
Participation as a basic human right needs to be reviewed from time to time. Yet here we are faced with not only the lack of data and information but also the lack of generally agreed quantifiable indicators. Therefore, there is an urgent need to establish a set of agreed indicators and subsequently a data base on which trends can be assessed. Immediate Causes The manifestations described above have arisen because the required institutional frameworks to support and provide the basic services have not been fully established and/or developed. The institutional framework covers institutional arrangement and environment. The former includes economic, social and legal infrastructure (schools, dispensaries, courts, trained and motivated teachers, magistrates, etc.). The latter covers rules that establish the basis for production, exchange and distribution.
Institutional Arrangement Here there are the issues of infrastructural capacity and operations and maintenance. In the area of children’s development recent data shows that both capacity and operation and maintenance of existing facilities are inadequate. Only 57% of the classrooms, 22% of the staff houses, 30% of toilets, 58% of staff rooms, 33% of stores, 35% of tables, 34% of chairs and 25% of cupboards are available. Therefore, pupil : facility ratios are very high. In addition, although the national pupil : teacher ratio of 39:1 presents a satisfactory picture, it hides information on poor training of the teachers and high inequality in their distribution across the country. The situation on capacity is the same

vii
for health and water and sanitation. For example recent data shows that over 2 villages share a dispensary, over 1 village share a bed (in the health facilities) and 69% of the rural households rely on open well and surface water sources. Operation and maintenance of existing capacities have caused major problems in basic service provision in the country. In 1997 a comprehensive study found that 80% of the 2600 households interviewed mentioned the lack of books and school equipment to be a big problem; a recent school mapping exercise has revealed that books are in short supply and unequally distributed; a recent study covering 675 households found that public health facilities scored low in drugs availability, cleanliness, staff availability, laboratory facilities, queuing time and patients handling; a follow up study revealed improvements in cleanliness but deterioration in availability of drugs, queuing time and availability of staff - the study reports that much of the user fee collection in public health facilities was used to paint buildings and clean up facilities, apparently reflecting differences in priorities between private and public facilities. Inadequacies in the capacity and operation and maintenance of facilities have resulted from a long period of underfunding for both investment and recurrent activities. A look at financial numbers leads to the following conclusions. Firstly, government’s financial commitment to implement the CRC began in 1995 when the share of social sector rose consistently. Both primary education and health care have been the main beneficiaries. However, in relation to inflation, primary health care gained but primary education lost, except after 1998. Secondly, most of the allocation went to pay salaries – 90% of primary education recurrent budget. In addition much of the remaining OC is being diverted to other uses – e.g. allowances. Although the share of OC is higher in health, much of the expenditure takes place at the central government level, implying that much of the decisions take place at higher (Ministry) levels. Thirdly, the issue of cost sharing requires careful thinking. Evidence shows that compliance is very low, e.g. 19% for primary education. The problems relate to the nature of the services (merit goods), inefficiencies in public facilities (leakages and wrong prioritization) and poverty. Each one of the three factors may facilitate withdrawal from basic services. In the absence of a credible study to disentangle the impact of each factor on withdrawal and following CRC, it may be more practical to separate the incidence of the burden of service costs from that of service accessibility. This implies that user fees in primary health care and education be replaced by a health insurance and education community contributions, respectively.
Institutional Environment The institutional environment is built around legal provisions, government regulations and directions and culture. In the context of the rights of children they include such provisions for free primary education and MCH services, acts of parliament on sex offences, etc.
Although far from the ideal, many positive steps have been taken to facilitate children’s rights. For example, government directives prohibit service centres from turning away pupils/patients for failure to contribute user fees and some services such as MCH are provided free of charge.

viii
However, experience shows that it is the effectiveness rather than the mere existence of the provisions that matter. In this context, weak and lax enforcement and cultural practices have undermined effectiveness of these provisions. For example, many children and patients have been turned away for failure to contribute fees; indeed, primary school fees is mentioned to be one of the factors that keep away children.
This brings in local governments as the key institution for implementing policies and strategies that promote children’s rights. The role of communities in service provision is underscored by our earlier recommendation to separate the incidence of the burden of service costs from that of service accessibility through primary school community contributions and primary health insurance systems. The ongoing local government reforms that aim to empower communities is a movement towards the right direction. However it is important that the reforms are driven by the communities to ensure that the interests of the latter are adequately and accurately addressed.
Underlying Causes
We have identified three important aspects of underlying causes. They are social-cultural, political-governance and economic. Important social-cultural aspects include social capital and traditional security systems and gender bias against women. Recent deterioration of social capital and traditional security systems has increased children’s vulnerability. Appropriate measures to fill in the vacuum have to be undertaken. On the other hand, new developments in the promotion of gender equality show positive signs towards the promotion of children’s rights. Opportunities created by the new developments have to be exploited.
Issues relating to political-governance have been discussed above. They relate to community empowerment. Only when the reforms are driven from communities can we talk about community empowerment.
The main economic issue is ownership of asset. In participatory studies it is defined by women and the poor to include access to land, basic education, basic health care, markets, etc. These issues are being addressed, but they are at different levels and some of them are still in early stages, e.g. land reform. However, as stated earlier on, it is effectiveness rather than legal provisions that matter. And here government capacity to implement the provisions and cultural barriers has become major constraints.
1
The Situation Analysis of Women and Children in Tanzania
Introduction
UNICEF is currently developing its Third Tanzania Country Programme as the
present one ends next year (2001). The new programme will be developed around the
framework of children's rights, based on the Convention of the Rights of Children
(CRC).
There are several moral and economic justifications for mainstreaming of children's
rights in development process. First, children have the right to enjoy certain
fundamental rights as provided in the Universal Declaration and the other basic UN
human rights instruments. Second, only a healthy development and active
participation of the children can ensure sustainable development of a given society.
Third, children are vulnerable to the actions of adults and institutions. More than any
other segment of the society, they are vulnerable to policies and programs on poverty,
human capabilities, social wellbeing and survival. Yet, many countries have not
developed adequate mechanisms to enable children to influence such policies.
Societies are paying high price for neglecting children. The economic and social costs
resulting from this are enormous. Indeed, poverty levels may largely be a result of
neglecting children, and particularly ignoring that children do have social, economic
and political rights that contribute to their spiritual, moral, physical and intellectual
development.
Given vulnerability of children, CRC commits governments to assume primary
responsibility in protecting children's rights. Governments are expected to set up
institutional systems (both institutional arrangements and environment) that support
the legal and administrative requirements of the CRC. This should be done not only
by incorporating the Convention into domestic law and making children more visible
in the government policies and strategies but also by allocating sufficient resources to
activities that address children's rights and needs.
2
It is in this context that the UN agencies and particularly UNICEF have initiated
processes that focus on children's rights during the 1990s. Countries were encouraged
to ratify the CRC and a target of Universal ratification of the CRC was set to be end
of 1995. So far 191 countries have ratified the treaty, making the CRC the most
widely ratified agreement ever.
During the various international conferences and world summits that took place
during the 1990s a number of international targets were defined, action plans were
made and endorsed and monitoring mechanisms were developed. In these meetings
international development targets (IDT) were set. They included reducing infant
mortality and under five mortality by a third, maternal mortality by half and severe
and moderate malnutrition of under five by half and achieving universal access to
basic education and primary education by at least 80% of primary school age children.
In recognition of vulnerability of children to diseases and particularly HIV/AIDS,
world leaders have adopted the Vienna Declaration and Programme of Action that
calls upon UN members to strengthen both national and international mechanisms for
addressing the problem.
It is in this context that in June 1997 the United Nations Secretary General announced
that as part of the UN reform process human rights should be a basis for all UN
activities (UNICEF: 1999). This explains UNICEF’s current focus on child rights
perspective and the motivation of the current study.
The government of Tanzania has demonstrated its commitment to the rights of
children in different ways. Only a selected number of key actions can be mentioned
here. At the political level, the country:
• ratified the CRC in 1991;
• participated in the World Summit for Children in 1990, organized a National
Summit for Children in 1991 and launched a National Programme for Action
(NPA) for Achieving the Goals for Tanzanian Children by the year 2000 in 1993;
• participated in the Education for All Conference in Jontien in 1999, International
Conference on Population and Development in Cairo in 1994, World Summit for

3
Social Development in Copenhagen and the Fourth World Conference on Women
in Beijing in 1995;
• established the Ministry of Community Development, Women Affairs and
Children in 1990;
• prepared the Tanzania Development Vision 2025 in …
• prepared the National Policy on Children in 1996; the policy is currently under
review to incorporate issues of participation and HIV/AIDS and;
• prepared the National Poverty Eradication Strategy in 1998, the Tanzania
Assistance Strategy and the Poverty Reduction Strategy Paper in year 2000.
Many central and sectoral policies and strategies have incorporated some aspects of
the CRC.
But perhaps it is in the NGO sector that many actions have taken place. The sector
has not only promoted children’s rights through its own actions but it has also
influenced government’s thinking and actions through social and political pressure.
2 Objectives of the Study
Guided by a human rights and gender perspective the main objective of the current
study is to identify priority concerns to be addressed in the strategic approach for a
new country programme of co-operation between the government of Tanzania and
UNICEF. This strategic approach aims to facilitate the mainstreaming of children's
rights into the new country programme.
The more specific objectives are:
• To develop an analytical synthesis of existing information and research findings
into the situation analysis of children and women in Tanzania. The synthesis will
review the current situation of the relevant national development targets,
performance in their achievements over the last decade and constraints that have
slowed down achievements.
• Based on the situation analysis, to suggest guidelines for a strategic approach for
a new country programme of co-operation, bearing in mind: the conclusions of
the mid-term review of the current GOT/UNICEF programme of co-operation,
4
the work which has been undertaken towards a new child policy in Tanzania, the
proposed establishment of a human rights commission and the local government
reform.
3. Analytical Framework
Drawing from the CRC, UNICEF is set to address the following concerns, namely,
survival, development, protection and participation of children. The analytical
framework for addressing these concerns has three levels. These are the observables
or manifestations, the immediate and underlying causes. (See figure 1).
First and foremost, children must survive to their adulthood. It means they should not
die. The current high rates of infant, under-five and maternal mortality should be
arrested. Malaria, diarrhoea diseases, respiratory infections (including anaemia), the
main killer diseases for children and HIV/AIDS the main killer for the youth and
adults have to be addressed.
Children’s development covers the physical, cognitive, social, emotional and spiritual
aspects. Children have the right to good quality basic education. Currently,
enrolments are low, dropouts are high and attainments are low. The teaching methods
and environments are not attractive to children. However, full and effective
participation of children in an education programme requires that the burden of
disease be reduced, i.e. reduced morbidity. The main killer diseases for children and
youth threaten both survival and development. This is also linked to access to safe
and clean water that has been shown to relate to diarrhoea and nutrition as important
aspects of children development.
Children are the most vulnerable group in any society because they depend on the
decisions and actions of others (adults) for their survival and development. Decisions
made by adults deny children their rights to basic education and health, protection,
free movement and speech, be heard and legal protection. Such denials are
manifested in street children, child labour, children headed households, rape,
unwanted pregnancies, lack of institutional set up and inadequate resource allocation
to address children’s rights and needs, etc. In this context the CRC commits

5
governments to assume primary responsibility in protecting children’s rights, among
others, by ensuring that the laws of the land and the corresponding administrative
structures comply with the provisions of the CRC.
Finally, children must participate in the decisions that affect them and society at large.
The CRC underscores the importance of children’s participation, in decisions that
affect their life, as they grow older. The extent to which growing children are
allowed, encouraged, inspired and supported to participate in decision making is
influenced by various background factors. They range from economic, social and
cultural factors. Sometimes children are forced to participate in activities and take
decisions too early in their life; other times they are delayed to participate and take
decisions. Societies have to put in place enabling environment that allows,
encourages, inspires and supports children to participate in appropriate activities and
take appropriate decisions at a given age.
The immediate causes can be grouped into three, namely, the lack of adequate
provision of basic services, household food security and children’s security. Many
children have limited access to basic education and health and clean and safe water;
adequate food and; security, justice, peaceful life and freedom. The lack of
adequate/appropriate economic, social and legal infrastructure largely accounts for the
declining capacity for these provisions. The country has not been able to put in place
adequate and appropriate institutional arrangements (including organizations,
manpower and equipment e.g. school and health committees, courts, dispensaries,
desks, qualified and motivated teachers, nurses and magistrates) to match increased
demand. And, sometimes, the institutional environment or the rules of the game have
failed to take into account existing local realities – e.g. cost sharing may have been
hurriedly introduced and is probably being haphazardly implemented or should have
been more carefully considered. Weaknesses in the institutional arrangements and
environment have often enhanced corruption that works to deny children their rights
for survival, development, protection and participation.
The underlying factors can be grouped into three, namely social-cultural, political and
governance and, economic. Two aspects of the social-cultural domain may be of
interest to UNICEF’s future programming. The first is the apparent declining role of
6
social capital in the investment and operations and maintenance of basic economic
and social infrastructure, as well as the traditional social security system. The second
is the growing awareness of existing gender inequality and the growing
establishments of institutional frameworks (both institutions of governance and rules
of the game) for promoting gender equality.
Related to social-cultural is the political-governance domain. Political capital that is
not based on social capital often fails to promote the wishes of the grassroots. Both
its institutional arrangement and rules of the game reflect and promote the wishes of
the political leaders. They may be manifested in top down reform programmes,
central government appointed local authorities executives, lack of transparency and
accountability, etc. This has implications for priority setting and resource allocations
and, therefore, the rights of children.
The final underlying cause is economic. Clearly economic structures and processes
are not de- linked from social-cultural and political-governance domains.
Participatory studies have shown that women consider asset ownership to be key in
determining poverty and inequality levels between gender. For women, the definition
of asset covers access to land and basic social and economic services and both social-
cultural and political-governance factors have favoured men at the expense of women.
Sources of Information and Data
The study will be guided by the human rights philosophy as enshrined in the existing
international instruments generally, and more specifically, the CRC and CEDAW. In
this respect, the study will undertake the following activities:
• A review of existing documents to observe and record trends and progress in
achieving national and international development targets IDT).
• A review of the budget to determine its sensitivity to children’s rights and needs
as well as its efficiency and effectiveness in addressing the national and IDT.
• Discussions with various stakeholders from central government, local
government, including village governments, NGO, CBO, donor agency
representatives and UNICEF staff.
7
• A field study from Kisarawe and Kibaha districts, two of the fifty five districts
which have received comprehensive programme support from UNICEF.
4. Situation Analysis
Following the analytical framework specified above, the situation analysis is aimed at
reviewing the status of children in the four areas of concern, namely survival,
development, protection and participation. As shown in the analytical framework, the
current situation incorporates three levels, namely the manifestations, the immediate
and the underlying causes. The manifestations will be compared to national and
international targets to provide an indication of the performance of national policies
and strategies. Analysis of immediate and underlying causes will provide pointers for
developing the next country programme.
4.1 Major Manifestations
Children have the right to survive, develop, be protected and participate in activities
and making decisions that affect their lives.
Survival
The right to survive implies that children should not die, that is, infant mortality
should be low. The national targets are to reduce infant mortality rate from 99 per
1000 in 1999 to 50 by 2010 and to 20 by 2025*. Infant mortality declined from 115
per 1000 in 1988 to 105 in 1992, equivalent to 2.5 points decline, annually. However,
the rate of decline slowed down to 0.86 points annually between 1992-1999.
Therefore, at the current rate the national targets on infant mortality will not be
achieved.
The national targets are to reduce under-5 mortality by 50% by year 2010 from 150
per 1000 in 1999. The under-5 mortality declined from 191 per 1000 in 1988 to 141
in 1992, equivalent to 12.5 points decline, annually. However, the situation reversed
* Most national targets presented in this report are drawn from the Tanzania Development Vision 2025, the National Poverty Eradication Strategy and the draft Poverty Reduction Strategy Paper (PRSP).

8
and recorded an increase of 1.3 points annually between 1992-1999. Therefore, at the
current rate the national targets on the under-5 mortality will not be achieved.
There is a strong link between infant mortality and maternal mortality. The national
target is to reduce maternal mortality from 529 per 100,000 births in 1999 to 265 by
2010. Figures on maternal mortality are uncertain. However, there are indications
that maternal mortality increased from 340 per 100,000 births from 1994 to the
current rate of 529. Based on this trend, it is unlikely that the national target on
maternal mortality will be achieved.
Data on mortality related to HIV/AIDS are likely to under-report because many
deaths are not reported in health centres. However HIV/AIDS is responsible for a
significant part of the high mortalities observed. Of the AIDS cases reported to the
National AIDS Control Programme (NACP) in 1998, 2% were children aged 0-5
years. More recent estimates quote higher numbers between 50,000 – 60,000 a year.
The percentage drops to 0.6, 0.1 for children aged 6-11 and 12-14, respectively before
it picks up as children enter the adolescent stage. For girls the picking up and high
rates start earlier than boys. These figures may be under-represented; many
HIV/AIDS deaths are not reported. Studies have also shown high rates (around 20%)
of HIV infection among pregnant women.
Nevertheless, the greatest threat for children’s survival continues to be malaria,
diarrhoeal diseases and respiratory infections (including anaemia). They account for
52.5 of the under-five children deaths. And for the youth women the leading killer
disease is HIV/AIDS, followed closely by malaria and tuberculosis.
Children’s survival can be significantly enhanced if they are adequately immunized.
The government has a target to immunize 85% of the children less than two years old
against measles and DPT by 2003; the current percentage is 71. The rate was around
74 percent in 1991, implying a decrease of 0.3 points per year during 1991 and year
2000. (URT, 1996). Therefore, the target to increase annual coverage by 4.7
percentage points in the next three years is unlikely to be met, unless serious
campaigns are launched – with a focus on districts with low immunization rates.
9
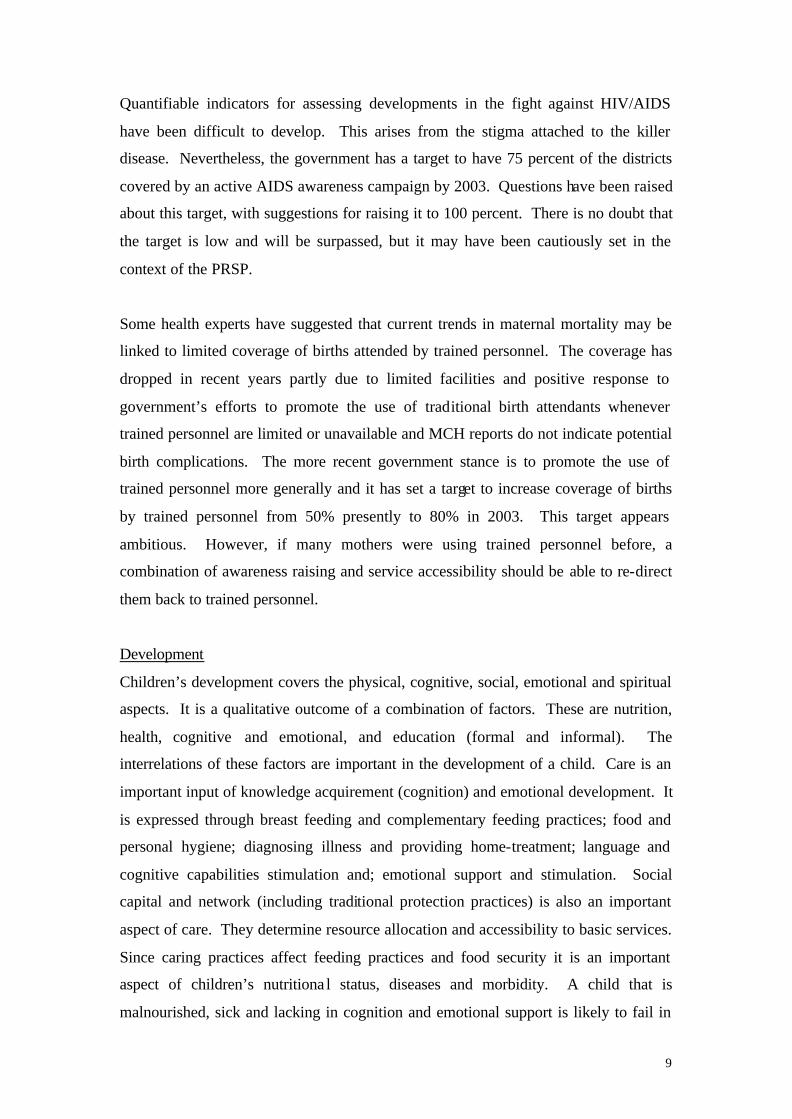
Quantifiable indicators for assessing developments in the fight against HIV/AIDS
have been difficult to develop. This arises from the stigma attached to the killer
disease. Nevertheless, the government has a target to have 75 percent of the districts
covered by an active AIDS awareness campaign by 2003. Questions have been raised
about this target, with suggestions for raising it to 100 percent. There is no doubt that
the target is low and will be surpassed, but it may have been cautiously set in the
context of the PRSP.
Some health experts have suggested that current trends in maternal mortality may be
linked to limited coverage of births attended by trained personnel. The coverage has
dropped in recent years partly due to limited facilities and positive response to
government’s efforts to promote the use of traditional birth attendants whenever
trained personnel are limited or unavailable and MCH reports do not indicate potential
birth complications. The more recent government stance is to promote the use of
trained personnel more generally and it has set a target to increase coverage of births
by trained personnel from 50% presently to 80% in 2003. This target appears
ambitious. However, if many mothers were using trained personnel before, a
combination of awareness raising and service accessibility should be able to re-direct
them back to trained personnel.
Development
Children’s development covers the physical, cognitive, social, emotional and spiritual
aspects. It is a qualitative outcome of a combination of factors. These are nutrition,
health, cognitive and emotional, and education (formal and informal). The
interrelations of these factors are important in the development of a child. Care is an
important input of knowledge acquirement (cognition) and emotional development. It
is expressed through breast feeding and complementary feeding practices; food and
personal hygiene; diagnosing illness and providing home-treatment; language and
cognitive capabilities stimulation and; emotional support and stimulation. Social
capital and network (including traditional protection practices) is also an important
aspect of care. They determine resource allocation and accessibility to basic services.
Since caring practices affect feeding practices and food security it is an important
aspect of children’s nutritiona l status, diseases and morbidity. A child that is
malnourished, sick and lacking in cognition and emotional support is likely to fail in

10
educational attainment; through lack of concentration, poor attendance, dropout and
failure to catch up on lessons.
The national target is to reduce severe underweight of under-five children from the
current level of 6.5% to 2% by 2010. During 1991/92 – 1999, severe underweight
declined by 0.6% points, from 7.1%. This is equivalent to an annual decline of 0.09%
points. In addition there was a national target to reduce moderate and severe
underweight from 28.8% in 1991/92 to 22% in year 2000. The current rate is 29.4%,
indicating that the rate increased rather than declining. Therefore, based on trends in
the past ten years national targets on malnutrition of the under-five children will not
be achieved. Studies show that in Tanzania, poor nutrition of the under-five mainly
arise from infrequent feeding of children. Although this may be an issue of limited
awareness on the part of parents, it is more likely an issue of food insecurity,
traditions and demands on time and workload of women who are often held
responsible for child feeding.
As mentioned earlier on, morbidity is another constraint of children’s development.
Unfortunately precise figures on morbidity are missing and; no specific national
targets have been fixed. A recent study1 covering seven districts in Mainland
Tanzania 675 households and 1341 children found high morbidity rates for infants
(55%), under-five children (55%) and children aged 5-18 years (35%). Consistent
with national survey, this study found that malaria, respiratory illness (including
pneumonia and anaemia) and diarrhoea are the most common diseases for infants and
the under-five children. National statistics show that malaria accounts for 38% of
morbidity. (URT, 1999)
Education is a major component of children’s development. In this case, access to
quality basic education is key. A useful outcome indicator of basic education is adult
literacy. Adult education that played an important role in the promotion of literacy in
the 1970s has not received high priority in recent years. Therefore, much of the
changes that we observe recently in literacy can largely be attributed to primary
education.
1 Mushi, Deogratias: Survey undertaken in Kibaha, Kisarawe, Bagamoyo, Mwanga, Rombo, Moshi Rural and Moshi Urban in 1998/99.
11
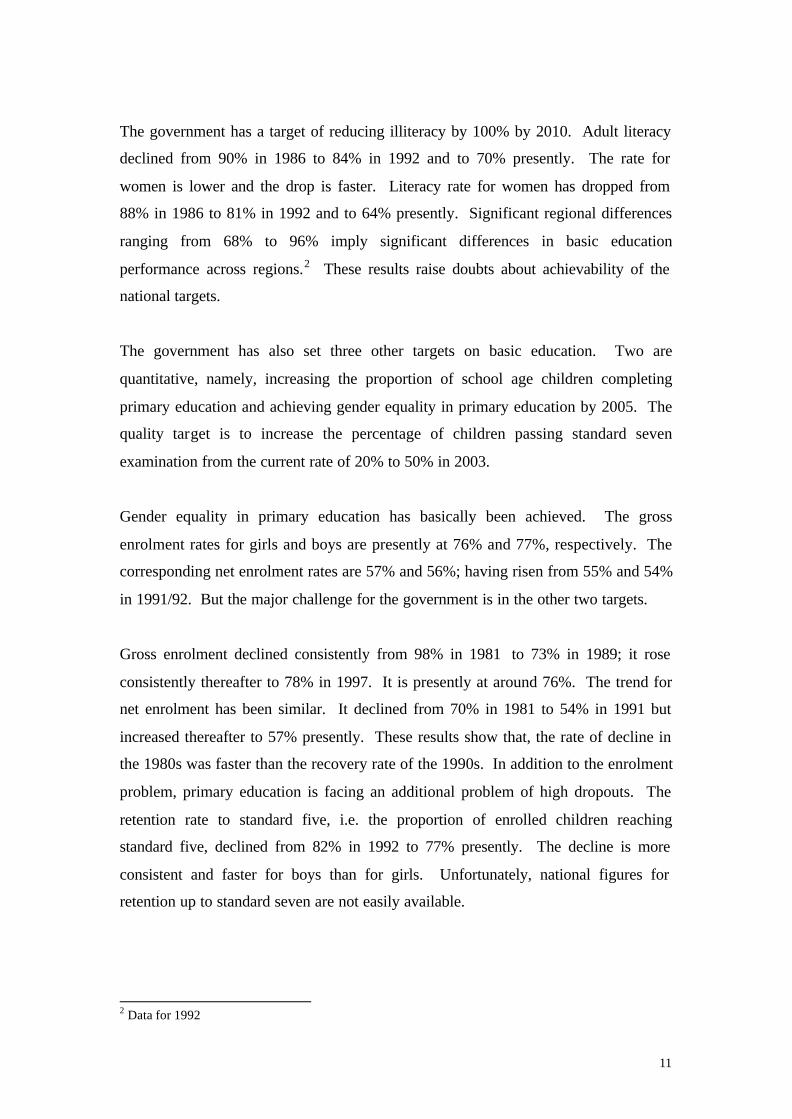
The government has a target of reducing illiteracy by 100% by 2010. Adult literacy
declined from 90% in 1986 to 84% in 1992 and to 70% presently. The rate for
women is lower and the drop is faster. Literacy rate for women has dropped from
88% in 1986 to 81% in 1992 and to 64% presently. Significant regional differences
ranging from 68% to 96% imply significant differences in basic education
performance across regions.2 These results raise doubts about achievability of the
national targets.
The government has also set three other targets on basic education. Two are
quantitative, namely, increasing the proportion of school age children completing
primary education and achieving gender equality in primary education by 2005. The
quality target is to increase the percentage of children passing standard seven
examination from the current rate of 20% to 50% in 2003.
Gender equality in primary education has basically been achieved. The gross
enrolment rates for girls and boys are presently at 76% and 77%, respectively. The
corresponding net enrolment rates are 57% and 56%; having risen from 55% and 54%
in 1991/92. But the major challenge for the government is in the other two targets.
Gross enrolment declined consistently from 98% in 1981 to 73% in 1989; it rose
consistently thereafter to 78% in 1997. It is presently at around 76%. The trend for
net enrolment has been similar. It declined from 70% in 1981 to 54% in 1991 but
increased thereafter to 57% presently. These results show that, the rate of decline in
the 1980s was faster than the recovery rate of the 1990s. In addition to the enrolment
problem, primary education is facing an additional problem of high dropouts. The
retention rate to standard five, i.e. the proportion of enrolled children reaching
standard five, declined from 82% in 1992 to 77% presently. The decline is more
consistent and faster for boys than for girls. Unfortunately, national figures for
retention up to standard seven are not easily available.
2 Data for 1992

12
The reasons for low enrolments and high dropouts may vary by children and school.
Two explanations are commonly given. The first is based on the economic concept of
opportunity cost and the second is that many parents are too poor to afford payment of
the fee, together with the other user charges and contributions. We focus on the first;
the second will be discussed under the immediate causes section (see below).
The opportunity cost argument is based on the expectations of the society, parents and
children on the achievements of primary education. During the first thirty years of
independence investment on education yielded high private returns. However, since
the rate of return increased with the level of education, people attached high values to
transition to secondary education, which was kept very low as public schools could
not keep pace with an expanding primary school population and public demand. The
rate remained at single digit for a long time. Only the coming in of private secondary
education was able to raise the rate to the current level of 15%. Recently, there have
been complaints about declining quality of primary education. In addition to low
transition rate, some primary school leavers have joined the illiterate population. As
stated above only about 20% of the primary school leavers pass their final
examination. A combination of low returns on primary education, low quality of
primary education and poverty may encourage parents and children to prefer short
term options such as trading. The latter two reasons are supported by the perceptions
study that covered 2,600 households in 54 rural and per-urban locations throughout
the country. (TADREG, 1997).
Therefore, the challenge is to increase the number of pupils passing standard seven
examination and the transition rate to secondary education from 20% to 50% and 15%
to 21%, respectively by 2003. Given past trends, it is unlikely that these targets will
be achieved.
Access to clean water and sanitary excrete disposal is an important aspect of human
capability. The government has a target of providing safe and clean water to rural
areas from the current coverage of 48.5% to 85% in 2010. Coverage was 52.3% in
1990-92, implying that accessibility declined during the past ten years. On the basis
of this trend, it is unlikely that the target will be realised. Access to sanitary excrete

13
disposal is high, 87.6%. However, the situation with solid waste disposal in the urban
areas is quite unsatisfactory; only about 10-20 percent is disposed and treated.
Protection
Children are vulnerable from actions of adults. Many of them are denied their rights
to basic services, freedom of speech and movement and be heard and legal protection.
These denials are manifested in street children, child labour, children headed
households, rape, early pregnancies, etc. Therefore children’s security is an important
aspect of the CRC. Data and information for the determination of children’s status in
these areas is lacking. Therefore, only anecdote information is presented here.
The number of children who have become orphans, loosing one or both of their
parents is estimated to be around 1.2 million in year 2000, mostly as a result of the
HIV/AIDS pandemic. This represents about 9% of all Tanzanian children under the
age of 15 years. However, there are major geographical differences across the
country. For example, it is estimated that up to 39% of children in Makete district are
orphaned; the district has many migrant workers and a high incidence of HIV/AIDS.
In Kisarawe the situation is not as bad; only about 4% of the children under 15 years
are orphaned.
Complete and reliable information on early marriage and pregnancies is lacking.
However, information from case studies show that the problems may not be
insignificant. For example, figures from MCH clinics in one clinic in Musoma in
selected months in 1997/98 show that 12% of the deliveries were to mothers aged 14-
18 years. The problem may be underestimated in the rural areas where attendance
and deliveries at MCH clinic may not be fully. High Primary school drop outs due to
pregnancy in some areas of the country show that the problem deserves adequate
attention. In Newala 45% of the drop outs during 1995-97 were girls. Of the girls
that dropped out, 32% were due to pregnancy. However, the rates vary between
areas. An average of 11% of the girls dropouts in Iringa were due to pregnancy
(UNICEF, 1999:198-234). The percentage was 20% and 28% in Bagamoyo in
1997/98 and 1998/99, respectively. (Galabawa, 2000:19). The extent of the problem
may be underestimated by official figures.
14
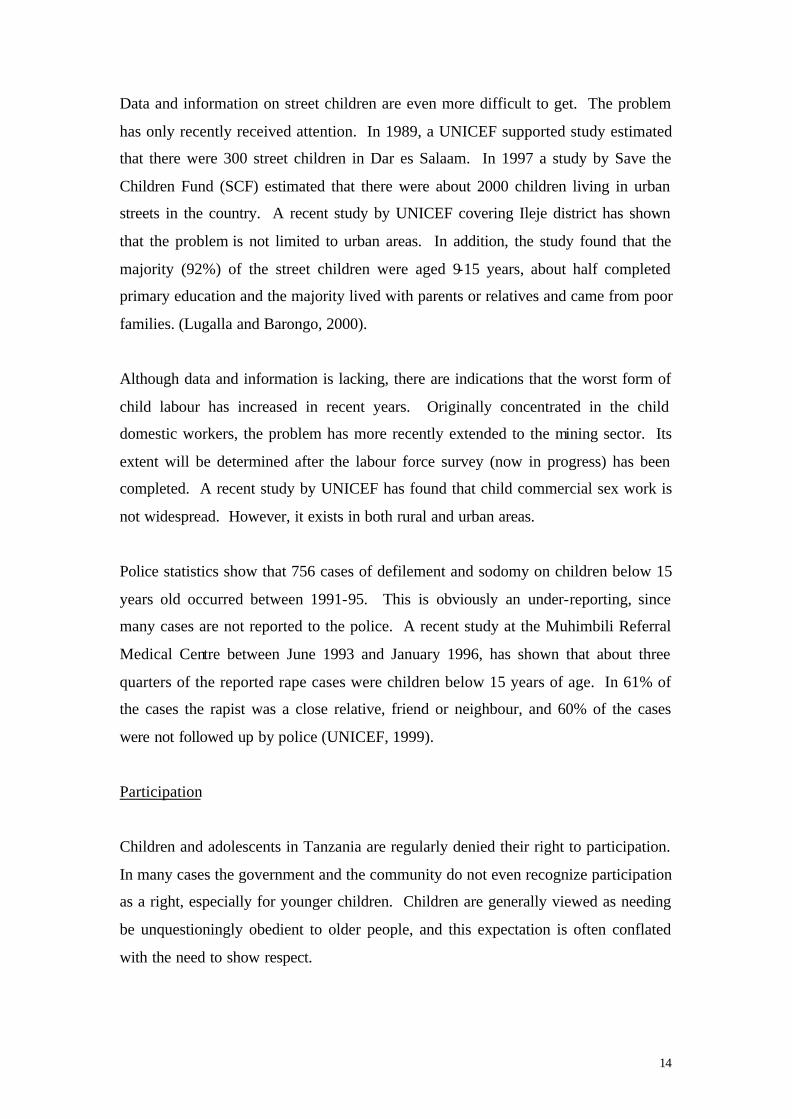
Data and information on street children are even more difficult to get. The problem
has only recently received attention. In 1989, a UNICEF supported study estimated
that there were 300 street children in Dar es Salaam. In 1997 a study by Save the
Children Fund (SCF) estimated that there were about 2000 children living in urban
streets in the country. A recent study by UNICEF covering Ileje district has shown
that the problem is not limited to urban areas. In addition, the study found that the
majority (92%) of the street children were aged 9-15 years, about half completed
primary education and the majority lived with parents or relatives and came from poor
families. (Lugalla and Barongo, 2000).
Although data and information is lacking, there are indications that the worst form of
child labour has increased in recent years. Originally concentrated in the child
domestic workers, the problem has more recently extended to the mining sector. Its
extent will be determined after the labour force survey (now in progress) has been
completed. A recent study by UNICEF has found that child commercial sex work is
not widespread. However, it exists in both rural and urban areas.
Police statistics show that 756 cases of defilement and sodomy on children below 15
years old occurred between 1991-95. This is obviously an under-reporting, since
many cases are not reported to the police. A recent study at the Muhimbili Referral
Medical Centre between June 1993 and January 1996, has shown that about three
quarters of the reported rape cases were children below 15 years of age. In 61% of
the cases the rapist was a close relative, friend or neighbour, and 60% of the cases
were not followed up by police (UNICEF, 1999).
Participation
Children and adolescents in Tanzania are regularly denied their right to participation.
In many cases the government and the community do not even recognize participation
as a right, especially for younger children. Children are generally viewed as needing
be unquestioningly obedient to older people, and this expectation is often conflated
with the need to show respect.

15
At the household level, children are rarely consulted in the key decision making
activities regarding the family budget, allocation of tasks or setting priorities. When
children complain about household arrangements, their views are ignored or even
punished. At the community level children also play a marginal role in important
decision making processes and structures. There is no formal place for children in
village councils, for instance, and children are virtually never involved in community
planning, monitoring or evaluation. While children often join together to engage in
activities, there is little space for them to form and foster their own associations.
The school setting – at both the primary and secondary level – is perhaps the most
oppressive in relation to child participation. Several studies and observations show
that daily interactions between pupils and teachers are characterized by hierarchical,
authoritarian relationships, where teaching is done by rote and little opportunity made
available for interactive learning or the acquisition of real life skills. Pupils are not
able to participate in student government or have a voice in the school committee.
School discipline is also administered in extreme draconian fashion, where the teacher
is the final arbiter and pupils have no ability to form the rules or influence their
implementation.
The participation of children is limited in other key sectors as well. According to
several reports, children and especially adolescents are ill- treated at health centres.
They are often pushed to the back of the queue, and if they do manage to see a health
worker are unable to explain their viewpoint and receive quality care. Counselling
services are often little more than admonishments, especially in relation to sexual
matters. Similarly, children have little say in water management committees,
environmental conservation and economic enterprises.
While all children lack adequate enjoyment of their right to participation, some
groups are affected more than others. Children with disabilities are often kept out of
school, receive little skill training, discriminated against in recreation and made to live
menial lives on the margins of society. Child domestic workers, most of whom are
female, often face an acutely isolated life with little opportunity to socialise with their
peers and no recourse to justice when they are abused. Poor and more rural children
are often unable to enjoy the limited benefits of their more urban and affluent peers,
16
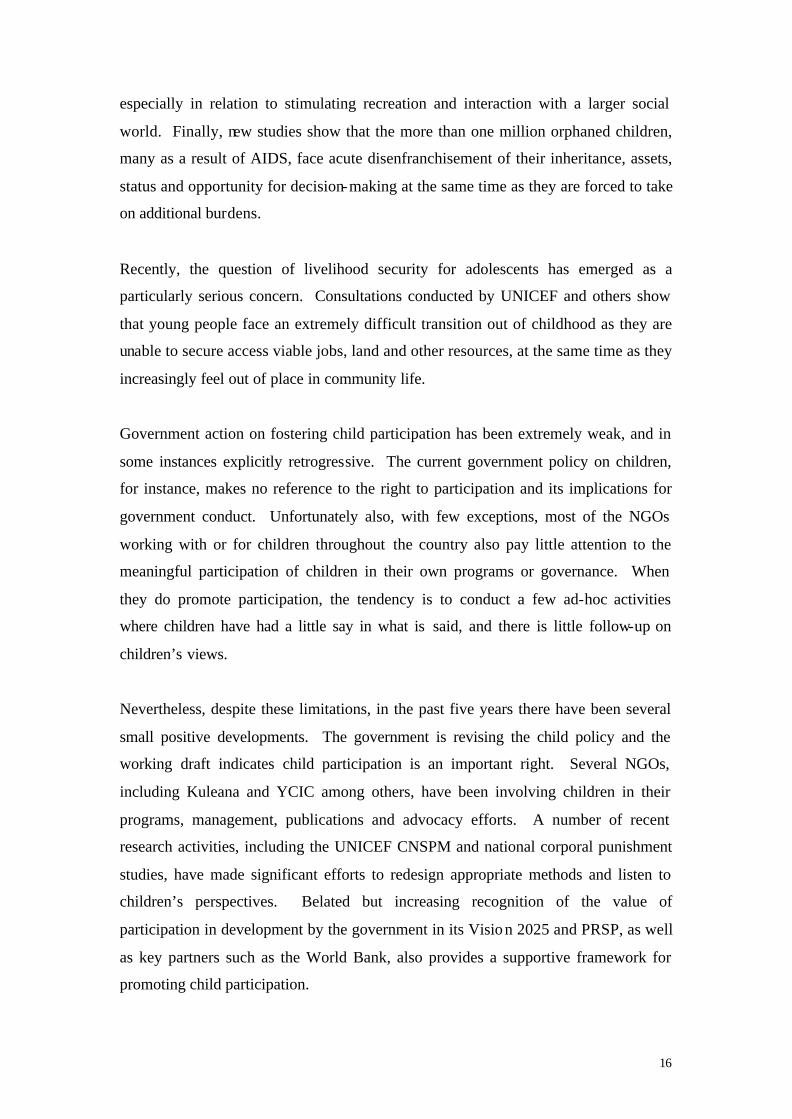
especially in relation to stimulating recreation and interaction with a larger social
world. Finally, new studies show that the more than one million orphaned children,
many as a result of AIDS, face acute disenfranchisement of their inheritance, assets,
status and opportunity for decision-making at the same time as they are forced to take
on additional burdens.
Recently, the question of livelihood security for adolescents has emerged as a
particularly serious concern. Consultations conducted by UNICEF and others show
that young people face an extremely difficult transition out of childhood as they are
unable to secure access viable jobs, land and other resources, at the same time as they
increasingly feel out of place in community life.
Government action on fostering child participation has been extremely weak, and in
some instances explicitly retrogressive. The current government policy on children,
for instance, makes no reference to the right to participation and its implications for
government conduct. Unfortunately also, with few exceptions, most of the NGOs
working with or for children throughout the country also pay little attention to the
meaningful participation of children in their own programs or governance. When
they do promote participation, the tendency is to conduct a few ad-hoc activities
where children have had a little say in what is said, and there is little follow-up on
children’s views.
Nevertheless, despite these limitations, in the past five years there have been several
small positive developments. The government is revising the child policy and the
working draft indicates child participation is an important right. Several NGOs,
including Kuleana and YCIC among others, have been involving children in their
programs, management, publications and advocacy efforts. A number of recent
research activities, including the UNICEF CNSPM and national corporal punishment
studies, have made significant efforts to redesign appropriate methods and listen to
children’s perspectives. Belated but increasing recognition of the value of
participation in development by the government in its Vision 2025 and PRSP, as well
as key partners such as the World Bank, also provides a supportive framework for
promoting child participation.
17
The task now is to build on these modest beginnings and develop support for deeper,
voluntary participation of children and adolescents at the heart of society. Ensuring
this happens meaningfully – on a day to day basis – in key institutions such as the
household, school and in community governance is the key challenge for the
government, UNICEF and partners. A vital dialogue with communities – including
young people – about the value of child participation and how to promote it
effectively will be essential as well.
4.2 Immediate Causes
The manifestations described above have arisen because the required institutional
framework has not been put in place to support and provide the basic services. This is
the case for both the institutional arrangement (institutions of governance) and
institutional environment (rules of the game or the incentive system). The former
relates to arrangements within and between organizations, reporting systems,
mechanisms for cooperation and changes in laws or property rights. More
specifically, within the CRC, it includes economic, social and legal infrastructure
(schools, dispensaries, courts, roads, motivated teachers, magistrates, etc.). The latter
covers a set of rules (political, social and legal) that establish the basis for production,
exchange and distribution. Within the CRC this would cover, for example, rules that
cover provision of basic rights for children.
4.2.1 Institutional Arrangement
Organizations have to be established, with adequate reporting systems for enhancing
accountability and transparency; and they should be equipped with competent and
motivated staff and complementary inputs. The relevant organizations for ensuring
the survival, development, protection and participation of children may be grouped
under basic social services, food security and police and judiciary.
Although major problems with institutional arrangements are found in operation and
maintenance of existing capacity and lack of provisions for facilitating children’s
participation, the problems of capacity are not insignificant, especially in the rural
areas. Data for 1998 show that, except for desks, there is a high shortage of facilities

18
and furniture in primary schools. For example, only 57% of the required classrooms,
22% of the required staff houses, 30% of the required toilets, 58% of the required
staff rooms, 33% of the required stores, 35% of the required tables, 34% of the
required chairs and 25% of the required cupboards were available in the country. The
ongoing school mapping exercise suggests that significant differences exist between
geographical areas. For example, the classroom pupil ratio is 1:70 in Kisarawe, 1.45
in Bagamoyo and 1:140 in Serengeti. The national average is 1:72. The toilet pupil
ratio is 1:40 in Kisarawe, 1:25 in Bagamoyo and 1:80 in Magu. (URT, 1999,
Galabawa, 2000).
The other area relates to human capacity, mainly the teachers and inspectors. The
government student-teacher ratio target is 45:1. In 1998 the national ratio was 39:1,
better than the government target. However, this ratio hides significant inequalities in
the distribution and quality of teachers. For example, the pupil teacher ratio is 47:1 in
Musoma, 37:1 in Kisarawe and 25:1 in Morogoro urban. High inequalities are also
experienced within an area. In Morogoro urban some wards and schools have a ratio
as high as 48:1, implying that others have ratios lower than 25:1.
In addition to inefficiency in the use of teachers, there is the quality aspect. 56% of
the primary school teachers are primary school leavers or secondary school failures.
0.6% are diploma holders. The rest are form four leavers. The need for training (of
the trainables) is obvious here.
A similar situation prevails in health, water and sanitation. Unfortunately detailed
information on existing facility gaps are not easily available to enable a similar
analysis as in primary education to be made. However, there are a total of 3955
dispensaries in the country, implying that about 2.4 villages share a dispensary.
Obviously more rural villages share a dispensary. Similarly, there are a total of 7081
inpatient beds shared between the health centres and dispensaries in the country,
implying that about 1.3 villages share a bed. In the rural areas, 69% of the households
rely on open well and surface (river, stream, lake, pond) water sources. The
corresponding percentage is 22 in the urban area. These statistics suggest that the
basic facilities in the health, water and sanitation are quite inadequate and unequally
distributed. And although the contribution of the non-public sector has grown in

19
recent years(currently accounting for about 34% of the health facilities) the focus has
been in the urban areas, leaving much of the rural population with limited facilities.
As stated earlier on, the main problems in institutional arrangements relate to
operation and maintenance of the exis ting facilities. Health facilities have operated
below capacity because essential inputs such as drugs and other supplies and inputs
are not available, and appropriate incentives for staff motivation are not adequately
provided. But often the supplies are not used as intended. The drugs provided under
the EDP have sometimes been diverted to private uses, leaving public health facilities
with limited supplies.
In a recent study that covered 675 households in 6 rural districts and 1 urban
municipality, public health facilities scored lower than private facilities in drugs
availability (2.95 against 4.19 points), cleanliness (3.37 against 4.12), staff availability
(3.33 against 3.69), laboratory facilities (2.87 against 3.26), queuing time (2.56
against 4.04) and patients handling (3.06 against 4.16), in a maximum score of 5
points. The public facilities scored higher than private facilities in prices (3.92
against 2.74), wards (2.56 against 2.49) and meals (1.28 against 0.46). For the latter
two the score for public facilities reflects unavailability in private facilities (as many
are dispensaries with no wards) rather than any qualitative difference (Mushi, 2000).
An assessment of inter-temporal change in the quality of care in health facilities in
Bagamoyo, Mwanga and Kisarawe public health facilities between 1995 and 1998
revealed that only cleanliness registered improvement. Availability of drugs, queuing
time and availability of staff registered deterioration. Apparently much of the
contribution from cost sharing was used to paint buildings and make the facilities look
clean at the time research was being undertaken (Mushi, 2000).
As stated earlier on, the quality of primary education is considered to have declined.
In a study involving 2600 households in 54 rural and peri-urban locations, 80%
indicated that shortage of books and school equipment was a big problem. Poor
school condition was also considered to be a big problem by 58% of the respondents.
Therefore, it is very important that books and equipment are provided (according to
81% of the respondents) and existing facilities are improved upon (stated by 64% of
20
the respondents) (TADREG, 1997). The school mapping exercise in Kisarawe,
Magu, Serengeti, Bagamoyo, Musoma districts and Morogoro urban has revealed
major problems in the availability of mathematics books in some areas. The ratio of
pupils to mathematics books is as high as 28:1 in Serengeti and 22:1 in Musoma
districts. The school mapping exercise has also revealed high inequalities in the
allocation of mathematics books across the country. The ratio was 3:1 in Kisarawe,
Magu and Bagamoyo districts and 7:1 in Morogoro municipality (Galabawa, 2000).
Budgeting and Resource Allocation for the Rights of Children
The observed inadequacy in the availability of physical facilities (equipment and
furniture), competent and motivated human resources as well as operation and
maintenance inputs and supplies is a result of two factors. Firstly, it results from a
prolonged period of limited allocation of public resources at the same time as the
requirements are rising. This partly arose from prioritization that did not necessarily
reflect children’s needs. Secondly, some of the allocated resources have not been
efficiently utilized. We focus our analysis on recurrent spending, except when
explicitly stated, mainly because comprehensive and accurate information on
investment expenditure is lacking and significant quick gains can be expected from
recurrent expenditures.
Analysis of government spending on social services would suggest that financial
commitment to implement the CRC begun in 1995. Between 1991 and 1994 the share
of government expenditure on social services declined consistently. The decline
seems to be a result of the fall in GDP growth and government revenue. The trend
does not show any discretionary spending on social services before 1995. After 1994
we begin to see changes in government priorities in favour of social services. (Table 1
and Figure 1.).

21
Table 1: GDP growth , government reserve and expenditure on social services 1991-2000
Year 1991 1992 1993 1994 1995 1996 1997 1998 1999 2000
GDP Growth Rate
2.8
1.8
0.4
1.4
3.6
4.2
3.3
4.0
4.5
5.0
Government revenue over GDP 13.5 13.6 10.2 11.4 11.8 13.0 13.4 13.1 12.3
12.4
Tax revenue over GDP 12.0 12.0 9.1 10.4 10.7 11.1 11.8 12.0 11.7 10.9
Government recurrent expenditure on social
services ( %)
25.8
23.7
20.8
18.4
28.4
26.2
27.6
29.5
31.13
40.83
Government total expenditure on education as
(%)
14 16 22
18 12 14 16
Share of recurrent primary education
expenditure in the total recurrent
expenditure on Education
57
53
67
63
66
66
61
72
Government expenditure on Health(%) 7.4 6 6.4 6.7 4.7
6.1
Share of recurrent primary health care
expenditure in the total recurrent
expenditure on health
21
34
25
25
31
28
41.3
40
Source: Economic Surveys, 1999 & 2000, Public Expenditure Review, 1999 and 2000.
22
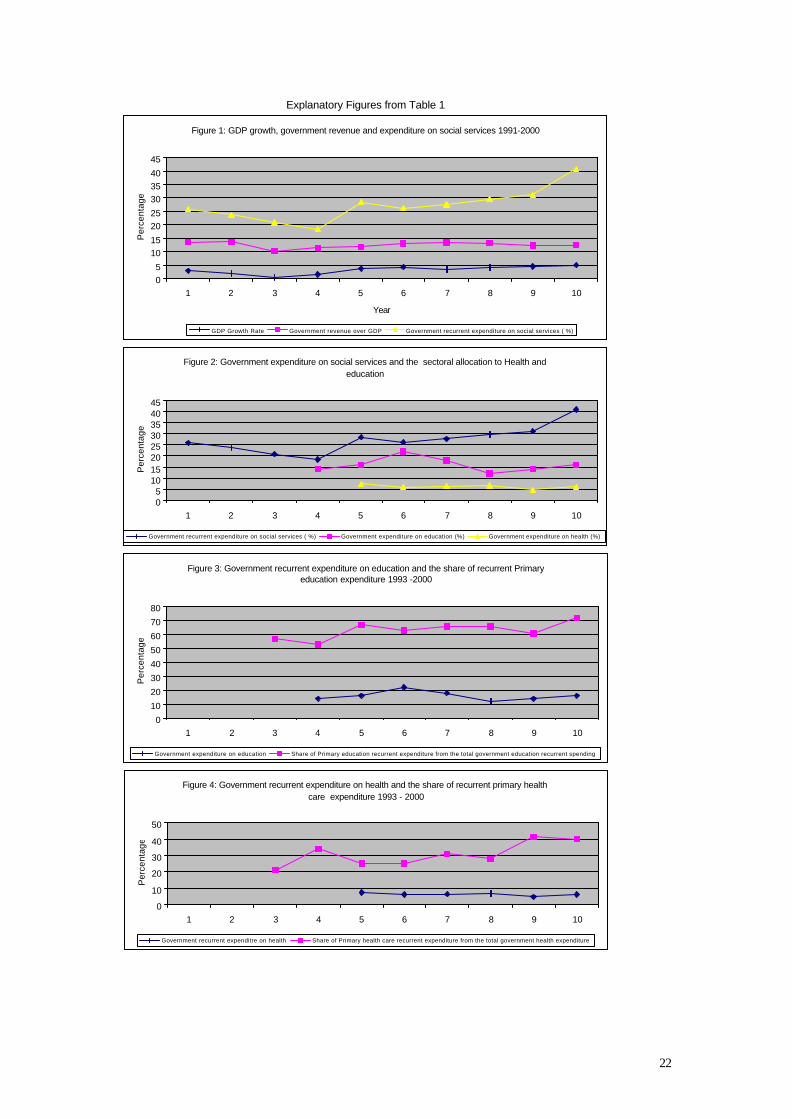
Explanatory Figures from Table 1
Figure 1: GDP growth, government revenue and expenditure on social services 1991-2000
05
1015202530354045
1 2 3 4 5 6 7 8 9 10
Year
Per
cent
age
GDP Growth Rate Government revenue over GDP Government recurrent expenditure on social services ( %)
Figure 2: Government expenditure on social services and the sectoral allocation to Health and education
05
1015202530354045
1 2 3 4 5 6 7 8 9 10
Per
cent
age
Government recurrent expenditure on social services ( %) Government expenditure on education (%) Government expenditure on health (%)
Figure 3: Government recurrent expenditure on education and the share of recurrent Primary education expenditure 1993 -2000
01020304050607080
1 2 3 4 5 6 7 8 9 10
Per
cent
age
Government expenditure on education Share of Primary education recurrent expenditure from the total government education recurrent spending
Figure 4: Government recurrent expenditure on health and the share of recurrent primary health care expenditure 1993 - 2000
0
10
20
30
40
50
1 2 3 4 5 6 7 8 9 10
Per
cent
age
Government recurrent expenditre on health Share of Primary health care recurrent expenditure from the total government health expenditure
23
However, the performance of the various social sectors differed. With the exception
of year 2000, the share of health sector from total government expenditure declined
consistently. However, within the health sector primary health care received higher
priority in public spending, especially during the final years of the decade. The share
of primary health care within the health sector rose from 28% in 1998 to 41.3% in
1999 though sectoral share-allocation from total government expenditure declined
(Table 1 and Figure 4).
Trends in the share of education expenditure do not lead to a conclusion that the
sector was a priority before 1999. However, primary education received high and
increasing priority for most of the second half of the decade. (Table 1 and Figure 3).
The year 2000 shows a big jump in government spending on social services. The
shares of education and health went up. This is a clear result of the current efforts by
the government to increase provision of social services; efforts that have received
donor support and financial backing through the MDF and now HIPC debt relief
programs.
Figure 5 shows a declining inflation rate for the last five years though the real changes
in per pupil expenditure remained negative throughout except from the year 1999.
Therefore, much of the increase in the allocation to primary education prior to 1999
(Figure 3) was swallowed by inflation. However, with an exception of 1995 and
1997, there was a real increase in government expenditure on primary health care.
(Figure 6).

24
source: Public Expenditure Review Reports, 1999 and 2000; Economic Surveys, 1999 and 2000; and Basic Statistics on
Education in Tanzania, 1999 and 2000.
The current trend of government financing of primary education shows that about
90% of the recurrent funds for the sector is used to finance personal emoluments.
Field survey data show that in Kibaha and Kisarawe less than 5% of the total
government subventions (education) is used as non-salary expenditures. This is less
Figure 6: Government Expenditure on Primary health Care: Annual changes
-40
-20
0
2 0
4 0
6 0
8 0
100
120
1994 1995 1996 1997 1998 1999 2000
Per
cent
age
Inflation Percentage change in nominal expenditure on Primary Health care
Figure 5: Inflation and government expenditure on Primary education
0
10
20
30
40
50
60
70
1995 1996 1997 1998 1999
Per
cent
age
Inflation Percentage nominal increase in per pupil government recurrent expenditure
25
than half the government no-salary allocation. Furthermore, the actual purchase of
school supplies as a percentage of non-salary subventions plus school fees never
exceeded fifty for the last nine years except for 1991 (Kisarawe) and 1998 and 1999
(Kibaha). Further analysis of the field data shows that the actual amount spent on
education is sometimes less than the actual government subventions to districts. In
Kibaha actual council expenditure on education was 89% in 1995 and 94% in 1998 of
the subventions received for education. The percentage in 1995 should be lower if we
adjust for school fees, which were part of council expenditures at that time. The
implication of these figures is that there is a re-allocation of the earmarked
government subventions at district councils. This implies further that the ultimate
actual amount available for intended expenditures in the sector is lower than is shown
in the budgets. The non-salary component is the major victim.
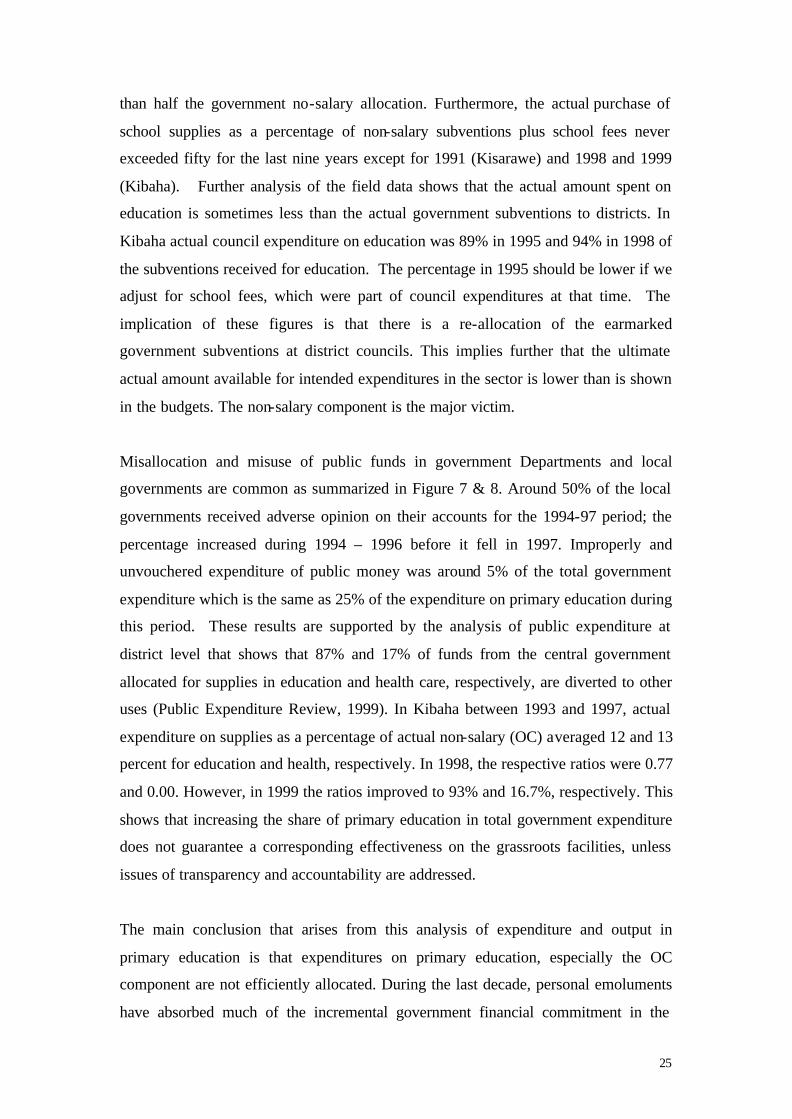
Misallocation and misuse of public funds in government Departments and local
governments are common as summarized in Figure 7 & 8. Around 50% of the local
governments received adverse opinion on their accounts for the 1994-97 period; the
percentage increased during 1994 – 1996 before it fell in 1997. Improperly and
unvouchered expenditure of public money was around 5% of the total government
expenditure which is the same as 25% of the expenditure on primary education during
this period. These results are supported by the analysis of public expenditure at
district level that shows that 87% and 17% of funds from the central government
allocated for supplies in education and health care, respectively, are diverted to other
uses (Public Expenditure Review, 1999). In Kibaha between 1993 and 1997, actual
expenditure on supplies as a percentage of actual non-salary (OC) averaged 12 and 13
percent for education and health, respectively. In 1998, the respective ratios were 0.77
and 0.00. However, in 1999 the ratios improved to 93% and 16.7%, respectively. This
shows that increasing the share of primary education in total government expenditure
does not guarantee a corresponding effectiveness on the grassroots facilities, unless
issues of transparency and accountability are addressed.
The main conclusion that arises from this analysis of expenditure and output in
primary education is that expenditures on primary education, especially the OC
component are not efficiently allocated. During the last decade, personal emoluments
have absorbed much of the incremental government financial commitment in the
26
sector. At the same time, the performance of the sector has been poor and
deteriorating, implying that personal emolument is inelastic with respect to primary
education attainment in the current set up, i.e. that personal emolument is a non-
output responding input.
Earlier on, we indicated that 56% of the primary school teachers are primary school
leavers or form four failures, a factor that may explain further the low attainment in
primary education. Therefore, much of the funds allocated for primary education go to
pay ill- trained teachers, whose performance is unlikely to correspond with the
financial inputs. Furthermore, according to the school mapping exercise in 5 rural
districts and one municipality, 36% of the respondents indicated that inspection was
not adequate; 8% said it was hardly available (Galabawa, 2000). Thus, in addition to
the lack of adequate OC to complement teachers’ efforts, poor quality of teachers may
have led to the observed poor performance. Therefore, adequate OC has to be
provided at the same time as teachers’ quality is improved, inspectorate is
strengthened, and transparency and accountability are enhanced.
27
Source: Public Expenditure Review, 2000.
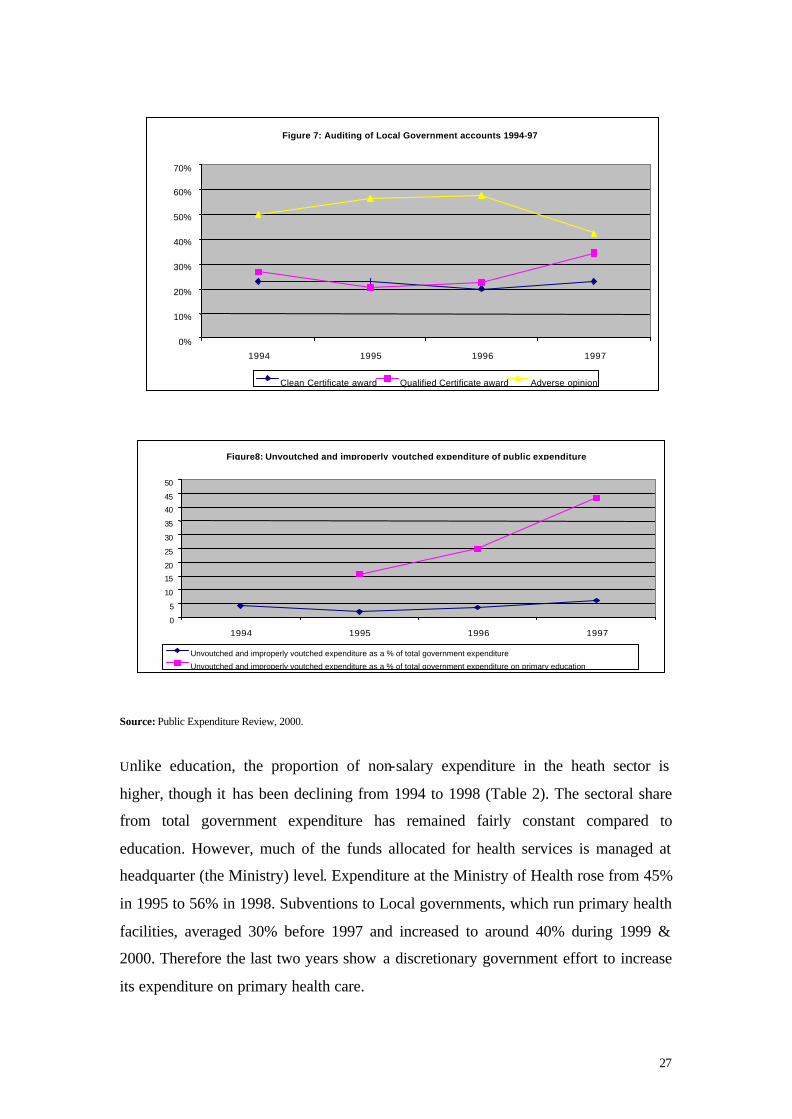
Unlike education, the proportion of non-salary expenditure in the heath sector is
higher, though it has been declining from 1994 to 1998 (Table 2). The sectoral share
from total government expenditure has remained fairly constant compared to
education. However, much of the funds allocated for health services is managed at
headquarter (the Ministry) level. Expenditure at the Ministry of Health rose from 45%
in 1995 to 56% in 1998. Subventions to Local governments, which run primary health
facilities, averaged 30% before 1997 and increased to around 40% during 1999 &
2000. Therefore the last two years show a discretionary government effort to increase
its expenditure on primary health care.
Figure 7: Auditing of Local Government accounts 1994-97
0%
10%
20%
30%
40%
50%
60%
70%
1994 1995 1996 1997
Clean Certificate award Qualified Certificate award Adverse opinion
Figure8: Unvoutched and improperly voutched expenditure of public expenditure
0
5
10
15
20
25
30
35
40
45
50
1994 1995 1996 1997
Unvoutched and improperly voutched expenditure as a % of total government expenditure
Unvoutched and improperly voutched expenditure as a % of total government expenditure on primary education
28
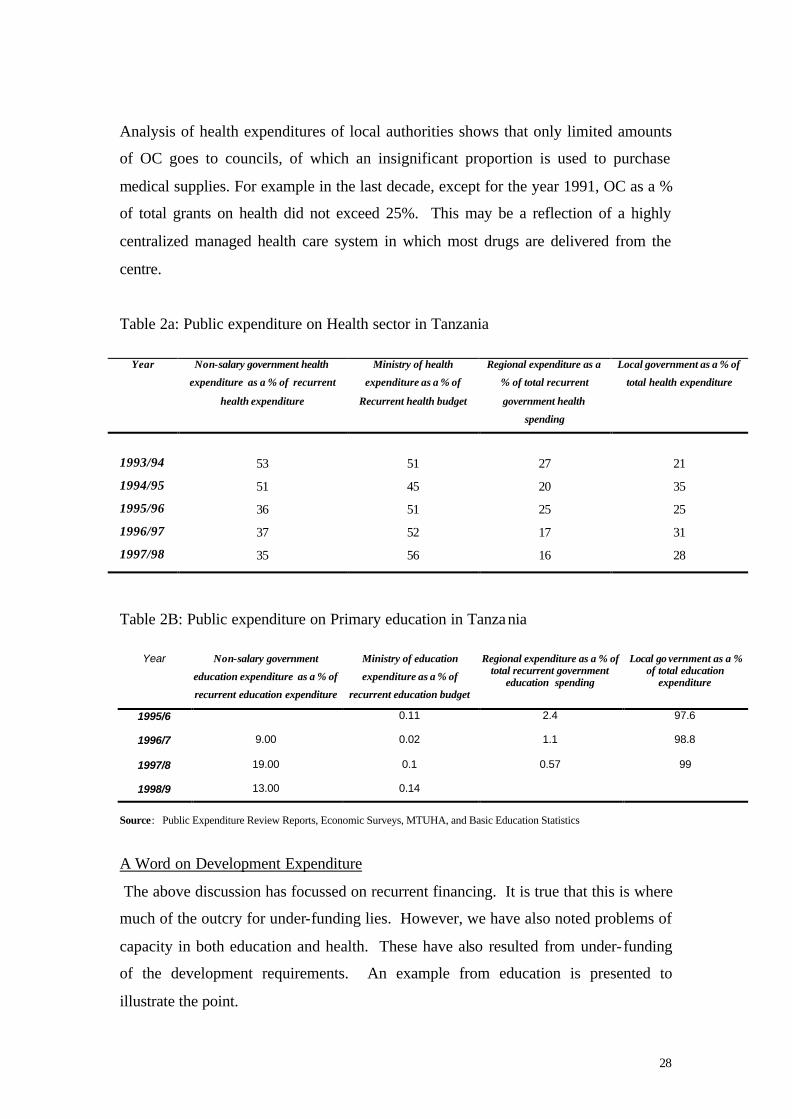
Analysis of health expenditures of local authorities shows that only limited amounts
of OC goes to councils, of which an insignificant proportion is used to purchase
medical supplies. For example in the last decade, except for the year 1991, OC as a %
of total grants on health did not exceed 25%. This may be a reflection of a highly
centralized managed health care system in which most drugs are delivered from the
centre.
Table 2a: Public expenditure on Health sector in Tanzania
Year Non-salary government health
expenditure as a % of recurrent
health expenditure
Ministry of health
expenditure as a % of
Recurrent health budget
Regional expenditure as a
% of total recurrent
government health
spending
Local government as a % of
total health expenditure
1993/94
53
51
27
21
1994/95 51 45 20 35
1995/96 36 51 25 25
1996/97 37 52 17 31
1997/98 35 56 16 28
Table 2B: Public expenditure on Primary education in Tanzania
Year Non-salary government
education expenditure as a % of
recurrent education expenditure
Ministry of education
expenditure as a % of
recurrent education budget
Regional expenditure as a % of total recurrent government
education spending
Local go vernment as a % of total education
expenditure
1995/6 0.11
2.4 97.6
1996/7 9.00 0.02
1.1 98.8
1997/8 19.00 0.1
0.57 99
1998/9 13.00 0.14
Source: Public Expenditure Review Reports, Economic Surveys, MTUHA, and Basic Education Statistics
A Word on Development Expenditure
The above discussion has focussed on recurrent financing. It is true that this is where
much of the outcry for under-funding lies. However, we have also noted problems of
capacity in both education and health. These have also resulted from under-funding
of the development requirements. An example from education is presented to
illustrate the point.
29
For example, in 1997/98 only about 613 million Tanzania shillings were allocated to
local authorities for education development requirements. This is equivalent to an
average of 6 million T.shs. per council or T.shs. 125,000 per school, using Kibaha as
the case. To some extent this is a reflection of the government priorities that allocated
85% of the development budget on education to the central ministry. But even if the
priority was given to local authorities/schools, the amount of public funds is still too
little to make much difference. 100% allocation to primary schools would allocate
only around T.shs. 825,000 per school in 1997/98. This means that significant
improvement in facilities and furniture at the school level may have to rely on
communities, as was seen recently in the campaign for school desks that led to 91%
availability of the requirements.
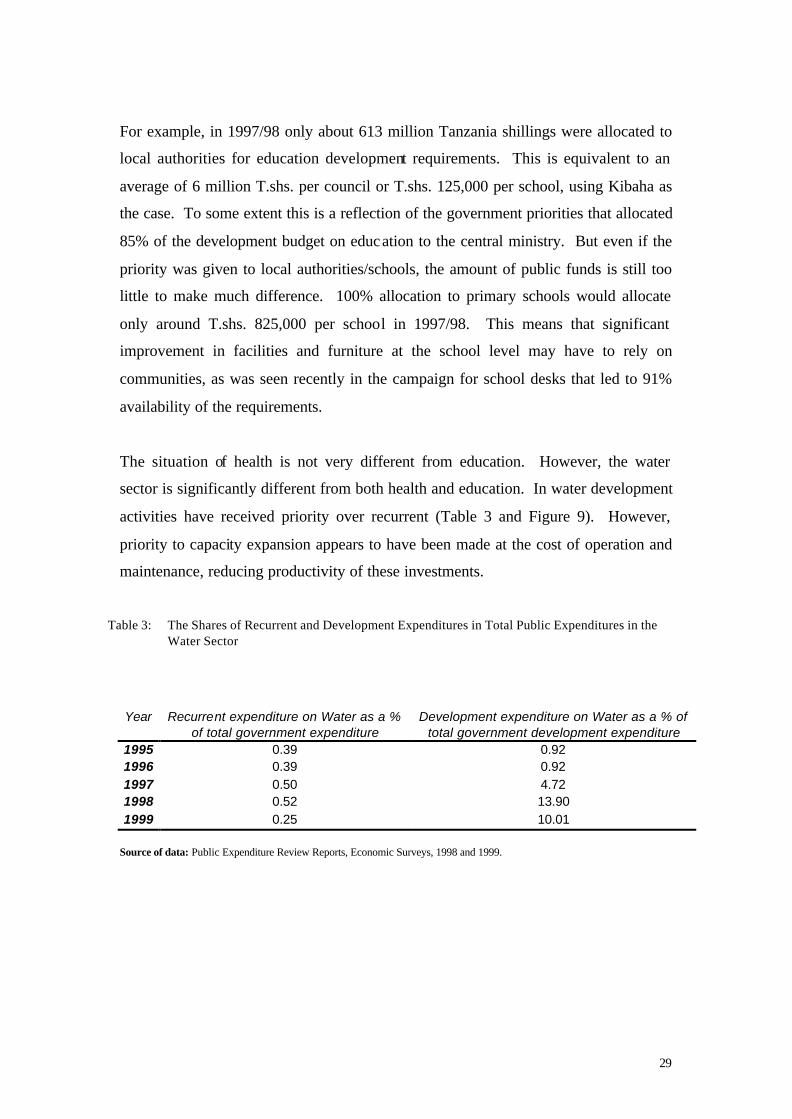
The situation of health is not very different from education. However, the water
sector is significantly different from both health and education. In water development
activities have received priority over recurrent (Table 3 and Figure 9). However,
priority to capacity expansion appears to have been made at the cost of operation and
maintenance, reducing productivity of these investments.
Table 3: The Shares of Recurrent and Development Expenditures in Total Public Expenditures in the Water Sector
Year
Recurrent expenditure on Water as a % of total government expenditure
Development expenditure on Water as a % of total government development expenditure
1995 0.39 0.92 1996 0.39 0.92 1997 0.50 4.72 1998 0.52 13.90 1999 0.25 10.01
Source of data: Public Expenditure Review Reports, Economic Surveys, 1998 and 1999.

30
Cost Sharing
Studies on user fees in public facilities suggest that the fees are deterrent rather than
an attraction through improved services (cf. Hongoro and Chadiwana, 1994; Mushi,
1996; Kamuzora and Mhamba, 1996; TADREG, 1997 and Galabawa, 2000). This
partly explains the law collection observed in both health and education. In the
former collection was higher in 1994/95 when it reached 13% of the non-salary public
expenditures on health care (MTUHA Data Base, 1999). In education only about
19% of the estimated official fee (UPE) is collected. As a result, the supposedly
positive link between user charges and quality of services has not been firmly
established. Instead, many indicators of quality show deterioration in service
provision.
A number of reasons may account for the problems faced in implementing the cost
sharing policy. The first is that the policy may have failed to recognise that both
primary education and health are merit goods; individuals perceive less benefits than
those enjoyed by community. Thus individuals are not prepared to pay a high price.
This is especially the case when the benefits accrue to the second or distant person
(e.g. in primary education) or at a later stage (e.g. in preventive health services or
HIV/AIDS). In this case, the government has to intervene (subsidise) to correct for
Figure 9: Government expenditure on water
0
5
10
15
20
25
30
35
40
45
1995 1996 1997 1998 1999 2000
Per
cent
age
Government recurrent expenditure on social services ( %)
Recurrent expenditure on Water as a % of total government expenditure
Development expenditure on Water as a % of total government development expenditure

31
the effect of the differences in preferences. The second is the inefficiencies inherent
in public facilities. We have already discussed the issues related to leakage in public
funds. The second source of inefficiency arises from wrong prioritization and misuse
of user fees. A recent study has found that much of the revenue from user fees in
public facilities has been used to renovate buildings. This is different from mission
and private facilities which respond mostly on medicine (Mushi, 2000). The third
reason may be the high poverty levels prevailing in the country. In this case
households are unable to raise adequate income to pay for the services. However,
studies have also found that many people would be willing to pay more if the quality
of services improved (TADREG, 1997 and Fjelstad and Semboja, 1998).
It is difficult to associate the observed withdrawals from public services to any one of
the three reasons mentioned above. Yet we know that both primary education and
health care are basic human rights that all citizens have to access. Therefore the
government has limited choices to make. For basic human rights services such as
primary education and health care, it is practically useful to separate the incidence of
the burden of service costs from that of service accessibility. In the case of primary
education it would imply that the UPE fee is abolished and communities encouraged
to mobilize local efforts within nationally prescribed parameters that put the burden
on parents and communities rather than children. However, financing for the
provision of minimum education attainment would be the responsibility of the
government. In the case of basic health care, experience elsewhere shows that
provision can be made through insurance schemes.
Financial Projections for Raising Primary School Enrolment
Based on current enrolment ratios, there are 2,332,751 school-age-children out of
school. There are two options to absorb this back- load. The first is to enrol the out-
of-school children in COBET or similar programmes. The second is to run a long-
term programme of gradual enrolment for the out-of-school children. Whichever
option is adopted, all the children aged 7 years should be enrolled under the regular
primary school system. The financial implications for the first option are subject to
COBET unit costs. Therefore, this option is not discus sed further in the current
report. Table 4 provides the basic background information for the projections.
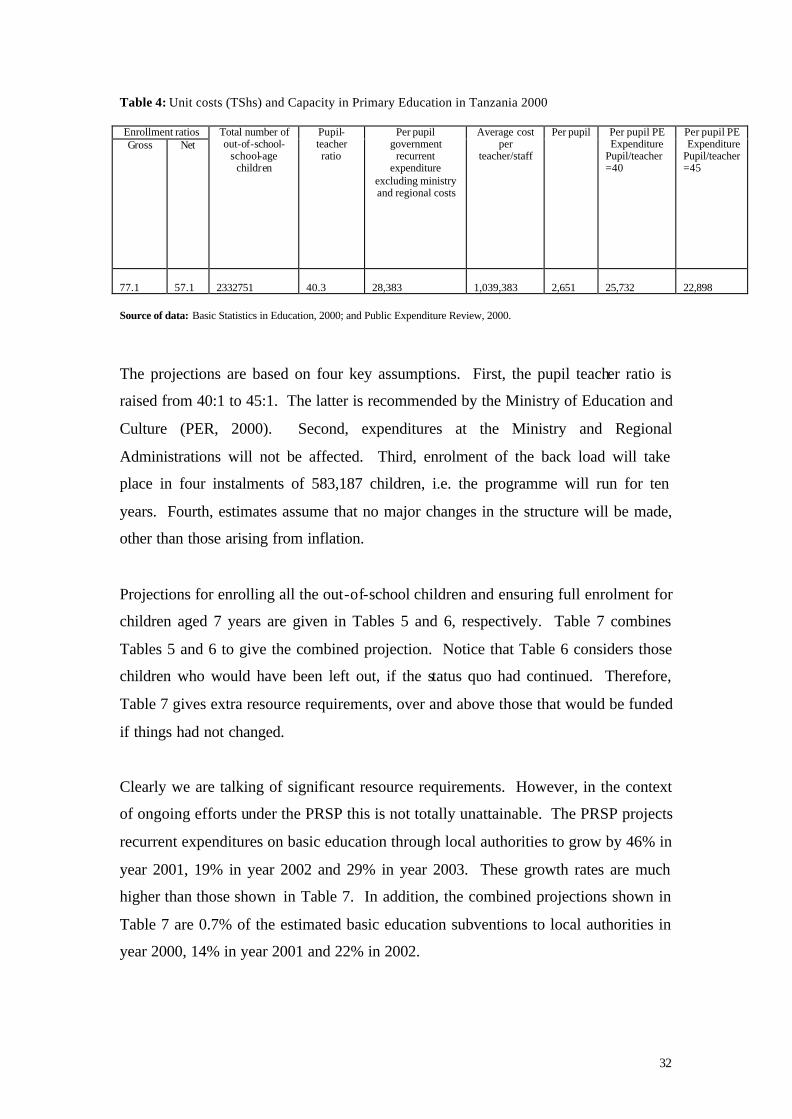
32
Table 4: Unit costs (TShs) and Capacity in Primary Education in Tanzania 2000 Enrollment ratios Gross Net
Total number of out-of-school-
school-age children
Pupil- teacher ratio
Per pupil government
recurrent expenditure
excluding ministry and regional costs
Average cost per
teacher/staff
Per pupil
Per pupil PE Expenditure
Pupil/teacher =40
Per pupil PE Expenditure Pupil/teacher =45
77.1
57.1
2332751
40.3
28,383
1,039,383
2,651
25,732
22,898
Source of data: Basic Statistics in Education, 2000; and Public Expenditure Review, 2000.
The projections are based on four key assumptions. First, the pupil teacher ratio is
raised from 40:1 to 45:1. The latter is recommended by the Ministry of Education and
Culture (PER, 2000). Second, expenditures at the Ministry and Regional
Administrations will not be affected. Third, enrolment of the back load will take
place in four instalments of 583,187 children, i.e. the programme will run for ten
years. Fourth, estimates assume that no major changes in the structure will be made,
other than those arising from inflation.
Projections for enrolling all the out-of-school children and ensuring full enrolment for
children aged 7 years are given in Tables 5 and 6, respectively. Table 7 combines
Tables 5 and 6 to give the combined projection. Notice that Table 6 considers those
children who would have been left out, if the status quo had continued. Therefore,
Table 7 gives extra resource requirements, over and above those that would be funded
if things had not changed.
Clearly we are talking of significant resource requirements. However, in the context
of ongoing efforts under the PRSP this is not totally unattainable. The PRSP projects
recurrent expenditures on basic education through local authorities to grow by 46% in
year 2001, 19% in year 2002 and 29% in year 2003. These growth rates are much
higher than those shown in Table 7. In addition, the combined projections shown in
Table 7 are 0.7% of the estimated basic education subventions to local authorities in
year 2000, 14% in year 2001 and 22% in 2002.
33
4.2.2 Institutional Environment
The institutional environment for promoting children’s rights is build around legal
provisions, government regulations and directions and culture. Government policy
provides for free MCH services to reduce mortality and, recent HIV/AIDS
programmes have also targeted mothers and children.
The area of children’s development has also received government attention.
Universal primary education is compulsory. There are regulations that prohibit
schools to expel children whose parents fail to pay fees and there are provisions to
prosecute parents who fail to enrol their children for primary education and those who
cause pupils to drop out of school (especially due to pregnancy). Free MCH services
are also aimed at enhancing children’s development through appropriate child
spacing, immunisation against diseases, better nutrition and feeding practices. The
more recent abolition of female genital mutilation has provided an extra handle for
enhancing children’s development.
Some components of children’s security have received more attention in recent years.
A recent Act of Parliament on sex offences did not only clarify and publisize the
issues, but it also raised penalty on the offenders. However, new developments that
have led to increased street children, children headed households and child labour
have yet to receive adequate attention.
The important issue of children’s participation is basically a new concept. No serious
attempts have been made to develop rules for enhancing children’s participation. The
proposed amendments of the Children’s Policy have provided room for discussion in
this direction.
But what matters is effectiveness of these provisions rather than their existence. At
least two factors have worked against these provisions. The first is government’s
capacity to enforce them and the second is cultural practices. Many legal provisions
and government regulations are not enforced because of the limited capacities and low
willingness of the police and the judiciary. These weaknesses are exacerbated when

34
the public is dissatisfied by particular public services and works to withdraw from it.
For example, very few parents are reported to the police and even fewer are
prosecuted for failing to enrol their children; yet only about half of the children are
enrolled at the appropriate age. People may not report because, after all the quality of
education is unsatisfactory or because reported cases are not likely to be adequately
attended by the police and judiciary.
Cultural factors have also worked to reduce effectiveness of legal provisions and
government regulations. In response to government’s abolition of female genital
mutilation, some societies have chosen to undertake it more secretly.
The Role of Local Governance
Institutional arrangements and environments have to be developed, managed,
regulated and overseen. This is the role of local government. Within specified
national standards, local authorities are responsible for managing and regulating
capacity expansion and utilization of the relevant service provision facilities in their
areas of jurisdiction. Ongoing local government reforms are aimed at more powers to
local authorities to facilitate service provision at lower levels. Through enhanced
democratic rights local authorities should decide on their local priorities. This will
also facilitate local resource mobilization, accountability and transparency. The logic
behind the local government reforms is that devolution will filter down to the ward,
village, kitongoji/mtaa and eventually to the service unit levels. At all these levels
decisions on priorities and resource allocation will be made to reflect specific local
requirements. Thus, for example, school committees will be responsible for
overseeing capacity expansion and utilization of the school, within the prescribed
national requirements. Only this committee can determine ability of a particular
parent to participate in resource mobilization efforts and determine the level of
exemption to be granted to assure continuity of children education. This should be
the case for all basic services under the management of local authorities.
However, the effectiveness of local authorities will depend on its legitimacy to its
residents. And for local authorities, service provision determines their legitimacy,
implying that they must have adequate capacity and willingness to manage and
regulate the basic services. Currently this important background requirement leaves a
35
lot to be desired. Firstly, important control departments (e.g. audit) are completely
absent or severely understaffed. Secondly, loyalty of some key staff is outside the
local authorities since they are not appointed by them. Thirdly, key decisions are still
centralised (e.g. decisions of school committees may not be final). Fourthly, is the
existence of parallel institutional structures through mainly donor-funded
projects/programmes that lead to duplication of efforts and withdrawal of key staff
from local authorities core activities.
Some of these issues are currently being addressed by the local government reform
programme. Although it is too early to predict the outcome of these reforms an
important concern may be raised relating to its methodology. The local government
reform is being undertaken at the same time as the decentralised ministries are
undertaking theirs. There are concerns, about coordination between sectoral and local
government reforms, which if not adequately addressed may not address the above
issues. For example, sector ministries may still wish to retain parallel institutions,
weak school committees and health boards, etc.
4.3 Underlying Causes
The underlying causes provide the basis on which decisions for priorities and resource
allocation are undertaken. As stated earlier on, they can be grouped into three,
namely social-cultural, political-governance and economic.
4.3.1 Social-cultural Causes
Social cultural factors may facilitate or constrain implementation of the framework of
the convention of the rights of children (CRC) and the elimination of all forms of
discrimination against women (EDAW). The positive elements of social-cultural
factors include existence of social capital and the traditional social security systems.
And the negative aspects include gender bias against women.
Community activities have been popular in the past. The Nationalist Party TANU,
and later the independence government utilised social capital to construct roads,
schools, dispensaries and similar infrastructural facilities that were public in nature or

36
too expensive for individuals to undertake. After completion, these public
programmes were also placed under local authorities or cooperative societies for their
management and regulation. As it were, service provision was the responsibility of
communities under the management and regulation of local authorities.
In addition to community activities that promoted basic service provision an effective
traditional social security system was also in place. Systems and procedures on how
to deal with vulnerable groups such as orphans, widows, the very old, the sick, etc.
were clearly known.
The outcomes of both aspects of social capital worked to promote the rights of
children. However, in recent years we observe an apparent declining role of social
capital in investment and operations and maintenance of basic economic and social
infrastructure, as well as the traditional social security system. This is happening at
the same time as government capacity to finance basic services has declined and the
level of vulnerability of social groups has increased substantially. The need for
renewed community efforts in promoting basic service provision and social security
can not be underestimated.
But culture also had its negative side of the coin. In many societies women were
made to be instruments of production and reproduction. As such a girl-child received
different treatment from a boy-child. The latter received all the rights to basic
economic and social services. The former only to a limited extent, to enable her to
perform her production and reproduction duties.
Recent efforts by both national and international agencies have produced positive
results, both in the mentality and behaviour of people (including men) and legal
provisions. These changes can be seen in women’s active participation in education,
leadership, etc. It is important to acknowledge/appreciate these positive
developments and take advantage of them as we pursue for further changes.
37
4.3.2 Political -governance Causes
There is a strong relationship between social-cultural and political-governance. At the
time of independence the former shaped the latter. Social-cultural factors determined
the political agenda and the institutional framework for implementing it. However,
major changes occurred starting 1965; political capital determined social capital. The
institutional framework for the development of social capital was determined at the
political level. As a result local institutions of governance were adjusted to suit
political interests. Local government was abolished in 1972 and replaced by central
government agencies. Cooperatives were abolished in 1975 and replaced by
marketing boards/authorities, non-governmental organisations were re-defined to suit
political interests, communities were re-defined, etc.
The basis of these changes was the Arusha Declaration that promoted public sector
development and equal access of basic services. The latter could be guaranteed under
free provision. Therefore, both positive and negative consequences were recorded. In
the former, significant capacity expansions were recorded in primary education, basic
health and rural water. And significant achievements were recorded in the
manifestation indicators such as literacy, mortality, etc. The negative consequences
included breakdown of the participatory and democratic systems, macroeconomic
imbalances and declining economic growth.
Significant changes have taken place since mid-1980s, all aimed at addressing the
weaknesses mentioned above. Continued efforts have been made to restructure the
sub-national administrative system by re- introducing and strengthening the local
government system, the political system by introducing and strengthening multi-party
politics, the economic system through the promotion of private sector development
and markets. Within the context of these reforms cost sharing in the basic services
has been made part of the rules of the game.
It may be too early to determine the effect of these changes (on service provision),
which in many areas are still ongoing. Nevertheless, a few observations that have
already been discussed in earlier sections can be made. Firstly, a significant number
of people are not paying the prescribed fees. This is especially the case in more

38
discretionary areas such as education where only about 19% of the estimated
contributions are collected. Secondly, the level of participation has not been good.
School enrolments have suffered in recent years. A recent study involving 675
households and 1341 children in six rural districts and one urban authority found that
15% of all sick children were not sent for medical consultation in 1998/99. The
percentages for infants and under-five were 12.5% and 15.3%. Requirements for fees
may have forced parents to look for other alternatives, although other reasons may
have featured in the decision making. Thirdly, a few cases of good practices suggests
that people’s willingness to pay for services is driven by the link between payment
and service provision. Therefore, in addition to ability, issues of accountability are
key in voluntary compliance. Therefore, community participation is central to cost
sharing.
4.3.3 Economic Causes
The economic causes are strongly linked to social-cultural and political-governance
issues. Participatory studies have shown that asset ownership are key in determining
poverty and inequality levels between gender. In this context asset as defined to
include access to land, improved human capabilities and access to markets. Studies
have shown that farming per se does not provide a viable avenue for escaping
poverty. Rather it is the capabilities and opportunities for increased productivity that
matter. As such, access to education, health and markets are key complements to
land. The ongoing land reforms need to be complemented with other reforms.
The gender disparity between primary school boys and girls has basically closed. The
gap is closing fast at the secondary school level. However, there are significant
performance differences between secondary school boys and girls, in favour of boys.
This has serious consequences on the opportunities for future earnings between the
two.
Girls are at higher risk of being infected with HIV/AIDS than boys and at younger
age. In other words they experience limited choices of survival and development than
boys. In addition to biological factors, social cultural and weakened institutional
frameworks for personal security increase their vulnerability.
39
Studies have shown that women, who participate in the informal sector especially in
trading, have managed to escape poverty more easily. This underscores the
importance of access to markets as reflected in many PPA studies. Yet agricultural
marketing has been the monopoly of men, even when women had produced the
output.
5. Summary of Conclusions
Below we provide the main conclusions that arise from the situation analysis. They
are organised around the three levels as described in the framework of analysis. They
are the manifestations that we observe on the children, the immediate and underlying
causes for the manifestations.
The first conclusion is that most of the targets on children’s survival and development
will not be achieved. In fact many variables have deteriorated in the recent past. The
exceptions include immunization that may be achieved if serious campaigns are
undertaken and gender equality in primary education that has already been achieved.
However, it is noted that a new form of gender inequality in education relates to
differences in the performance between boys and girls, in favour of boys. There is
need to address this new form of inequality.
The second conclusion is that the poor performance observed in many of the variables
for children’s survival and development can be linked to a weak institutional
framework for supporting the basic services. Both the institutional arrangement that
includes economic, social and legal infrastructure (such as schools, dispensaries,
courts, trained and motivated teachers, nurses, magistrates, etc.) and the institutional
environment that covers the rules of the game for production, exchange and
distribution have not been adequately developed. As a result, many basic facilities are
either absent or have limited capacity (e.g. classrooms, toilets, dispensaries, patient
beds, etc.) and operation and maintenance of existing facilities has been inadequate
(e.g. books, drugs, cleanliness, etc.).

40
Inadequacies in the capacity and operation and maintenance of facilities are a
manifestation of under-funding and misuse of resources. Although the government
ratified the CRC in 1991, it is not until 1995 that discretionary efforts are made to
implement the CRC by prioritising the social sector, financially. And even then
allocations to basic education fell below inflation rates until 1998, implying that the
real allocations fell. In addition, most of the budget increase went to finance personal
emoluments, leaving very little to other charges. In health where the other charges
were better funded than in education, decisions to spend were highly centralised.
Furthermore, a significant part of the OC allocated to councils is not used for the
purpose intended.
The recent introduction of user charges can not be considered to be responsible for
improvements in service provision, if any. First of all, compliance is very low, 19%
in primary education. Secondly, many studies have concluded that service
accessibility has deteriorated as a result; although some studies have also shown that
people are willing to pay if the services improved. Based on the criteria of merit
goods and human rights, it makes sense to separate the incidence of the burden of
service costs from that of service accessibility by replacing centrally determined fees
with community determined contributions and insurance schemes.
The third conclusion is that the role of communities in the management of service
facilities has to be enhanced. This is obvious from the significant financial
responsibility of communities; in addition to promoting efficiency in the use of
resources. The role of local government in promoting community participation is
central here. The ongoing local government reform is a move in the right direction.
However, only if the reforms are driven by communities can there be assurance that
their interests are accommodated.
The fourth conclusion is a fact. That we have dealt more on the manifestations and
immediate causes of children’s survival and development; much less on the
manifestations and immediate causes of children’s protection and participation and;
even much less on the underlying causes in general. This apparent bias may have
been driven by the orientation of the main authors that tend to prefer quantitative data
and information which are virtually absent on children’s protection and participation.

41
Indeed for both protection and participation even the agreed indicators are absent.
Yet in order to assess developments on the two children’s rights, we need agreed
indicators (whether quantitative or qualitative) and baseline data. Therefore, there is
an urgent need to work on agreed indicators and a baseline survey for future
assessment of the two rights for the children.

42
Table 5: Financial implication of eliminating the out -of-school-school age children in four years
Year 2001 2002 2003 2004 2005 2006 2007 2008 2009 2010
No .of pupils in school
from the back -load
583187
1166374
1749561
2332748
2332748
2332748
2332748
1749561
1166374
583187
Effective No.of Pupils
to pay for PE (Adjusted
with pupil-teacher ratio)
64532 647719 1230906 1814093 1814093 1814093 1814093 1230906 647719 64532
PE cost 1477653736 14831469662 28185285588 41539101514 41539101514 41539101514 41539101514 28185285588 14831469662 1477653736
Effective no. of pupils
to pay for OC
583187 1166374 1749561 2332748 2332748 2332748 2332748 1749561 1166374 583187
OC cost 1546028737 3092057474 4638086211 6184114948 6184114948 6184114948 6184114948 4638086211 3092057474 1546028737
Total cost 3023682473 17923527136 32823371799 47723216462 47723216462 47723216462 47723216462 32823371799 17923527136 3023682473
Total cost adjusted with
6% constant inflation.
3205103421 20074350392 38731578723 59176788413 62040181401 64903574388 67766967376 48578590263 27602231789 4837891957
Annual growth rate 526.32 92.94 52.79 4.84 4.62 4.41 -28.32 -43.18 -82.47
Adjusted costs as a %
of the 2000 education
budget
2.70 16.88 32.57 49.76 52.17 54.58 56.98 40.85 23.21 4.07
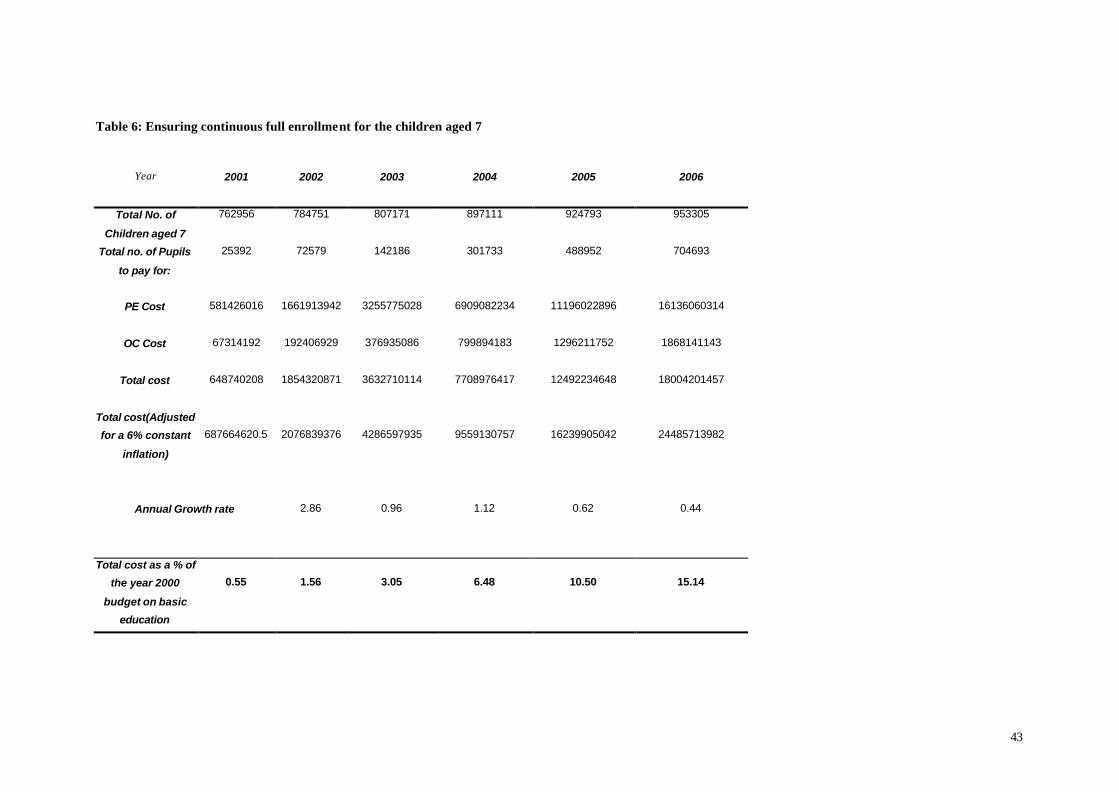
43
Table 6: Ensuring continuous full enrollment for the children aged 7
Year 2001
2002 2003 2004 2005 2006
Total No. of
Children aged 7
762956 784751 807171 897111 924793 953305
Total no. of Pupils
to pay for:
25392 72579 142186 301733 488952 704693
PE Cost
581426016
1661913942
3255775028
6909082234
11196022896
16136060314
OC Cost
67314192
192406929
376935086
799894183
1296211752
1868141143
Total cost
648740208
1854320871
3632710114
7708976417
12492234648
18004201457
Total cost(Adjusted
for a 6% constant
inflation)
687664620.5
2076839376
4286597935
9559130757
16239905042
24485713982
Annual Growth rate
2.86 0.96 1.12 0.62 0.44
Total cost as a % of
the year 2000
budget on basic
education
0.55
1.56
3.05
6.48
10.50
15.14

44
Table 7: Projected % increase in Government spending to attain full enrollment in four years
Year 2001 2002 2003 2004 2005 2006
Grand Total for ensuring full enrolment after four years
892768042
22151189768.00
43018176658.00
68735919170.00
78280086443.00
89389288370.00
% Change in the year 2000 Budget for basic education
3.27
18.63
36.17
57.80
65.82
75.17

45
References Bank of Tanzania (1999), Economic Bulletin for the Quarter ended 30th June. Cooksey, B., M. Mmuya and F. Wamara (1997), “A Baseline Service Delivery Schooling in Rural Tanzania”, TADREG Working Paper Series 7. Galabawa, J.C. (2000), Impact Assessment of School Mapping in Six Districts (Kisarawe, Musoma, Serengeti, Magu and Morogoro Urban). A Report Prepared for UNICEF, Dar es Salaam Graham Eele, Joseph Semboja, Servacius Likwelile, Longinus Rutasitara, and Stephen Akroyd, (1999), “Meeting the International Development Targets in Tanzania”. Oxford Policy Management and Research on Poverty Alleviation. Hongoro, C. and Chandiwana, S. (1994), The effects of Enforcement of User Fees on the Health Care Delivery System in Zimbabwe. A study financed by UNICEF Harare. Harare Blair Research Laboratory and Ministry of health and Child Welfare. Kamuzora, P. and Mhamba, R. (1998), “Health Services Provision at Local Level in the Context of Health Sector Reform in Tanzania” A research report submitted to the Joint Research Committee, ENRECA, University of Dar es Salaam. Katunzi, N.B., F.B. Mukyanuzi and J.R. Barongo (1997), School Mapping in Kisarawe District. Lugalla, J.L.P. and V. Barongo (2000), Rural Based Street Orphaned Children of Ileje District. Report Prepared for UNICEF, Dar es Salaam Mbelle A. V. Y., and Kilindo, A. (1998), “Prospects for Implementation of the 20/20 Initiative on Budge t and Aid Restructuring in favour of Basic Social Services In Mainland Tanzania”. A Report submitted to UNICEF and UNDP, Dar es Salaam Tanzania. Mushi Deograsias, P. (1996), “Cost Sharing in Health Services in Tanzania: Preliminary Impact on Quality, Affordability, and Accessibility. A case Study of Selected Regions”. Research Report submitted to CDR- Copenhagen and the Economic Research Bureau, University of Dar es Salaam. Mushi Deograsias, P. (2000), Demand and Welfare in Health Care: Effects of Asymmetric Information and User Charges. A Dphil. Thesis submitted to the University of Oxford in partial fulfillment of the degree of Doctor of Philosophy. National Bureau of Statistics (2000), Tanzania Reproductive and Child Health Survey 1999 Preliminary Report. National Bureau of Statistics and Macro International Inc. February. Fjelstad, Odd-Helge and Joseph Semboja (1998), “Why People Pay Taxes: The Case of the Development Levy in Tanzania". CMI Working paper no. 1998.5.
46
Sumra, Suleman & Ennew, Judith (1999), Children in need of special protection measures: A Tanzania study. Unicef Tanzania Education Database Version1.2, UNICEF. Thematic working Group (1999), Report on the Rights of the Young Child (0-6). June. Unicef. UNICEF ( ), National Study on Children in Need of Special Protection United Republic of Tanzania (URT) (1999), Health Statistical Abstract 1999 Vol.1, Morbidity and Mortality Statistics URT (1998). The National Poverty Eradication Strategy, Dar es Salaam, Government Printer URT (1999), Basic Statistic in Education 1998. Regional Data, Dar es Salaam, Ministry of Education and Culture. URT (1999), Health Statistic Abrastract . Vol 1 and 2, Dar es Salaam, Ministry of Health. URT (2000), Mwongozi (Framework) wa Kitaifa Kuhusu Utekelezaji wa Sera ya Maendeleo ya Mtoto Tanzania, Dar es Salaam, Government Printer URT (2000), Workshop Reports, Karimjee Hall, Dar es Salaam May 2-3. URT (1996), Monitoring Progress Towards the Goals of the World Summit for Children, Through Multiple Indicator Cluster Survey. NBS in collaboration with UNICEF. URT and Unicef (1999), Mid-term Review of Government of Tanzania/Unicef Country Programme, 1997-2001.Unicef URT, (1998), Basic Statistics in Education, 1994 – 1998, National Data, Dar es Salaam, Ministry of Education and Culture. URT, (1998), Basic Statistics in Education, Regional Data, Dar es Salaam, Ministry of Education and Culture. URT, (1999), The Economic Survey 1998. Dar es Salaam, Government Printer. URT, (2000), Basic Statistics in Education, 1995 – 1999, National Data, Dar es Salaam, Ministry of Education and Culture. URT, (2000), Sera ya Maendeleo ya Mtoto Tanzania Iliyodurusiwa, Dar es Salaam, Government Printer
47
URT, (2000), The Economic Survey 1999. Dar es Salaam, Government Printer. World Bank (1999), Macroeconomic 2, Africa Region, “Public Expenditure Review”, Main Report volume 1. World Bank (1999), Tanzania Social Sector Review. The World Bank.