Embed Size (px)
Citation preview

The significance of proficient grant writing –towards evidence-based support
Anders FribergStefan Forsaeus Nilsson
Grants Office, Chalmers University of Technology
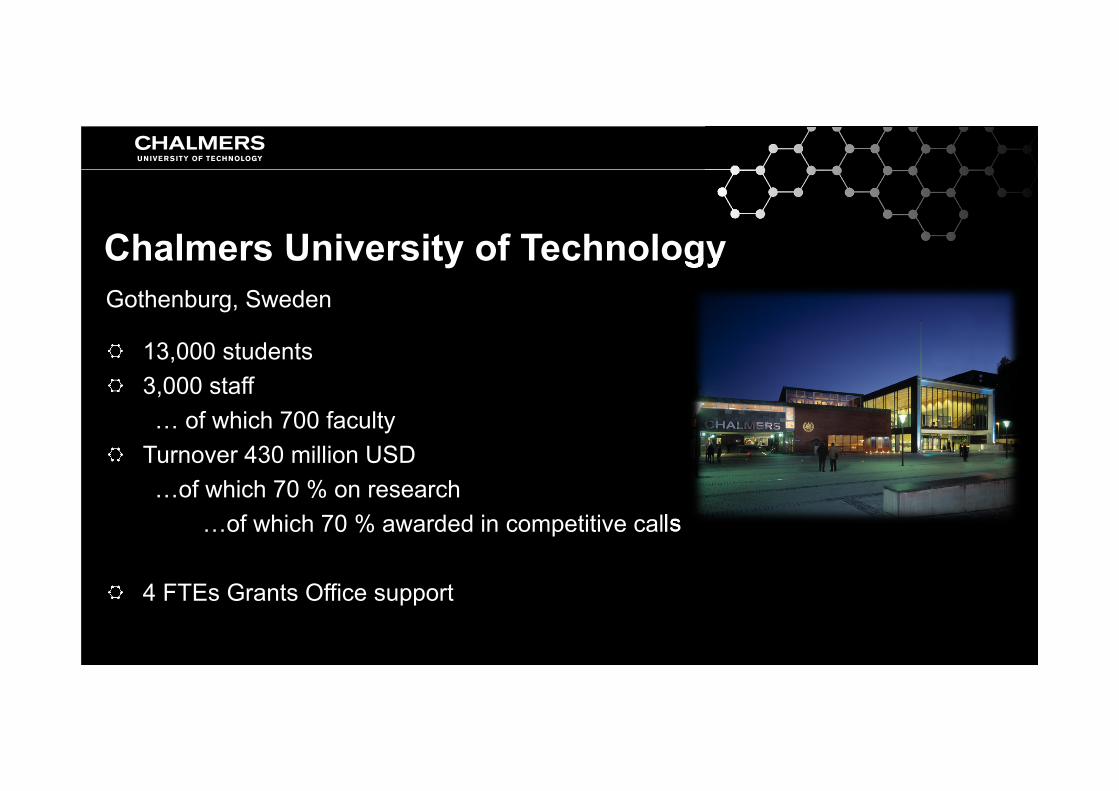
13,000 students3,000 staff… of which 700 faculty
Turnover 430 million USD…of which 70 % on research
…of which 70 % awarded in competitive calls
4 FTEs Grants Office support
Chalmers University of TechnologyGothenburg, Sweden
Is proficient proposal writing important for funding success?
Additional question:
Can a research advisor estimate a proposal’s chances for funding, regardlessof research topic?

Are we doing the right things, and are wedoing them right?
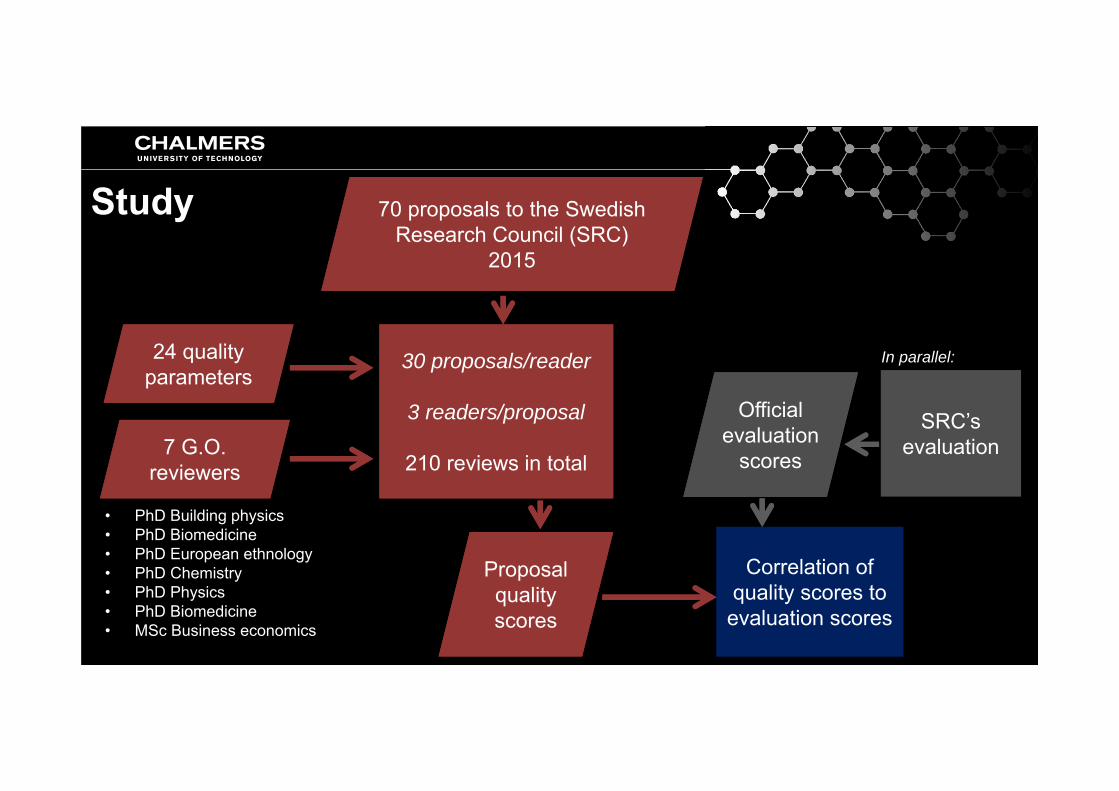
Study
• PhD Building physics• PhD Biomedicine• PhD European ethnology• PhD Chemistry• PhD Physics• PhD Biomedicine• MSc Business economics
70 proposals to the Swedish Research Council (SRC)
2015
70 proposals to the Swedish Research Council (SRC)
2015
24 qualityparameters24 quality
parameters
7 G.O. reviewers
7 G.O. reviewers
30 proposals/reader
3 readers/proposal
210 reviews in total
30 proposals/reader
3 readers/proposal
210 reviews in total
Officialevaluation
scores
Officialevaluation
scores
SRC’sevaluation
SRC’sevaluation
Proposalqualityscores
Proposalqualityscores
Correlation ofquality scores to
evaluation scores
Correlation ofquality scores to
evaluation scores
In parallel:
Results and analysis

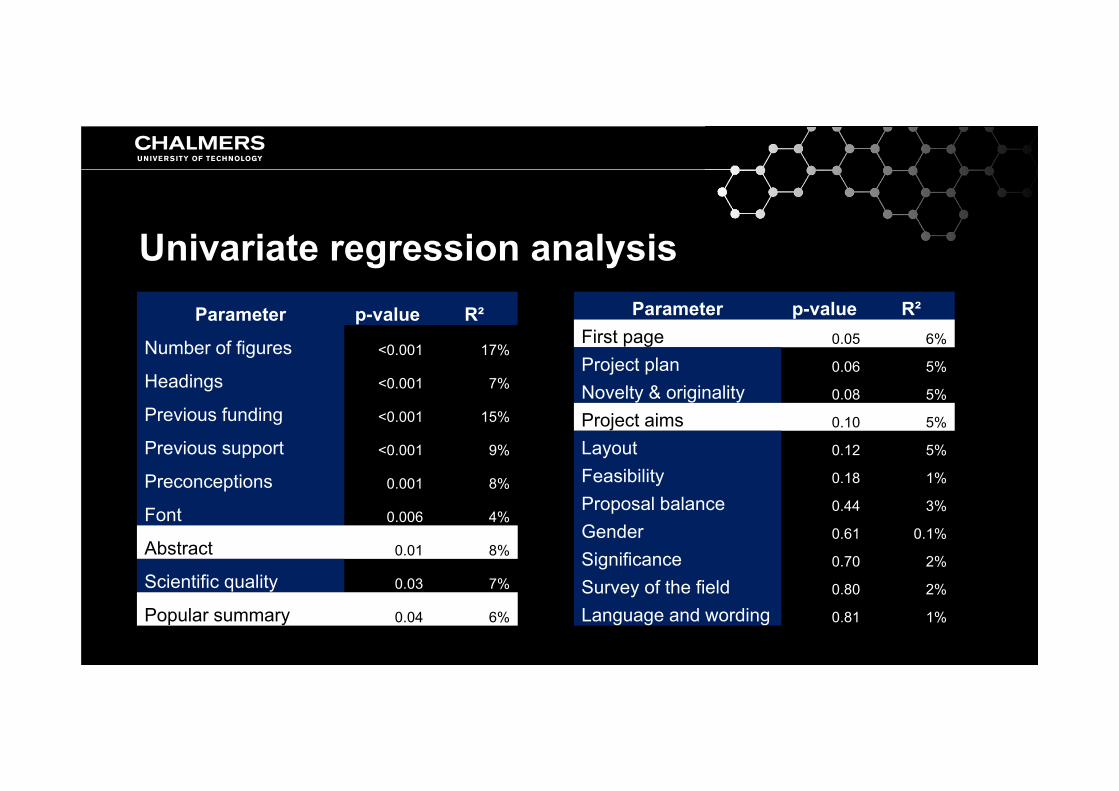
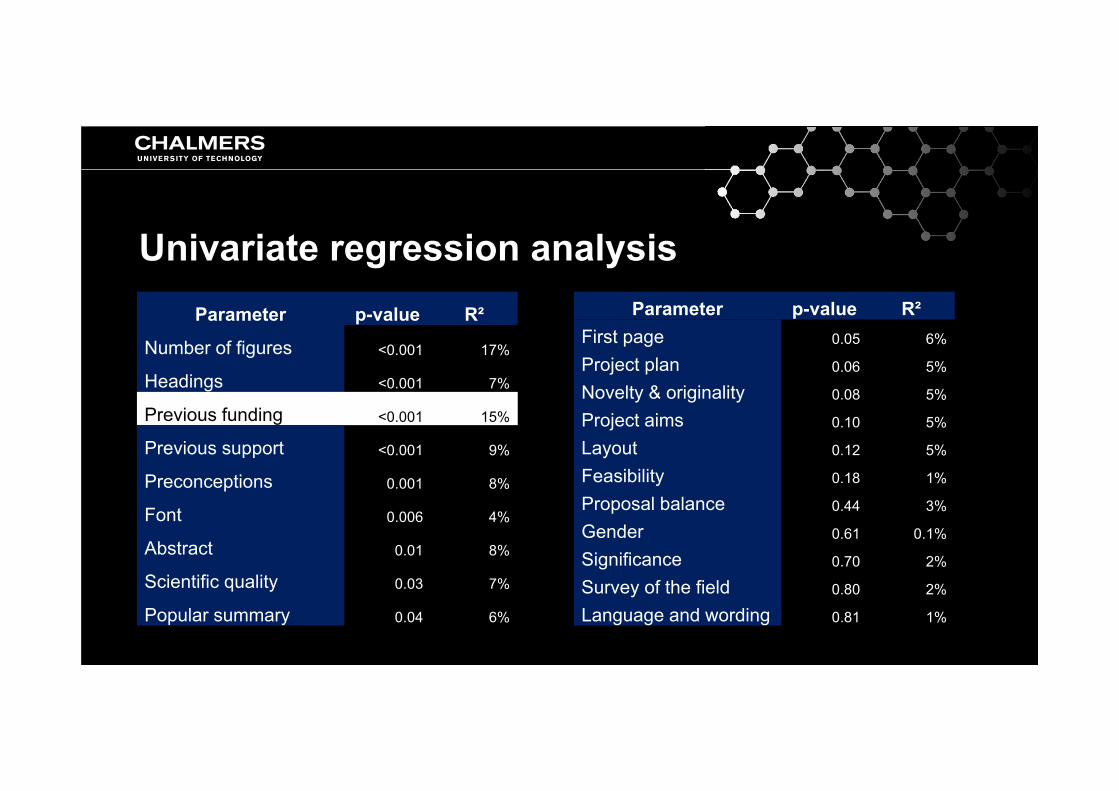
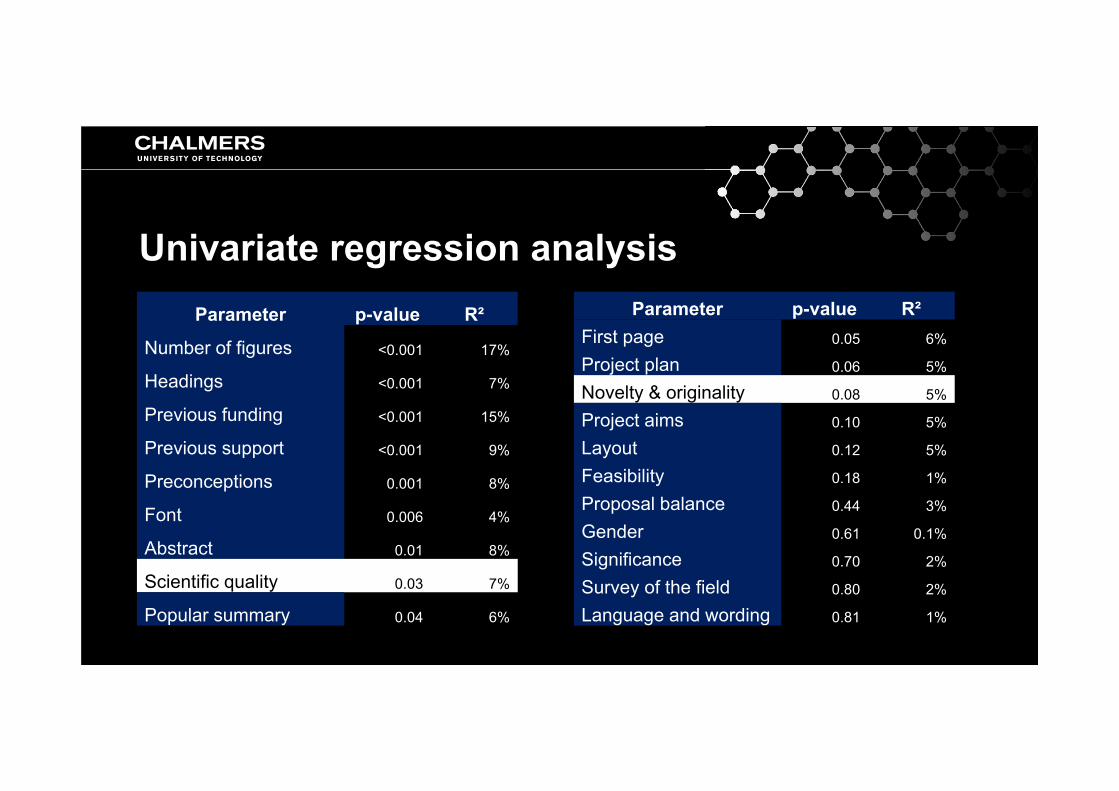
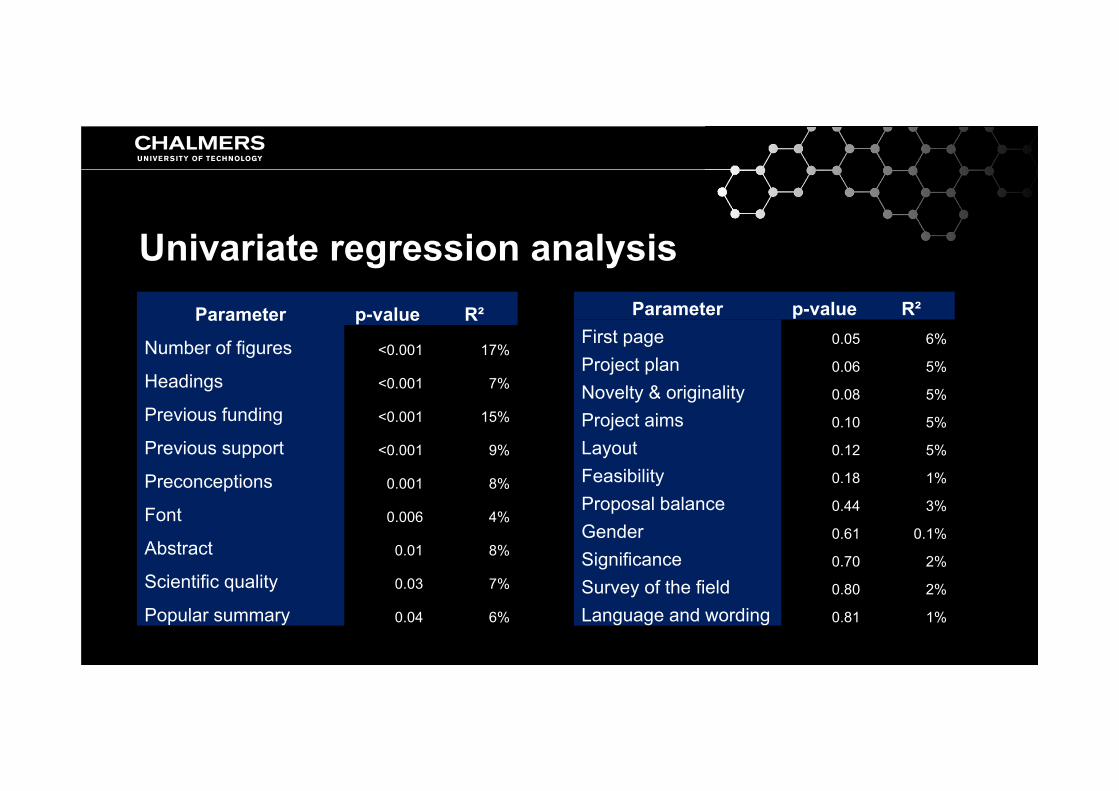
Univariate regression analysisParameter p-value R²
Number of figures <0.001 17%
Headings <0.001 7%
Previous funding <0.001 15%
Previous support <0.001 9%
Preconceptions 0.001 8%
Font 0.006 4%
Abstract 0.01 8%
Scientific quality 0.03 7%
Popular summary 0.04 6%
Parameter p-value R²First page 0.05 6%
Project plan 0.06 5%
Novelty & originality 0.08 5%
Project aims 0.10 5%
Layout 0.12 5%
Feasibility 0.18 1%
Proposal balance 0.44 3%
Gender 0.61 0.1%
Significance 0.70 2%
Survey of the field 0.80 2%
Language and wording 0.81 1%
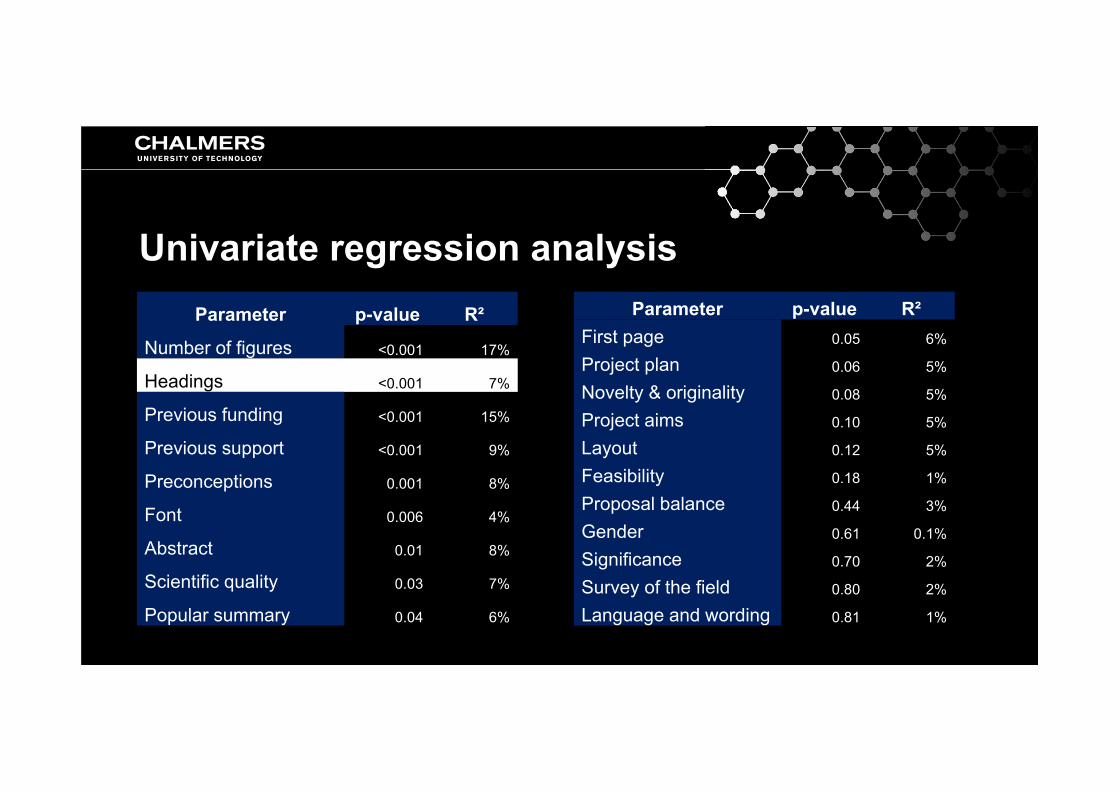
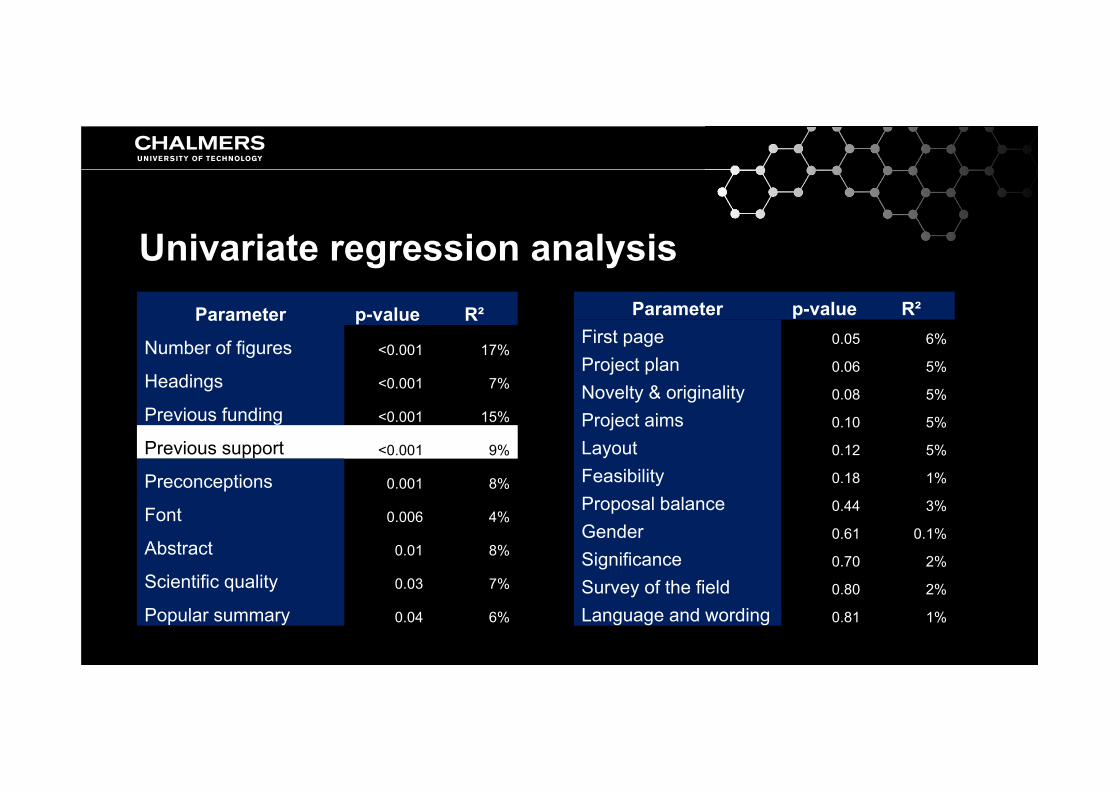
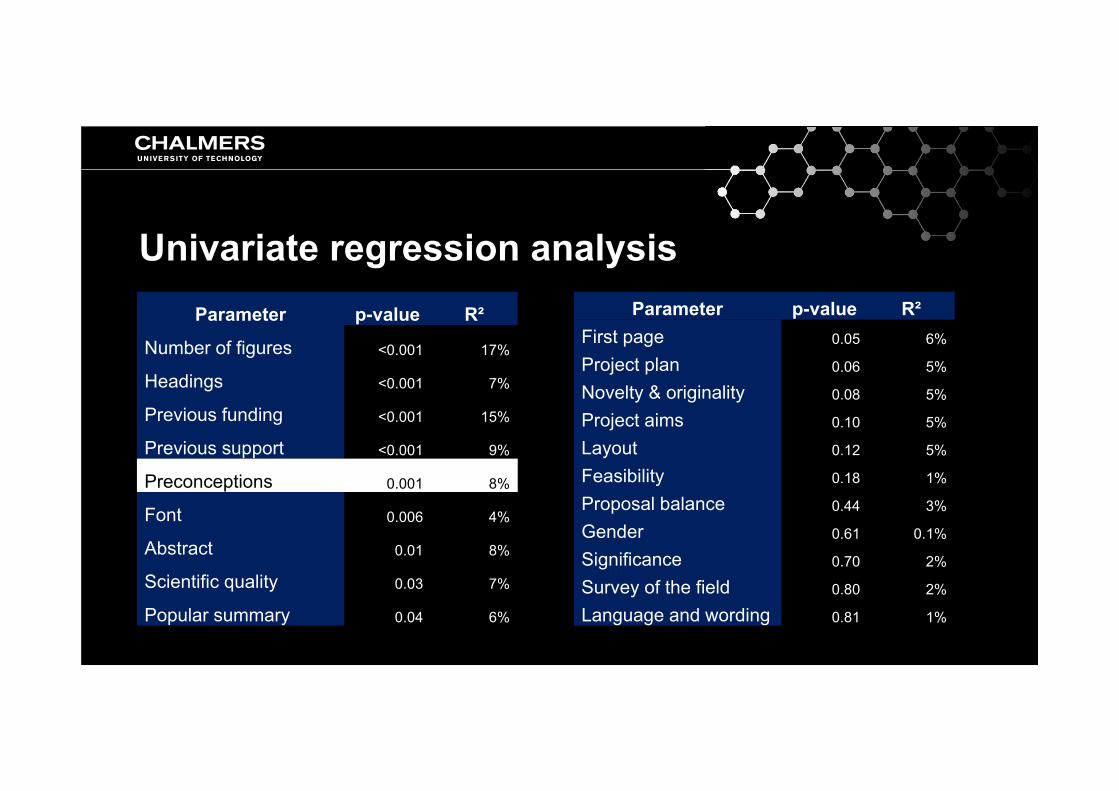
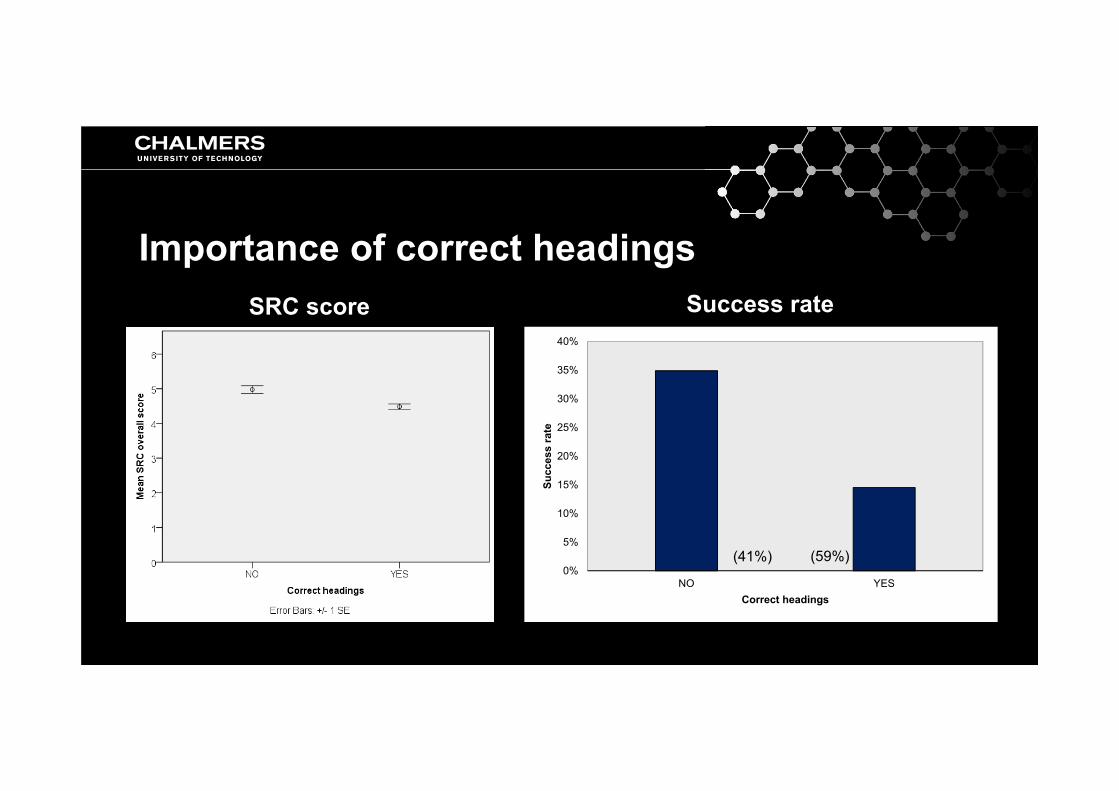
Importance of correct headings
0%
5%
10%
15%
20%
25%
30%
35%
40%
NO YES
Succ
ess
rate
Correct headings
(41%) (59%)
SRC score Success rate
Univariate regression analysisParameter p-value R²
Number of figures <0.001 17%
Headings <0.001 7%
Previous funding <0.001 15%
Previous support <0.001 9%
Preconceptions 0.001 8%
Font 0.006 4%
Abstract 0.01 8%
Scientific quality 0.03 7%
Popular summary 0.04 6%
Parameter p-value R²First page 0.05 6%
Project plan 0.06 5%
Novelty & originality 0.08 5%
Project aims 0.10 5%
Layout 0.12 5%
Feasibility 0.18 1%
Proposal balance 0.44 3%
Gender 0.61 0.1%
Significance 0.70 2%
Survey of the field 0.80 2%
Language and wording 0.81 1%

Importance of previous grant from funder
0%
10%
20%
30%
40%
50%
60%
NO YES
Succ
ess
rate
Previous funding
(80%) (20%)
SRC score Success rate
Univariate regression analysisParameter p-value R²
Number of figures <0.001 17%
Headings <0.001 7%
Previous funding <0.001 15%
Previous support <0.001 9%
Preconceptions 0.001 8%
Font 0.006 4%
Abstract 0.01 8%
Scientific quality 0.03 7%
Popular summary 0.04 6%
Parameter p-value R²First page 0.05 6%
Project plan 0.06 5%
Novelty & originality 0.08 5%
Project aims 0.10 5%
Layout 0.12 5%
Feasibility 0.18 1%
Proposal balance 0.44 3%
Gender 0.61 0.1%
Significance 0.70 2%
Survey of the field 0.80 2%
Language and wording 0.81 1%
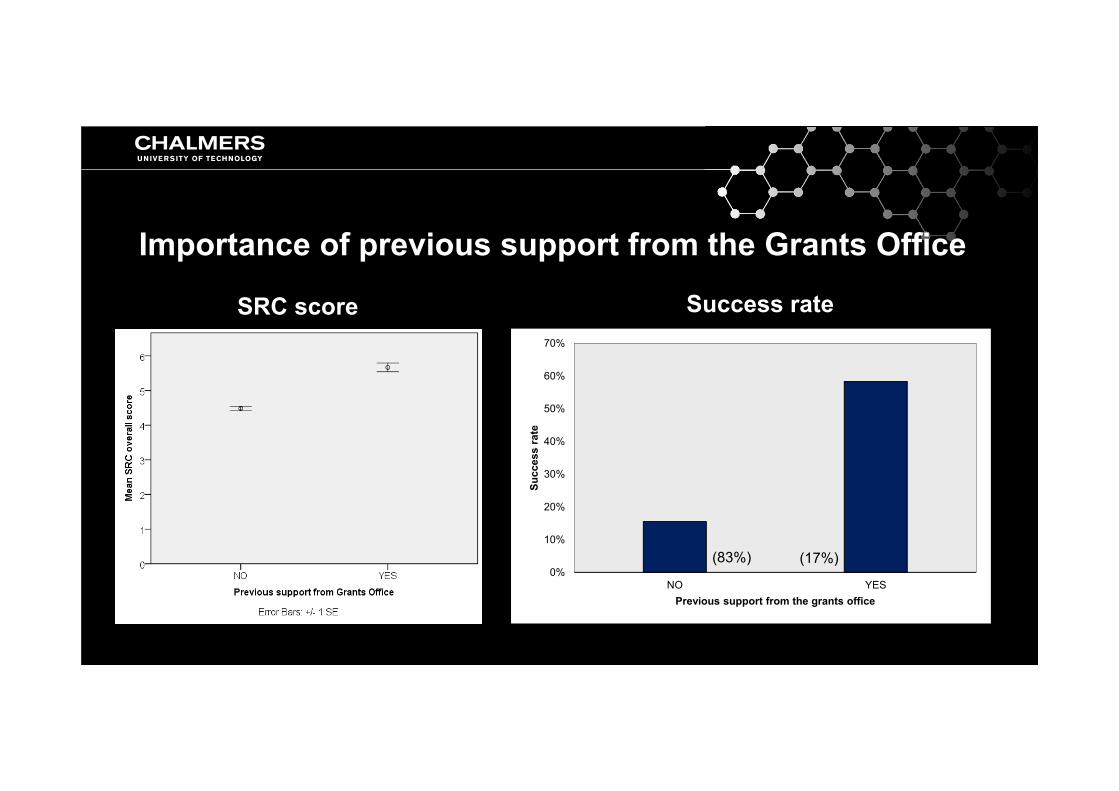
Importance of previous support from the Grants Office
0%
10%
20%
30%
40%
50%
60%
70%
NO YES
Succ
ess
rate
Previous support from the grants office
(17%)(83%)
SRC score Success rate
Univariate regression analysisParameter p-value R²
Number of figures <0.001 17%
Headings <0.001 7%
Previous funding <0.001 15%
Previous support <0.001 9%
Preconceptions 0.001 8%
Font 0.006 4%
Abstract 0.01 8%
Scientific quality 0.03 7%
Popular summary 0.04 6%
Parameter p-value R²First page 0.05 6%
Project plan 0.06 5%
Novelty & originality 0.08 5%
Project aims 0.10 5%
Layout 0.12 5%
Feasibility 0.18 1%
Proposal balance 0.44 3%
Gender 0.61 0.1%
Significance 0.70 2%
Survey of the field 0.80 2%
Language and wording 0.81 1%
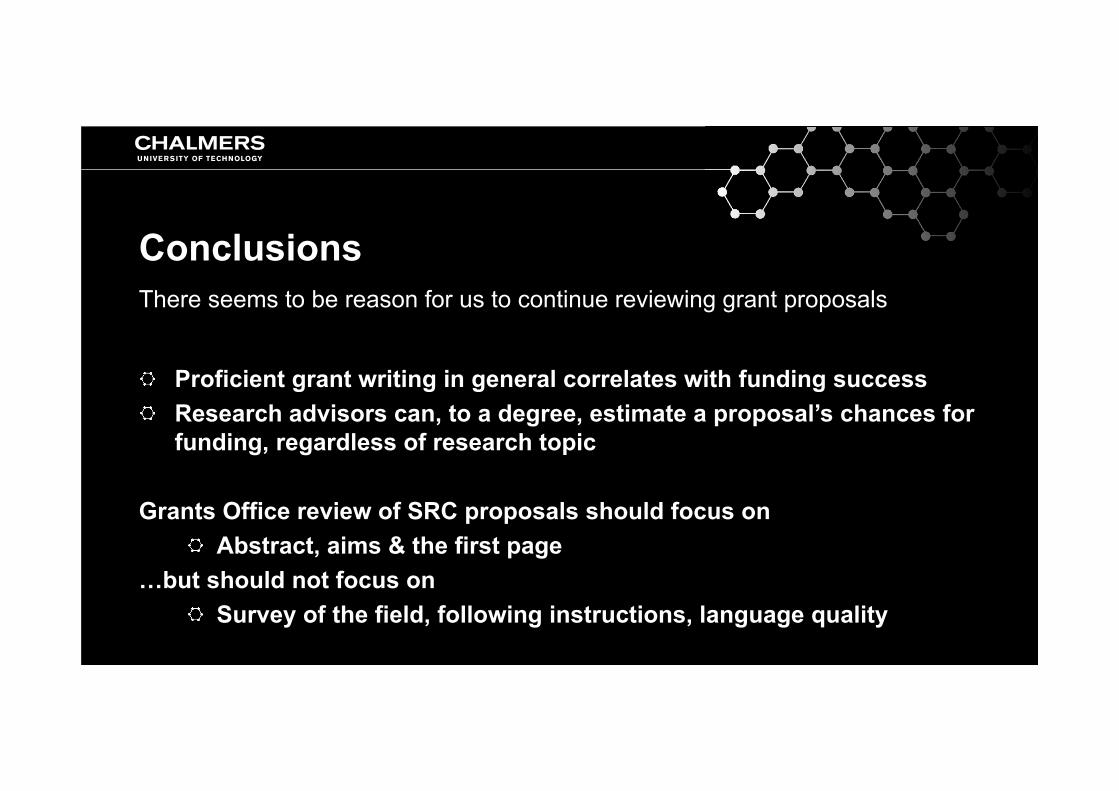
Proficient grant writing in general correlates with funding successResearch advisors can, to a degree, estimate a proposal’s chances for funding, regardless of research topic
Grants Office review of SRC proposals should focus onAbstract, aims & the first page
…but should not focus onSurvey of the field, following instructions, language quality
ConclusionsThere seems to be reason for us to continue reviewing grant proposals
Peter Eriksson
Silvia Dürmeier
Maggie Wallquist
Barbara Sturn
Karolina Partheen
Lana Hallengren
Acknowledgements

[email protected]@chalmers.se
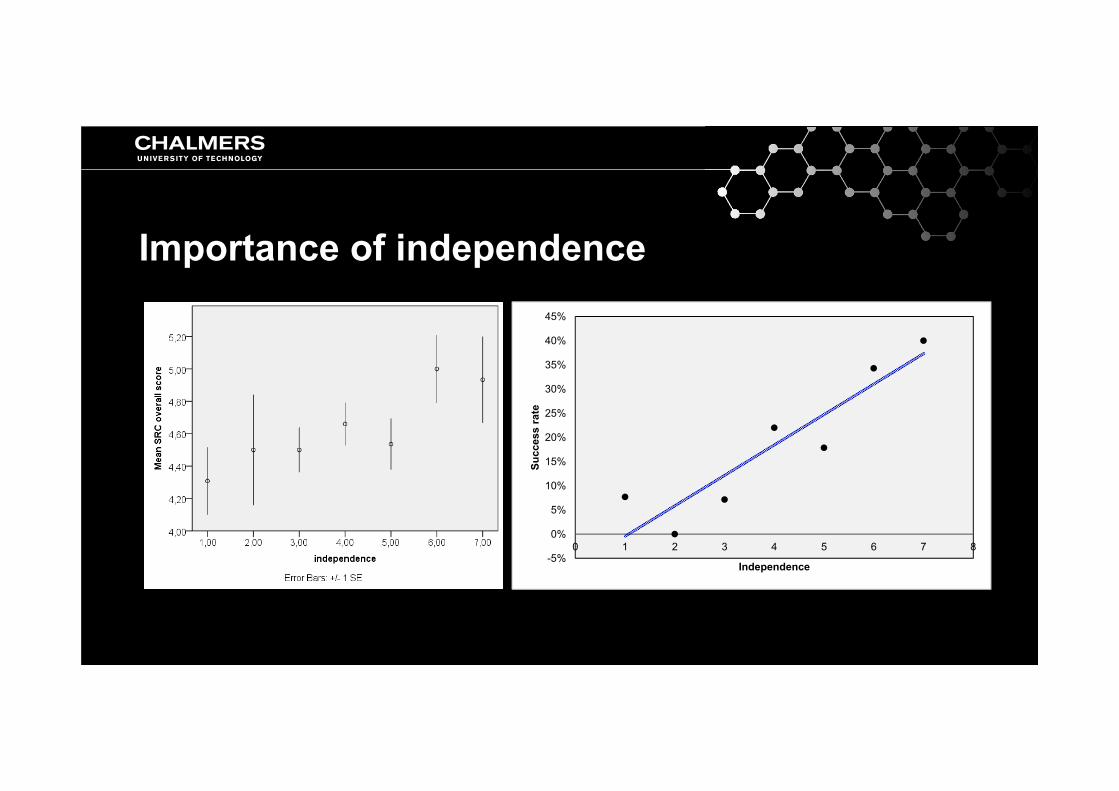
Importance of independence
-5%
0%
5%
10%
15%
20%
25%
30%
35%
40%
45%
0 1 2 3 4 5 6 7 8Su
cces
sra
te
Independence

2016-09-23 23
Extra slides for questions
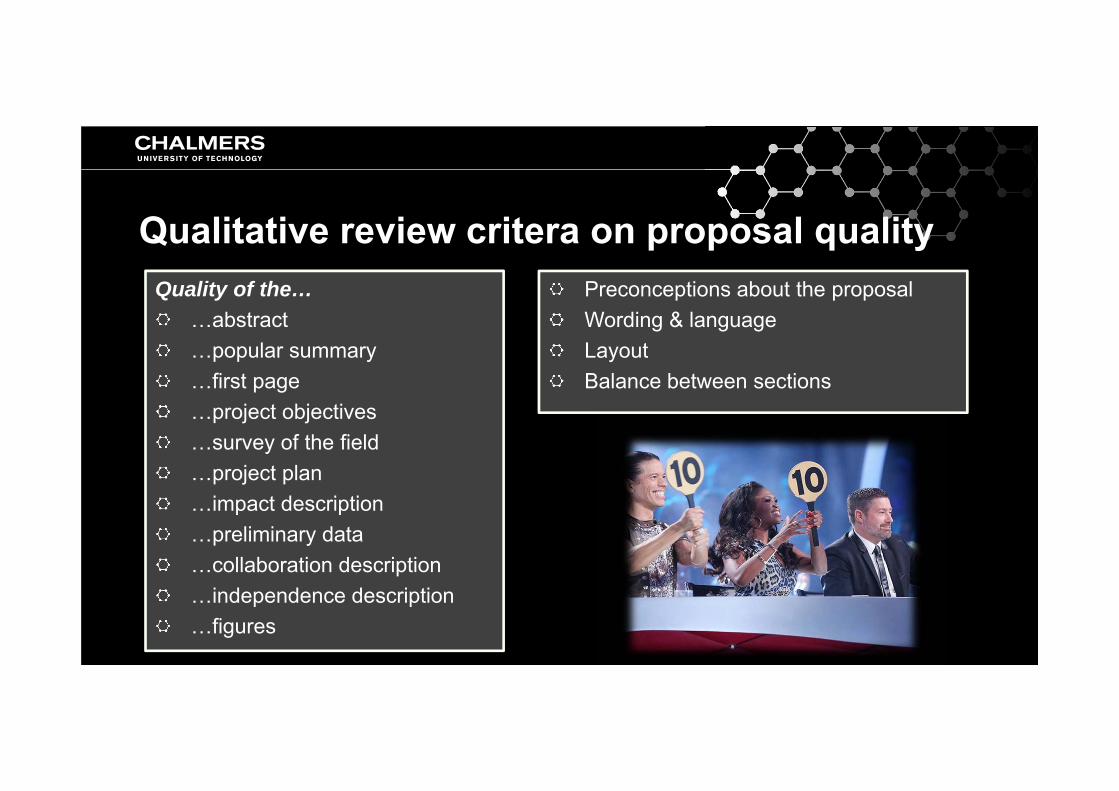
Quality of the… …abstract…popular summary…first page…project objectives…survey of the field…project plan…impact description…preliminary data…collaboration description…independence description…figures
Qualitative review critera on proposal qualityPreconceptions about the proposalWording & languageLayoutBalance between sections
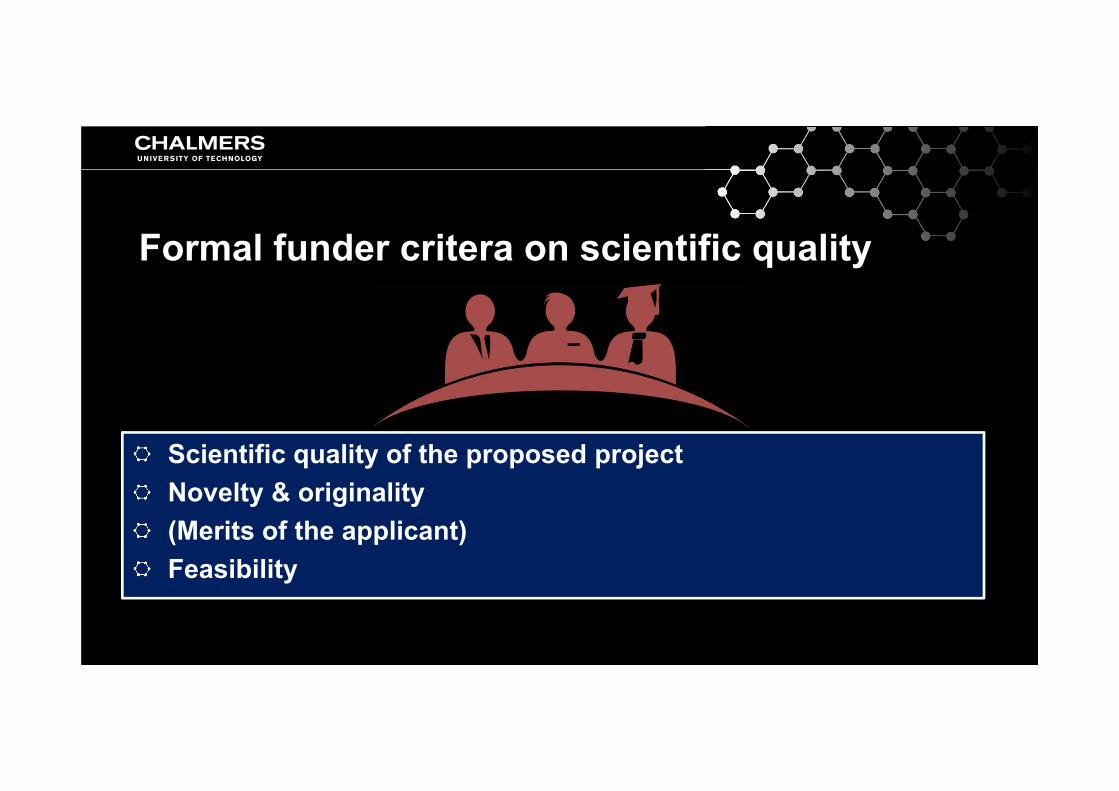
Scientific quality of the proposed projectNovelty & originality(Merits of the applicant)Feasibility
Formal funder critera on scientific quality

Previous support to the researcherPrevious funds from the same funderCorrect font and sizeCorrect headingsNumber of figures
Quantitative review critera
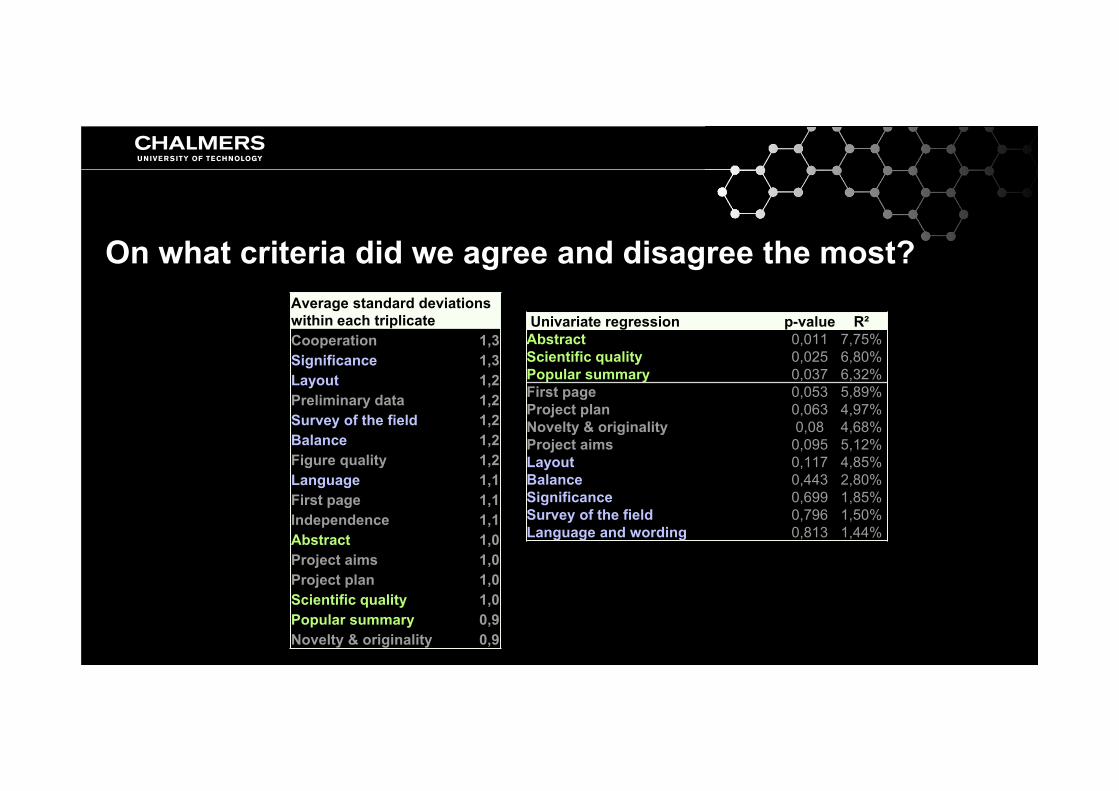
On what criteria did we agree and disagree the most?Average standard deviations within each triplicateCooperation 1,3Significance 1,3Layout 1,2Preliminary data 1,2Survey of the field 1,2Balance 1,2Figure quality 1,2Language 1,1First page 1,1Independence 1,1Abstract 1,0Project aims 1,0Project plan 1,0Scientific quality 1,0Popular summary 0,9Novelty & originality 0,9
Univariate regression p-value R²Abstract 0,011 7,75%Scientific quality 0,025 6,80%Popular summary 0,037 6,32%First page 0,053 5,89%Project plan 0,063 4,97%Novelty & originality 0,08 4,68%Project aims 0,095 5,12%Layout 0,117 4,85%Balance 0,443 2,80%Significance 0,699 1,85%Survey of the field 0,796 1,50%Language and wording 0,813 1,44%
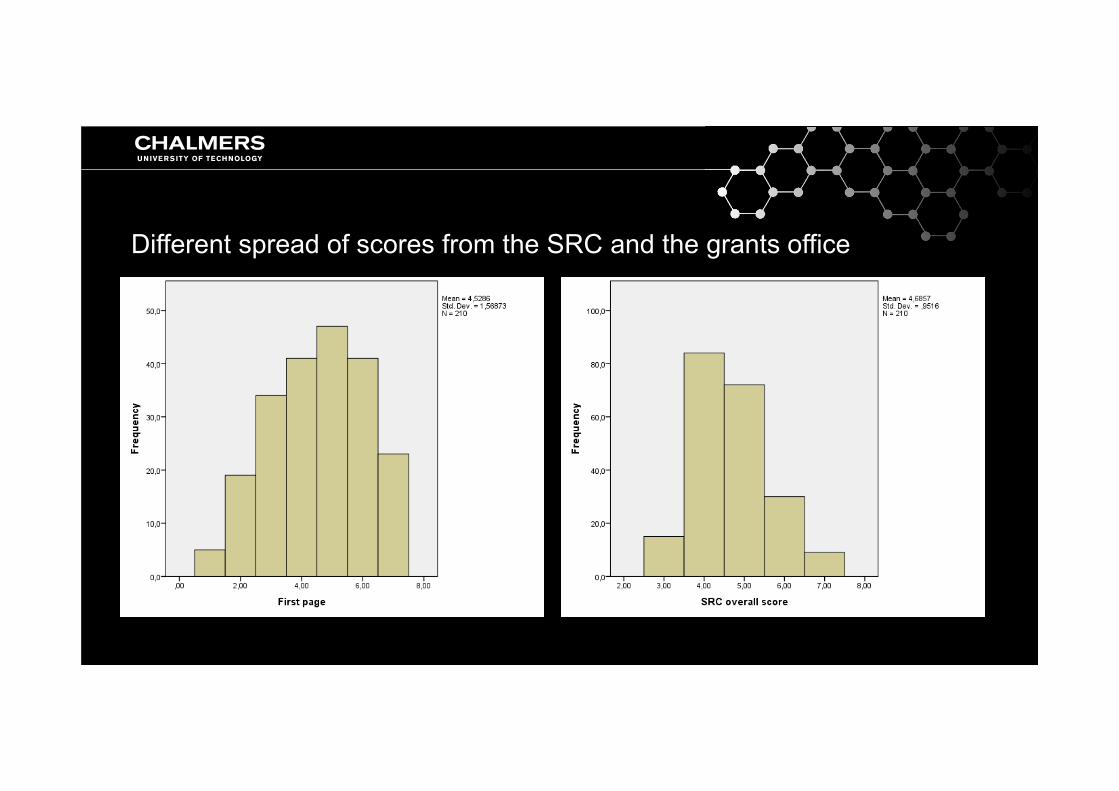
Different spread of scores from the SRC and the grants office
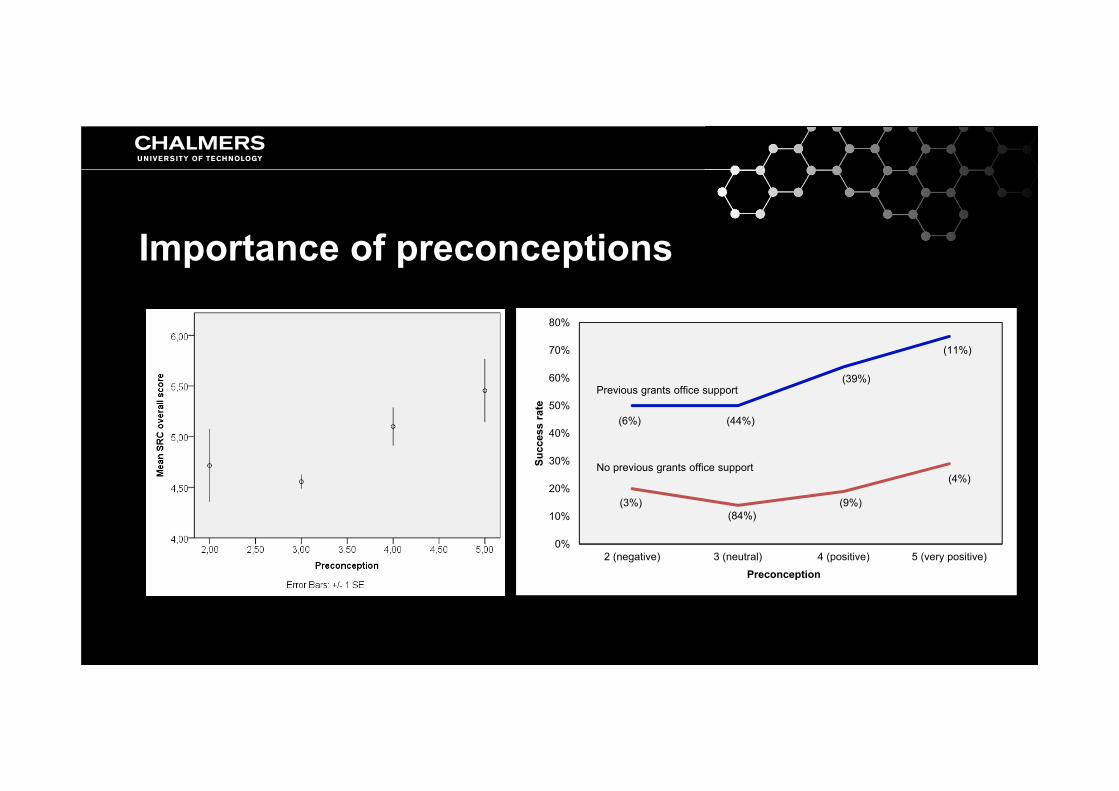
Importance of preconceptions
0%
10%
20%
30%
40%
50%
60%
70%
80%
2 (negative) 3 (neutral) 4 (positive) 5 (very positive)Su
cces
s ra
te
Preconception
(6%) (44%)
(39%)
(11%)
(3%)(84%)
(9%)
(4%)
Previous grants office support
No previous grants office support
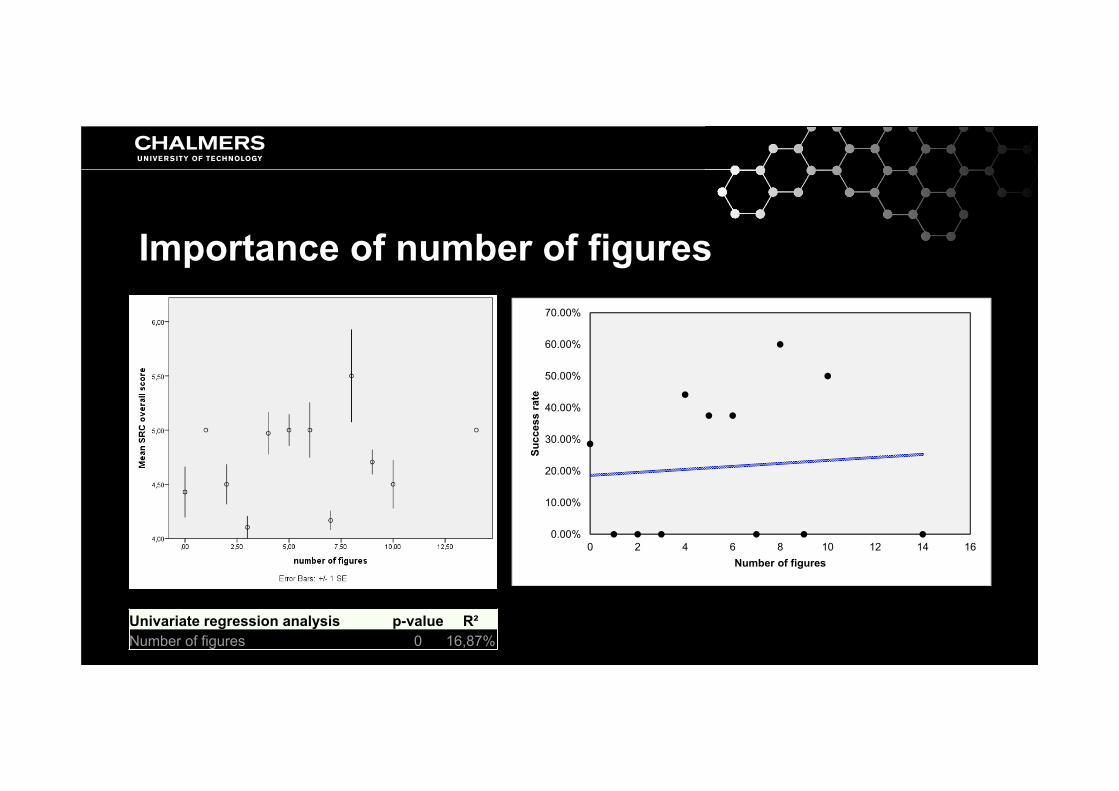
Importance of number of figures
Univariate regression analysis p-value R²Number of figures 0 16,87%
0.00%
10.00%
20.00%
30.00%
40.00%
50.00%
60.00%
70.00%
0 2 4 6 8 10 12 14 16Su
cces
sra
te
Number of figures
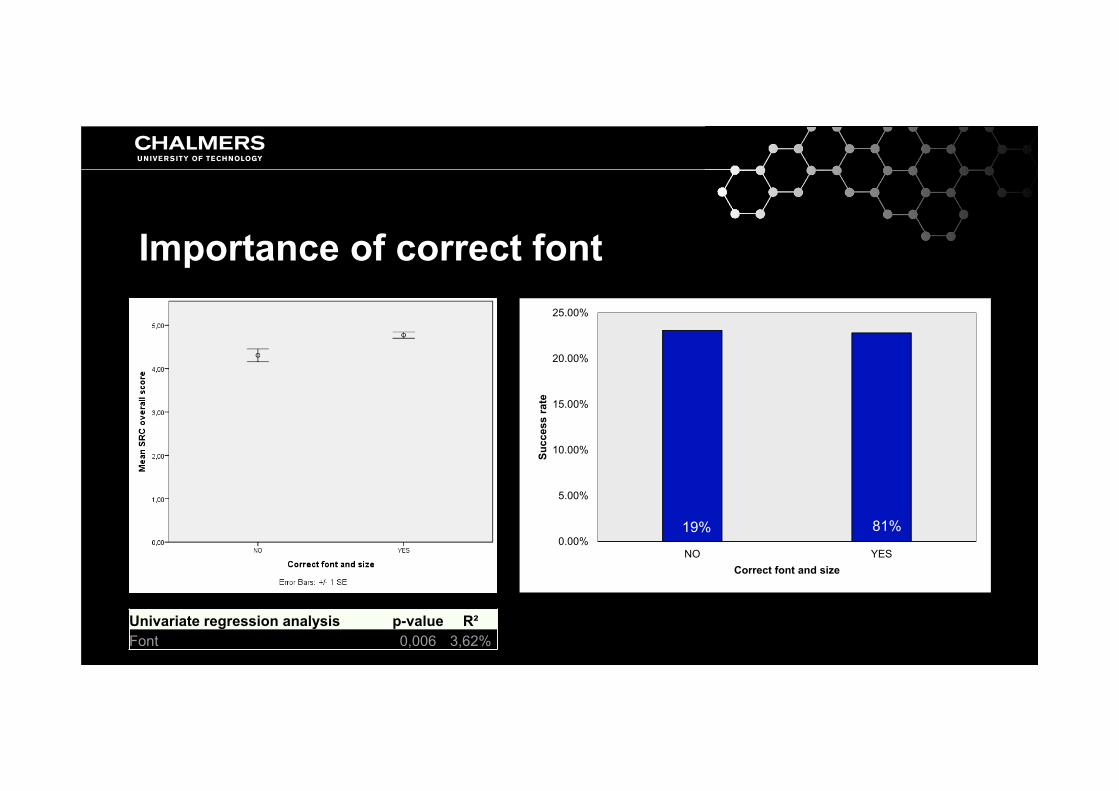
Importance of correct font
Univariate regression analysis p-value R²Font 0,006 3,62%
0.00%
5.00%
10.00%
15.00%
20.00%
25.00%
NO YESSu
cces
sra
te
Correct font and size
19% 81%
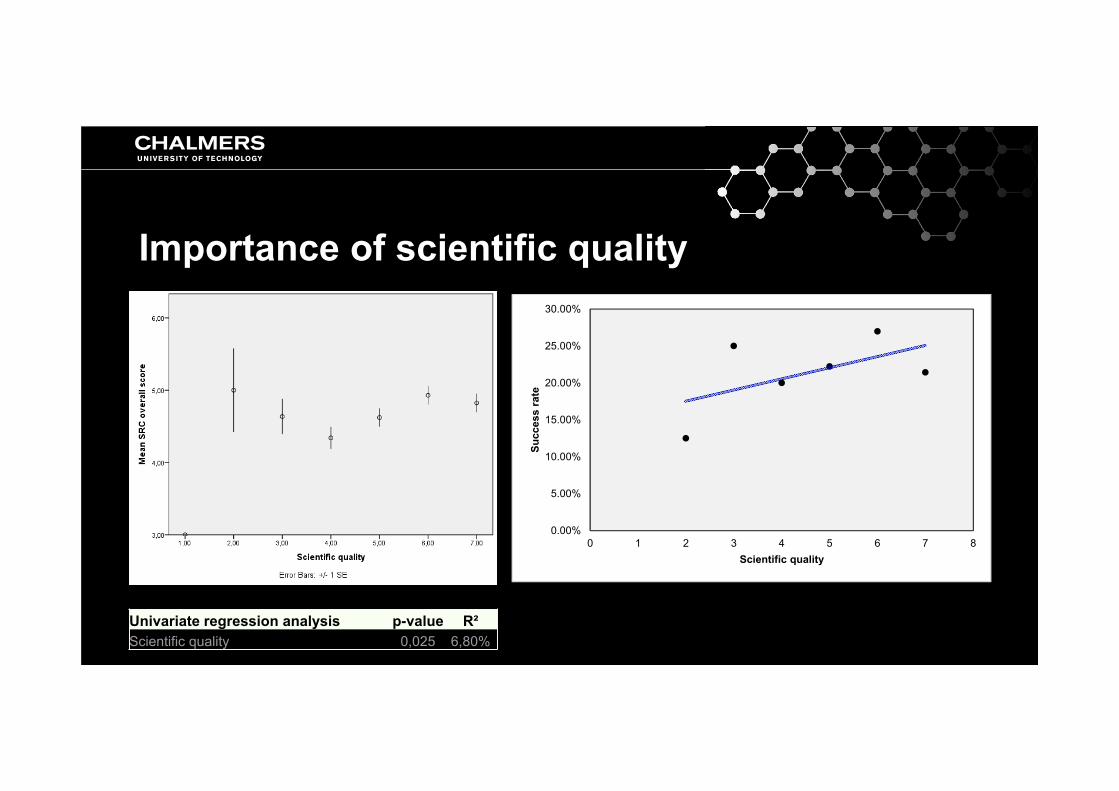
Importance of scientific quality
Univariate regression analysis p-value R²Scientific quality 0,025 6,80%
0.00%
5.00%
10.00%
15.00%
20.00%
25.00%
30.00%
0 1 2 3 4 5 6 7 8Su
cces
sra
te
Scientific quality
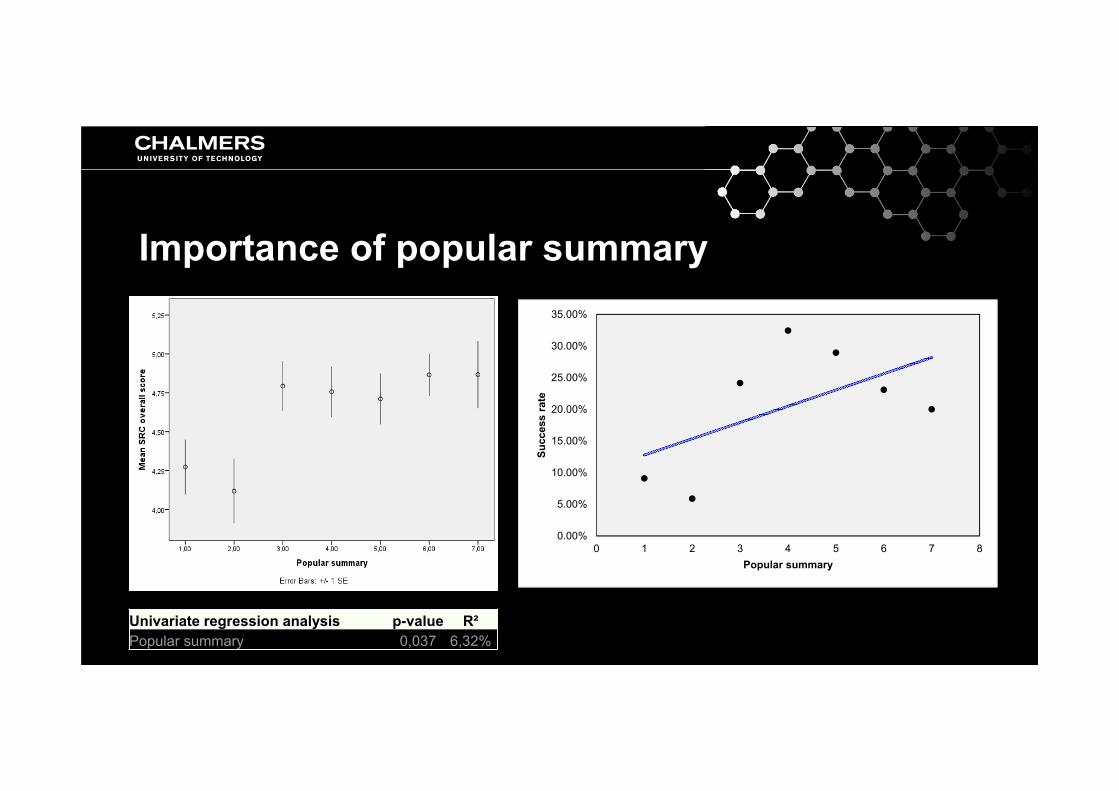
Importance of popular summary
Univariate regression analysis p-value R²Popular summary 0,037 6,32%
0.00%
5.00%
10.00%
15.00%
20.00%
25.00%
30.00%
35.00%
0 1 2 3 4 5 6 7 8Su
cces
sra
te
Popular summary
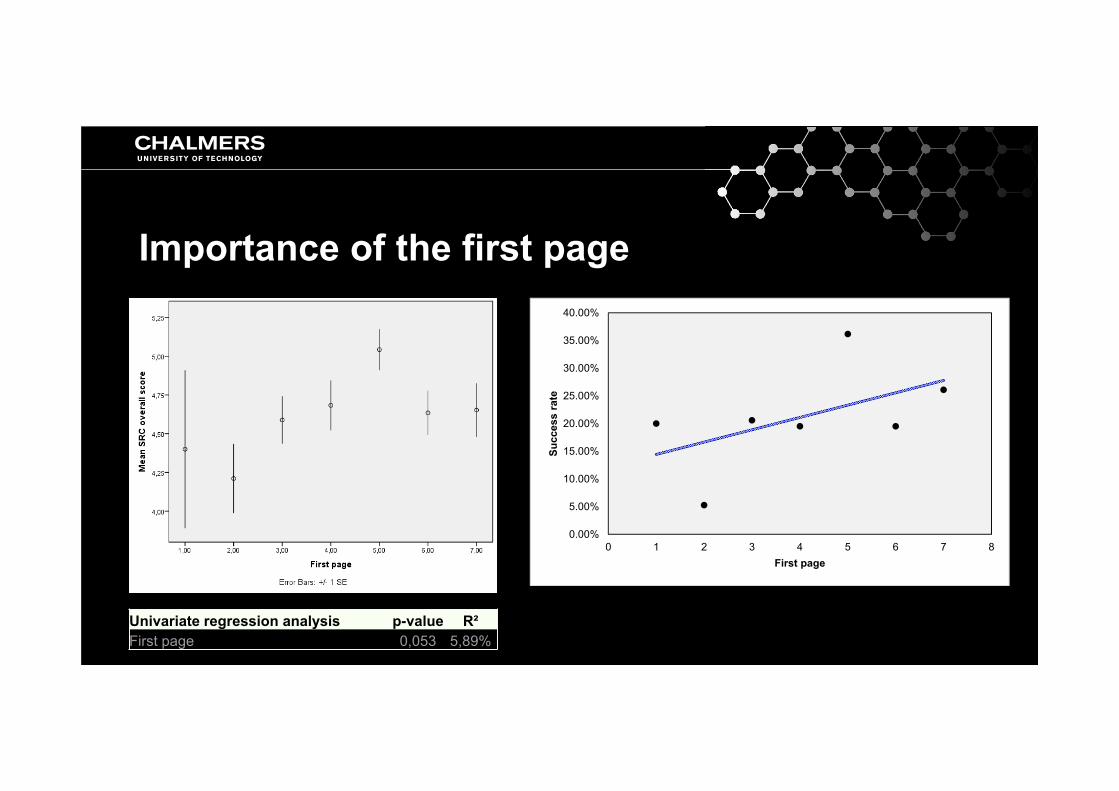
Importance of the first page
Univariate regression analysis p-value R²First page 0,053 5,89%
0.00%
5.00%
10.00%
15.00%
20.00%
25.00%
30.00%
35.00%
40.00%
0 1 2 3 4 5 6 7 8Su
cces
sra
teFirst page

Importance of aims description
Univariate regression analysis p-value R²Project aims 0,095 5,12%
0.00%
5.00%
10.00%
15.00%
20.00%
25.00%
30.00%
35.00%
0 1 2 3 4 5 6 7 8Su
cces
sra
te
Aims
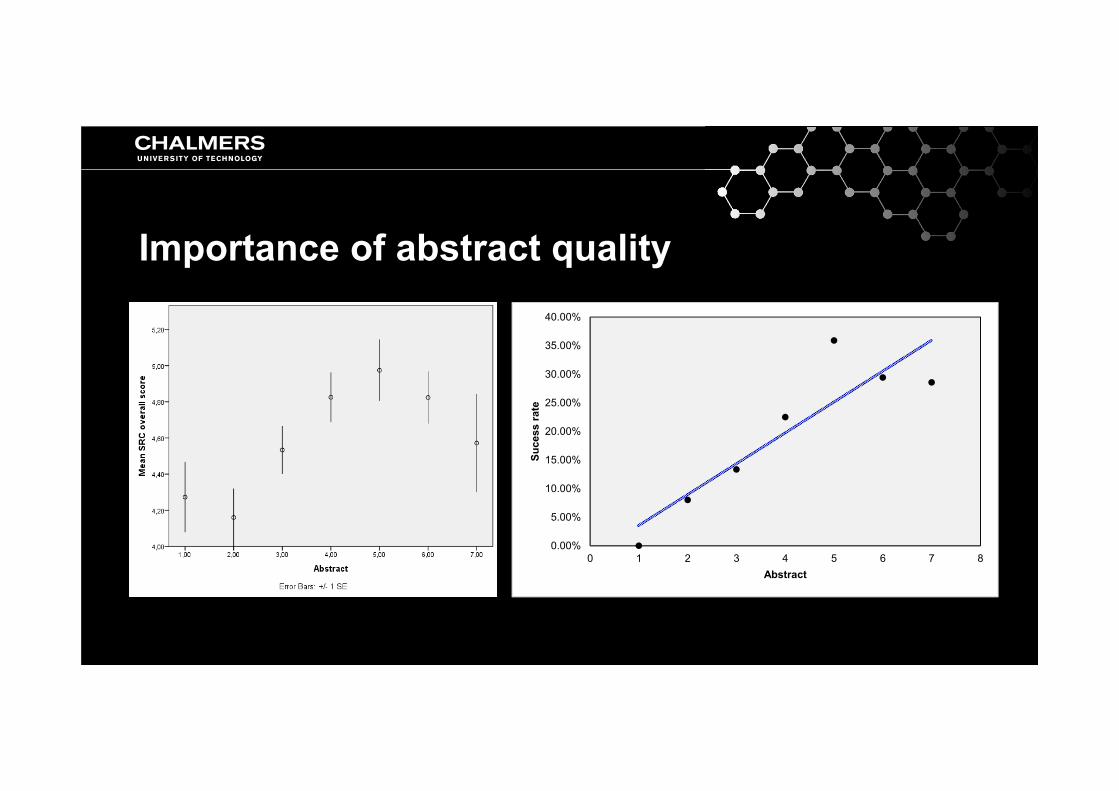
Importance of abstract quality
0.00%
5.00%
10.00%
15.00%
20.00%
25.00%
30.00%
35.00%
40.00%
0 1 2 3 4 5 6 7 8
Suce
ss ra
te
Abstract
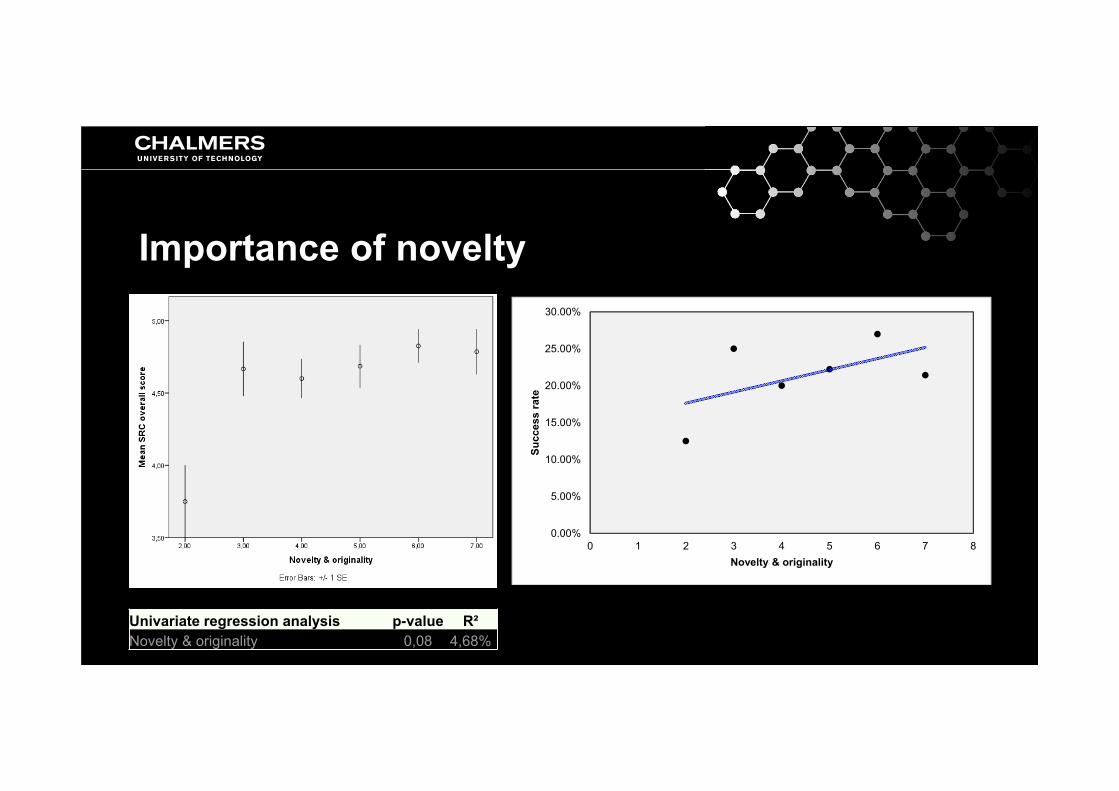
Importance of novelty
Univariate regression analysis p-value R²Novelty & originality 0,08 4,68%
0.00%
5.00%
10.00%
15.00%
20.00%
25.00%
30.00%
0 1 2 3 4 5 6 7 8Su
cces
sra
te
Novelty & originality
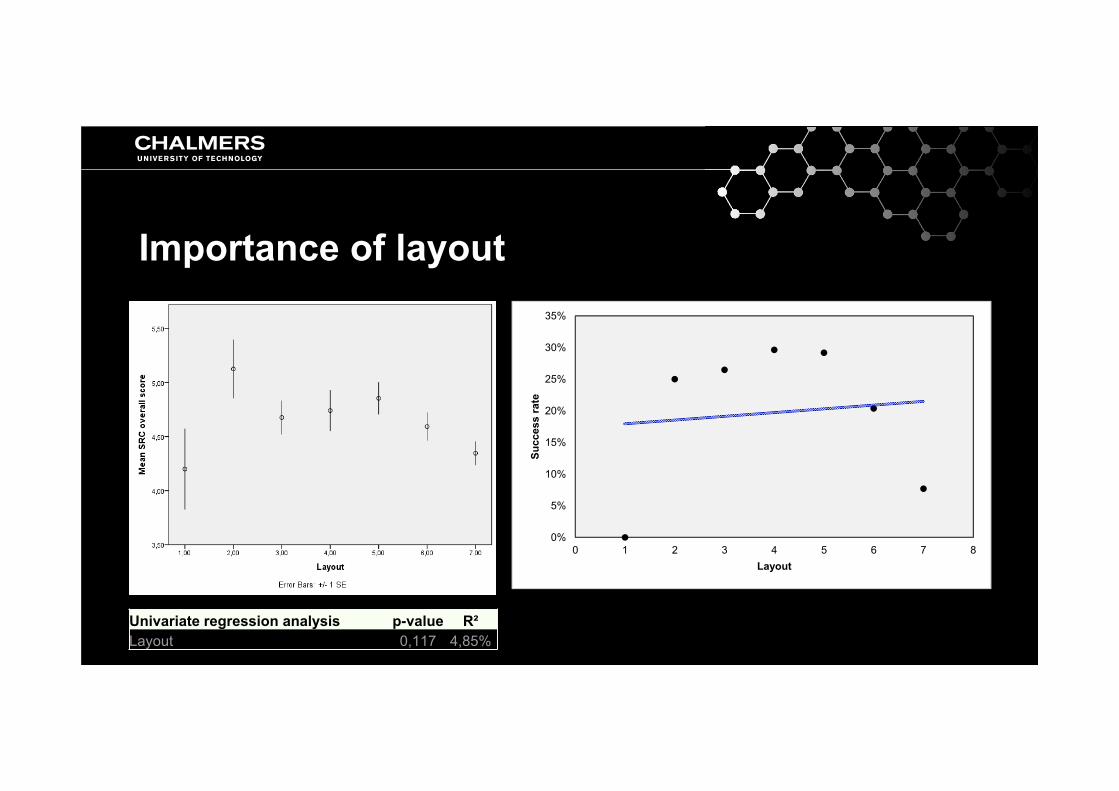
Importance of layout
Univariate regression analysis p-value R²Layout 0,117 4,85%
0%
5%
10%
15%
20%
25%
30%
35%
0 1 2 3 4 5 6 7 8Su
cces
sra
te
Layout
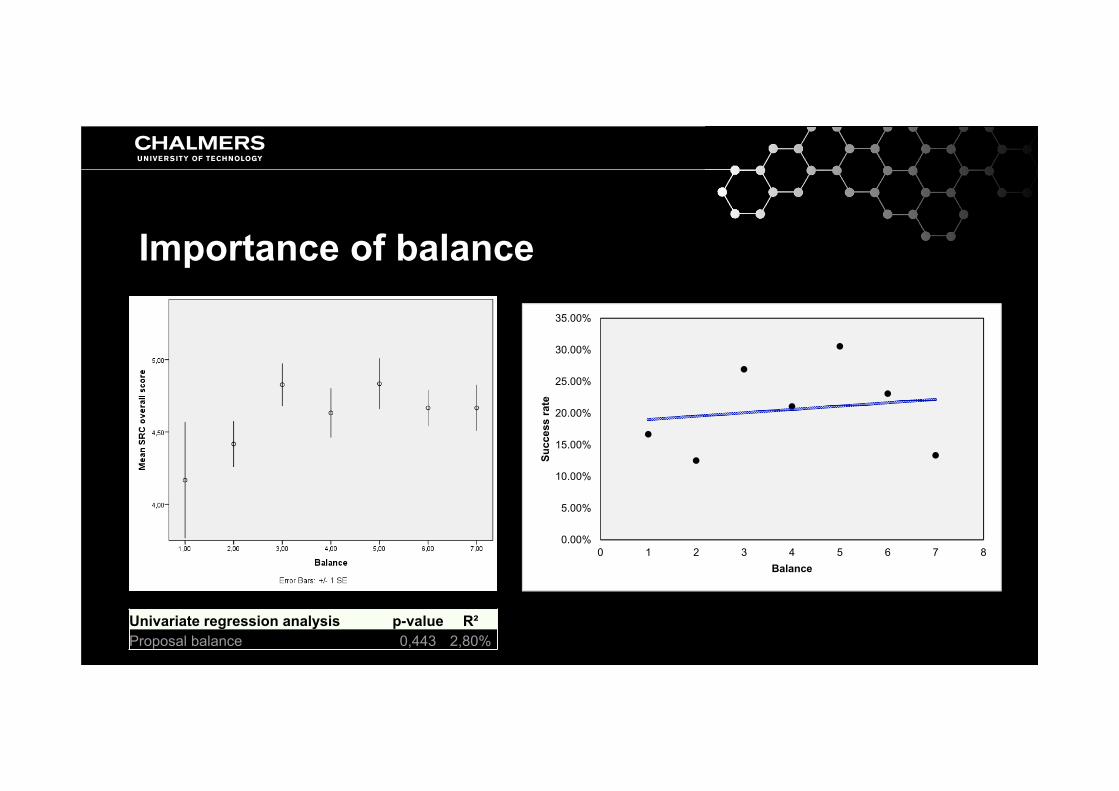
Importance of balance
Univariate regression analysis p-value R²Proposal balance 0,443 2,80%
0.00%
5.00%
10.00%
15.00%
20.00%
25.00%
30.00%
35.00%
0 1 2 3 4 5 6 7 8Su
cces
sra
te
Balance
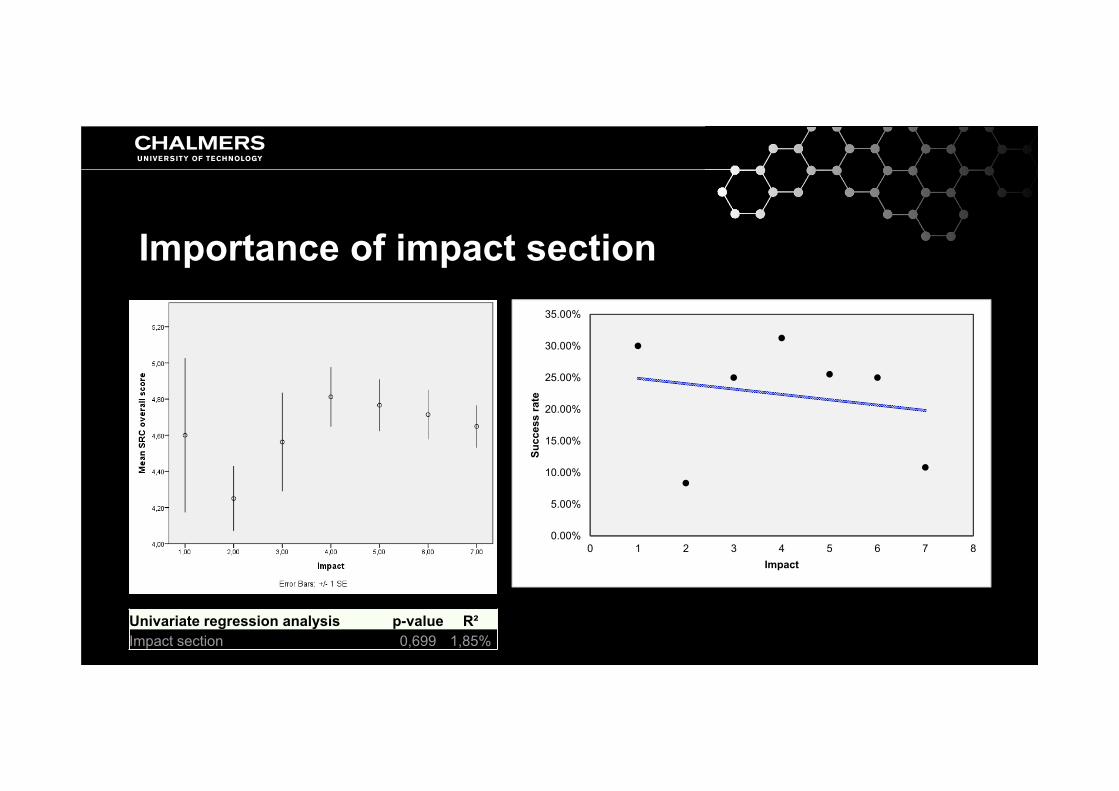
Importance of impact section
Univariate regression analysis p-value R²Impact section 0,699 1,85%
0.00%
5.00%
10.00%
15.00%
20.00%
25.00%
30.00%
35.00%
0 1 2 3 4 5 6 7 8Su
cces
sra
te
Impact
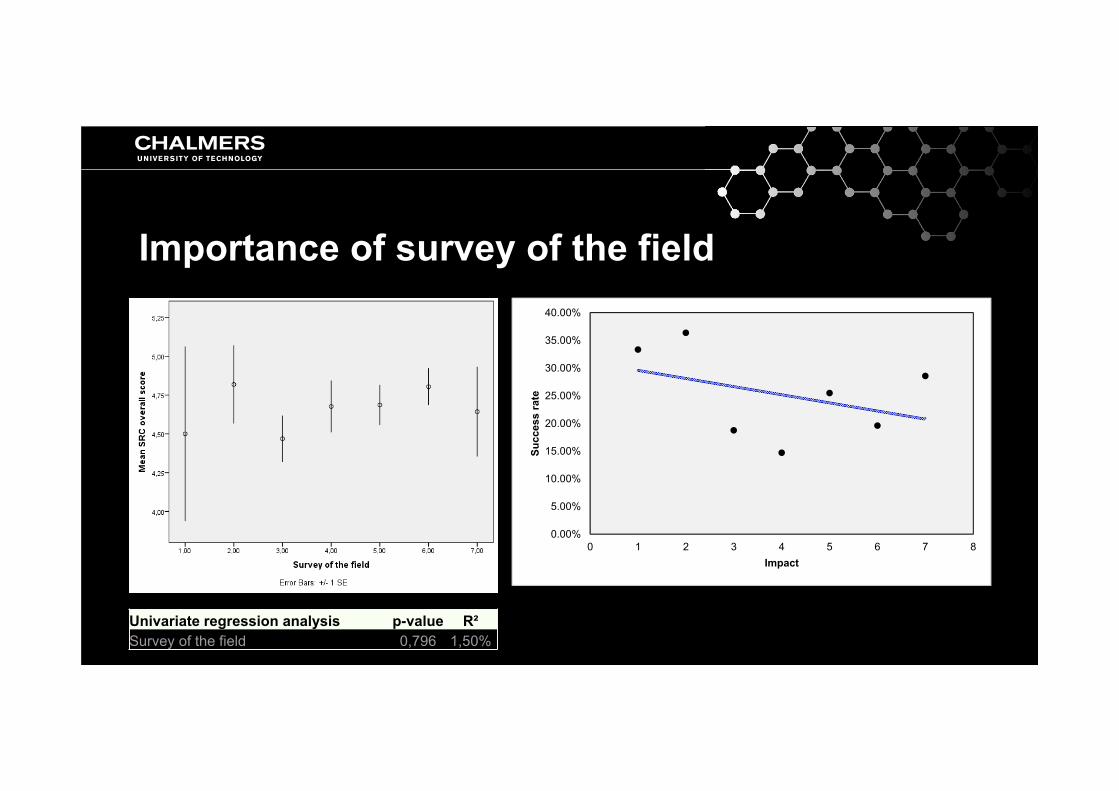
Importance of survey of the field
Univariate regression analysis p-value R²Survey of the field 0,796 1,50%
0.00%
5.00%
10.00%
15.00%
20.00%
25.00%
30.00%
35.00%
40.00%
0 1 2 3 4 5 6 7 8Su
cces
sra
te
Impact
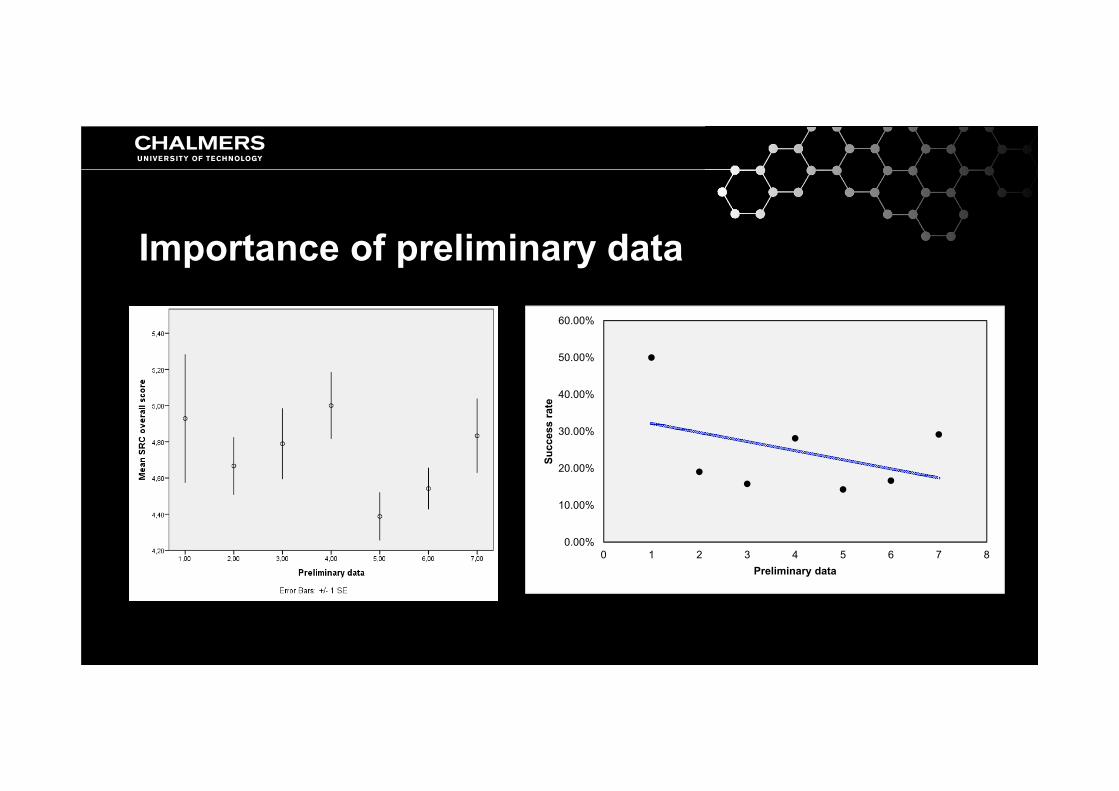
Importance of preliminary data
0.00%
10.00%
20.00%
30.00%
40.00%
50.00%
60.00%
0 1 2 3 4 5 6 7 8Su
cces
sra
te
Preliminary data
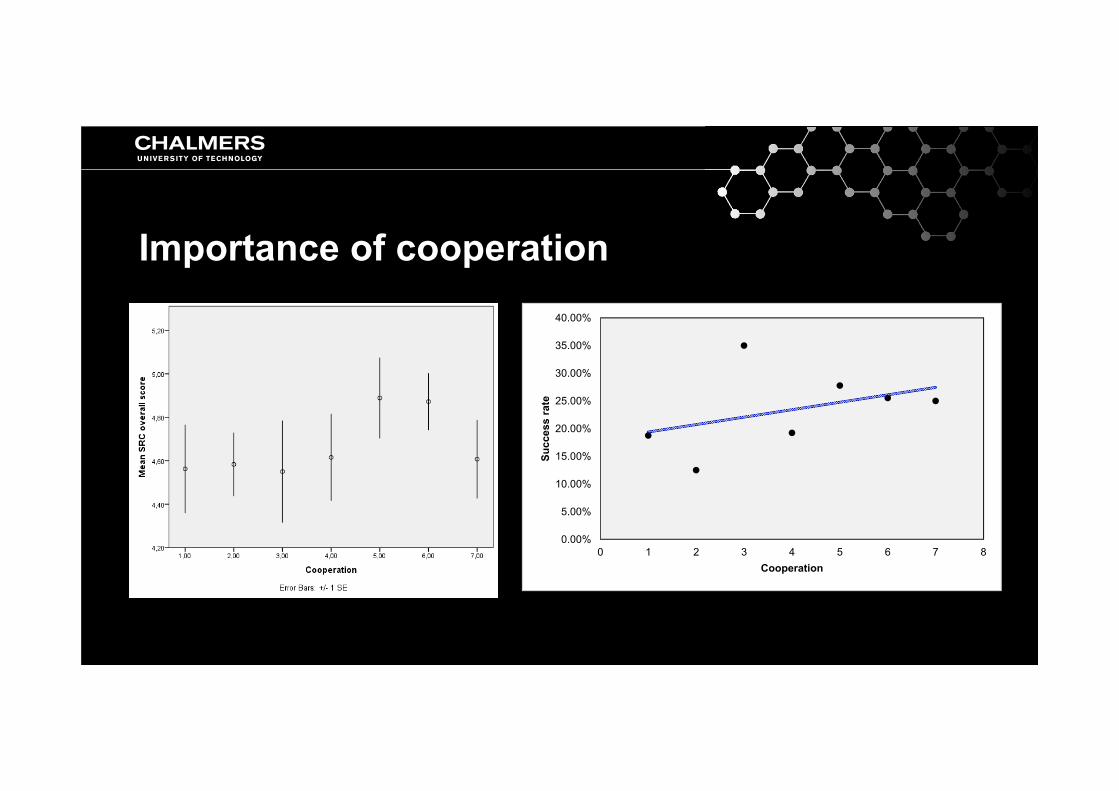
Importance of cooperation
0.00%
5.00%
10.00%
15.00%
20.00%
25.00%
30.00%
35.00%
40.00%
0 1 2 3 4 5 6 7 8Su
cces
sra
te
Cooperation
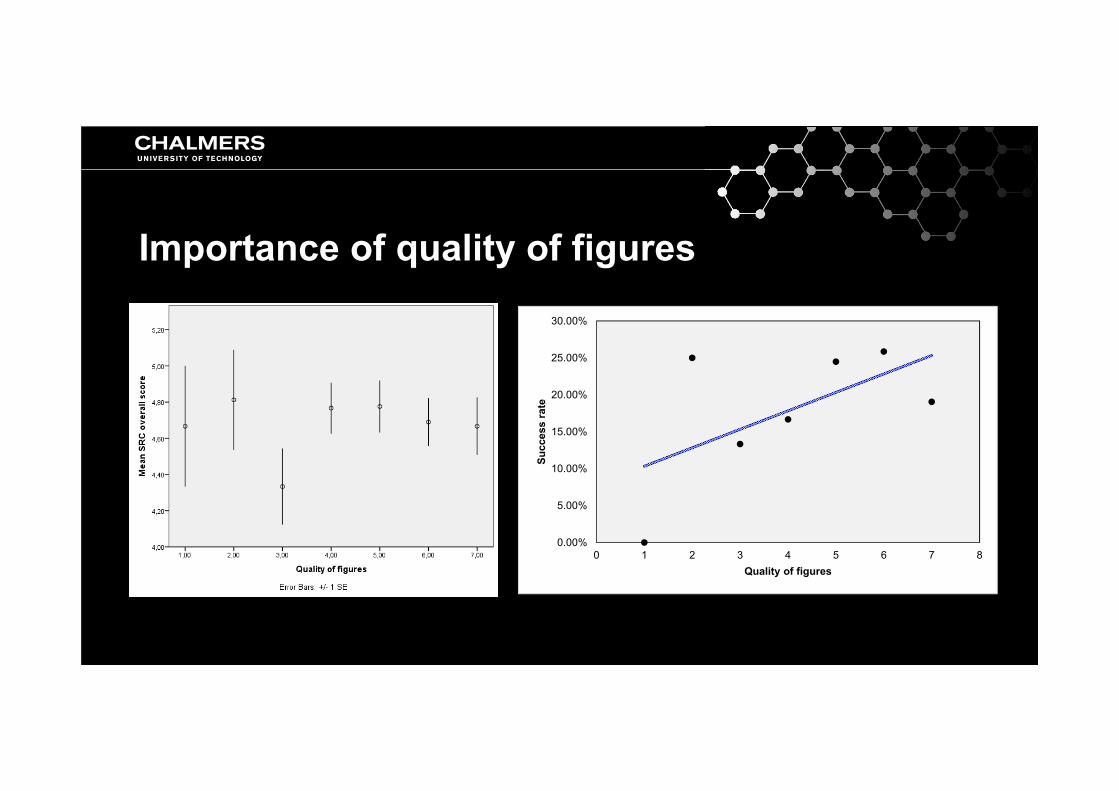
Importance of quality of figures
0.00%
5.00%
10.00%
15.00%
20.00%
25.00%
30.00%
0 1 2 3 4 5 6 7 8Su
cces
sra
te
Quality of figures
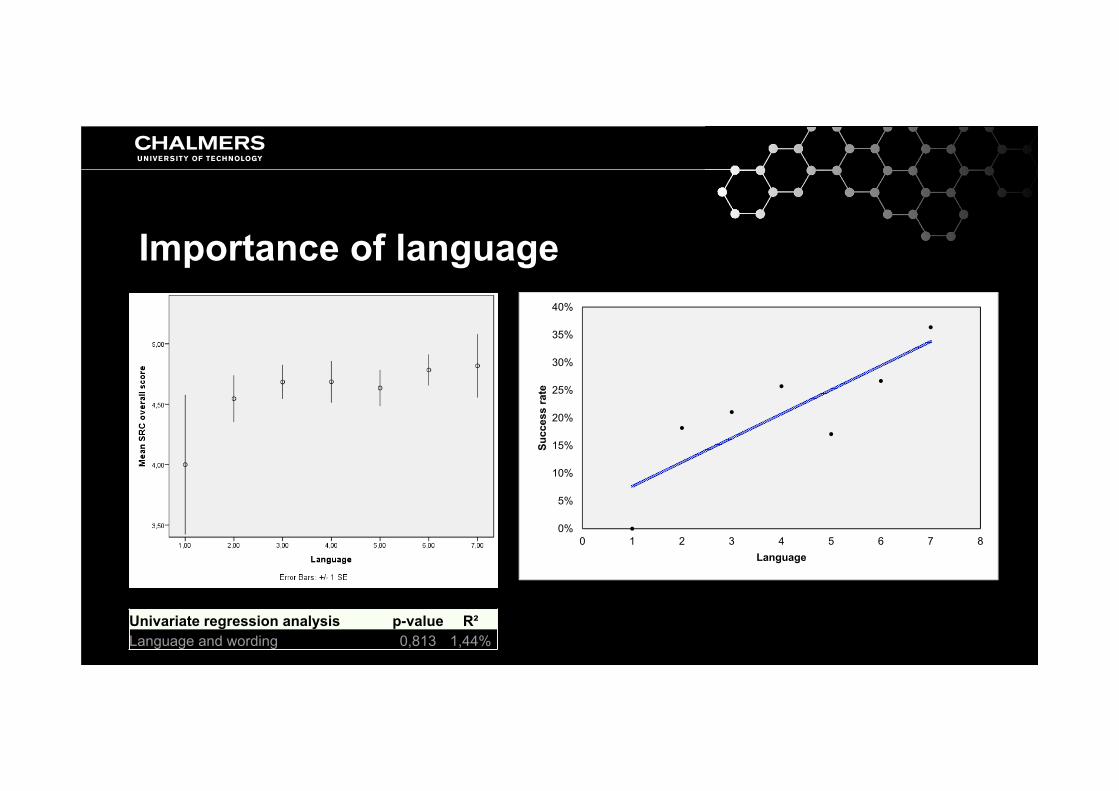
Importance of language
Univariate regression analysis p-value R²Language and wording 0,813 1,44%
0%
5%
10%
15%
20%
25%
30%
35%
40%
0 1 2 3 4 5 6 7 8Su
cces
sra
teLanguage