Embed Size (px)
Citation preview

American Academy of Political and Social Science
Crime and U.S. Cities: Recent Patterns and ImplicationsAuthor(s): Ingrid Gould Ellen and Katherine O'ReganSource: Annals of the American Academy of Political and Social Science, Vol. 626, The Shapeof the New American City (Nov., 2009), pp. 22-38Published by: Sage Publications, Inc. in association with the American Academy of Political and SocialScienceStable URL: http://www.jstor.org/stable/40375922 .
Accessed: 29/09/2013 01:31
Your use of the JSTOR archive indicates your acceptance of the Terms & Conditions of Use, available at .http://www.jstor.org/page/info/about/policies/terms.jsp
.JSTOR is a not-for-profit service that helps scholars, researchers, and students discover, use, and build upon a wide range ofcontent in a trusted digital archive. We use information technology and tools to increase productivity and facilitate new formsof scholarship. For more information about JSTOR, please contact [email protected].
.
Sage Publications, Inc. and American Academy of Political and Social Science are collaborating with JSTORto digitize, preserve and extend access to Annals of the American Academy of Political and Social Science.
http://www.jstor.org
This content downloaded from 128.135.12.127 on Sun, 29 Sep 2013 01:31:06 AMAll use subject to JSTOR Terms and Conditions
Crime and U.S. Cities: Recent Patterns and Implications
Crime fell substantially in the United States between the early 1990s and 2005. This article examines the size and nature of crime reductions that occurred in cities and their surrounding suburbs and identifies the charac- teristics of cities experiencing greater declines. The authors then explore two questions: how these changes altered existing disparities in safety (or exposure to crime) among particular groups and the extent to which these reductions increased the relative attrac- tiveness of cities and ultimately led to city growth. The authors find that reductions in crime contributed to the ability of cities to retain households that might other- wise have moved to the suburbs, although the measur- able impact on overall city growth is modest at best. Additionally, reductions in crime clearly changed the geography of crime and dramatically reshaped differ- ential exposure to crime among demographic groups. At the city and neighborhood level, the authors find that the distribution of crime reductions was highly "progressive," disproportionately benefiting historically disadvantaged groups.
Keywords: crime; city growth; poverty; race
INGRID GOULD ELLEN and
KATHERINE O'REGAN most of the twentieth century, U.S. cities -
and their high-poverty neighborhoods in particular - were viewed as dangerous, crime- ridden places that middle-class, mobile (and typically white) households avoided, fueling suburbanization. While some pundits and policy analysts bemoaned this urban flight, oth- ers voiced concern over the potential impact of crime-ridden environments on the urban resi- dents who were left behind. In the past decade or so, however the media have instead high- lighted the dramatic reductions in crime taking place in many large cities.
In this article, we explore these crime reduc- tions and their implications for urban environ- ments. We begin by examining the changes in central city crime rates in greater detail, docu- menting how central cities fared relative to sub- urban communities and examining which cities and neighborhoods experienced the largest
DOI: 10.1177/0002716209343547
22 ANNALS, AAPSS, 626, November 2009
This content downloaded from 128.135.12.127 on Sun, 29 Sep 2013 01:31:06 AMAll use subject to JSTOR Terms and Conditions
CRIME AND U.S. CITIES 23
declines. Given these patterns, we then explore two key questions: (1) whether and how these changes altered existing disparities in safety (or exposure to crime) among particular groups, and (2) the extent to which these reductions increased the relative attractiveness of cities and ultimately led to city growth. In exploring these questions, we draw on theory, past literature, and empirical evidence.
Changes in City Crime between 1990 and 2005
Between 1990 and 2005, crime rates in the United States as a whole fell by a striking 33 percent, with similar declines occurring for both property and violent crime (FBI Uniform Crime Reports). In this section, we specifically examine the crime reductions that took place in central cities. We describe crime changes for a sample of 278 cities and their surrounding suburbs.
City crime data
We relied on crime data available through the Department of Housing and Urban Developments (HUDs) State of the City Web site (http://socds.hud.user. org/), which provides electronic annual crime rates for more than five hundred central cities and more than sixty-eight hundred suburban places beginning in 1992. To define the suburbs of any particular central city, we matched the city to the metropolitan area in which it was located in 1990 and then defined its sub- urbs as all parts of that metropolitan area that are not in a central city. We then aggregated crime rates from all non-central-city-reporting agencies in that met- ropolitan area for each year to get the suburban crime rate.
The Web site reports crime data for 1992 and then annual data from 1997 through 2005. However, we are confident that crime rates declined fairly steadily
Ingrid Gould Ellen is an associate professor of public policy and urban planning and codirector of New York University's (NYU's) Furman Center for Real Estate and Urban Policy. She joined the faculty of NYU's Wagner Graduate School of Public Service in the fall of 1997 and currently teaches courses in microeconomics, urban economics, and urban policy. She is author of Sharing Americas Neighborhoods: The Prospects for Stable Racial Integration (Harvard University Press 2000) and has been published in such journals as Journal of Policy Analysis and Management, Urban Studies, Brookings-Wharton Papers on Urban Affairs, and Housing Policy Debate.
Katherine O'Regan is an associate professor of public policy and director of the Public and Nonprofit Management Program at the Wagner Graduate School of Public Service at New York University. She holds a PhD in economics from the University of California, Berkeley, and spent ten years teaching at the Yale School of Management prior to joining the Wagner faculty in 2000. She is currently working on a large project (with Ingrid Gould Ellen) examining neighborhood transitions over the past few decades.
NOTE: We would like to thank New York University's Wagner Graduate School of Public Service for generous support, Susan Wächter for helpful editorial guidance, and Michael Lens for exceptional research assistance.
This content downloaded from 128.135.12.127 on Sun, 29 Sep 2013 01:31:06 AMAll use subject to JSTOR Terms and Conditions
24 THE ANNALS OF THE AMERICAN ACADEMY
between 1992 and 1997: in an analysis of a sample of 150 large central cities for which we manually collected annual crime data, we found that crime rates peaked in 1992 and then declined monotonically until 1997 (Ellen and O'Regan 2009).
Data are missing for particular cities within coverage years as well.1 To mini- mize our reliance on estimated rates and to build a consistent panel of cities to examine, we included only cities with complete data, or for which we had com- plete data in all years but one.2 We also included cities only if we had suburban crime data from surrounding reporting agencies that covered at least 80 percent of the total suburban population.3 In total, we were able to identify city and sub- urban crime rates for 278 central cities.
For our analysis of neighborhood-level exposure to crime, we relied on neigh- borhood crime data from city agencies in Cleveland and Denver. The Denver crime data is available via the Piton Foundation s community facts Web site,4 pro- vided by the Denver Department of Public Safety. Data are reported for seventy- eight Denver neighborhoods that are composed of one to three census tracts, from 1990 to 2007.5 We accessed data on Cleveland crime from the Center on Urban Poverty and Social Change at Case Western s Mandel School of Applied Social Sciences.6 They obtained the data from the Cleveland police department on 228 census tracts from 1990 through 2007 (though data for 1998 are missing).
Changes in central city crime rates
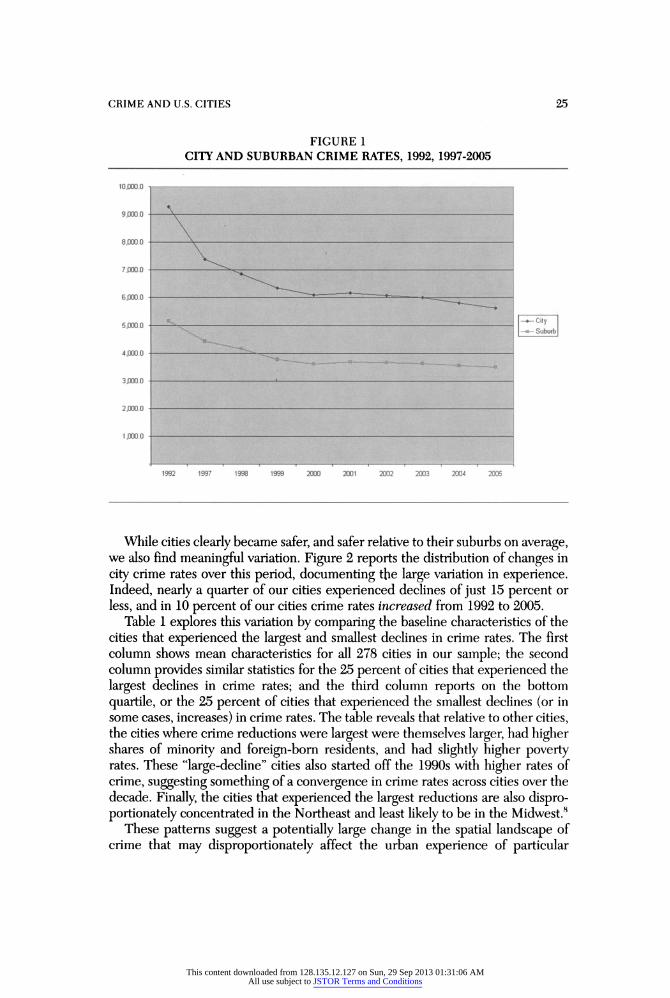
Figure 1 shows trends in the average crime rate for our sample of 278 central cities from 1992 through 2005.7 (We report total crimes per one hundred thousand people and weight the average by city population.) The top line is crime rates for central cities and shows that there was a dramatic decline in total crime rates in these cities beginning in 1992. From an average of more than ninety-two hundred reported crimes per one hundred thousand people in 1992, to just over fifty-six hundred in 2005, these cities experienced a 39 percent decline in total crime dur- ing this twelve-year period. The largest declines occurred in the 1990s, with some additional small declines after 2000. Property and violent crimes declined at simi- lar rates: 38 and 48 percent, respectively. Overall, average crime rates in cities fell even more sharply than crime in the country as a whole during this period, sug- gesting that cities became relatively safer compared to the rest of the country.
Crime rates in cities also declined more sharply than crime in their own sur- rounding suburbs. As shown by the second line on the graph, while the suburbs also experienced a steady reduction in crime, the decline was not quite as dra- matic as that taking place in cities. As a result, the difference between city crime rates and suburban crime rates fell from a high of about forty-one hundred crimes per one hundred thousand people in cities in 1992 to a low of about twenty-one hundred in 2005. Indeed, 36 percent of the central cities in our sample had crime rates in 2005 that were lower than the average suburban crime rate in 1992; more than a quarter of our cities had crime rates in 2005 that were lower than those in their surrounding suburbs in 1992.
This content downloaded from 128.135.12.127 on Sun, 29 Sep 2013 01:31:06 AMAll use subject to JSTOR Terms and Conditions
CRIME AND U.S. CITIES 25
FIGURE 1 CITY AND SUBURBAN CRIME RATES, 1992, 1997-2005
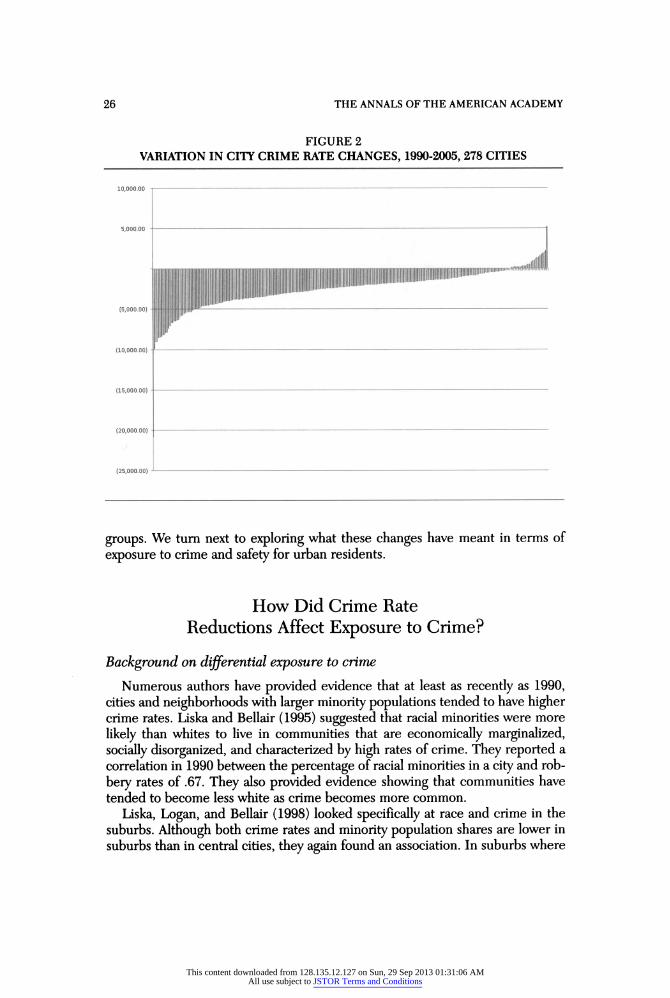
While cities clearly became safer, and safer relative to their suburbs on average, we also find meaningful variation. Figure 2 reports the distribution of changes in city crime rates over this period, documenting the large variation in experience. Indeed, nearly a quarter of our cities experienced declines of just 15 percent or less, and in 10 percent of our cities crime rates increased from 1992 to 2005.
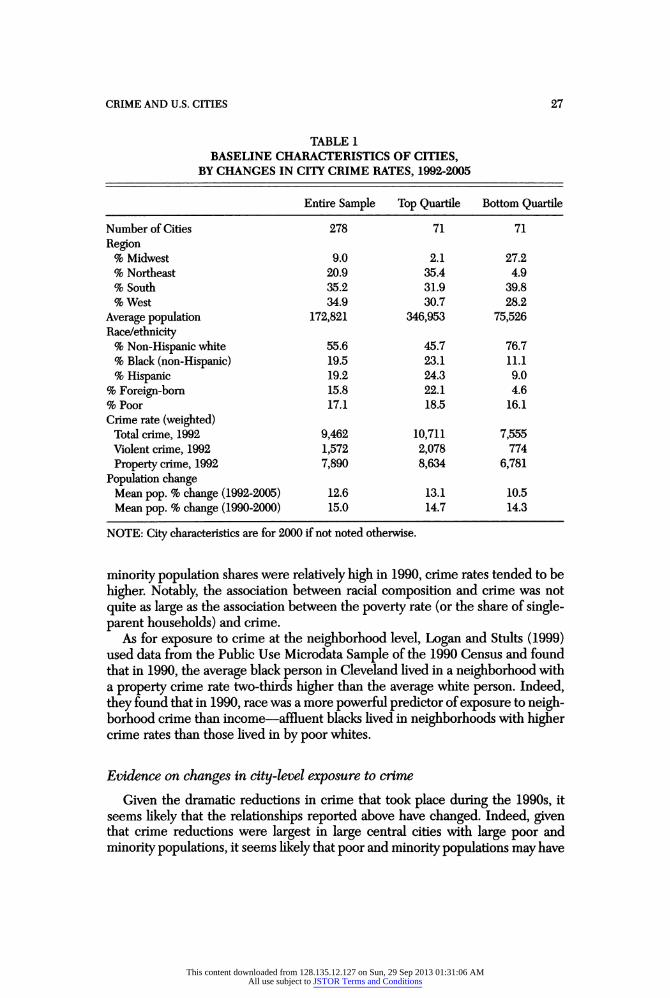
Table 1 explores this variation by comparing the baseline characteristics of the cities that experienced the largest and smallest declines in crime rates. The first column shows mean characteristics for all 278 cities in our sample; the second column provides similar statistics for the 25 percent of cities that experienced the largest declines in crime rates; and the third column reports on the bottom quartile, or the 25 percent of cities that experienced the smallest declines (or in some cases, increases) in crime rates. The table reveals that relative to other cities, the cities where crime reductions were largest were themselves larger, had higher shares of minority and foreign-born residents, and had slightly higher poverty rates. These "large-decline" cities also started off the 1990s with higher rates of crime, suggesting something of a convergence in crime rates across cities over the decade. Finally, the cities that experienced the largest reductions are also dispro- portionately concentrated in the Northeast and least likely to be in the Midwest.8
These patterns suggest a potentially large change in the spatial landscape of crime that may disproportionately affect the urban experience of particular
This content downloaded from 128.135.12.127 on Sun, 29 Sep 2013 01:31:06 AMAll use subject to JSTOR Terms and Conditions
26 THE ANNALS OF THE AMERICAN ACADEMY
FIGURE 2 VARIATION IN CITY CRIME RATE CHANGES, 1990-2005, 278 CITIES
groups. We turn next to exploring what these changes have meant in terms of exposure to crime and safety for urban residents.
How Did Crime Rate Reductions Affect Exposure to Crime?
Background on differential exposure to crime
Numerous authors have provided evidence that at least as recently as 1990, cities and neighborhoods with larger minority populations tended to have higher crime rates. Liska and Bellair (1995) suggested that racial minorities were more likely than whites to live in communities that are economically marginalized, socially disorganized, and characterized by high rates of crime. They reported a correlation in 1990 between the percentage of racial minorities in a city and rob- bery rates of .67. They also provided evidence showing that communities have tended to become less white as crime becomes more common.
Liska, Logan, and Bellair (1998) looked specifically at race and crime in the suburbs. Although both crime rates and minority population shares are lower in suburbs than in central cities, they again found an association. In suburbs where
This content downloaded from 128.135.12.127 on Sun, 29 Sep 2013 01:31:06 AMAll use subject to JSTOR Terms and Conditions
CRIME AND U.S. CITIES 27
TABLE 1 BASELINE CHARACTERISTICS OF CITIES,
BY CHANGES IN CITY CRIME RATES, 1992-2005
Entire Sample Top Quartile Bottom Quartile
Number of Cities 278 71 71 Region % Midwest 9.0 2.1 27.2 % Northeast 20.9 35.4 4.9 % South 35.2 31.9 39.8 %West 34.9 30.7 28.2
Average population 172,821 346,953 75,526 Race/ethnicity % Non-Hispanic white 55.6 45.7 76.7 % Black (non-Hispanic) 19.5 23.1 11.1 % Hispanic 19.2 24.3 9.0
% Foreign-born 15.8 22.1 4.6 %Poor 17.1 18.5 16.1 Crime rate (weighted) Total crime, 1992 9,462 10,711 7,555 Violent crime, 1992 1,572 2,078 774 Property crime, 1992 7,890 8,634 6,781
Population change Mean pop. % change (1992-2005) 12.6 13.1 10.5 Mean pop. % change (1990-2000) 15.0 14.7 14.3
NOTE: City characteristics are for 2000 if not noted otherwise.
minority population shares were relatively high in 1990, crime rates tended to be higher. Notably, the association between racial composition and crime was not quite as large as the association between the poverty rate (or the share of single- parent households) and crime.
As for exposure to crime at the neighborhood level, Logan and Stults (1999) used data from the Public Use Microdata Sample of the 1990 Census and found that in 1990, the average black person in Cleveland lived in a neighborhood with a property crime rate two-thirds higher than the average white person. Indeed, they found that in 1990, race was a more powerful predictor of exposure to neigh- borhood crime than income - affluent blacks lived in neighborhoods with higher crime rates than those lived in by poor whites.
Evidence on changes in city-level exposure to crime
Given the dramatic reductions in crime that took place during the 1990s, it seems likely that the relationships reported above have changed. Indeed, given that crime reductions were largest in large central cities with large poor and minority populations, it seems likely that poor and minority populations may have
This content downloaded from 128.135.12.127 on Sun, 29 Sep 2013 01:31:06 AMAll use subject to JSTOR Terms and Conditions
28 THE ANNALS OF THE AMERICAN ACADEMY
TABLE 2 AVERAGE CITY CRIME EXPOSURE RATES, BY DEMOGRAPHIC GROUPS
Total Crime Total Crime % Change Exposure Rate, 1992 Exposure Rate, 2000 Total Crime Exposure
Overall 9,274 6,092 -34.3 White 8,910 6,077 -31.8 Black 10,320 6,867 -33.5
Hispanic 9,389 5,847 -37.7
Foreign-born 9,238 5,380 -41.8 Native-born 9,281 6,274 -32.4
Nonpoor 9,190 6,064 -34.0 Poor 9,681 6,225 -35.7
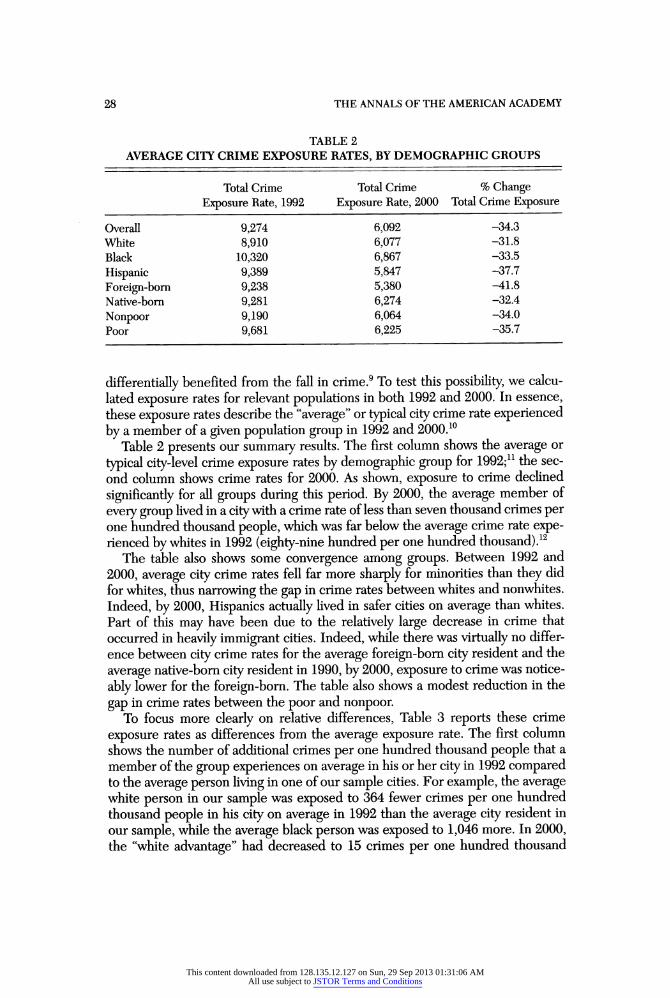
differentially benefited from the fall in crime.9 To test this possibility, we calcu- lated exposure rates for relevant populations in both 1992 and 2000. In essence, these exposure rates describe the "average" or typical city crime rate experienced by a member of a given population group in 1992 and 2000. 10
Table 2 presents our summary results. The first column shows the average or typical city-level crime exposure rates by demographic group for 1992;11 the sec- ond column shows crime rates for 2000. As shown, exposure to crime declined significantly for all groups during this period. By 2000, the average member of every group lived in a city with a crime rate of less than seven thousand crimes per one hundred thousand people, which was far below the average crime rate expe- rienced by whites in 1992 (eighty-nine hundred per one hundred thousand).12
The table also shows some convergence among groups. Between 1992 and 2000, average city crime rates fell far more sharply for minorities than they did for whites, thus narrowing the gap in crime rates between whites and nonwhites. Indeed, by 2000, Hispanics actually lived in safer cities on average than whites. Part of this may have been due to the relatively large decrease in crime that occurred in heavily immigrant cities. Indeed, while there was virtually no differ- ence between city crime rates for the average foreign-born city resident and the average native-born city resident in 1990, by 2000, exposure to crime was notice- ably lower for the foreign-born. The table also shows a modest reduction in the gap in crime rates between the poor and nonpoor.
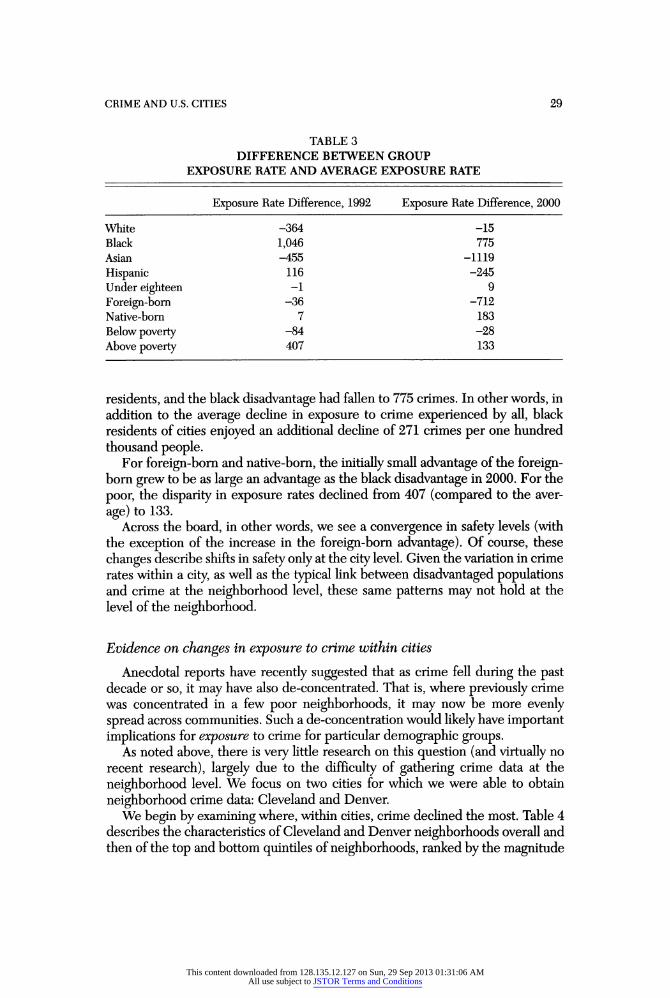
To focus more clearly on relative differences, Table 3 reports these crime exposure rates as differences from the average exposure rate. The first column shows the number of additional crimes per one hundred thousand people that a member of the group experiences on average in his or her city in 1992 compared to the average person living in one of our sample cities. For example, the average white person in our sample was exposed to 364 fewer crimes per one hundred thousand people in his city on average in 1992 than the average city resident in our sample, while the average black person was exposed to 1,046 more. In 2000, the "white advantage" had decreased to 15 crimes per one hundred thousand
This content downloaded from 128.135.12.127 on Sun, 29 Sep 2013 01:31:06 AMAll use subject to JSTOR Terms and Conditions
CRIME AND U.S. CITIES 29
TABLE 3 DIFFERENCE BETWEEN GROUP
EXPOSURE RATE AND AVERAGE EXPOSURE RATE
Exposure Rate Difference, 1992 Exposure Rate Difference, 2000
White -364 -15 Black 1,046 775 Asian -455 -1119 Hispanic 116 -245 Under eighteen -1 9 Foreign-born -36 -712 Native-born 7 183 Below poverty -84 -28 Above poverty 407 133
residents, and the black disadvantage had fallen to 775 crimes. In other words, in addition to the average decline in exposure to crime experienced by all, black residents of cities enjoyed an additional decline of 271 crimes per one hundred thousand people.
For foreign-born and native-born, the initially small advantage of the foreign- born grew to be as large an advantage as the black disadvantage in 2000. For the poor, the disparity in exposure rates declined from 407 (compared to the aver- age) to 133.
Across the board, in other words, we see a convergence in safety levels (with the exception of the increase in the foreign-born advantage). Of course, these changes describe shifts in safety only at the city level. Given the variation in crime rates within a city, as well as the typical link between disadvantaged populations and crime at the neighborhood level, these same patterns may not hold at the level of the neighborhood.
Evidence on changes in exposure to crime within cities
Anecdotal reports have recently suggested that as crime fell during the past decade or so, it may have also de-concentrated. That is, where previously crime was concentrated in a few poor neighborhoods, it may now be more evenly spread across communities. Such a de-concentration would likely have important implications for exposure to crime for particular demographic groups.
As noted above, there is very little research on this question (and virtually no recent research), largely due to the difficulty of gathering crime data at the neighborhood level. We focus on two cities for which we were able to obtain neighborhood crime data: Cleveland and Denver.
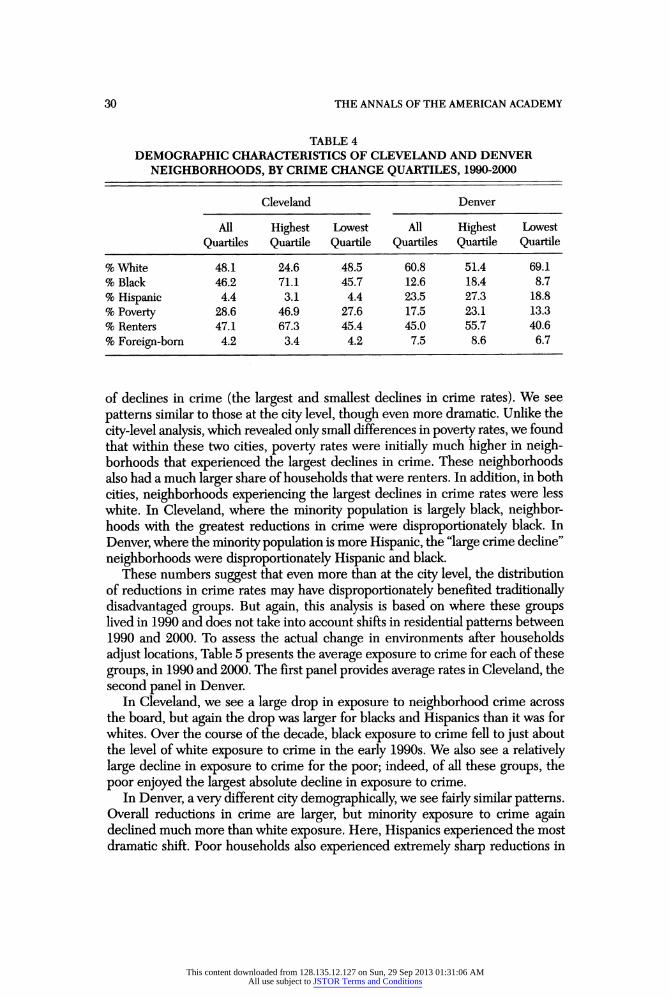
We begin by examining where, within cities, crime declined the most. Table 4 describes the characteristics of Cleveland and Denver neighborhoods overall and then of the top and bottom quintiles of neighborhoods, ranked by the magnitude
This content downloaded from 128.135.12.127 on Sun, 29 Sep 2013 01:31:06 AMAll use subject to JSTOR Terms and Conditions
30 THE ANNALS OF THE AMERICAN ACADEMY
TABLE 4 DEMOGRAPHIC CHARACTERISTICS OF CLEVELAND AND DENVER
NEIGHBORHOODS, BY CRIME CHANGE QUARTILES, 1990-2000
Cleveland Denver
All Highest Lowest All Highest Lowest Quartiles Quartile Quartile Quartiles Quartile Quartile
% White 48.1 24.6 48.5 60.8 51.4 69.1 % Black 46.2 71.1 45.7 12.6 18.4 8.7 % Hispanic 4.4 3.1 4.4 23.5 27.3 18.8 % Poverty 28.6 46.9 27.6 17.5 23.1 13.3 % Renters 47.1 67.3 45.4 45.0 55.7 40.6 % Foreign-born 4.2 3.4 4.2 7.5 8.6 6.7
of declines in crime (the largest and smallest declines in crime rates). We see patterns similar to those at the city level, though even more dramatic. Unlike the city-level analysis, which revealed only small differences in poverty rates, we found that within these two cities, poverty rates were initially much higher in neigh- borhoods that experienced the largest declines in crime. These neighborhoods also had a much larger share of households that were renters. In addition, in both cities, neighborhoods experiencing the largest declines in crime rates were less white. In Cleveland, where the minority population is largely black, neighbor- hoods with the greatest reductions in crime were disproportionately black. In Denver, where the minority population is more Hispanic, the "large crime decline" neighborhoods were disproportionately Hispanic and black.
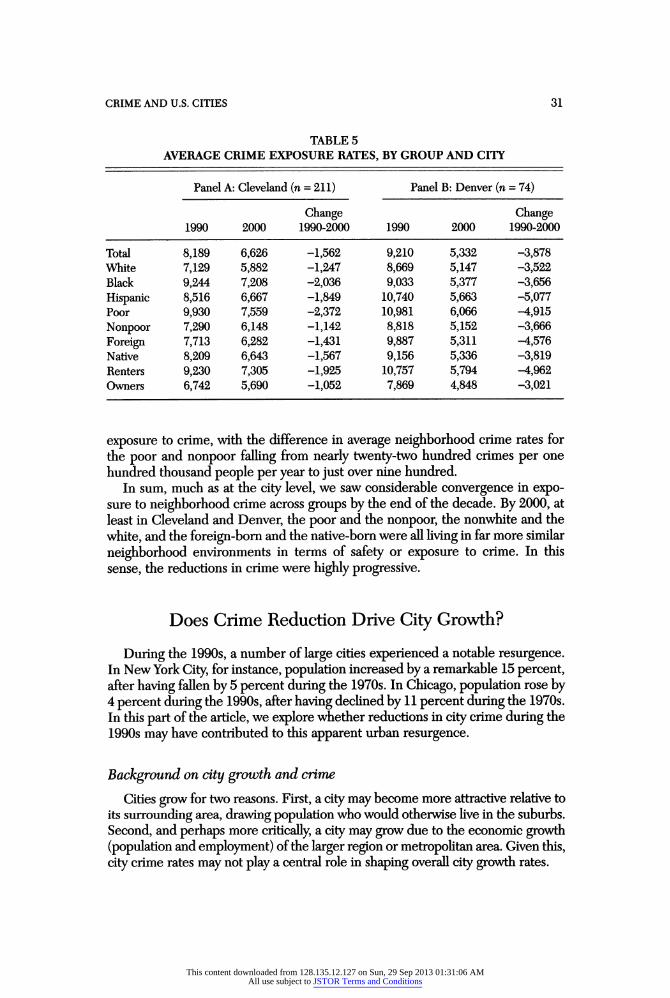
These numbers suggest that even more than at the city level, the distribution of reductions in crime rates may have disproportionately benefited traditionally disadvantaged groups. But again, this analysis is based on where these groups lived in 1990 and does not take into account shifts in residential patterns between 1990 and 2000. To assess the actual change in environments after households adjust locations, Table 5 presents the average exposure to crime for each of these groups, in 1990 and 2000. The first panel provides average rates in Cleveland, the second panel in Denver.
In Cleveland, we see a large drop in exposure to neighborhood crime across the board, but again the drop was larger for blacks and Hispanics than it was for whites. Over the course of the decade, black exposure to crime fell to just about the level of white exposure to crime in the early 1990s. We also see a relatively large decline in exposure to crime for the poor; indeed, of all these groups, the poor enjoyed the largest absolute decline in exposure to crime.
In Denver, a very different city demographically, we see fairly similar patterns. Overall reductions in crime are larger, but minority exposure to crime again declined much more than white exposure. Here, Hispanics experienced the most dramatic shift. Poor households also experienced extremely sharp reductions in
This content downloaded from 128.135.12.127 on Sun, 29 Sep 2013 01:31:06 AMAll use subject to JSTOR Terms and Conditions
CRIME AND U.S. CITIES 31
TABLE 5 AVERAGE CRIME EXPOSURE RATES, BY GROUP AND CITY
Panel A: Cleveland (n = 211) Panel B: Denver (n = 74)
Change Change 1990 2000 1990-2000 1990 2000 1990-2000
Total 8,189 6,626 -1,562 9,210 5,332 -3,878 White 7,129 5,882 -1,247 8,669 5,147 -3,522 Black 9,244 7,208 -2,036 9,033 5,377 -3,656 Hispanic 8,516 6,667 -1,849 10,740 5,663 -5,077 Poor 9,930 7,559 -2,372 10,981 6,066 -4,915 Nonpoor 7,290 6,148 -1,142 8,818 5,152 -3,666 Foreign 7,713 6,282 -1,431 9,887 5,311 -4,576 Native 8,209 6,643 -1,567 9,156 5,336 -3,819 Renters 9,230 7,305 -1,925 10,757 5,794 -4,962 Owners 6,742 5,690 -1,052 7,869 4,848 -3,021
exposure to crime, with the difference in average neighborhood crime rates for the poor and nonpoor falling from nearly twenty-two hundred crimes per one hundred thousand people per year to just over nine hundred.
In sum, much as at the city level, we saw considerable convergence in expo- sure to neighborhood crime across groups by the end of the decade. By 2000, at least in Cleveland and Denver, the poor and the nonpoor, the nonwhite and the white, and the foreign-born and the native-born were all living in far more similar neighborhood environments in terms of safety or exposure to crime. In this sense, the reductions in crime were highly progressive.
Does Crime Reduction Drive City Growth?
During the 1990s, a number of large cities experienced a notable resurgence. In New York City, for instance, population increased by a remarkable 15 percent, after having fallen by 5 percent during the 1970s. In Chicago, population rose by 4 percent during the 1990s, after having declined by 11 percent during the 1970s. In this part of the article, we explore whether reductions in city crime during the 1990s may have contributed to this apparent urban resurgence.
Background on city growth and crime
Cities grow for two reasons. First, a city may become more attractive relative to its surrounding area, drawing population who would otherwise live in the suburbs. Second, and perhaps more critically, a city may grow due to the economic growth (population and employment) of the larger region or metropolitan area. Given this, city crime rates may not play a central role in shaping overall city growth rates.
This content downloaded from 128.135.12.127 on Sun, 29 Sep 2013 01:31:06 AMAll use subject to JSTOR Terms and Conditions
32 THE ANNALS OF THE AMERICAN ACADEMY
Indeed, economists studying urban growth have not traditionally included crime or urban amenities in their explanatory models. In explaining the variation in growth across cities in the 1990s, for instance, Glaeser and Shapiro (2001) concluded that the factors associated with high growth are being located in the West; having large service-sector industries, high foreign-born population shares, and high levels of education; and being auto-dependent. These are really charac- teristics of metropolitan areas and not cities per se.
Some recent researchers have emphasized the importance of urban amenities and their appeal to workers, however. Glaeser, Kolko, and Saiz (2000) argued that while the urban economics literature has traditionally focused on the ways in which cities can make themselves more attractive and productive places for firms, the future of cities may depend more critically on their ability to attract increasingly wealthy and footloose workers.
Indeed, Glaeser and Gottlieb (2006) argued that the growth that occurred during the 1990s in large, dense cities was driven by increases in labor supply. Specifically, they showed that as large, dense cities grew during the 1990s, their real wages declined relative to other areas in the United States, and housing prices increased. This suggests that urban growth in recent years has not been driven by increases in firm productivity in cities but rather by an increase in their ability to attract workers. It is plausible that one key amenity change for cities has been the decline in crime rates.13
There is a fair amount of research exploring the extent to which increases in crime and other perceived sources of urban blight push households out to the suburbs (for overviews, see Bradford and Kelejian 1973; Mieszkowski and Mills 1993). While this theory has intuitive appeal, the empirical support for the importance of crime rates in shaping residential location decisions is decidedly mixed. Frey (1979) used aggregate central city migration data on thirty-nine large metropolitan statistical areas (MSAs) from 1967 to 1970 to assess the relative role of central city decline in migration flows. He found some evidence that central city crime rates influenced the likelihood of moving to the suburbs, conditional on changing housing, but the independent influence of crime was quite small.
Mills and Price (1984) found no evidence that central city crime contributed to suburbanization. They considered the importance of city crime relative to subur- ban crime, controlling for a variety of other city characteristics. Their primary approach was based on density gradients for between thirty-five and fifty-eight metropolitan areas between 1960 and 1970, although they also estimated a variety of alternative models, with similarly unsupportive results. In their examination of the 1980s, Jordan, Ross, and Usowski (1998) found that higher city crime rates are associated with less suburbanization, counter to their expectations.
Some researchers have found that only certain populations appear sensitive to crime. Grubb (1982) considered the suburbanization of both households and jobs from 1960 to 1970 in more than one hundred large MSAs and found evidence of sensitivity to central city crime rates only for white households, particularly upper-income white households. By contrast, South and Crowder (1997), using the geocoded files of the Panel Study of Income Dynamics (PSID) between 1979 and 1985, found that the ratio of central city violent crime rates to suburban
This content downloaded from 128.135.12.127 on Sun, 29 Sep 2013 01:31:06 AMAll use subject to JSTOR Terms and Conditions
CRIME AND U.S. CITIES 33
increased the likelihood that black households would move to the suburbs but not white households.
One reason for the mixed evidence is that in addition to crime affecting resi- dential decisions, residential decisions - and suburbanization in particular - may actually affect crime rates. If models fail to correct for this reverse causality, the resulting estimates are likely to be biased. Farley (1987) and more recently Jargowsky and Park (2006) suggested several avenues through which suburban- ization may well lead to higher crime rates in the central city, including changes in the composition of households in the city and suburb as well as increased social stratification.
Cullen and Levitt (1999) offered some of the most recent (and most widely cited) work in this area. Unlike the vast majority of previous work, they focused on changes in crime rates, rather than levels. Using a series of data sources and models, they found that increases in crime rates during the 1970s and 1980s led to population losses and that white households, families, and those with greater education are more sensitive to changes in crime. In addition, the authors found that changes in crime rates had their greatest influence on relocation decisions within the metropolitan area. Their work also employed an instrumental variables strategy to better identify a causal relationship and still found that increases in crime contributed to lower growth and greater migration to the suburbs.
Of course, even if the prior evidence on the role of increasing or high levels of crime in the depopulation of cities were more consistent, it is not obvious a priori that the relationship between crime and residential decisions would be symmetrical - while increases in city crime may push residents away from cities, similarly sized reductions may not attract them. Thus, the remainder of the article offers some new empirical evidence to test whether the decline in city crime rates shaped residential decisions and ultimately contributed to city popu- lation growth in the 1990s.
Evidence on the effect of reductions in city crime on changes in city population
Building on the work of Cullen and Levitt (1999) and drawing on our recent paper (Ellen and O'Regan 2009), we examined whether reductions in central city crimes rates led to overall population gains for cities. We studied this more recent period using Census data and Uniform Crime Report data for 1990 through 2005.
Our basic regression models are as follows:14
Aln populationi(1990 2000) = a + ß2A CityCrimei(1989 1994) + ß2CityCrimef 1990 + yXam + Xr + Eit; (1)
Aln population¿(2000 2005) = a + ßxA CityCrimei(1995 2000) +
ß^ityCrim^ 2000 +yXi2000 + Xr + ziv (2)
This content downloaded from 128.135.12.127 on Sun, 29 Sep 2013 01:31:06 AMAll use subject to JSTOR Terms and Conditions
34 THE ANNALS OF THE AMERICAN ACADEMY
where subscripts i and r reference city i and region r. The dependent variable is the change in the log of city population from year 1990 to 2000 in model 1 and the change in the city population between 2000 and 2005 in model 2. The inde- pendent variables include changes in city crime rates over an earlier period and city crime rates at the start of the time period. X is a vector of characteristics of the city at the start of the period that includes the initial population, unemploy- ment rate, median family income, percentage of the city's population who are black, percentage who are foreign-born, percentage with college degrees, and percentage who own their homes. We also include measures of the age distribu- tion of the population, the average temperatures in January and July, 1994 total precipitation, and regional dummy variables to capture variation across the nine Census regions. All baseline variables are measured at the start of the period to minimize endogeneity.
We use decennial Census data for city characteristics in 1990 and 2000 and American Community Survey (ACS) data for 2005 population. Data on city crime rates are taken from the FBI's Uniform Crime Reports. We estimate our regres- sions on a sample of 145 large central cities. These are all the central cities that had populations in 1980 of at least one hundred thousand.
A few notes on the specification: while most of the empirical literature on crime and flight examines crime levels, Cullen and Levitt (1999) argued that it is changes in crime rates that should matter for flight since the level of crime has already been factored into decisions of residents to live in a city.15 While this argument makes sense, we think crime levels may still be important too. In par- ticular, once a household makes a decision to move (decisions that are typically prompted by changes in a households housing needs, such as family formation, childbearing, and aging), the choice of which jurisdiction to settle in (including whether to remain in the city or choose a jurisdiction outside) may well depend on the current assessment of relative attractiveness of different location alterna- tives, which may be based on crime levels or recent changes in crime. Thus, it is unclear a priori whether reductions in crime, or simply low levels of crime, should be more likely to induce households to move to or choose to stay in central cities. For these reasons, we test for effects of both levels and changes.
In terms of the temporal relationship between changes in crime and changes in population, there are important arguments for lagging changes in crime. If these changes are presumed to be causal, they should precede any residential movements they affect. Lagging crime rates also help to address endogeneity. However, for our decade models, to focus on changes in crime that preceded 1990 prohibits capturing any of the decline in crime in the early 1990s and, more- over, would suggest a very long lag between the change in crime and any impact on moves over the second half of the decade. As a compromise, the period in which we measure change in crime overlaps with the start of the decade, spe- cifically changes in crime from 1989 to 1994.
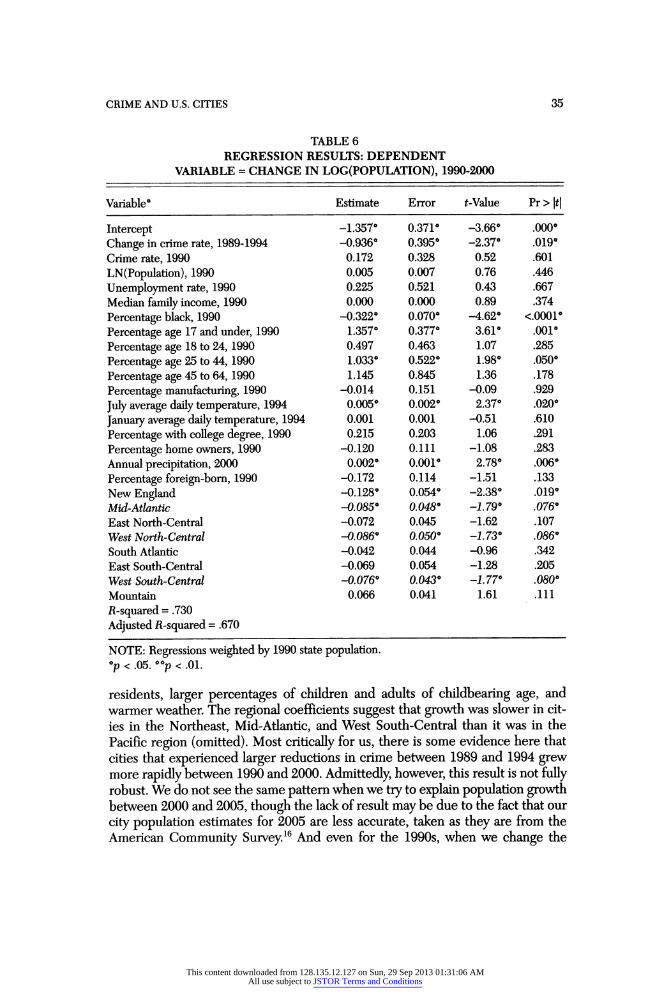
Table 6 shows our basic results. The coefficients on the noncrime variables generally have the expected signs. Population growth during the 1990s was higher in cities that had - relative to their regions - smaller percentages of black
This content downloaded from 128.135.12.127 on Sun, 29 Sep 2013 01:31:06 AMAll use subject to JSTOR Terms and Conditions
CRIME AND U.S. CITIES 35
TABLE 6 REGRESSION RESULTS: DEPENDENT
VARIABLE = CHANGE IN LOG(POPULATION), 1990-2000
Variable* Estimate Error ¿-Value Pr>|t|
Intercept -1.357° 0.371° -3.66° .000°
Change in crime rate, 1989-1994 -0.936° 0.395° -2.37° .019° Crime rate, 1990 0.172 0.328 0.52 .601
LN(Population), 1990 0.005 0.007 0.76 .446
Unemployment rate, 1990 0.225 0.521 0.43 .667 Median family income, 1990 0.000 0.000 0.89 .374
Percentage black, 1990 -0.322° 0.070° -4.62° <.0001°
Percentage age 17 and under, 1990 1.357° 0.377° 3.61° .001°
Percentage age 18 to 24, 1990 0.497 0.463 1.07 .285
Percentage age 25 to 44, 1990 1.033° 0.522° 1.98° .050°
Percentage age 45 to 64, 1990 1.145 0.845 1.36 .178
Percentage manufacturing, 1990 -0.014 0.151 -0.09 .929
July average daily temperature, 1994 0.005° 0.002° 2.37° .020°
January average daily temperature, 1994 0.001 0.001 -0.51 .610
Percentage with college degree, 1990 0.215 0.203 1.06 .291
Percentage home owners, 1990 -0.120 0.111 -1.08 .283 Annual precipitation, 2000 0.002° 0.001° 2.78° .006°
Percentage foreign-born, 1990 -0.172 0.114 -1.51 .133 New England -0.128° 0.054° -2.38° .019° Mid-Atlantic -0.085* 0.048* -1.79° .076* East North-Central -0.072 0.045 -1.62 .107 West North-Central -0.086* 0.050* -1.73* .086* South Atlantic -0.042 0.044 -0.96 .342 East South-Central -0.069 0.054 -1.28 .205 West South-Central -0.076* 0.043* -1.77* .080* Mountain 0.066 0.041 1.61 .111
fí-squared = .730 Adjusted fí-squared = .670
NOTE: Regressions weighted by 1990 state population. *p < .05. °°p < .01.
residents, larger percentages of children and adults of childbearing age, and warmer weather. The regional coefficients suggest that growth was slower in cit- ies in the Northeast, Mid-Atlantic, and West South-Central than it was in the Pacific region (omitted). Most critically for us, there is some evidence here that cities that experienced larger reductions in crime between 1989 and 1994 grew more rapidly between 1990 and 2000. Admittedly, however, this result is not fully robust. We do not see the same pattern when we try to explain population growth between 2000 and 2005, though the lack of result may be due to the fact that our city population estimates for 2005 are less accurate, taken as they are from the American Community Survey16 And even for the 1990s, when we change the
This content downloaded from 128.135.12.127 on Sun, 29 Sep 2013 01:31:06 AMAll use subject to JSTOR Terms and Conditions
36 THE ANNALS OF THE AMERICAN ACADEMY
period used to capture crime changes, the coefficients on crime change are not always statistically significant. Finally, it is important to note that our results do not prove causality. Still, we find weak evidence here that changes in crime were associated with city population growth, at least for the period during which crime dropped dramatically. There is little evidence that initial crime levels matter to growth.
It is perhaps not surprising that overall city population is not dramatically affected by crime. Changes in overall city population are driven by a multiplicity of forces, many of which are unlikely to be related to crime, including births, deaths, and migration from abroad. Moreover, this aggregate measure combines the two key residential decisions that we think are likely related to crime - retention and attraction - into a single net effect. In other work, we have examined these distinct channels separately and found that while lower crime rates do not enable cities to attract new residents, they do help them to retain a larger share of those residents who originally live in the central city and who remained in the metropolitan area. While not supporting an actual reversal of flight, this latter finding is completely consistent with abating flight. It also suggests that the reductions in crime in cities may have contributed to a shift in the distribution of the population within metropolitan areas.
Conclusion
The findings here show that crime rates fell dramatically in cities during the 1990s and the early years of the twenty-first century. City crime rates fell even more sharply than they did in the nation as a whole, and the absolute difference in crime rates in central cities and their surrounding suburbs was cut in half dur- ing this time. These relative reductions in crime appear to have contributed to the ability of cities to retain households who otherwise might move to the sub- urbs, although the measurable direct impact on overall city growth is modest at best. Beyond impacts on residential decision making, the reductions in crime did clearly change the geography of crime and dramatically reshape differential exposure to crime. Both at the city and neighborhood levels, we consistently found that the distribution of crime reductions was highly "progressive," with reductions disproportionately benefiting historically disadvantaged groups.
Notes 1. In many years, a few states did not report crime data at the city level. In addition, where monthly
data are not provided by the local reporting agency, the FBI uses an estimation procedure that relies on those months the agency does report. The HUD/FBI data does identify which annual crime rates are based on incomplete reporting data and whether the incomplete data are based on three to eleven months of reported data or fewer than three months.
2. We consider data for an agency to be complete in a given year if the annual crime rate is based on at least three months of actual data.
This content downloaded from 128.135.12.127 on Sun, 29 Sep 2013 01:31:06 AMAll use subject to JSTOR Terms and Conditions
CRIME AND U.S. CITIES 37
3. Only seven cities in the panel have a year in which estimates were used. 4. http://www.piton.org/index.cfm?fuseaction=CommunityFacts. Search. 5. Crime rates are reported per one thousand persons but have been adjusted to correspond to the
conventional reporting practice, per one hundred thousand. 6. httpy/neocando.case.edu/cando/index.jsp. 7. We found fairly similar patterns for a larger set of 429 central cities, which include cities for
which no suburban crime data are available. For consistency with the rest of the article, we focus on the 278 central cities for which we have crime data for their surrounding suburbs. Throughout the article, our reference to cities is to the central cities in our samples.
8. Note that our sample underrepresents cities in the Midwest. However, we have replicated this
analysis for the larger sample of 429 central cities, which is much more representative geographically, and the general patterns are the same.
9. Given that populations are mobile, and that past research shows that minority populations tend to
grow as crime rates climb, it is not necessarily true that poor and minority populations have differentially benefited from crime reductions.
10. The exposure rates are the average crime rate across cities, weighted by the share of each group residing in a city. This is a standard exposure rate, here measured for our entire sample rather than within a city or school.
11. While our crime data begin in 1992, because we need Census-based data on racial and poverty populations in cities, we are weighting 1992 crime rates by the 1990 Census population numbers.
12. We find similarly dramatic declines for all subgroups when violent and property crime are exam- ined separately.
13. Shapiro (2006) considered the potential role of local amenities, and specifically crime, more
directly. However, his work examined metropolitan-level outcomes. As noted earlier, the more likely ave- nue through which crime may well affect city population growth is through residential location decisions within metropolitan areas.
14. This model is very similar in structure to Cullen and Levitt (1999). 15. They also noted that relying on changes in crime rates has the benefit of minimizing differences in
reporting practices across police jurisdictions. 16. Results for 2000 through 2005 growth regression available from authors upon request.
References Bradford, David F. & Kelejian, Harry H., 1973. "An Econometric Model of the Flight to the Suburbs,"
Journal of Political Economy 81(3): 566-89 Cullen, J., and S. Levitt. 1999. Crime, urban flight, and the consequences for cities. Review of Economics
and Statistics 81 (2): 159-69. Ellen, Ingrid Gould, and Katherine O'Regan. 2009. Crime and urban flight revisited: The effect of the
1990s drop in crime on cities. Manuscript. Farley, J. 1987. Suburbanization and central-city crime rates: New evidence and a reinterpretation.
American Journal of Sociology 93 (3): 688-700. Federal Bureau of Investigations. 2006. Table 1: Crime in the United States 2005. http://www.ibi.gov/
ucr/05cius/data/table_01.html Frey, William. 1979. Central city white flight: racial and nonracial factors. American Sociological Review
44(3): 425-448. Glaeser, Edward, and Joshua Gottlieb. 2006. Urban resurgence and the consumer city. Urban Studies
43:1275-99. Glaeser, Edward, Jed Kolko, and Alberto Saiz. 2001. Consumer city. Journal of Economic Geography
1:27-50. Glaeser, Edward L., and Jesse M. Shapiro. 2001. City growth and the 2000 Census: Which places grew, and
why. The Brookings Institution Survey Series, Census 2000, Brookings Institution, Washington, DC. Grubb, W. N. 1982. The flight to the suburbs of population and employment, 1960-1970. Journal of Urban
Economics 11 (3): 348-67.
This content downloaded from 128.135.12.127 on Sun, 29 Sep 2013 01:31:06 AMAll use subject to JSTOR Terms and Conditions
38 THE ANNALS OF THE AMERICAN ACADEMY
Jargowsky, P., and Y. Park. 2006. Cause or consequence? Suburbanization and crime in U.S. metropolitan areas. Paper presented at Annual Conference, Association for Public Policy Analysis and Management, November.
Jordan, Stacy, John P. Ross, and Kurt G. Usowski. 1998. U.S. suburbanization in the 1980s. Regional Science and Urban Economics 28 (5): 611.
Iiska, Allen E., and Paul E. Bellair. 1995. Violent-crime rates and racial composition: Convergence over time. American Journal of Sociology 101 (3): 578.
Iiska, Allen E., John R. Logan, and Paul E. BeDair. 1998. Race and violent crime in the suburbs. American
Sociological Review 63 (1): 27. Logan, John R., and Brian J. Stults. 1999. Racial differences in exposure to crime: The city and suburbs of
Cleveland in 1990. Criminology 37 (2): 251. Mieszkowski, Peter, and Edwin S. Mills. 1993. The causes of metropolitan suburbanization. Journal of
Economic Perspectives 7 (3): 135. Mills, Edwin S. and Price, Richard. 1984. Metropolitan suburbanization and central city problems. Journal
of Urban Economics 15(1): 1-17. Shapiro, Jesse. 2006. Smart cities: Quality of life, productivity, and the growth effects of human capital.
Review of Economics and Statistics 88(2): 324-335 South, S., and K. Crowder. 1997. Residential mobility between cities and suburbs: Race, suburbanization,
and back-to-city moves. Demography 34 (4): 525-38.
This content downloaded from 128.135.12.127 on Sun, 29 Sep 2013 01:31:06 AMAll use subject to JSTOR Terms and Conditions