Embed Size (px)
Citation preview
The “Shale Revolution” Myths and Realities
Trans-Atlantic Energy DialogueWashington, DC
December 10, 2013
J. David Hughes
Global Sustainability Research Inc.
Post Carbon Institute1
Conventional Wisdom
• The United States is on the verge of Energy Independence thanks to the “SHALE REVOLUTION”.
• Shale Gas production will continue to grow for the foreseeable future (2040 at least) and prices will remain below $4.50/mcf for the next 10 years and below $6.00/mcf for the next 20 years.
• The way is clear for U.S. LNG exports to monetize the shale bounty. Large scale LNG exports of shale gas from Canada will provide a bonanza.
• Tight Oil will allow U.S. production to exceed that of Saudi Arabia and U.S. imports will shrink to zero.
© Hughes GSR Inc, 2013
2

2010
2012
2014
2016
2018
2020
2022
2024
2026
2028
2030
2032
2034
2036
2038
2040
0
5
10
15
20
25
30
35LNG Imports Canada Imports Shale GasAlaska Coalbed Methane Tight GasAssociated Conventional Offshore
Year
Tri
llio
n C
ub
ic F
ee
t p
er
Ye
ar
U.S. Natural Gas Supply Projection by Source, 2010-2040, EIA Reference Case 2013
Canadian Imports
Shale Gas(+105% 2012-2040)
Coalbed Methane
50% o
f 2040 Pro
du
ction
55% increase inproduction by 2040
Tight Gas
Conventional
Offshore
Associated
Alaska
U.S. domestic consumption
Exports
(data from EIA Annual Energy Outlook 2013, Tables 13 and 14, http://www.eia.gov/forecasts/aeo/er/excel/yearbyyear.xlsx)© Hughes GSR Inc, 2013
3

2010
2012
2014
2016
2018
2020
2022
2024
2026
2028
2030
2032
2034
2036
2038
2040
0
1
2
3
4
5
6
7
8
9AlaskaOnshore EOROnshore Shale/Tight OilLower-48 Onshore Conventional Lower-48 Offshore
Year
Mil
lio
n B
arr
els
pe
r D
ay
Shale/Tight Oil
Lower-48 Offshore
Alaska
Lower-48 Onshore Conventional Production
Onshore EOR
32% o
f 2040 Su
pp
lyU.S. Crude Oil Production Projection by Source and
Region 2010-2040 (EIA 2013 Reference Case)
Peak Production 2019
© Hughes GSR Inc, 2013 (data from EIA Annual Energy Outlook 2013)
4
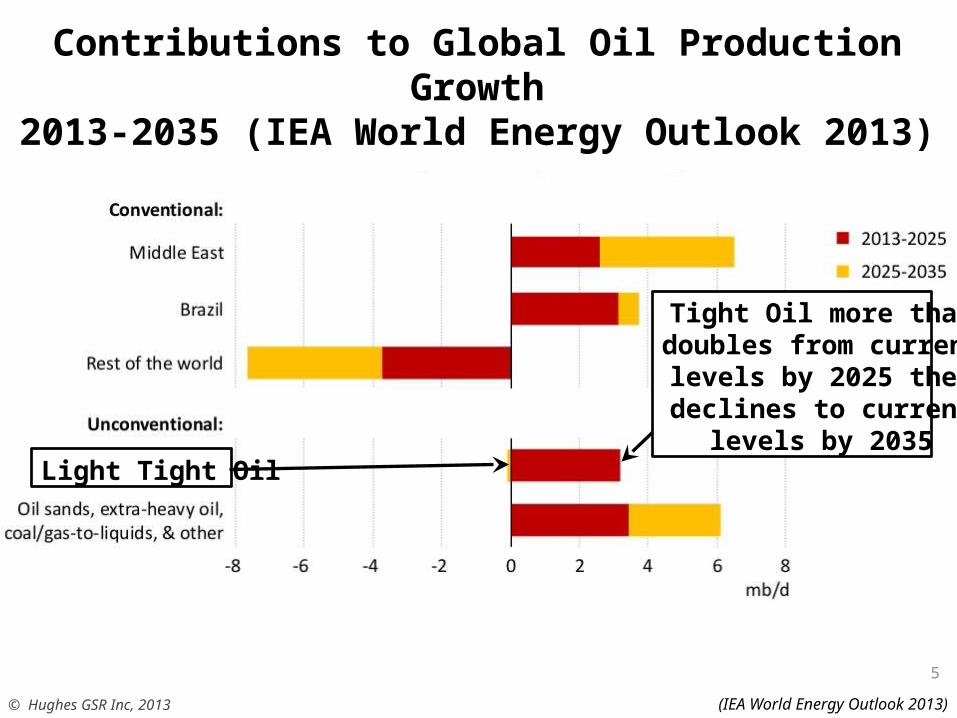
Contributions to Global Oil Production Growth2013-2035 (IEA World Energy Outlook 2013)
© Hughes GSR Inc, 2013 (IEA World Energy Outlook 2013)
Tight Oil more thandoubles from currentlevels by 2025 thendeclines to current
levels by 2035Light Tight Oil
5

2007 2008 2009 2010 2011 2012 20130
5
10
15
20
25
30
35
Marcellus (PA and WV)Bakken (ND)Eagle Ford (TX)Antrim (MI, IN, and OH)Rest of U.S.Woodford (OK)Fayetteville (AR)Haynesville (LA and TX)
Year
Gas
Pro
du
ctio
n (
Bil
lio
n c
ub
ic f
eet
per
day
)
Peak Excluding Marcellusoccurred August 2012
Now Down 5%
U.S. Shale Gas Production from EIA data, 2007 - June, 2013
(data from DI Desktop, HPDI, September, 2012)
© Hughes GSR Inc, 2013 (data from EIA, 2013, http://www.eia.gov/naturalgas/weekly/img/ShaleGas-201306.xlsx)
42% of U.S. Production
Peak Excluding Marcellusand tight oil plays
occurred November 2011Now Down 12% Marcellus
Haynesville
Barnett
Eagle Ford
6

2007 2008 2009 2010 2011 2012 20130
500
1000
1500
2000
2500
3000
3500
4000
Eagle FordBakkenHaynesvilleMarcellusPermianNiobrara
Year
Oil
Pro
du
ctio
n (
Th
ou
san
d B
arre
ls p
er D
ay)
Tight Oil, NG Liquids and Conventional Production from Six Plays, 2007- June, 2013 (EIA DPR Report, 2013)
© Hughes GSR Inc, 2013 (data from EIA DPR report December, 2012)
Eagle Ford
Bakken
Permian Basin
7

2007 2008 2009 2010 2011 2012 20130
500
1000
1500
2000
2500
Eagle FordBakkenHaynesvilleMarcellusPermianNiobrara
Year
Oil
Pro
du
ctio
n (
Th
ou
san
d B
arre
ls p
er D
ay)
U.S. Tight OilProduction NowAbout 2.3 mbd
Tight Oil Production from Six Plays, 2007- June, 2013(EIA DPR Report, 2013) - Excludes NGLs and Conventional
© Hughes GSR Inc, 2013 (data from EIA DPR report December, 2013)
Eagle Ford
Bakken
8
9
Marcellus
Haynesville
Barnett
Eagle Ford
Fayetteville
Woodford
Bakken
Antrim
Rest of U
.S.0
1
2
3
4
5
6
7
8
9
10
Shale Play
Bil
lio
n C
ub
ic F
ee
t p
er
Da
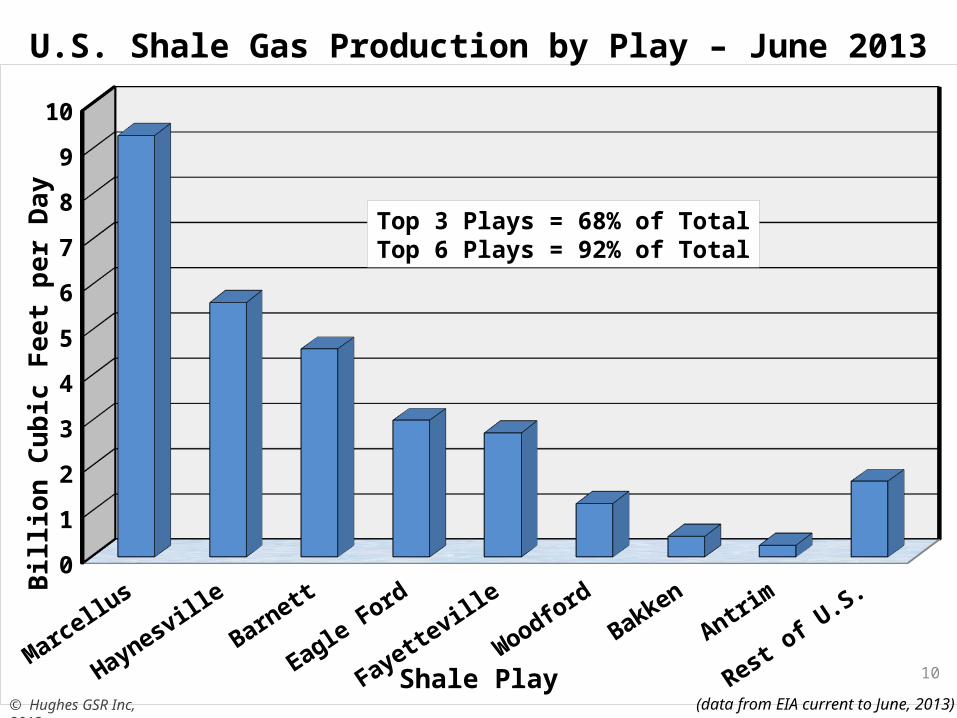
yU.S. Shale Gas Production by Play – June 2013
(data from EIA current to June, 2013)
Top 3 Plays = 68% of TotalTop 6 Plays = 92% of Total
© Hughes GSR Inc, 2013
10

Bakken
Eagle Ford
Permian Basin
Niobrara
Haynesville
Marcellus
Rest of U
.S.0
100
200
300
400
500
600
700
800
900
Shale Play
Th
ou
sa
nd
Ba
rre
ls p
er
Da
yU.S. Tight Oil Production by Play – June 2013
(data from EIA current to June, 2013 – excludes NGLs and conventional production)
Top 2 Plays = 74% of TotalTop 4 Plays = 85% of Total
© Hughes GSR Inc, 2013
11

The Shale Play Life Cycle
• Discovery followed by leasing frenzy.
• Drilling boom follows to meet “held-by-production” lease requirements.
• Sweet spots identified, targeted and drilled off.
• Production rises rapidly and is maintained for cash-flow despite potentially uneconomic full-cycle costs.
• Sweet spots become saturated and well quality and field production decline.
• Plays like the Haynesville become middle aged after just five years.
© Hughes GSR Inc, 2012
12

13
2006 2007 2008 2009 2010 2011 2012 20130
1
2
3
4
5
6
7
8
9
0
500
1000
1500
2000
2500
3000
3500
4000
Gas ProductionNumber of Wells
Year
Gas
Pro
du
ctio
n (
Bil
lio
n c
ub
ic f
eet
per
day
)N
um
ber o
f Op
erating
Wells
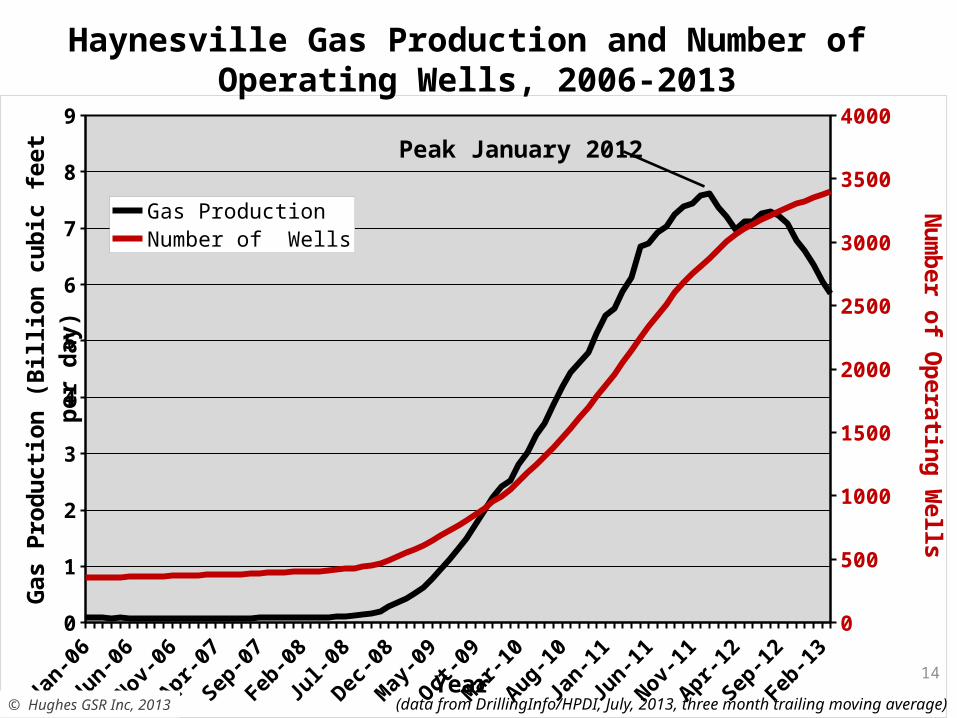
Haynesville Gas Production and Number of Operating Wells, 2006-2013
(data from DI Desktop, HPDI, September, 2012)
© Hughes GSR Inc, 2013 (data from DrillingInfo/HPDI, July, 2013, three month trailing moving average)
Peak January 2012
14

1 4 7 10 13 16 19 22 25 28 31 34 37 40 43 460
1000
2000
3000
4000
5000
6000
7000
8000
Months on Production
Gas
Pro
du
ctio
n
(Th
ou
san
d c
ub
ic f
eet
per
Day
)Haynesville Type Gas Well Decline Curve
(data from DrillingInfo/HPDI, March, 2013)
Yearly DeclinesFirst year = 66%
Second year = 49%Third year = 41%
Fourth year = 49%
© Hughes GSR Inc, 2013
3-Year Decline = 89%
15

2007 2008 2009 2010 2011 20120
1
2
3
4
5
6
7
8
0
500
1000
1500
2000
2500
3000
3500
4000
Production from pre-2012 WellsNumber of pre-2012 Wells
Year
Gas
Pro
du
ctio
n (
Bil
lio
n c
ub
ic f
eet
per
Day
)N
um
ber o
f Op
erating
pre-2012 W
ellsOverall Field Decline for Haynesville Gas Production
based on Production Decline from pre-2012 Wells
(data from DI Desktop, HPDI, September, 2012)
Overall Field Decline = 47%
© Hughes GSR Inc, 2013 (data from DrillingInfo/HPDI, March, 2013)
16
1 4 7 10 13 16 19 22 25 28 31 34 37 40 43 460
1000
2000
3000
4000
5000
6000
7000
8000
HaynesvilleMarcellusBarnettFayettevilleWoodford
Months on Production
Gas
Pro
du
ctio
n
(Th
ou
san
d c
ub
ic f
eet
per
Day
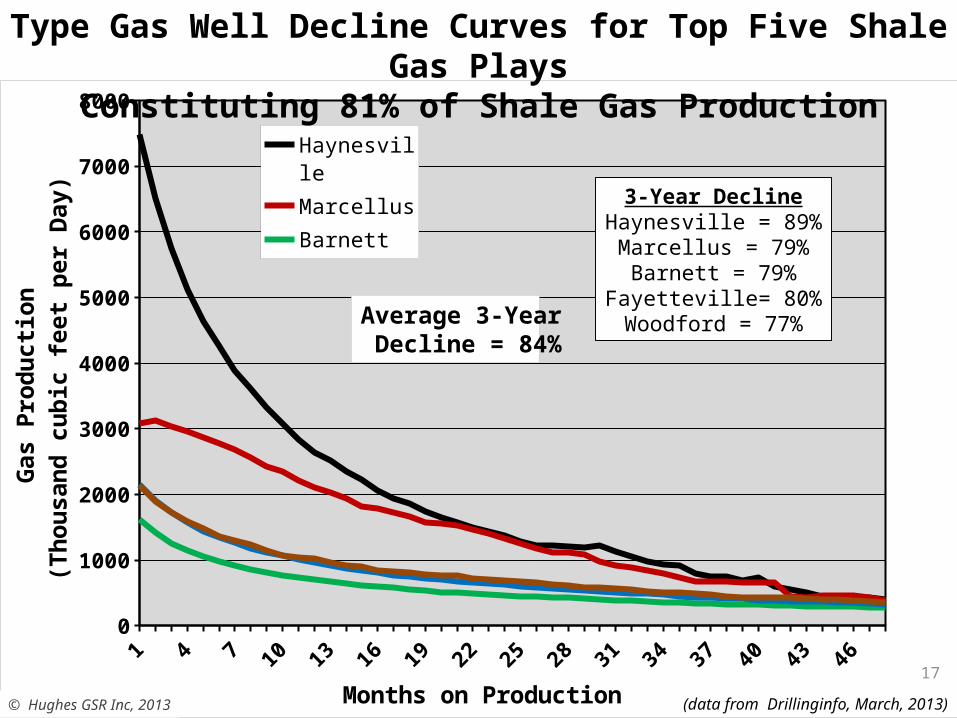
)Type Gas Well Decline Curves for Top Five Shale Gas Plays
Constituting 81% of Shale Gas Production
(data from Drillinginfo, March, 2013)
3-Year DeclineHaynesville = 89%Marcellus = 79%Barnett = 79%
Fayetteville= 80%Woodford = 77%
© Hughes GSR Inc, 2013
Average 3-Year Decline = 84%
17

2008 2009 2010 2011 20120
1
2
3
4
5
6
7
8
HaynesvilleMarcellusBarnettFayettevilleWoodford
Year
Gas
Pro
du
ctio
n (
Bil
lio
n c
ub
ic f
eet
per
Day
)Overall Field Decline for Top Five Shale Gas Playsbased on Production Decline from pre-2012 Wells
(data from DI Desktop, HPDI, September, 2012)
Field Decline (per year)Haynesville = 47%Marcellus = 29%Barnett = 28%
Fayetteville = 35%Woodford = 44%
© Hughes GSR Inc, 2013 (data from Drillinginfo, March, 2013)
Average Field Decline = 37%
18
2006 2007 2008 2009 2010 2011 2012 20130
1
2
3
4
5
6
7
8
9
Barnett
Fayetteville
Woodford
Haynesville
PA Marcellus
WV Marcellus
Year
Gas
Pro
du
ctio
n (
Bil
lio
n c
ub
ic f
eet
per
day
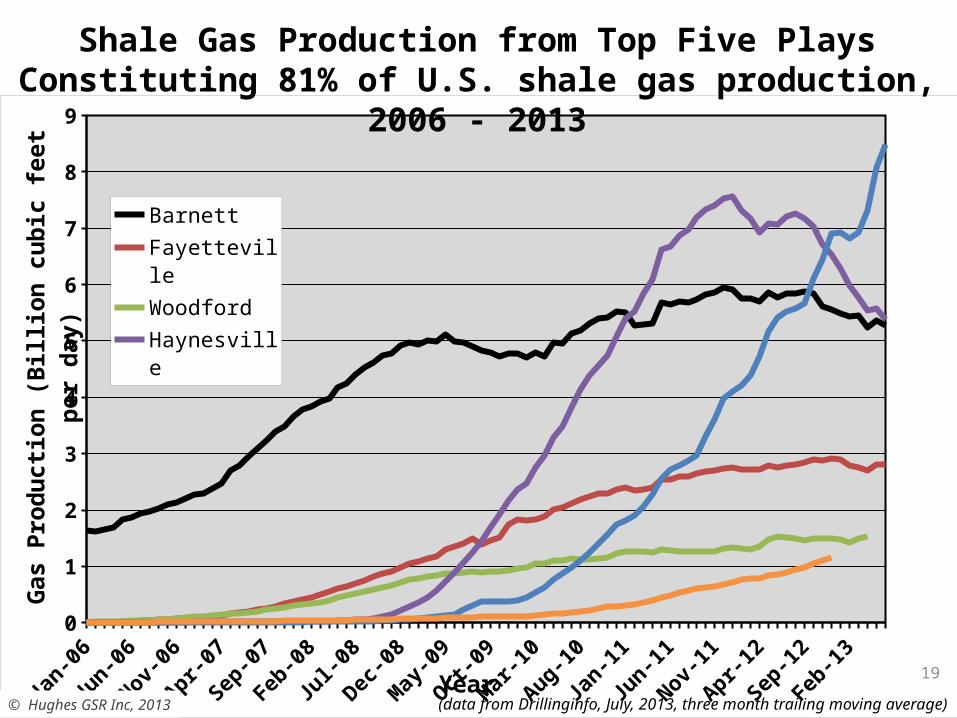
)Shale Gas Production from Top Five Plays Constituting
81% of U.S. shale gas production, 2006 - 2013
(data from DI Desktop, HPDI, September, 2012)
© Hughes GSR Inc, 2013 (data from Drillinginfo, July, 2013, three month trailing moving average)
19
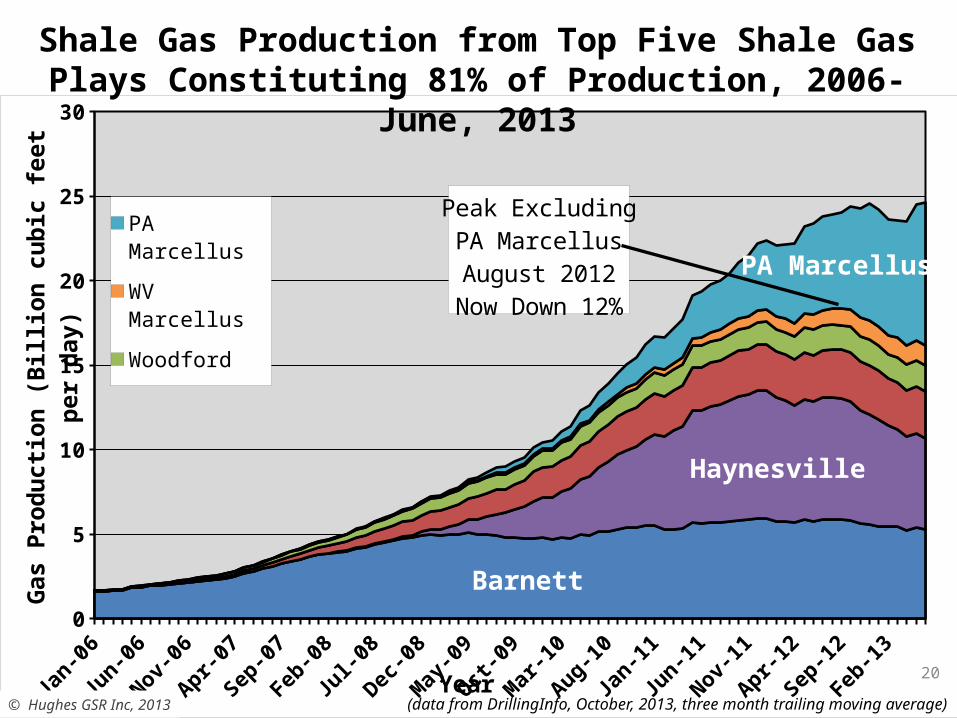
2006 2007 2008 2009 2010 2011 2012 20130
5
10
15
20
25
30
PA Marcellus
WV Marcellus
Woodford
Fayetteville
Haynesville
Barnett
Year
Gas
Pro
du
ctio
n (
Bil
lio
n c
ub
ic f
eet
per
day
)
Peak ExcludingPA MarcellusAugust 2012
Now Down 12%
Shale Gas Production from Top Five Shale Gas Plays Constituting 81% of Production, 2006-June, 2013
© Hughes GSR Inc, 2013 (data from DrillingInfo, October, 2013, three month trailing moving average)
Haynesville
Barnett
PA Marcellus
20
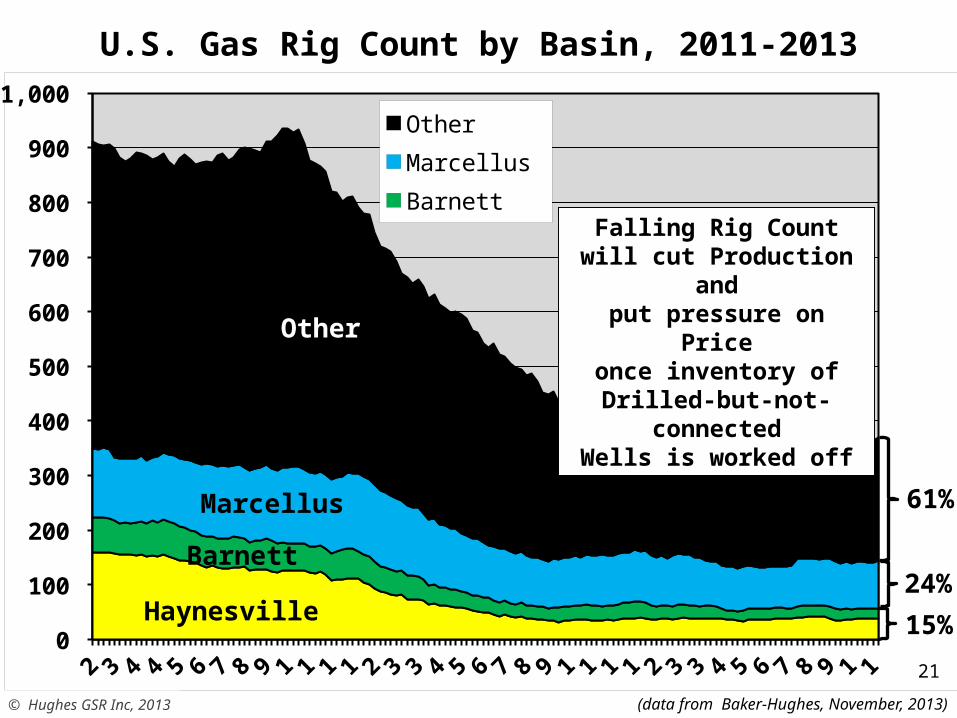
Feb, 11 Jun, 11 Oct, 11 Feb, 12 Jun, 12 Oct, 12 Feb, 13 Jun, 13 Oct, 130
100
200
300
400
500
600
700
800
900
1,000 OtherMarcellusBarnettHaynesville
Haynesville
Other
(data from Baker-Hughes, November, 2013)© Hughes GSR Inc, 2013
U.S. Gas Rig Count by Basin, 2011-2013
Barnett
Marcellus 61%
24%
15%
Falling Rig Countwill cut Production andput pressure on Price
once inventory ofDrilled-but-not-connected
Wells is worked off
21
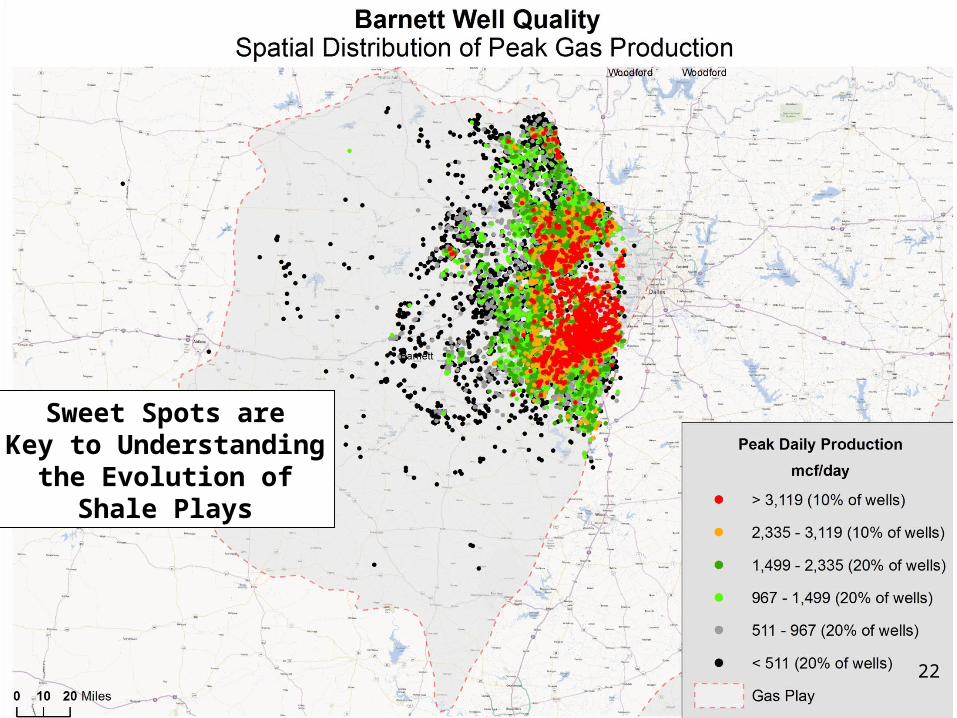
Sweet Spots areKey to Understanding
the Evolution ofShale Plays
22
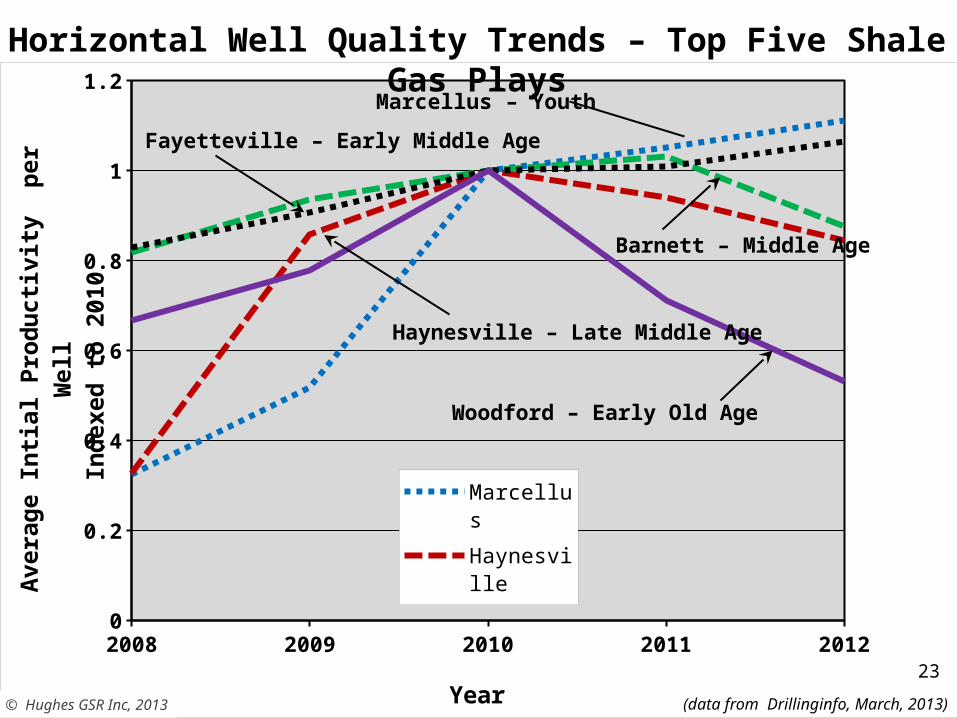
2008 2009 2010 2011 20120
0.2
0.4
0.6
0.8
1
1.2
MarcellusHaynesvilleBarnettFayettevilleWoodford
Year
Ave
rag
e In
tial
Pro
du
ctiv
ity
per
Wel
lIn
dex
ed t
o 2
010
Marcellus – Youth
Horizontal Well Quality Trends – Top Five Shale Gas Plays
(data from DI Desktop, HPDI, September, 2012)
© Hughes GSR Inc, 2013 (data from Drillinginfo, March, 2013)
Fayetteville – Early Middle Age
Barnett – Middle Age
Haynesville – Late Middle Age
Woodford – Early Old Age
23

Feb, 11 Jun, 11 Oct, 11 Feb, 12 Jun, 12 Oct, 12 Feb, 13 Jun, 13 Oct, 130
200
400
600
800
1,000
1,200
1,400
1,600 OtherPermianEagle FordWilliston (Bakken)
Williston (Bakken)
Other
(data from Baker-Hughes, November, 2013)© Hughes GSR Inc, 2013
U.S. Oil Rig Count by Basin, 2011-2013
Permian Basin
Eagle Ford
40%
33%
14%
13%
24

2005 2006 2007 2008 2009 2010 2011 2012 20130
100
200
300
400
500
600
700
800
900
0
1000
2000
3000
4000
5000
6000
7000
Oil ProductionNumber of Wells
Year
Oil
Pro
du
ctio
n (
Th
ou
san
d B
arre
ls/d
ay)
Nu
mb
er of P
rod
ucin
g W
ellsBakken/Three Forks Oil Production and Number of
Operating Wells, 2005- June 2013
© Hughes GSR Inc, 2013 (data from Drillinginfo, October, 2013, three month trailing moving average)
25

1 3 5 7 9 11 13 15 17 19 21 23 25 27 29 31 33 35 37 39 41 43 45 470
100
200
300
400
500
600
Oil Production
Months on Production
Oil
Pro
du
ctio
n (
Bar
rels
per
Day
)Bakken/Three Forks Type Oil and Barrels of Oil Equivalent Well Decline Curves Including Montana and North Dakota
(data from Drillinginfo, October, 2013)© Hughes GSR Inc, 2013
Oil DeclineFirst Year = 70%
Second Year = 34%Third Year = 23%
Fourth Year = 21%
3-Year Decline = 84%
26
2007 2008 2009 2010 2011 2012 20130
100
200
300
400
500
600
700
0
500
1000
1500
2000
2500
3000
3500
4000
4500
5000
Total Oil ProductionNumber of pre-2012 Wells
Year
Oil
Pro
du
ctio
n (
Th
ou
san
d B
arre
ls/d
ay)
Nu
mb
er of P
rod
ucin
g W
ells
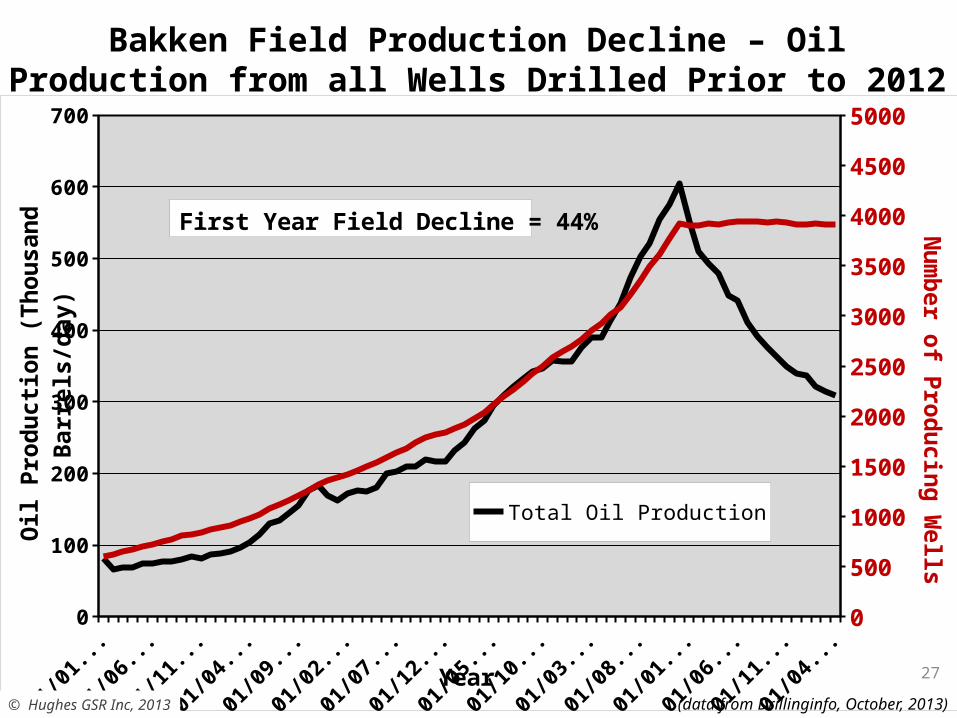
First Year Field Decline = 44%
Bakken Field Production Decline – Oil Production from all Wells Drilled Prior to 2012
© Hughes GSR Inc, 2013 (data from Drillinginfo, October, 2013)
27
28

0
50
100
150
200
250
County
Pro
du
ctio
n (
Th
ou
san
d B
arre
ls
per
day
)Bakken/Three Forks Production By County,
North Dakota and Montana, June, 2013
Total Production = 787 Kbbls/dayTop 2 counties = 52% of productionTop 4 counties = 85% of production
© Hughes GSR Inc, 2013 (data from Drillinginfo, October, 2013)
29
1 3 5 7 9 11 13 15 17 19 21 23 25 27 29 31 33 35 37 39 41 43 45 470
100
200
300
400
500
600
700
Divide (ND)Dunn (ND)McKenzie (ND)Mountrail (ND)Williams (ND)Other ND CountiesRichland (MT)Other MT Counties
Months on Production
Oil
Pro
du
ctio
n (
Bar
rels
per
Day
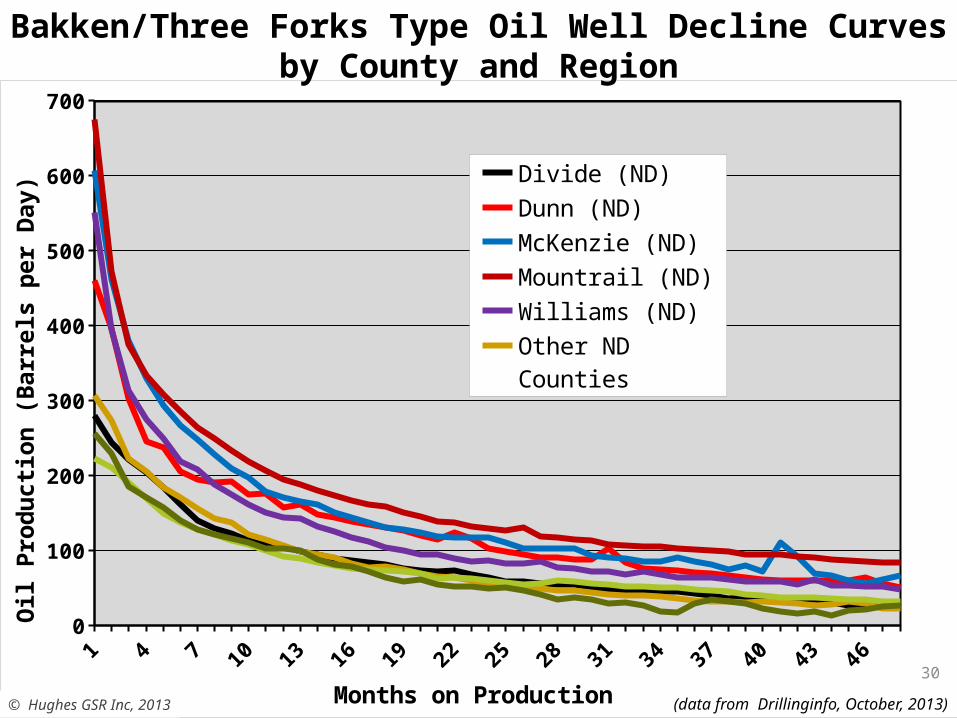
)Bakken/Three Forks Type Oil Well Decline Curves
by County and Region
(data from Drillinginfo, October, 2013)© Hughes GSR Inc, 2013
30
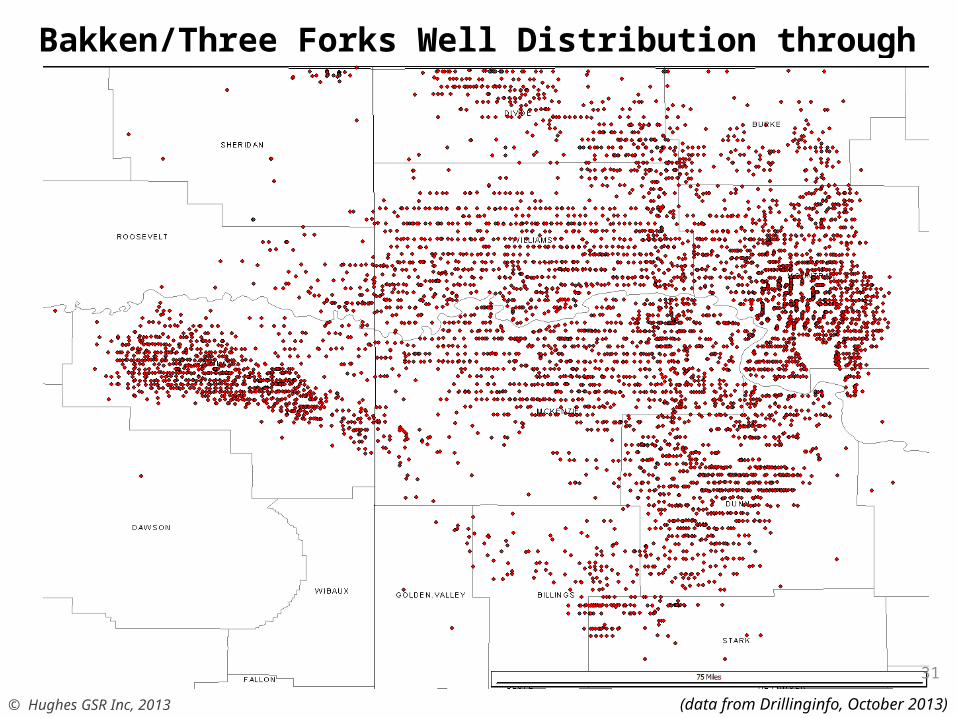
Bakken/Three Forks Well Distribution through mid-2013
© Hughes GSR Inc, 2013 (data from Drillinginfo, October 2013)
31
2005
2007
2009
2011
2013
2015
2017
2019
2021
2023
2025
2027
2029
2031
2033
2035
0
200
400
600
800
1000
1200
0
5000
10000
15000
20000
25000
30000
Risked Total Oil Produc-tion
Year
Oil
Pro
du
ctio
n (
Th
ou
san
d B
arre
ls/d
ay)
Nu
mb
er of P
rod
ucin
g W
ells
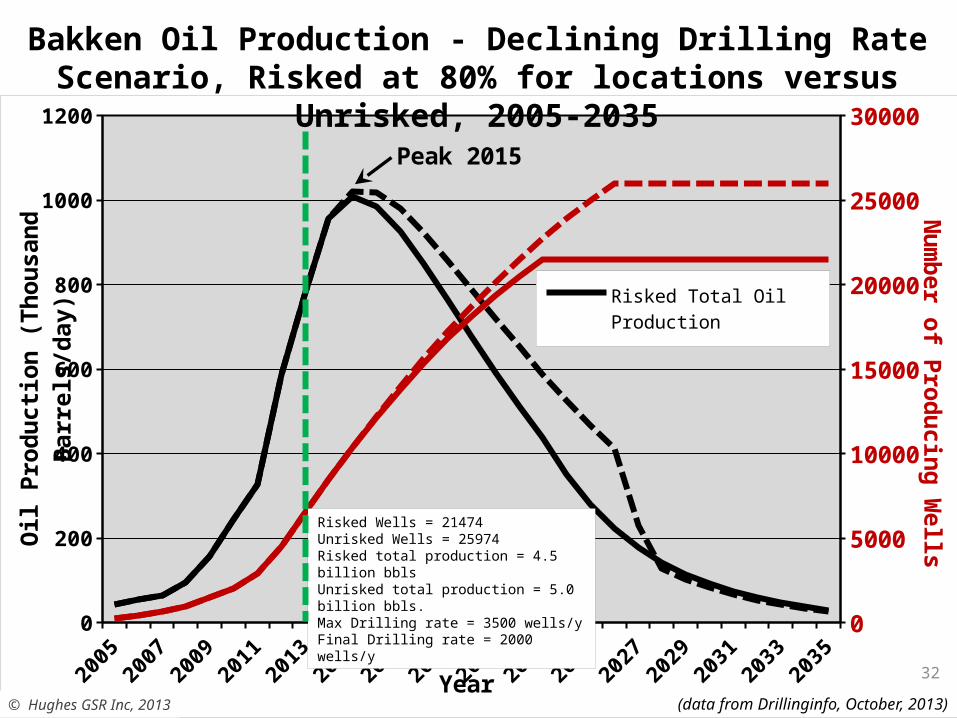
Peak 2015
Bakken Oil Production - Declining Drilling Rate Scenario, Risked at 80% for locations versus Unrisked, 2005-2035
© Hughes GSR Inc, 2013 (data from Drillinginfo, October, 2013)
Risked Wells = 21474Unrisked Wells = 25974Risked total production = 4.5 billion bblsUnrisked total production = 5.0 billion bbls.Max Drilling rate = 3500 wells/yFinal Drilling rate = 2000 wells/y
32
2005
2007
2009
2011
2013
2015
2017
2019
2021
2023
2025
2027
2029
2031
2033
2035
0
500
1000
1500
2000
2500
Eagle Ford Risked ProductionBakken Risked Production
Year
Oil
Pro
du
ctio
n (
Th
ou
san
d B
arre
ls/d
ay)
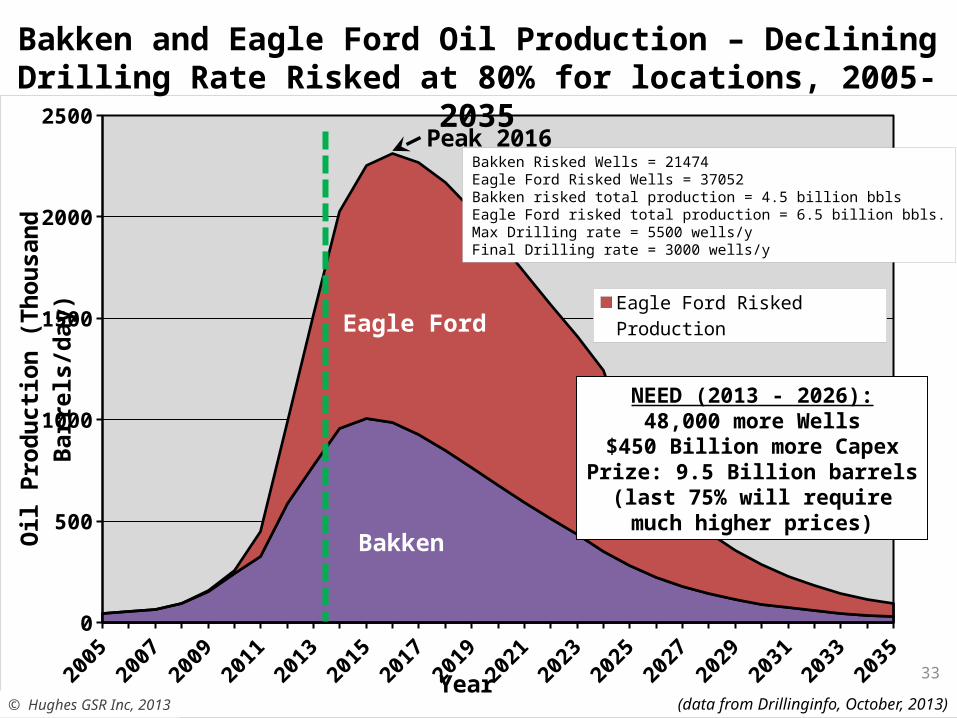
Peak 2016
Bakken and Eagle Ford Oil Production – Declining Drilling Rate Risked at 80% for locations, 2005-2035
© Hughes GSR Inc, 2013 (data from Drillinginfo, October, 2013)
Bakken Risked Wells = 21474Eagle Ford Risked Wells = 37052Bakken risked total production = 4.5 billion bblsEagle Ford risked total production = 6.5 billion bbls.Max Drilling rate = 5500 wells/yFinal Drilling rate = 3000 wells/y
Eagle Ford
Bakken
NEED (2013 - 2026):48,000 more Wells
$450 Billion more CapexPrize: 9.5 Billion barrels
(last 75% will requiremuch higher prices)
33
• Shale gas production in several top plays is declining and tight oil production from the top two plays is likely to peak in the 2016-2017 timeframe
• High well- and field-decline rates mandate sustained high levels of drilling to maintain production.
• Sweet spots become exhausted early on in field development hence drilling rates must continually escalate to maintain production levels.
• Liquids production with associated gas has allowed gas production to remain stable – for now – but long term sustainability is questionable.
• High quality shale plays are not ubiquitous:
• 68% of shale gas production comes from 3 plays.
• 74% of tight oil production comes from 2 plays.
• Environmental concerns with fracking are widespread and will likely escalate with the escalating drilling treadmill needed to maintain, let alone grow, shale gas and oil production.
Shale Takeaways
© Hughes GSR Inc, 2013
34