Embed Size (px)
Citation preview
ALSWH Data Dictionary Supplement
Section 2 Core Survey Dataset 2.3 Health-related Quality of Life Variables
SF-36
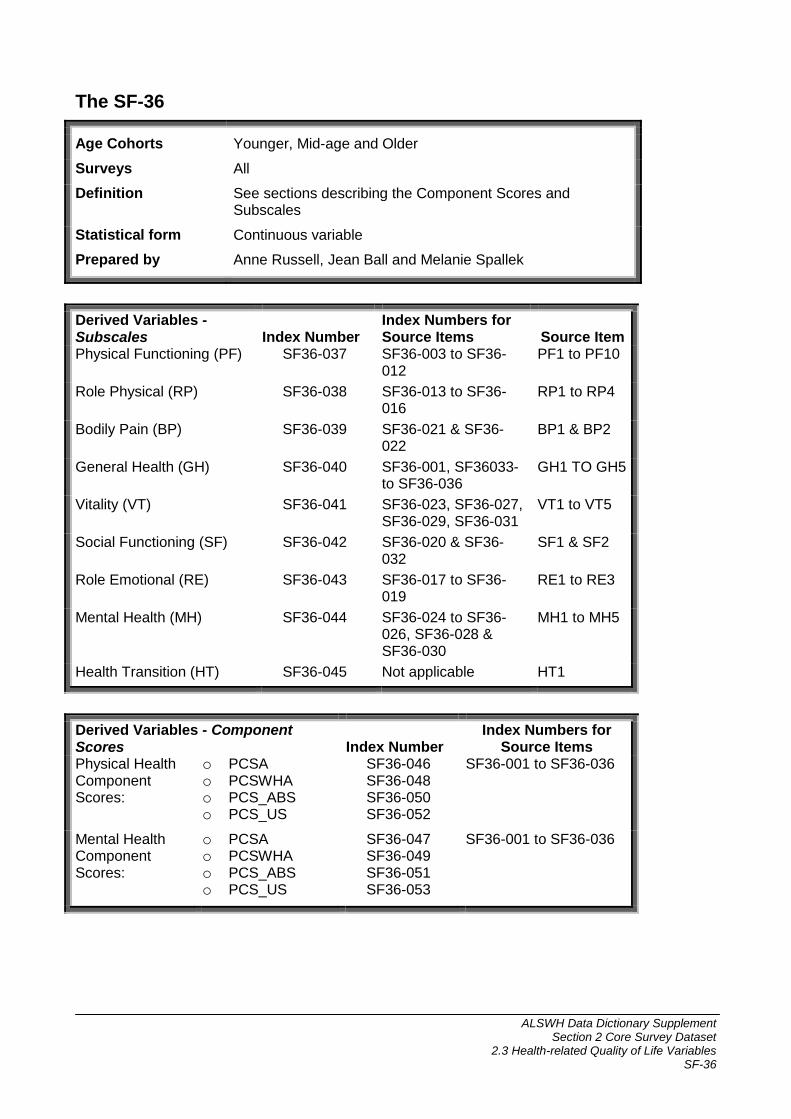
The SF-36
Age Cohorts Younger, Mid-age and Older
Surveys All
Definition See sections describing the Component Scores and Subscales
Statistical form Continuous variable
Prepared by Anne Russell, Jean Ball and Melanie Spallek
Derived Variables - Subscales Index Number
Index Numbers for Source Items Source Item
Physical Functioning (PF) SF36-037 SF36-003 to SF36-012
PF1 to PF10
Role Physical (RP) SF36-038 SF36-013 to SF36-016
RP1 to RP4
Bodily Pain (BP) SF36-039 SF36-021 & SF36-022
BP1 & BP2
General Health (GH) SF36-040 SF36-001, SF36033- to SF36-036
GH1 TO GH5
Vitality (VT) SF36-041 SF36-023, SF36-027, SF36-029, SF36-031
VT1 to VT5
Social Functioning (SF) SF36-042 SF36-020 & SF36-032
SF1 & SF2
Role Emotional (RE) SF36-043 SF36-017 to SF36-019
RE1 to RE3
Mental Health (MH) SF36-044 SF36-024 to SF36-026, SF36-028 & SF36-030
MH1 to MH5
Health Transition (HT) SF36-045 Not applicable HT1
Derived Variables - Component Scores Index Number
Index Numbers for Source Items
Physical Health Component Scores:
o PCSA o PCSWHA o PCS_ABS o PCS_US
SF36-046 SF36-048 SF36-050 SF36-052
SF36-001 to SF36-036
Mental Health Component Scores:
o PCSA o PCSWHA o PCS_ABS o PCS_US
SF36-047 SF36-049 SF36-051 SF36-053
SF36-001 to SF36-036
ALSWH Data Dictionary Supplement
Section 2 Core Survey Dataset 2.3 Health-related Quality of Life Variables
SF-36
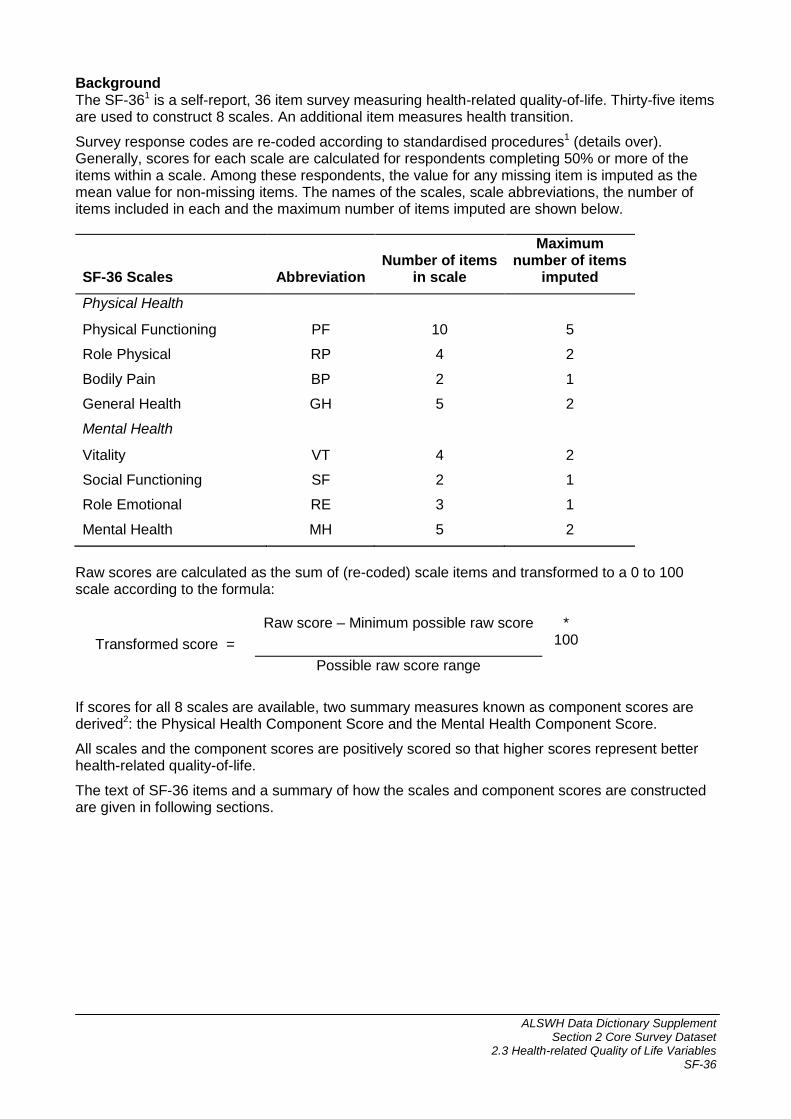
Background The SF-361 is a self-report, 36 item survey measuring health-related quality-of-life. Thirty-five items are used to construct 8 scales. An additional item measures health transition.
Survey response codes are re-coded according to standardised procedures1 (details over). Generally, scores for each scale are calculated for respondents completing 50% or more of the items within a scale. Among these respondents, the value for any missing item is imputed as the mean value for non-missing items. The names of the scales, scale abbreviations, the number of items included in each and the maximum number of items imputed are shown below.
SF-36 Scales Abbreviation Number of items
in scale
Maximum number of items
imputed
Physical Health
Physical Functioning PF 10 5
Role Physical RP 4 2
Bodily Pain BP 2 1
General Health GH 5 2
Mental Health
Vitality VT 4 2
Social Functioning SF 2 1
Role Emotional RE 3 1
Mental Health MH 5 2
Raw scores are calculated as the sum of (re-coded) scale items and transformed to a 0 to 100 scale according to the formula:
Transformed score =
Raw score – Minimum possible raw score * 100
Possible raw score range
If scores for all 8 scales are available, two summary measures known as component scores are derived2: the Physical Health Component Score and the Mental Health Component Score.
All scales and the component scores are positively scored so that higher scores represent better health-related quality-of-life.
The text of SF-36 items and a summary of how the scales and component scores are constructed are given in following sections.
ALSWH Data Dictionary Supplement
Section 2 Core Survey Dataset 2.3 Health-related Quality of Life Variables
SF-36 – Physical Functioning
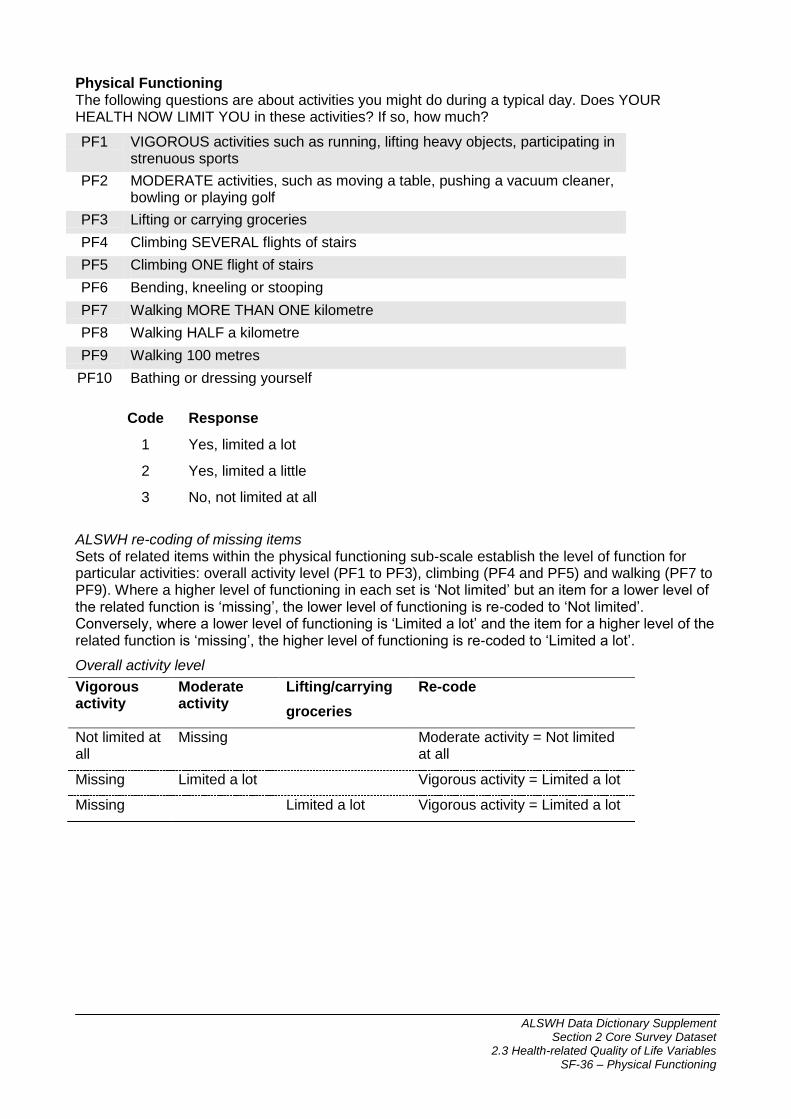
Physical Functioning The following questions are about activities you might do during a typical day. Does YOUR HEALTH NOW LIMIT YOU in these activities? If so, how much?
PF1 VIGOROUS activities such as running, lifting heavy objects, participating in strenuous sports
PF2 MODERATE activities, such as moving a table, pushing a vacuum cleaner, bowling or playing golf
PF3 Lifting or carrying groceries
PF4 Climbing SEVERAL flights of stairs
PF5 Climbing ONE flight of stairs
PF6 Bending, kneeling or stooping
PF7 Walking MORE THAN ONE kilometre
PF8 Walking HALF a kilometre
PF9 Walking 100 metres
PF10 Bathing or dressing yourself
Code Response
1 Yes, limited a lot
2 Yes, limited a little
3 No, not limited at all
ALSWH re-coding of missing items Sets of related items within the physical functioning sub-scale establish the level of function for particular activities: overall activity level (PF1 to PF3), climbing (PF4 and PF5) and walking (PF7 to PF9). Where a higher level of functioning in each set is ‘Not limited’ but an item for a lower level of the related function is ‘missing’, the lower level of functioning is re-coded to ‘Not limited’. Conversely, where a lower level of functioning is ‘Limited a lot’ and the item for a higher level of the related function is ‘missing’, the higher level of functioning is re-coded to ‘Limited a lot’.
Overall activity level
Vigorous activity
Moderate activity
Lifting/carrying
groceries
Re-code
Not limited at all
Missing Moderate activity = Not limited at all
Missing Limited a lot Vigorous activity = Limited a lot
Missing Limited a lot Vigorous activity = Limited a lot
ALSWH Data Dictionary Supplement
Section 2 Core Survey Dataset 2.3 Health-related Quality of Life Variables
SF-36 – Physical Functioning
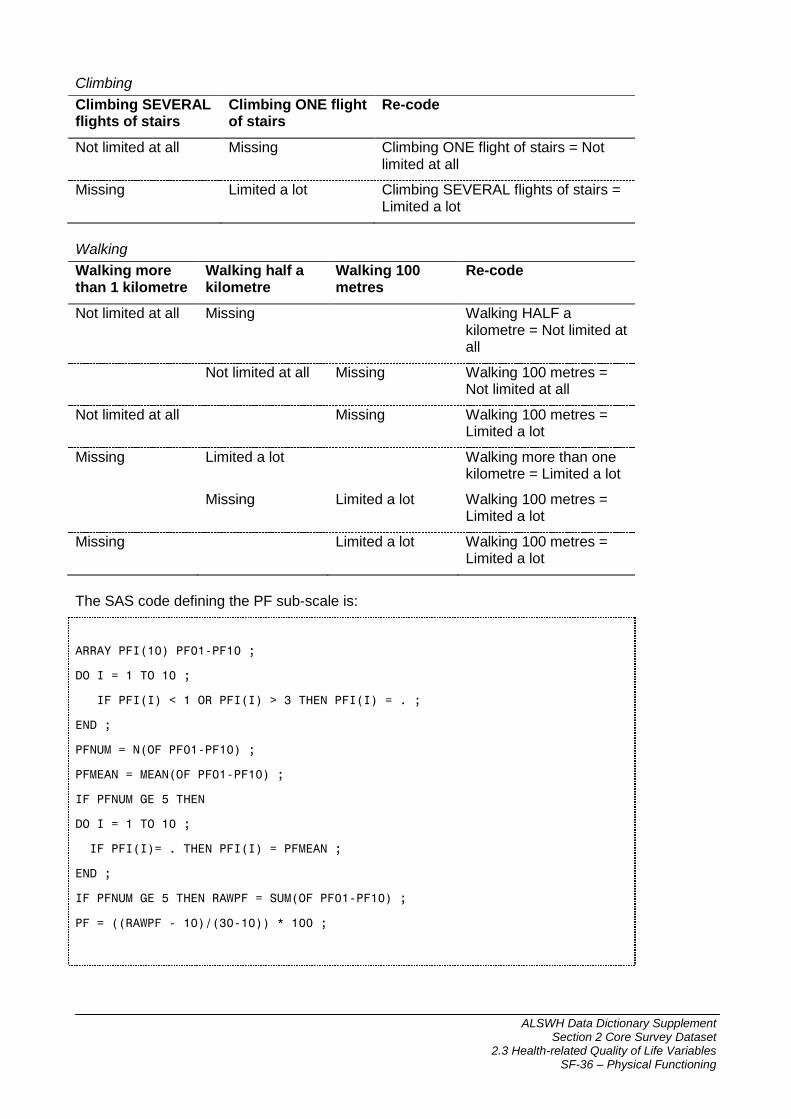
Climbing
Climbing SEVERAL flights of stairs
Climbing ONE flight of stairs
Re-code
Not limited at all Missing Climbing ONE flight of stairs = Not limited at all
Missing Limited a lot Climbing SEVERAL flights of stairs = Limited a lot
Walking
Walking more than 1 kilometre
Walking half a kilometre
Walking 100 metres
Re-code
Not limited at all Missing Walking HALF a kilometre = Not limited at all
Not limited at all Missing Walking 100 metres = Not limited at all
Not limited at all Missing Walking 100 metres = Limited a lot
Missing Limited a lot Walking more than one kilometre = Limited a lot
Missing Limited a lot Walking 100 metres = Limited a lot
Missing Limited a lot Walking 100 metres = Limited a lot
The SAS code defining the PF sub-scale is:
ARRAY PFI(10) PF01-PF10 ;
DO I = 1 TO 10 ;
IF PFI(I) < 1 OR PFI(I) > 3 THEN PFI(I) = . ;
END ;
PFNUM = N(OF PF01-PF10) ;
PFMEAN = MEAN(OF PF01-PF10) ;
IF PFNUM GE 5 THEN
DO I = 1 TO 10 ;
IF PFI(I)= . THEN PFI(I) = PFMEAN ;
END ;
IF PFNUM GE 5 THEN RAWPF = SUM(OF PF01-PF10) ;
PF = ((RAWPF - 10)/(30-10)) * 100 ;
ALSWH Data Dictionary Supplement
Section 2 Core Survey Dataset 2.3 Health-related Quality of Life Variables
SF-36 – Role Physical
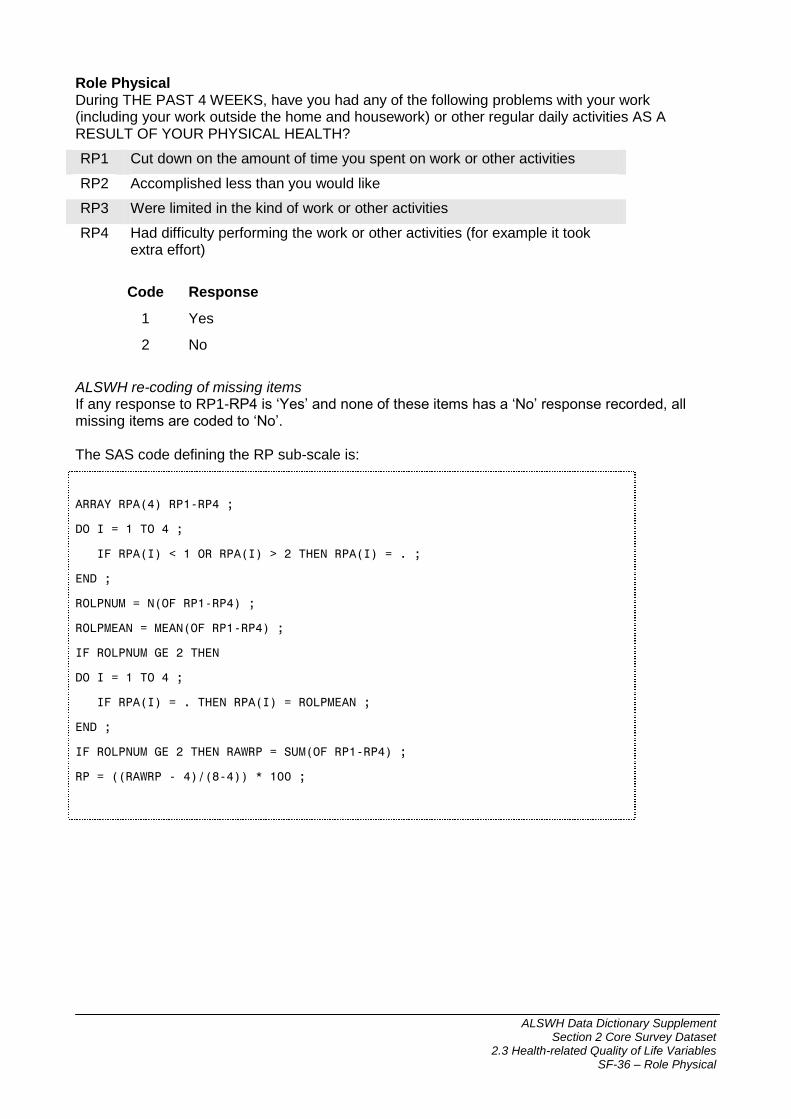
Role Physical During THE PAST 4 WEEKS, have you had any of the following problems with your work (including your work outside the home and housework) or other regular daily activities AS A RESULT OF YOUR PHYSICAL HEALTH?
RP1 Cut down on the amount of time you spent on work or other activities
RP2 Accomplished less than you would like
RP3 Were limited in the kind of work or other activities
RP4 Had difficulty performing the work or other activities (for example it took extra effort)
Code Response
1 Yes
2 No
ALSWH re-coding of missing items If any response to RP1-RP4 is ‘Yes’ and none of these items has a ‘No’ response recorded, all missing items are coded to ‘No’. The SAS code defining the RP sub-scale is:
ARRAY RPA(4) RP1-RP4 ;
DO I = 1 TO 4 ;
IF RPA(I) < 1 OR RPA(I) > 2 THEN RPA(I) = . ;
END ;
ROLPNUM = N(OF RP1-RP4) ;
ROLPMEAN = MEAN(OF RP1-RP4) ;
IF ROLPNUM GE 2 THEN
DO I = 1 TO 4 ;
IF RPA(I) = . THEN RPA(I) = ROLPMEAN ;
END ;
IF ROLPNUM GE 2 THEN RAWRP = SUM(OF RP1-RP4) ;
RP = ((RAWRP - 4)/(8-4)) * 100 ;
ALSWH Data Dictionary Supplement
Section 2 Core Survey Dataset 2.3 Health-related Quality of Life Variables
SF-36 – Bodily Pain
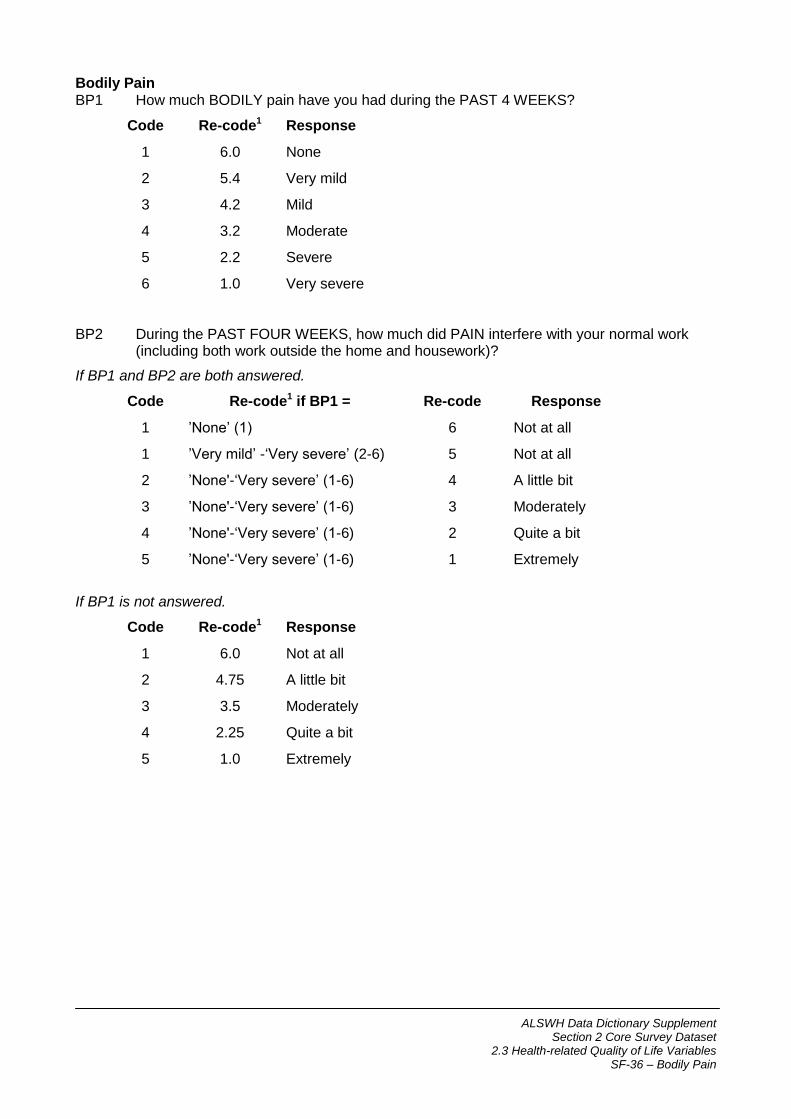
Bodily Pain BP1 How much BODILY pain have you had during the PAST 4 WEEKS?
Code Re-code1 Response
1 6.0 None
2 5.4 Very mild
3 4.2 Mild
4 3.2 Moderate
5 2.2 Severe
6 1.0 Very severe
BP2 During the PAST FOUR WEEKS, how much did PAIN interfere with your normal work (including both work outside the home and housework)?
If BP1 and BP2 are both answered.
Code Re-code1 if BP1 = Re-code Response
1 ’None’ (1) 6 Not at all
1 ’Very mild’ -‘Very severe’ (2-6) 5 Not at all
2 ’None'-‘Very severe’ (1-6) 4 A little bit
3 ’None'-‘Very severe’ (1-6) 3 Moderately
4 ’None'-‘Very severe’ (1-6) 2 Quite a bit
5 ’None'-‘Very severe’ (1-6) 1 Extremely
If BP1 is not answered.
Code Re-code1 Response
1 6.0 Not at all
2 4.75 A little bit
3 3.5 Moderately
4 2.25 Quite a bit
5 1.0 Extremely
ALSWH Data Dictionary Supplement
Section 2 Core Survey Dataset 2.3 Health-related Quality of Life Variables
SF-36 – Bodily Pain
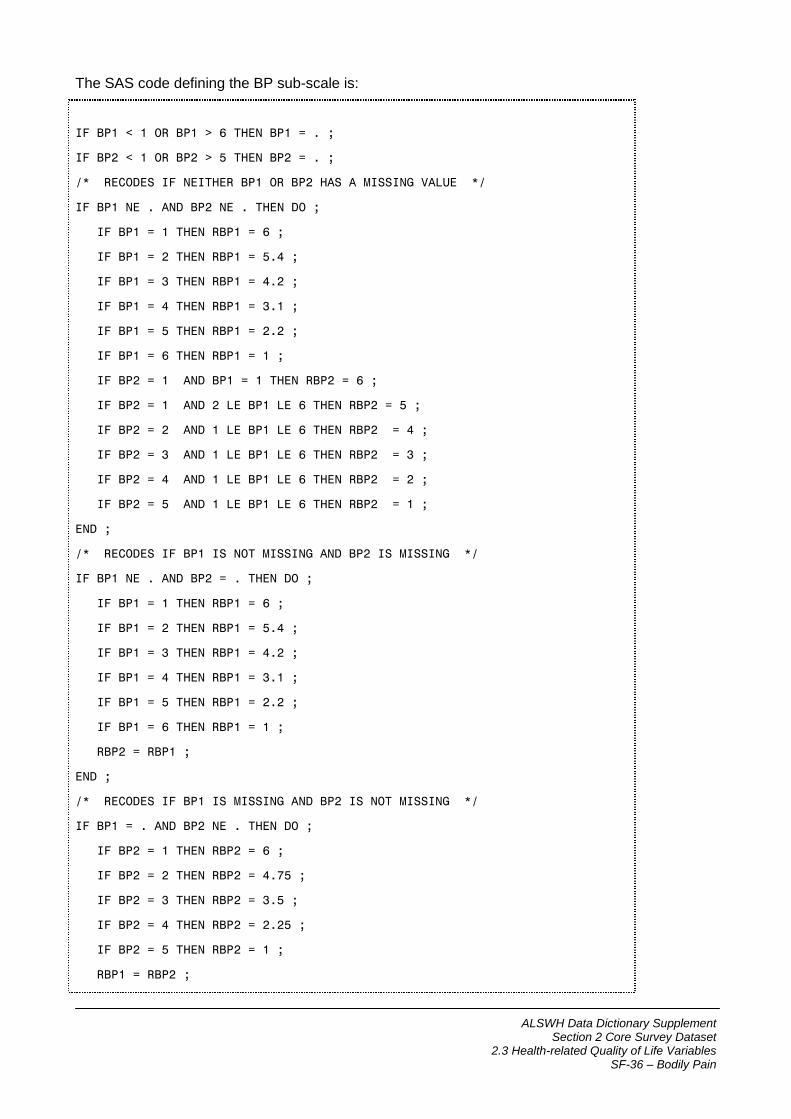
The SAS code defining the BP sub-scale is:
IF BP1 < 1 OR BP1 > 6 THEN BP1 = . ;
IF BP2 < 1 OR BP2 > 5 THEN BP2 = . ;
/* RECODES IF NEITHER BP1 OR BP2 HAS A MISSING VALUE */
IF BP1 NE . AND BP2 NE . THEN DO ;
IF BP1 = 1 THEN RBP1 = 6 ;
IF BP1 = 2 THEN RBP1 = 5.4 ;
IF BP1 = 3 THEN RBP1 = 4.2 ;
IF BP1 = 4 THEN RBP1 = 3.1 ;
IF BP1 = 5 THEN RBP1 = 2.2 ;
IF BP1 = 6 THEN RBP1 = 1 ;
IF BP2 = 1 AND BP1 = 1 THEN RBP2 = 6 ;
IF BP2 = 1 AND 2 LE BP1 LE 6 THEN RBP2 = 5 ;
IF BP2 = 2 AND 1 LE BP1 LE 6 THEN RBP2 = 4 ;
IF BP2 = 3 AND 1 LE BP1 LE 6 THEN RBP2 = 3 ;
IF BP2 = 4 AND 1 LE BP1 LE 6 THEN RBP2 = 2 ;
IF BP2 = 5 AND 1 LE BP1 LE 6 THEN RBP2 = 1 ;
END ;
/* RECODES IF BP1 IS NOT MISSING AND BP2 IS MISSING */
IF BP1 NE . AND BP2 = . THEN DO ;
IF BP1 = 1 THEN RBP1 = 6 ;
IF BP1 = 2 THEN RBP1 = 5.4 ;
IF BP1 = 3 THEN RBP1 = 4.2 ;
IF BP1 = 4 THEN RBP1 = 3.1 ;
IF BP1 = 5 THEN RBP1 = 2.2 ;
IF BP1 = 6 THEN RBP1 = 1 ;
RBP2 = RBP1 ;
END ;
/* RECODES IF BP1 IS MISSING AND BP2 IS NOT MISSING */
IF BP1 = . AND BP2 NE . THEN DO ;
IF BP2 = 1 THEN RBP2 = 6 ;
IF BP2 = 2 THEN RBP2 = 4.75 ;
IF BP2 = 3 THEN RBP2 = 3.5 ;
IF BP2 = 4 THEN RBP2 = 2.25 ;
IF BP2 = 5 THEN RBP2 = 1 ;
RBP1 = RBP2 ;
ALSWH Data Dictionary Supplement
Section 2 Core Survey Dataset 2.3 Health-related Quality of Life Variables
SF-36 – Bodily Pain
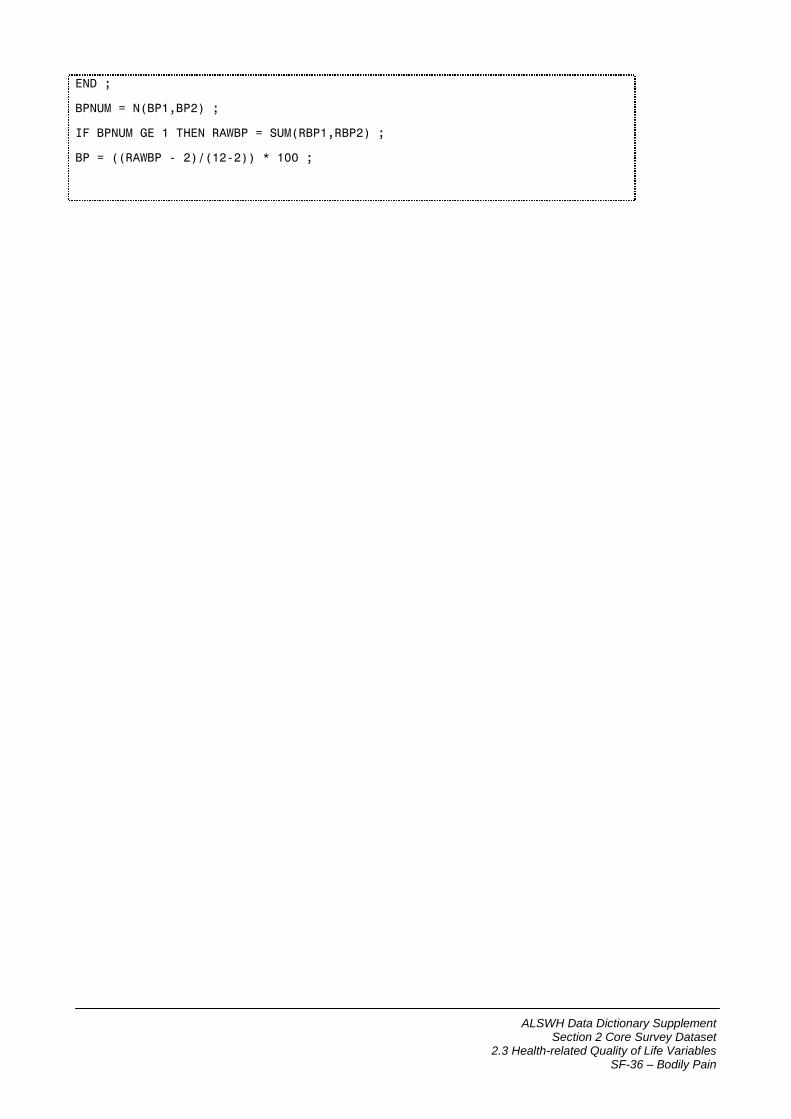
END ;
BPNUM = N(BP1,BP2) ;
IF BPNUM GE 1 THEN RAWBP = SUM(RBP1,RBP2) ;
BP = ((RAWBP - 2)/(12-2)) * 100 ;
ALSWH Data Dictionary Supplement
Section 2 Core Survey Dataset 2.3 Health-related Quality of Life Variables
SF-36 – General Health
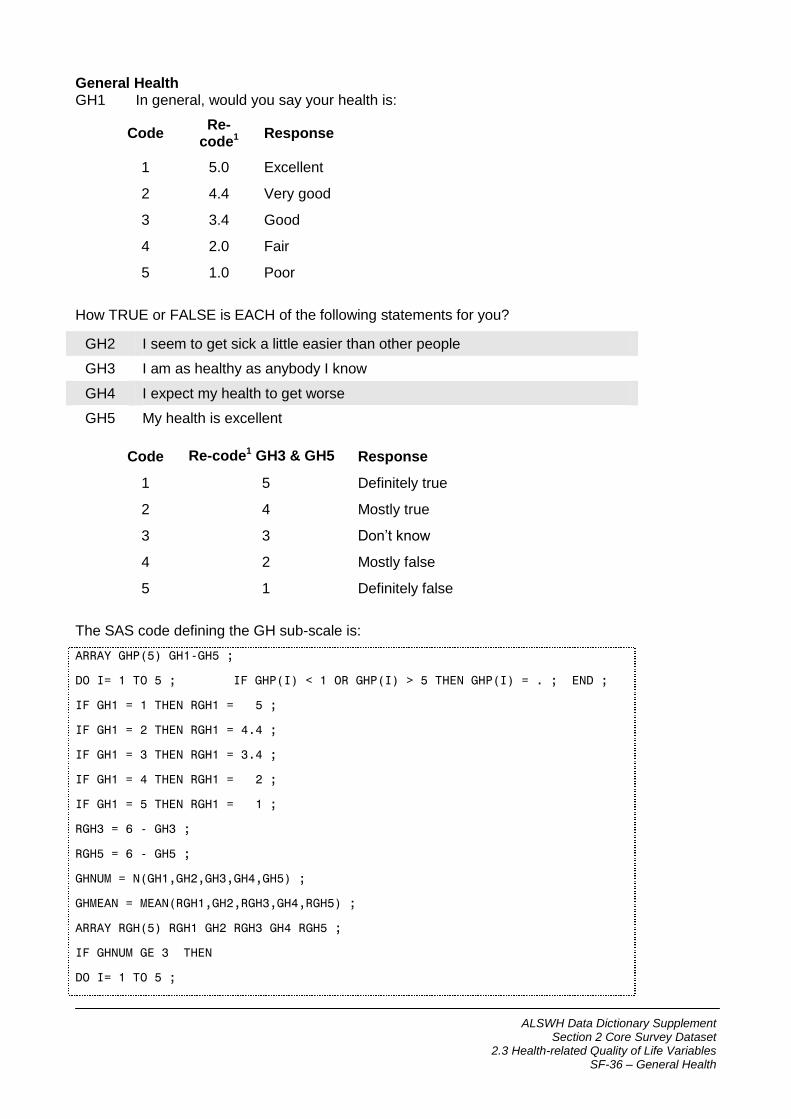
General Health GH1 In general, would you say your health is:
Code Re-
code1 Response
1 5.0 Excellent
2 4.4 Very good
3 3.4 Good
4 2.0 Fair
5 1.0 Poor
How TRUE or FALSE is EACH of the following statements for you?
GH2 I seem to get sick a little easier than other people
GH3 I am as healthy as anybody I know
GH4 I expect my health to get worse
GH5 My health is excellent
Code Re-code1 GH3 & GH5 Response
1 5 Definitely true
2 4 Mostly true
3 3 Don’t know
4 2 Mostly false
5 1 Definitely false
The SAS code defining the GH sub-scale is:
ARRAY GHP(5) GH1-GH5 ;
DO I= 1 TO 5 ; IF GHP(I) < 1 OR GHP(I) > 5 THEN GHP(I) = . ; END ;
IF GH1 = 1 THEN RGH1 = 5 ;
IF GH1 = 2 THEN RGH1 = 4.4 ;
IF GH1 = 3 THEN RGH1 = 3.4 ;
IF GH1 = 4 THEN RGH1 = 2 ;
IF GH1 = 5 THEN RGH1 = 1 ;
RGH3 = 6 - GH3 ;
RGH5 = 6 - GH5 ;
GHNUM = N(GH1,GH2,GH3,GH4,GH5) ;
GHMEAN = MEAN(RGH1,GH2,RGH3,GH4,RGH5) ;
ARRAY RGH(5) RGH1 GH2 RGH3 GH4 RGH5 ;
IF GHNUM GE 3 THEN
DO I= 1 TO 5 ;
ALSWH Data Dictionary Supplement
Section 2 Core Survey Dataset 2.3 Health-related Quality of Life Variables
SF-36 – General Health
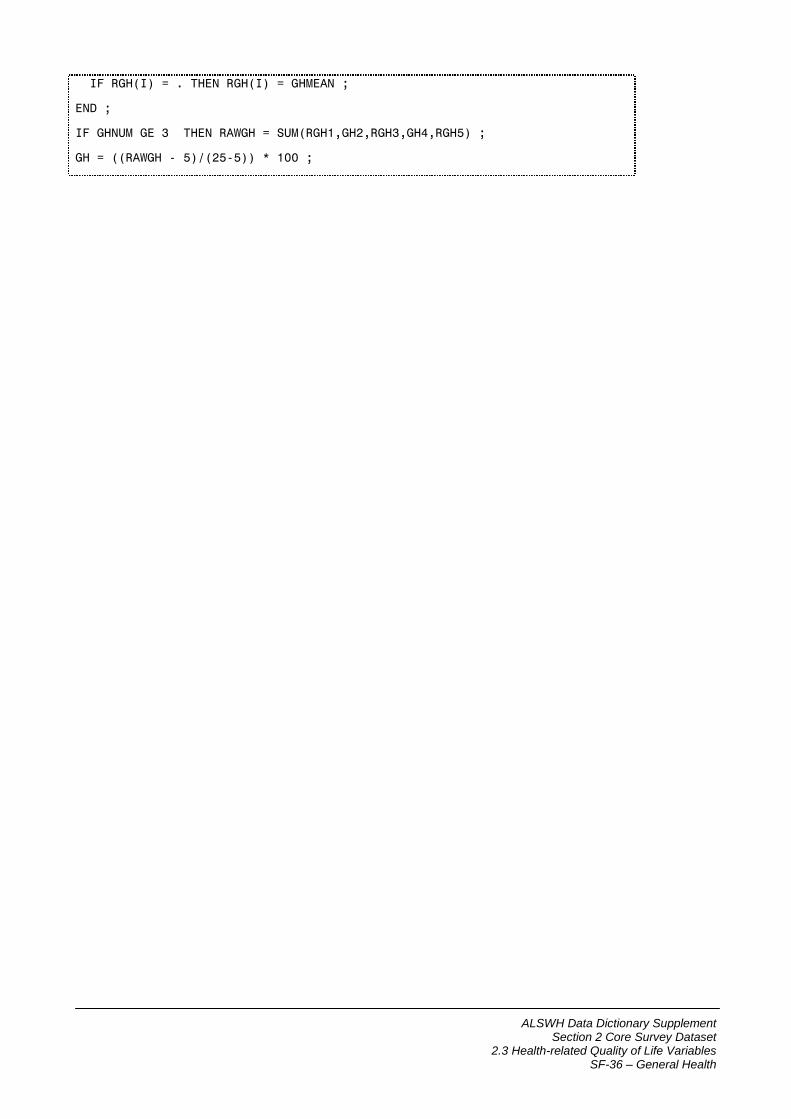
IF RGH(I) = . THEN RGH(I) = GHMEAN ;
END ;
IF GHNUM GE 3 THEN RAWGH = SUM(RGH1,GH2,RGH3,GH4,RGH5) ;
GH = ((RAWGH - 5)/(25-5)) * 100 ;
ALSWH Data Dictionary Supplement
Section 2 Core Survey Dataset 2.3 Health-related Quality of Life Variables
SF-36 – Vitality
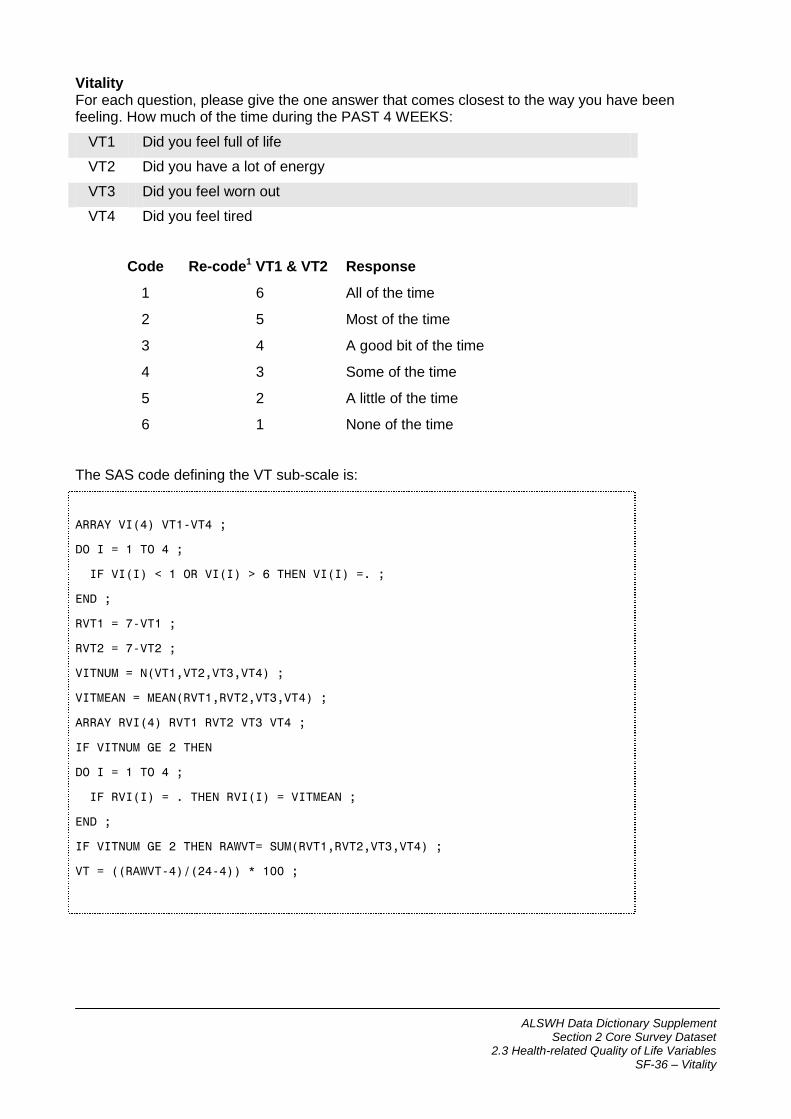
Vitality For each question, please give the one answer that comes closest to the way you have been feeling. How much of the time during the PAST 4 WEEKS:
VT1 Did you feel full of life
VT2 Did you have a lot of energy
VT3 Did you feel worn out
VT4 Did you feel tired
Code Re-code1 VT1 & VT2 Response
1 6 All of the time
2 5 Most of the time
3 4 A good bit of the time
4 3 Some of the time
5 2 A little of the time
6 1 None of the time
The SAS code defining the VT sub-scale is:
ARRAY VI(4) VT1-VT4 ;
DO I = 1 TO 4 ;
IF VI(I) < 1 OR VI(I) > 6 THEN VI(I) =. ;
END ;
RVT1 = 7-VT1 ;
RVT2 = 7-VT2 ;
VITNUM = N(VT1,VT2,VT3,VT4) ;
VITMEAN = MEAN(RVT1,RVT2,VT3,VT4) ;
ARRAY RVI(4) RVT1 RVT2 VT3 VT4 ;
IF VITNUM GE 2 THEN
DO I = 1 TO 4 ;
IF RVI(I) = . THEN RVI(I) = VITMEAN ;
END ;
IF VITNUM GE 2 THEN RAWVT= SUM(RVT1,RVT2,VT3,VT4) ;
VT = ((RAWVT-4)/(24-4)) * 100 ;
ALSWH Data Dictionary Supplement
Section 2 Core Survey Dataset 2.3 Health-related Quality of Life Variables
SF-36 – Social Functioning
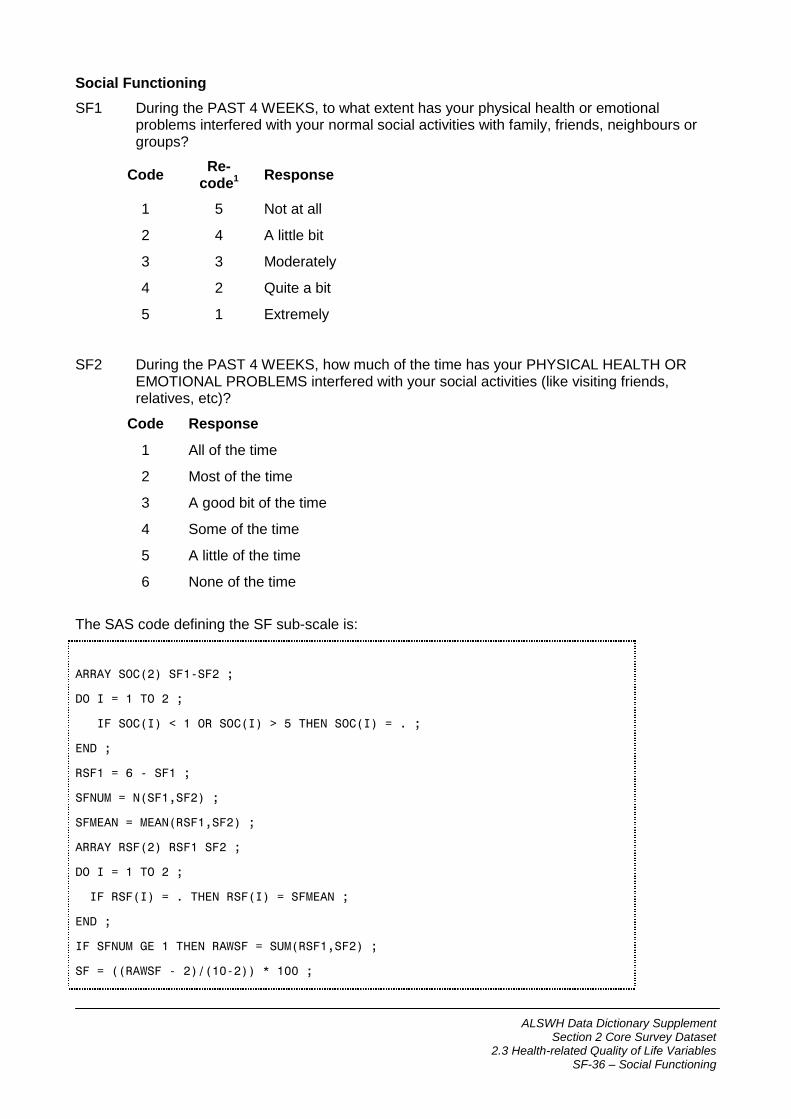
Social Functioning
SF1 During the PAST 4 WEEKS, to what extent has your physical health or emotional problems interfered with your normal social activities with family, friends, neighbours or groups?
Code Re-
code1 Response
1 5 Not at all
2 4 A little bit
3 3 Moderately
4 2 Quite a bit
5 1 Extremely
SF2 During the PAST 4 WEEKS, how much of the time has your PHYSICAL HEALTH OR EMOTIONAL PROBLEMS interfered with your social activities (like visiting friends, relatives, etc)?
Code Response
1 All of the time
2 Most of the time
3 A good bit of the time
4 Some of the time
5 A little of the time
6 None of the time
The SAS code defining the SF sub-scale is:
ARRAY SOC(2) SF1-SF2 ;
DO I = 1 TO 2 ;
IF SOC(I) < 1 OR SOC(I) > 5 THEN SOC(I) = . ;
END ;
RSF1 = 6 - SF1 ;
SFNUM = N(SF1,SF2) ;
SFMEAN = MEAN(RSF1,SF2) ;
ARRAY RSF(2) RSF1 SF2 ;
DO I = 1 TO 2 ;
IF RSF(I) = . THEN RSF(I) = SFMEAN ;
END ;
IF SFNUM GE 1 THEN RAWSF = SUM(RSF1,SF2) ;
SF = ((RAWSF - 2)/(10-2)) * 100 ;
ALSWH Data Dictionary Supplement
Section 2 Core Survey Dataset 2.3 Health-related Quality of Life Variables
SF-36 – Social Functioning
ALSWH Data Dictionary Supplement
Section 2 Core Survey Dataset 2.3 Health-related Quality of Life Variables
SF-36 – Role Emotional
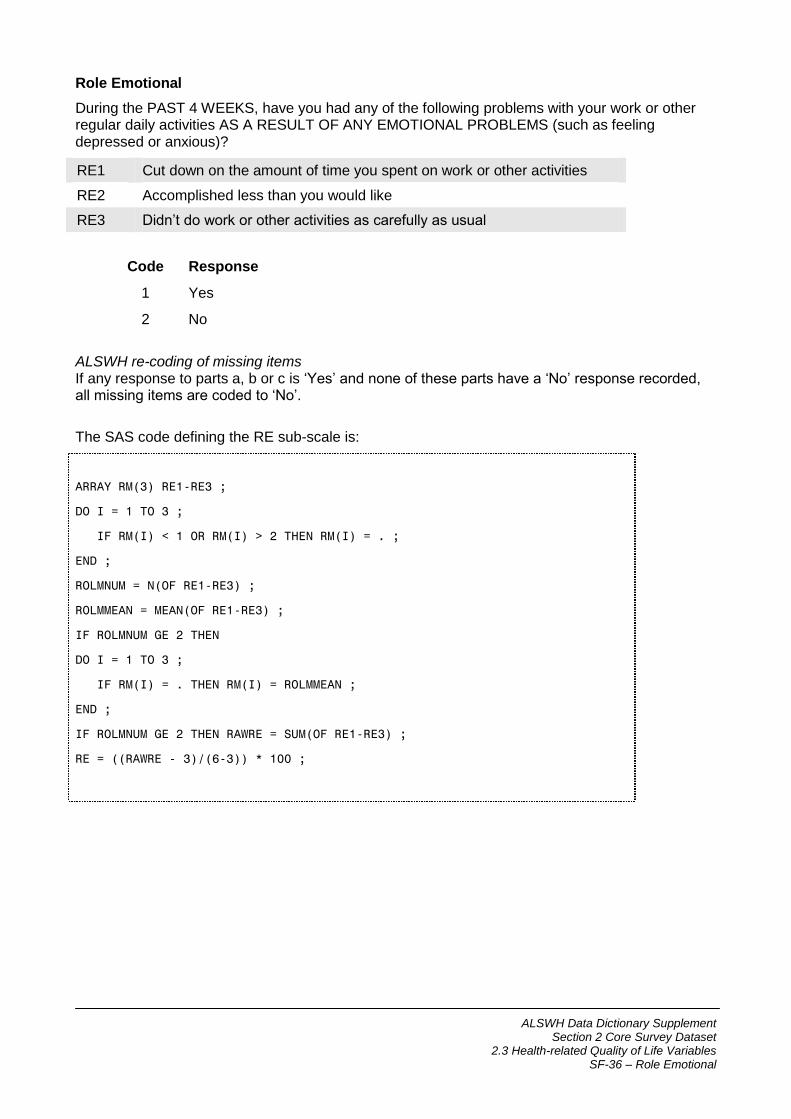
Role Emotional
During the PAST 4 WEEKS, have you had any of the following problems with your work or other regular daily activities AS A RESULT OF ANY EMOTIONAL PROBLEMS (such as feeling depressed or anxious)?
RE1 Cut down on the amount of time you spent on work or other activities
RE2 Accomplished less than you would like
RE3 Didn’t do work or other activities as carefully as usual
Code Response
1 Yes
2 No
ALSWH re-coding of missing items If any response to parts a, b or c is ‘Yes’ and none of these parts have a ‘No’ response recorded, all missing items are coded to ‘No’.
The SAS code defining the RE sub-scale is:
ARRAY RM(3) RE1-RE3 ;
DO I = 1 TO 3 ;
IF RM(I) < 1 OR RM(I) > 2 THEN RM(I) = . ;
END ;
ROLMNUM = N(OF RE1-RE3) ;
ROLMMEAN = MEAN(OF RE1-RE3) ;
IF ROLMNUM GE 2 THEN
DO I = 1 TO 3 ;
IF RM(I) = . THEN RM(I) = ROLMMEAN ;
END ;
IF ROLMNUM GE 2 THEN RAWRE = SUM(OF RE1-RE3) ;
RE = ((RAWRE - 3)/(6-3)) * 100 ;
ALSWH Data Dictionary Supplement
Section 2 Core Survey Dataset 2.3 Health-related Quality of Life Variables
SF-36 – Mental Health
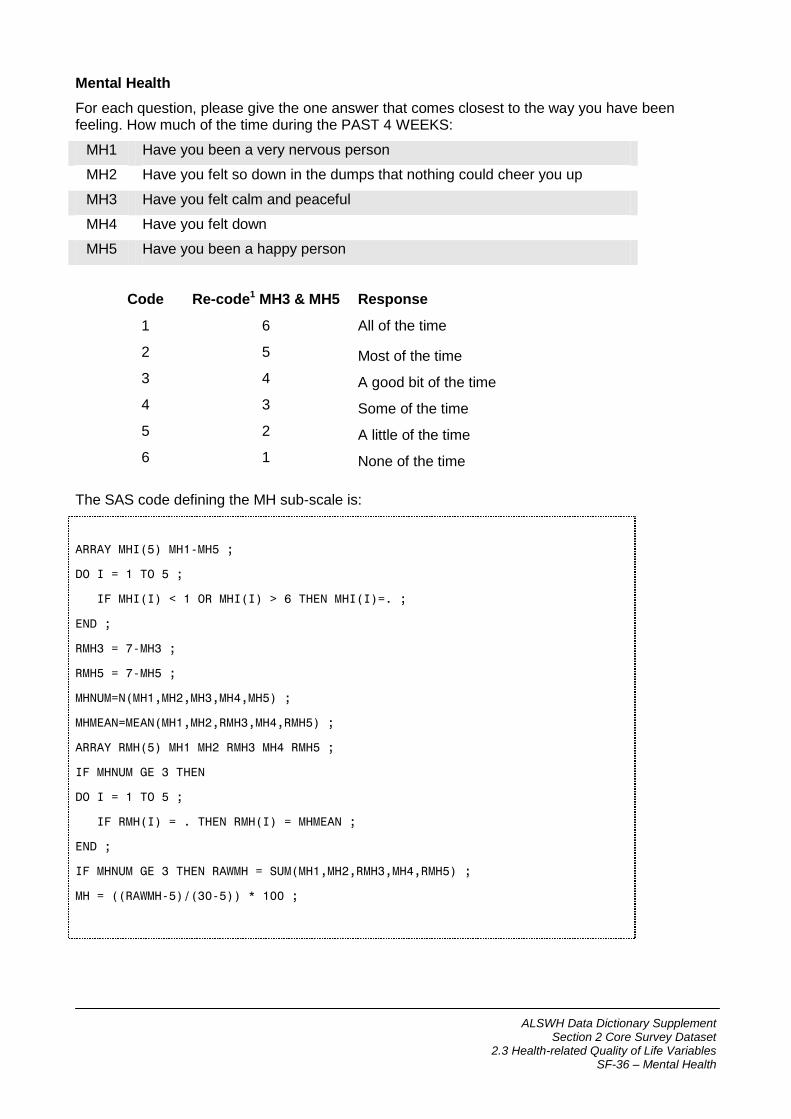
Mental Health
For each question, please give the one answer that comes closest to the way you have been feeling. How much of the time during the PAST 4 WEEKS:
MH1 Have you been a very nervous person
MH2 Have you felt so down in the dumps that nothing could cheer you up
MH3 Have you felt calm and peaceful
MH4 Have you felt down
MH5 Have you been a happy person
Code Re-code1 MH3 & MH5 Response
1 6 All of the time
2 5 Most of the time
3 4 A good bit of the time
4 3 Some of the time
5 2 A little of the time
6 1 None of the time
The SAS code defining the MH sub-scale is:
ARRAY MHI(5) MH1-MH5 ;
DO I = 1 TO 5 ;
IF MHI(I) < 1 OR MHI(I) > 6 THEN MHI(I)=. ;
END ;
RMH3 = 7-MH3 ;
RMH5 = 7-MH5 ;
MHNUM=N(MH1,MH2,MH3,MH4,MH5) ;
MHMEAN=MEAN(MH1,MH2,RMH3,MH4,RMH5) ;
ARRAY RMH(5) MH1 MH2 RMH3 MH4 RMH5 ;
IF MHNUM GE 3 THEN
DO I = 1 TO 5 ;
IF RMH(I) = . THEN RMH(I) = MHMEAN ;
END ;
IF MHNUM GE 3 THEN RAWMH = SUM(MH1,MH2,RMH3,MH4,RMH5) ;
MH = ((RAWMH-5)/(30-5)) * 100 ;
ALSWH Data Dictionary Supplement
Section 2 Core Survey Dataset 2.3 Health-related Quality of Life Variables
SF-36 – Health Transition
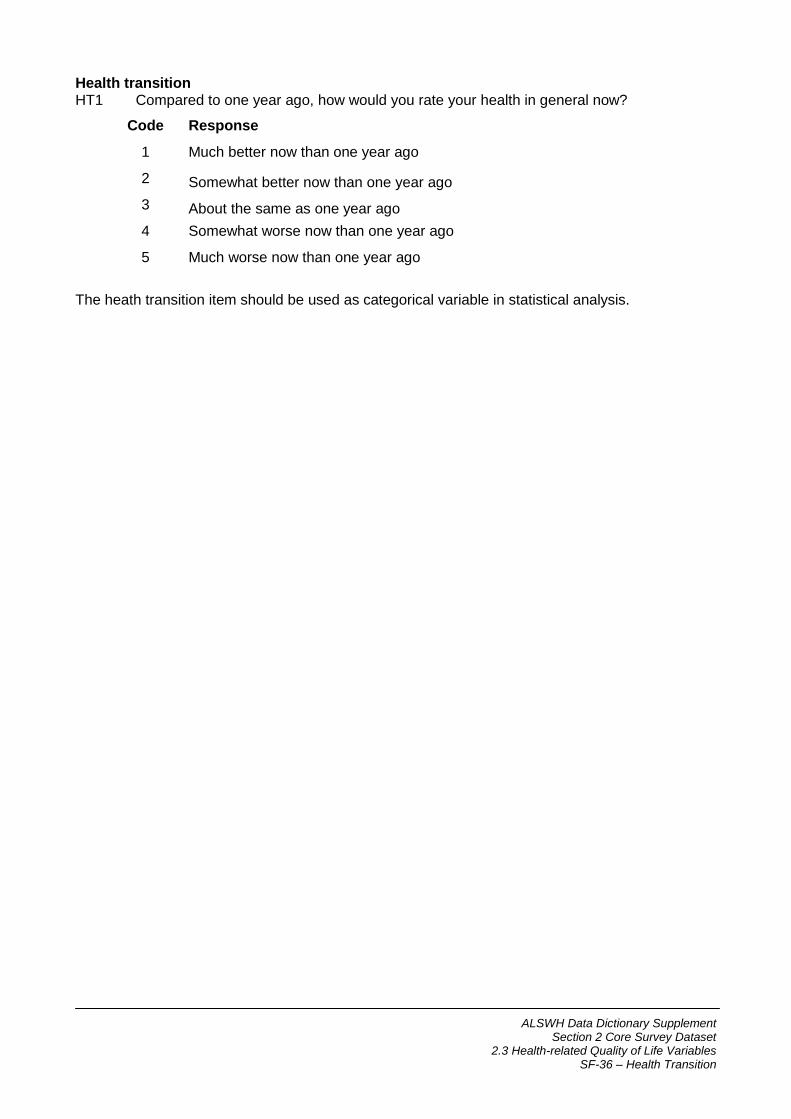
Health transition HT1 Compared to one year ago, how would you rate your health in general now?
Code Response
1 Much better now than one year ago
2 Somewhat better now than one year ago
3 About the same as one year ago
4 Somewhat worse now than one year ago
5 Much worse now than one year ago
The heath transition item should be used as categorical variable in statistical analysis.
ALSWH Data Dictionary Supplement
Section 2 Core Survey Dataset 2.3 Health-related Quality of Life Variables SF-36 – Standardised Component Scores
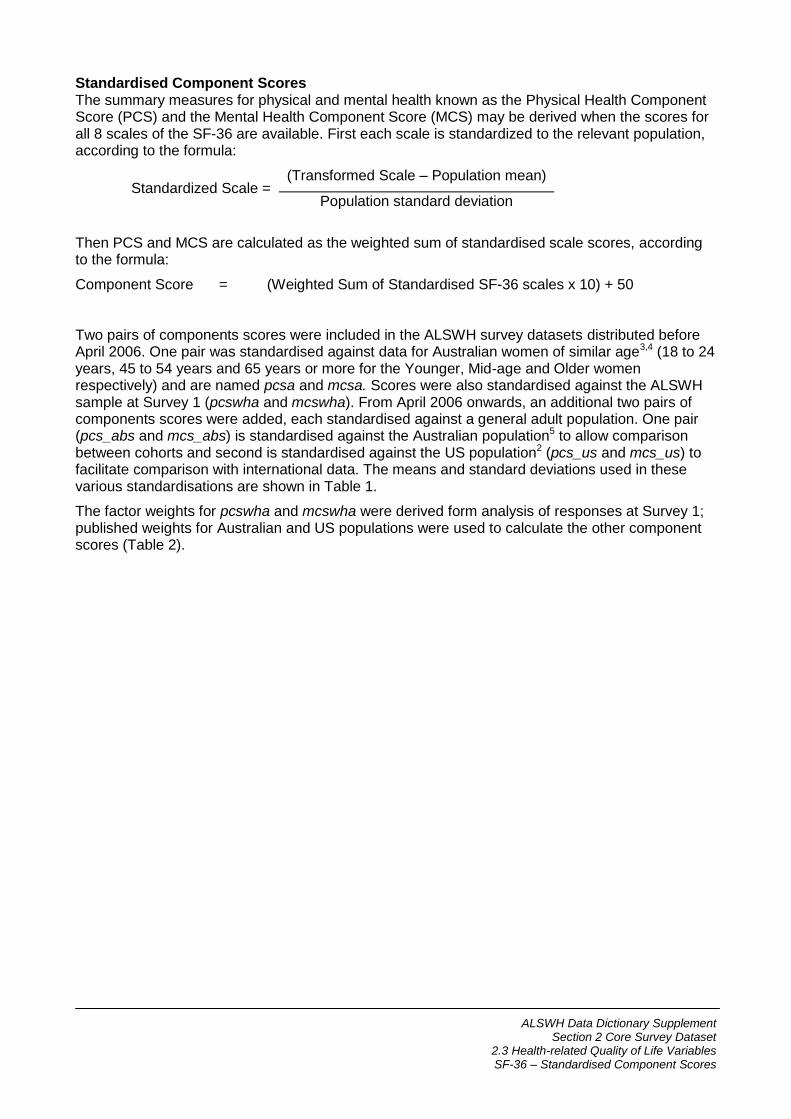
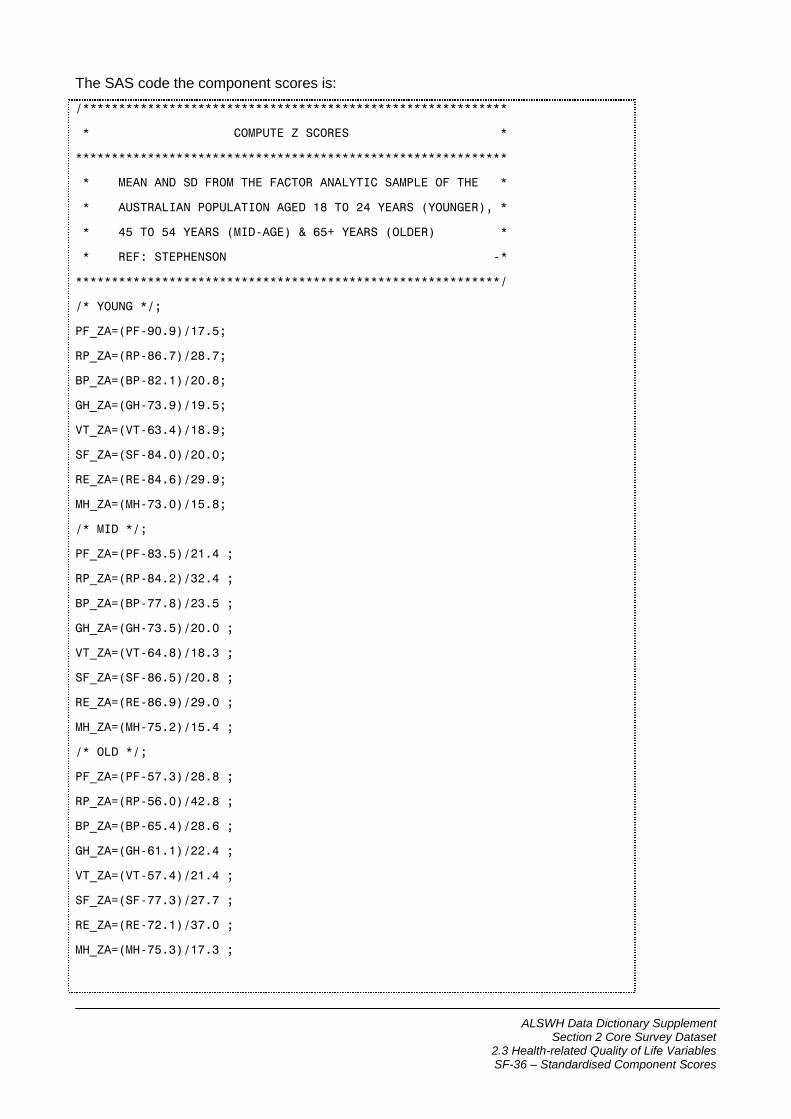
Standardised Component Scores The summary measures for physical and mental health known as the Physical Health Component Score (PCS) and the Mental Health Component Score (MCS) may be derived when the scores for all 8 scales of the SF-36 are available. First each scale is standardized to the relevant population, according to the formula:
Standardized Scale = (Transformed Scale – Population mean)
Population standard deviation
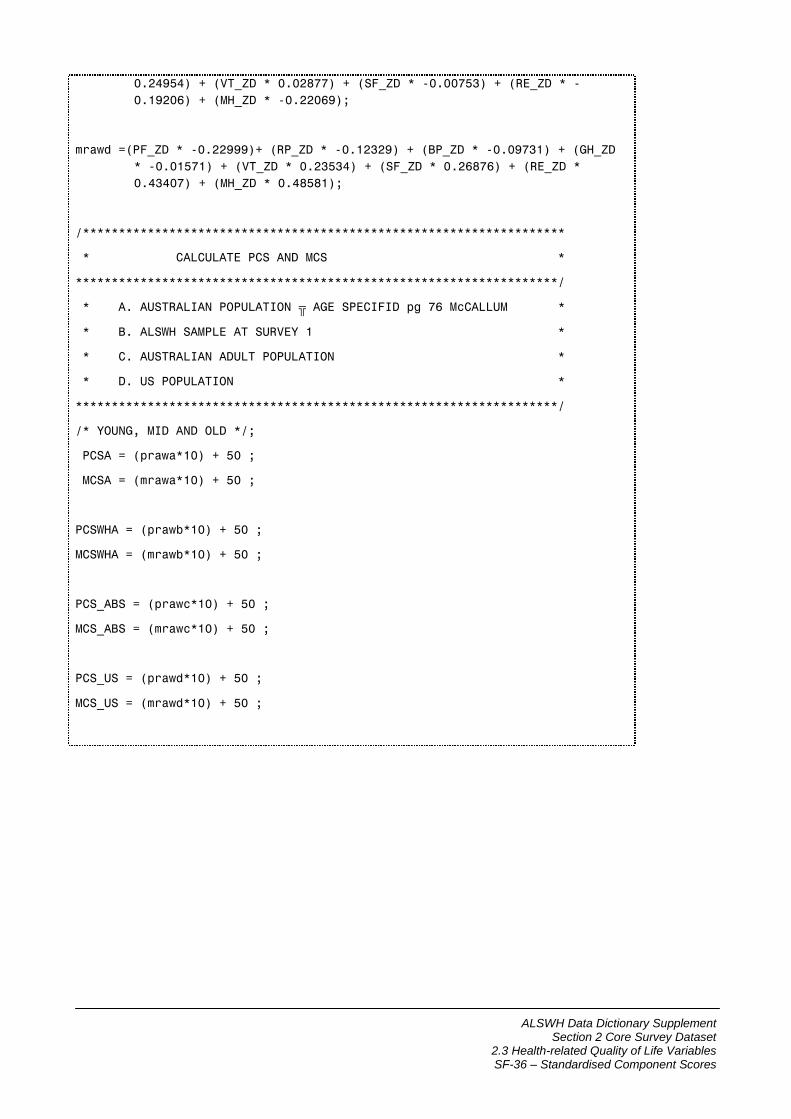
Then PCS and MCS are calculated as the weighted sum of standardised scale scores, according to the formula:
Component Score = (Weighted Sum of Standardised SF-36 scales x 10) + 50 Two pairs of components scores were included in the ALSWH survey datasets distributed before April 2006. One pair was standardised against data for Australian women of similar age3,4 (18 to 24 years, 45 to 54 years and 65 years or more for the Younger, Mid-age and Older women respectively) and are named pcsa and mcsa. Scores were also standardised against the ALSWH sample at Survey 1 (pcswha and mcswha). From April 2006 onwards, an additional two pairs of components scores were added, each standardised against a general adult population. One pair (pcs_abs and mcs_abs) is standardised against the Australian population5 to allow comparison between cohorts and second is standardised against the US population2 (pcs_us and mcs_us) to facilitate comparison with international data. The means and standard deviations used in these various standardisations are shown in Table 1.
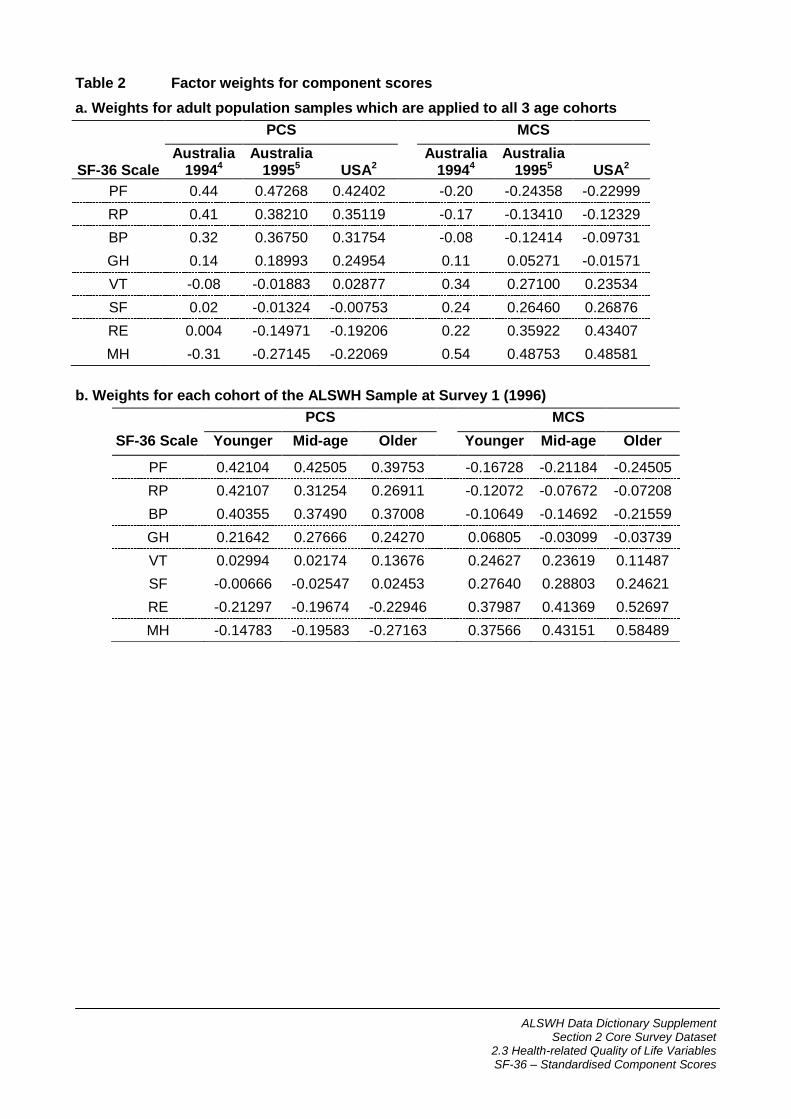
The factor weights for pcswha and mcswha were derived form analysis of responses at Survey 1; published weights for Australian and US populations were used to calculate the other component scores (Table 2).
ALSWH Data Dictionary Supplement
Section 2 Core Survey Dataset 2.3 Health-related Quality of Life Variables SF-36 – Standardised Component Scores
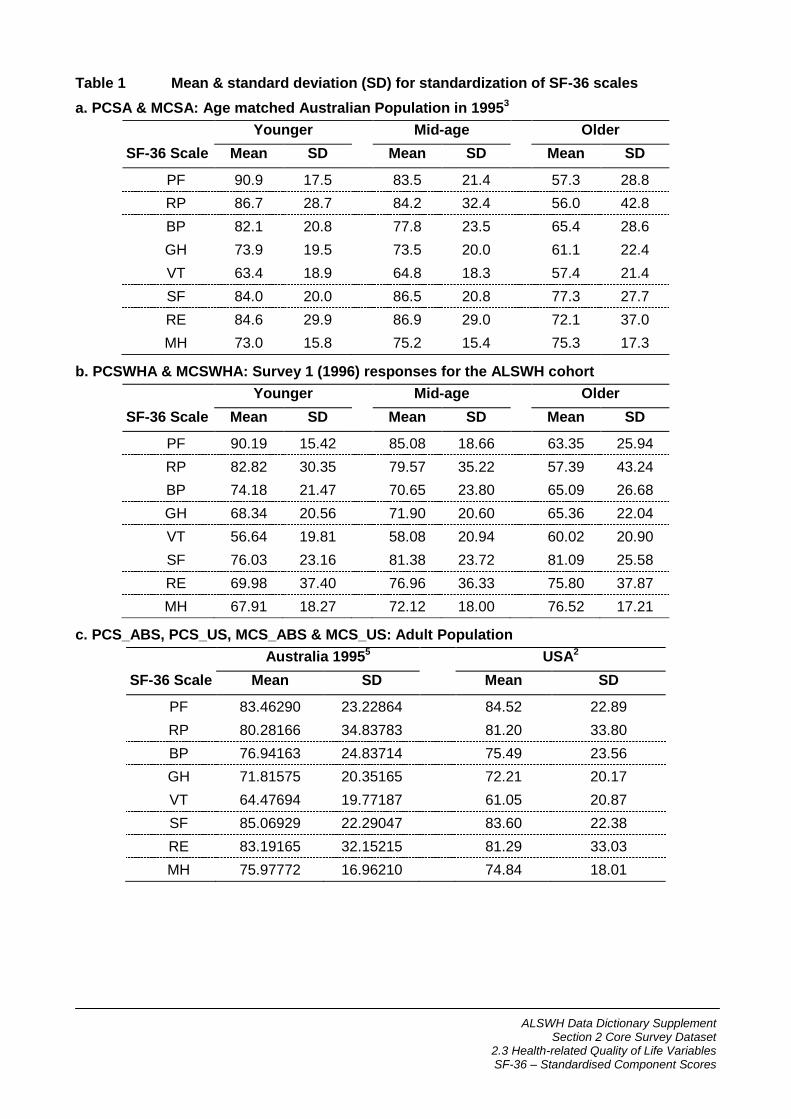
Table 1 Mean & standard deviation (SD) for standardization of SF-36 scales
a. PCSA & MCSA: Age matched Australian Population in 19953
Younger Mid-age Older
SF-36 Scale Mean SD Mean SD Mean SD
PF 90.9 17.5 83.5 21.4 57.3 28.8
RP 86.7 28.7 84.2 32.4 56.0 42.8
BP 82.1 20.8 77.8 23.5 65.4 28.6
GH 73.9 19.5 73.5 20.0 61.1 22.4
VT 63.4 18.9 64.8 18.3 57.4 21.4
SF 84.0 20.0 86.5 20.8 77.3 27.7
RE 84.6 29.9 86.9 29.0 72.1 37.0
MH 73.0 15.8 75.2 15.4 75.3 17.3
b. PCSWHA & MCSWHA: Survey 1 (1996) responses for the ALSWH cohort
Younger Mid-age Older
SF-36 Scale Mean SD Mean SD Mean SD
PF 90.19 15.42 85.08 18.66 63.35 25.94
RP 82.82 30.35 79.57 35.22 57.39 43.24
BP 74.18 21.47 70.65 23.80 65.09 26.68
GH 68.34 20.56 71.90 20.60 65.36 22.04
VT 56.64 19.81 58.08 20.94 60.02 20.90
SF 76.03 23.16 81.38 23.72 81.09 25.58
RE 69.98 37.40 76.96 36.33 75.80 37.87
MH 67.91 18.27 72.12 18.00 76.52 17.21
c. PCS_ABS, PCS_US, MCS_ABS & MCS_US: Adult Population
Australia 19955 USA2
SF-36 Scale Mean SD Mean SD
PF 83.46290 23.22864 84.52 22.89
RP 80.28166 34.83783 81.20 33.80
BP 76.94163 24.83714 75.49 23.56
GH 71.81575 20.35165 72.21 20.17
VT 64.47694 19.77187 61.05 20.87
SF 85.06929 22.29047 83.60 22.38
RE 83.19165 32.15215 81.29 33.03
MH 75.97772 16.96210 74.84 18.01
ALSWH Data Dictionary Supplement
Section 2 Core Survey Dataset 2.3 Health-related Quality of Life Variables SF-36 – Standardised Component Scores
Table 2 Factor weights for component scores
a. Weights for adult population samples which are applied to all 3 age cohorts
PCS MCS
SF-36 Scale Australia
19944 Australia
19955 USA2 Australia
19944 Australia
19955 USA2
PF 0.44 0.47268 0.42402 -0.20 -0.24358 -0.22999
RP 0.41 0.38210 0.35119 -0.17 -0.13410 -0.12329
BP 0.32 0.36750 0.31754 -0.08 -0.12414 -0.09731
GH 0.14 0.18993 0.24954 0.11 0.05271 -0.01571
VT -0.08 -0.01883 0.02877 0.34 0.27100 0.23534
SF 0.02 -0.01324 -0.00753 0.24 0.26460 0.26876
RE 0.004 -0.14971 -0.19206 0.22 0.35922 0.43407
MH -0.31 -0.27145 -0.22069 0.54 0.48753 0.48581
b. Weights for each cohort of the ALSWH Sample at Survey 1 (1996)
PCS MCS
SF-36 Scale Younger Mid-age Older Younger Mid-age Older
PF 0.42104 0.42505 0.39753 -0.16728 -0.21184 -0.24505
RP 0.42107 0.31254 0.26911 -0.12072 -0.07672 -0.07208
BP 0.40355 0.37490 0.37008 -0.10649 -0.14692 -0.21559
GH 0.21642 0.27666 0.24270 0.06805 -0.03099 -0.03739
VT 0.02994 0.02174 0.13676 0.24627 0.23619 0.11487
SF -0.00666 -0.02547 0.02453 0.27640 0.28803 0.24621
RE -0.21297 -0.19674 -0.22946 0.37987 0.41369 0.52697
MH -0.14783 -0.19583 -0.27163 0.37566 0.43151 0.58489

ALSWH Data Dictionary Supplement
Section 2 Core Survey Dataset 2.3 Health-related Quality of Life Variables SF-36 – Standardised Component Scores
The SAS code the component scores is:
/***********************************************************
* COMPUTE Z SCORES *
************************************************************
* MEAN AND SD FROM THE FACTOR ANALYTIC SAMPLE OF THE *
* AUSTRALIAN POPULATION AGED 18 T0 24 YEARS (YOUNGER), *
* 45 T0 54 YEARS (MID-AGE) & 65+ YEARS (OLDER) *
* REF: STEPHENSON -*
***********************************************************/
/* YOUNG */;
PF_ZA=(PF-90.9)/17.5;
RP_ZA=(RP-86.7)/28.7;
BP_ZA=(BP-82.1)/20.8;
GH_ZA=(GH-73.9)/19.5;
VT_ZA=(VT-63.4)/18.9;
SF_ZA=(SF-84.0)/20.0;
RE_ZA=(RE-84.6)/29.9;
MH_ZA=(MH-73.0)/15.8;
/* MID */;
PF_ZA=(PF-83.5)/21.4 ;
RP_ZA=(RP-84.2)/32.4 ;
BP_ZA=(BP-77.8)/23.5 ;
GH_ZA=(GH-73.5)/20.0 ;
VT_ZA=(VT-64.8)/18.3 ;
SF_ZA=(SF-86.5)/20.8 ;
RE_ZA=(RE-86.9)/29.0 ;
MH_ZA=(MH-75.2)/15.4 ;
/* OLD */;
PF_ZA=(PF-57.3)/28.8 ;
RP_ZA=(RP-56.0)/42.8 ;
BP_ZA=(BP-65.4)/28.6 ;
GH_ZA=(GH-61.1)/22.4 ;
VT_ZA=(VT-57.4)/21.4 ;
SF_ZA=(SF-77.3)/27.7 ;
RE_ZA=(RE-72.1)/37.0 ;
MH_ZA=(MH-75.3)/17.3 ;

ALSWH Data Dictionary Supplement
Section 2 Core Survey Dataset 2.3 Health-related Quality of Life Variables SF-36 – Standardised Component Scores
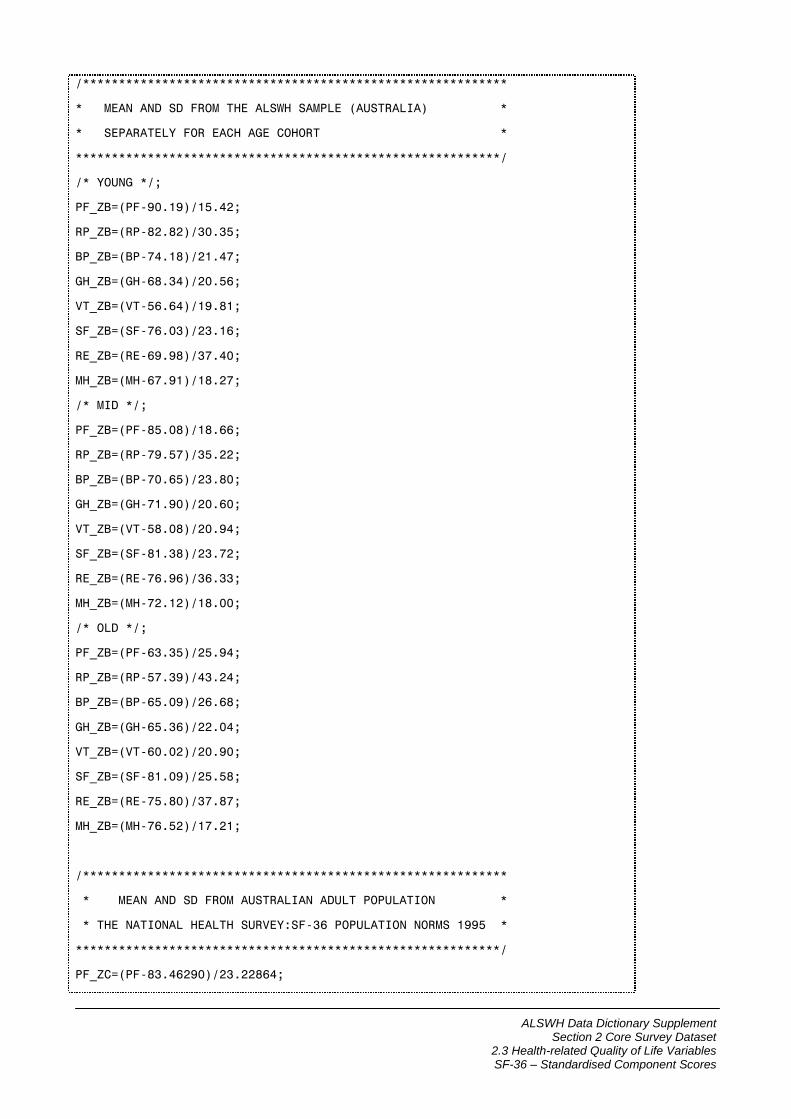
/***********************************************************
* MEAN AND SD FROM THE ALSWH SAMPLE (AUSTRALIA) *
* SEPARATELY FOR EACH AGE COHORT *
***********************************************************/
/* YOUNG */;
PF_ZB=(PF-90.19)/15.42;
RP_ZB=(RP-82.82)/30.35;
BP_ZB=(BP-74.18)/21.47;
GH_ZB=(GH-68.34)/20.56;
VT_ZB=(VT-56.64)/19.81;
SF_ZB=(SF-76.03)/23.16;
RE_ZB=(RE-69.98)/37.40;
MH_ZB=(MH-67.91)/18.27;
/* MID */;
PF_ZB=(PF-85.08)/18.66;
RP_ZB=(RP-79.57)/35.22;
BP_ZB=(BP-70.65)/23.80;
GH_ZB=(GH-71.90)/20.60;
VT_ZB=(VT-58.08)/20.94;
SF_ZB=(SF-81.38)/23.72;
RE_ZB=(RE-76.96)/36.33;
MH_ZB=(MH-72.12)/18.00;
/* OLD */;
PF_ZB=(PF-63.35)/25.94;
RP_ZB=(RP-57.39)/43.24;
BP_ZB=(BP-65.09)/26.68;
GH_ZB=(GH-65.36)/22.04;
VT_ZB=(VT-60.02)/20.90;
SF_ZB=(SF-81.09)/25.58;
RE_ZB=(RE-75.80)/37.87;
MH_ZB=(MH-76.52)/17.21;
/***********************************************************
* MEAN AND SD FROM AUSTRALIAN ADULT POPULATION *
* THE NATIONAL HEALTH SURVEY:SF-36 POPULATION NORMS 1995 *
***********************************************************/
PF_ZC=(PF-83.46290)/23.22864;

ALSWH Data Dictionary Supplement
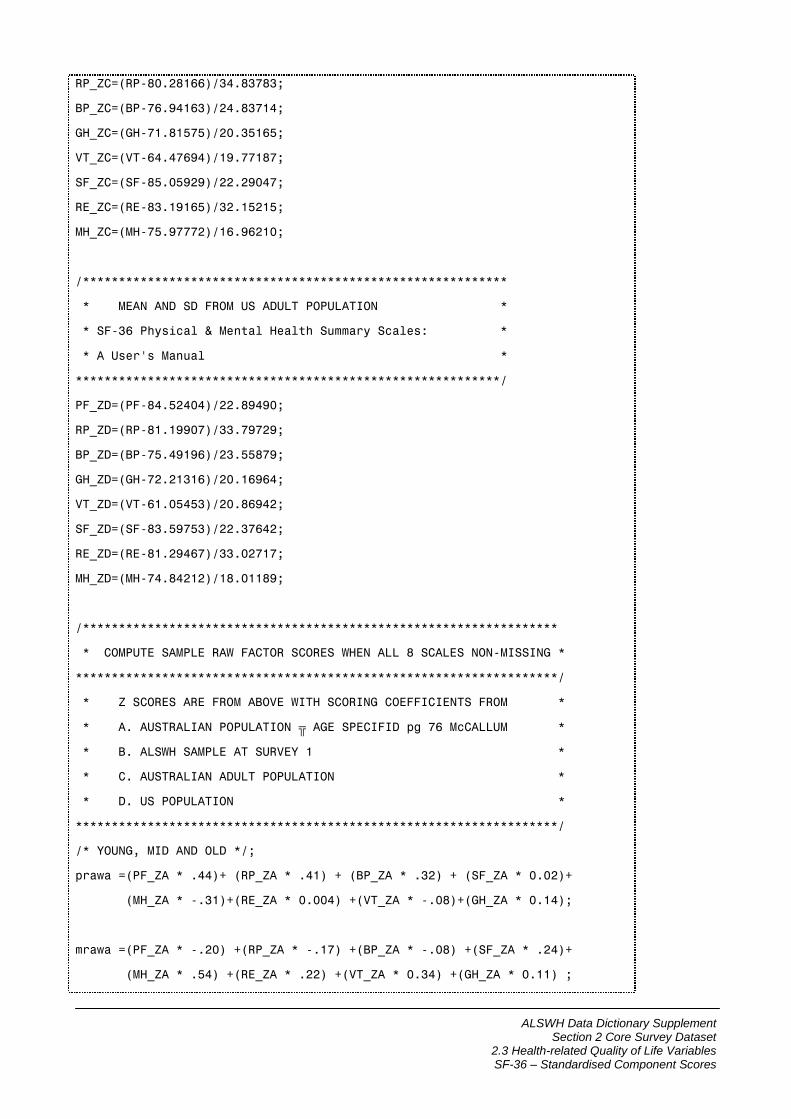
Section 2 Core Survey Dataset 2.3 Health-related Quality of Life Variables SF-36 – Standardised Component Scores
RP_ZC=(RP-80.28166)/34.83783;
BP_ZC=(BP-76.94163)/24.83714;
GH_ZC=(GH-71.81575)/20.35165;
VT_ZC=(VT-64.47694)/19.77187;
SF_ZC=(SF-85.05929)/22.29047;
RE_ZC=(RE-83.19165)/32.15215;
MH_ZC=(MH-75.97772)/16.96210;
/***********************************************************
* MEAN AND SD FROM US ADULT POPULATION *
* SF-36 Physical & Mental Health Summary Scales: *
* A User's Manual *
***********************************************************/
PF_ZD=(PF-84.52404)/22.89490;
RP_ZD=(RP-81.19907)/33.79729;
BP_ZD=(BP-75.49196)/23.55879;
GH_ZD=(GH-72.21316)/20.16964;
VT_ZD=(VT-61.05453)/20.86942;
SF_ZD=(SF-83.59753)/22.37642;
RE_ZD=(RE-81.29467)/33.02717;
MH_ZD=(MH-74.84212)/18.01189;
/******************************************************************
* COMPUTE SAMPLE RAW FACTOR SCORES WHEN ALL 8 SCALES NON-MISSING *
*******************************************************************/
* Z SCORES ARE FROM ABOVE WITH SCORING COEFFICIENTS FROM *
* A. AUSTRALIAN POPULATION – AGE SPECIFID pg 76 McCALLUM *
* B. ALSWH SAMPLE AT SURVEY 1 *
* C. AUSTRALIAN ADULT POPULATION *
* D. US POPULATION *
*******************************************************************/
/* YOUNG, MID AND OLD */;
prawa =(PF_ZA * .44)+ (RP_ZA * .41) + (BP_ZA * .32) + (SF_ZA * 0.02)+
(MH_ZA * -.31)+(RE_ZA * 0.004) +(VT_ZA * -.08)+(GH_ZA * 0.14);
mrawa =(PF_ZA * -.20) +(RP_ZA * -.17) +(BP_ZA * -.08) +(SF_ZA * .24)+
(MH_ZA * .54) +(RE_ZA * .22) +(VT_ZA * 0.34) +(GH_ZA * 0.11) ;
ALSWH Data Dictionary Supplement
Section 2 Core Survey Dataset 2.3 Health-related Quality of Life Variables SF-36 – Standardised Component Scores
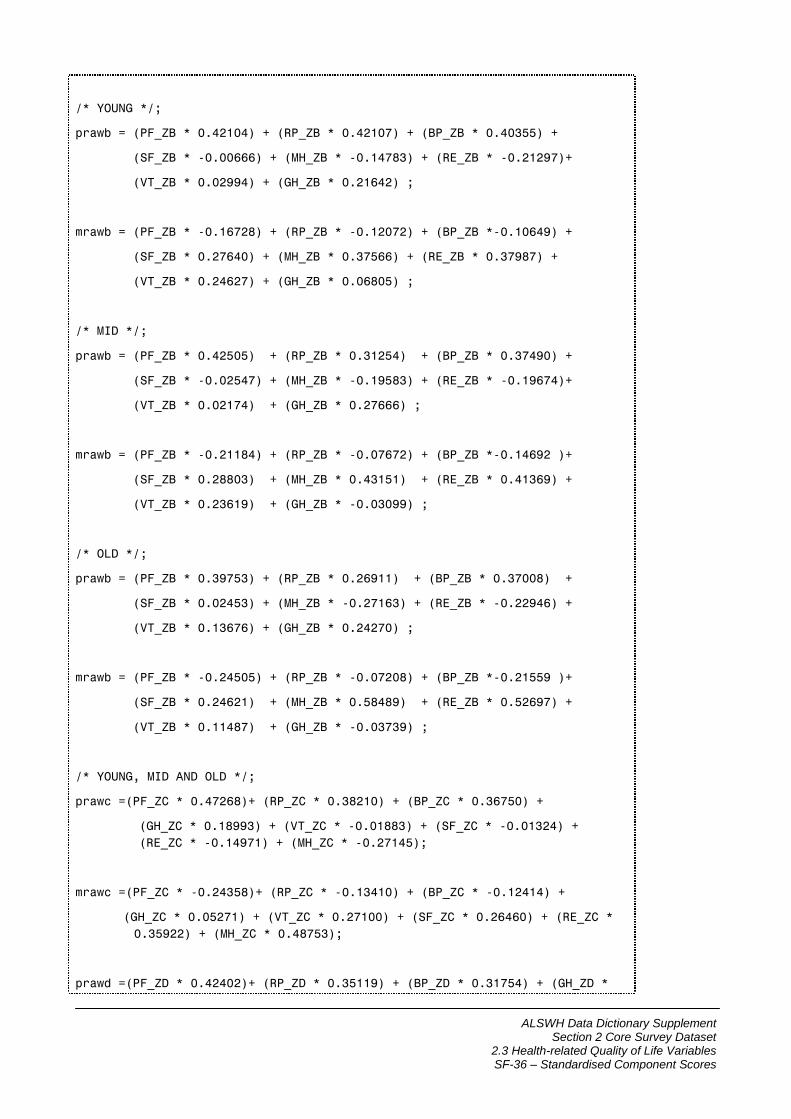
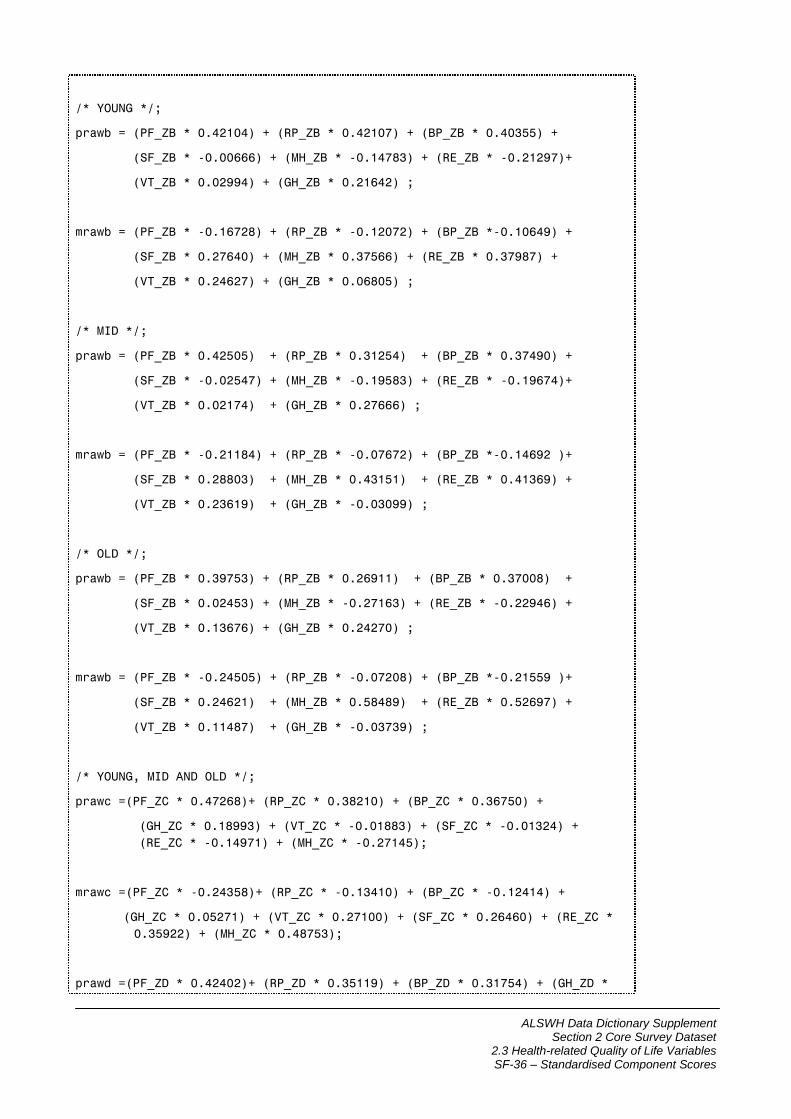
/* YOUNG */;
prawb = (PF_ZB * 0.42104) + (RP_ZB * 0.42107) + (BP_ZB * 0.40355) +
(SF_ZB * -0.00666) + (MH_ZB * -0.14783) + (RE_ZB * -0.21297)+
(VT_ZB * 0.02994) + (GH_ZB * 0.21642) ;
mrawb = (PF_ZB * -0.16728) + (RP_ZB * -0.12072) + (BP_ZB *-0.10649) +
(SF_ZB * 0.27640) + (MH_ZB * 0.37566) + (RE_ZB * 0.37987) +
(VT_ZB * 0.24627) + (GH_ZB * 0.06805) ;
/* MID */;
prawb = (PF_ZB * 0.42505) + (RP_ZB * 0.31254) + (BP_ZB * 0.37490) +
(SF_ZB * -0.02547) + (MH_ZB * -0.19583) + (RE_ZB * -0.19674)+
(VT_ZB * 0.02174) + (GH_ZB * 0.27666) ;
mrawb = (PF_ZB * -0.21184) + (RP_ZB * -0.07672) + (BP_ZB *-0.14692 )+
(SF_ZB * 0.28803) + (MH_ZB * 0.43151) + (RE_ZB * 0.41369) +
(VT_ZB * 0.23619) + (GH_ZB * -0.03099) ;
/* OLD */;
prawb = (PF_ZB * 0.39753) + (RP_ZB * 0.26911) + (BP_ZB * 0.37008) +
(SF_ZB * 0.02453) + (MH_ZB * -0.27163) + (RE_ZB * -0.22946) +
(VT_ZB * 0.13676) + (GH_ZB * 0.24270) ;
mrawb = (PF_ZB * -0.24505) + (RP_ZB * -0.07208) + (BP_ZB *-0.21559 )+
(SF_ZB * 0.24621) + (MH_ZB * 0.58489) + (RE_ZB * 0.52697) +
(VT_ZB * 0.11487) + (GH_ZB * -0.03739) ;
/* YOUNG, MID AND OLD */;
prawc =(PF_ZC * 0.47268)+ (RP_ZC * 0.38210) + (BP_ZC * 0.36750) +
(GH_ZC * 0.18993) + (VT_ZC * -0.01883) + (SF_ZC * -0.01324) +
(RE_ZC * -0.14971) + (MH_ZC * -0.27145);
mrawc =(PF_ZC * -0.24358)+ (RP_ZC * -0.13410) + (BP_ZC * -0.12414) +
(GH_ZC * 0.05271) + (VT_ZC * 0.27100) + (SF_ZC * 0.26460) + (RE_ZC *
0.35922) + (MH_ZC * 0.48753);
prawd =(PF_ZD * 0.42402)+ (RP_ZD * 0.35119) + (BP_ZD * 0.31754) + (GH_ZD *
ALSWH Data Dictionary Supplement
Section 2 Core Survey Dataset 2.3 Health-related Quality of Life Variables SF-36 – Standardised Component Scores
0.24954) + (VT_ZD * 0.02877) + (SF_ZD * -0.00753) + (RE_ZD * -
0.19206) + (MH_ZD * -0.22069);
mrawd =(PF_ZD * -0.22999)+ (RP_ZD * -0.12329) + (BP_ZD * -0.09731) + (GH_ZD
* -0.01571) + (VT_ZD * 0.23534) + (SF_ZD * 0.26876) + (RE_ZD *
0.43407) + (MH_ZD * 0.48581);
/*******************************************************************
* CALCULATE PCS AND MCS *
*******************************************************************/
* A. AUSTRALIAN POPULATION – AGE SPECIFID pg 76 McCALLUM *
* B. ALSWH SAMPLE AT SURVEY 1 *
* C. AUSTRALIAN ADULT POPULATION *
* D. US POPULATION *
*******************************************************************/
/* YOUNG, MID AND OLD */;
PCSA = (prawa*10) + 50 ;
MCSA = (mrawa*10) + 50 ;
PCSWHA = (prawb*10) + 50 ;
MCSWHA = (mrawb*10) + 50 ;
PCS_ABS = (prawc*10) + 50 ;
MCS_ABS = (mrawc*10) + 50 ;
PCS_US = (prawd*10) + 50 ;
MCS_US = (mrawd*10) + 50 ;
ALSWH Data Dictionary Supplement
Section 2 Core Survey Dataset 2.3 Health-related Quality of Life Variables SF-36 – Standardised Component Scores
The SAS code the component scores is:
/***********************************************************
* COMPUTE Z SCORES *
************************************************************
* MEAN AND SD FROM THE FACTOR ANALYTIC SAMPLE OF THE *
* AUSTRALIAN POPULATION AGED 18 T0 24 YEARS (YOUNGER), *
* 45 T0 54 YEARS (MID-AGE) & 65+ YEARS (OLDER) *
* REF: STEPHENSON -*
***********************************************************/
/* YOUNG */;
PF_ZA=(PF-90.9)/17.5;
RP_ZA=(RP-86.7)/28.7;
BP_ZA=(BP-82.1)/20.8;
GH_ZA=(GH-73.9)/19.5;
VT_ZA=(VT-63.4)/18.9;
SF_ZA=(SF-84.0)/20.0;
RE_ZA=(RE-84.6)/29.9;
MH_ZA=(MH-73.0)/15.8;
/* MID */;
PF_ZA=(PF-83.5)/21.4 ;
RP_ZA=(RP-84.2)/32.4 ;
BP_ZA=(BP-77.8)/23.5 ;
GH_ZA=(GH-73.5)/20.0 ;
VT_ZA=(VT-64.8)/18.3 ;
SF_ZA=(SF-86.5)/20.8 ;
RE_ZA=(RE-86.9)/29.0 ;
MH_ZA=(MH-75.2)/15.4 ;
/* OLD */;
PF_ZA=(PF-57.3)/28.8 ;
RP_ZA=(RP-56.0)/42.8 ;
BP_ZA=(BP-65.4)/28.6 ;
GH_ZA=(GH-61.1)/22.4 ;
VT_ZA=(VT-57.4)/21.4 ;
SF_ZA=(SF-77.3)/27.7 ;
RE_ZA=(RE-72.1)/37.0 ;
MH_ZA=(MH-75.3)/17.3 ;
ALSWH Data Dictionary Supplement
Section 2 Core Survey Dataset 2.3 Health-related Quality of Life Variables SF-36 – Standardised Component Scores
/***********************************************************
* MEAN AND SD FROM THE ALSWH SAMPLE (AUSTRALIA) *
* SEPARATELY FOR EACH AGE COHORT *
***********************************************************/
/* YOUNG */;
PF_ZB=(PF-90.19)/15.42;
RP_ZB=(RP-82.82)/30.35;
BP_ZB=(BP-74.18)/21.47;
GH_ZB=(GH-68.34)/20.56;
VT_ZB=(VT-56.64)/19.81;
SF_ZB=(SF-76.03)/23.16;
RE_ZB=(RE-69.98)/37.40;
MH_ZB=(MH-67.91)/18.27;
/* MID */;
PF_ZB=(PF-85.08)/18.66;
RP_ZB=(RP-79.57)/35.22;
BP_ZB=(BP-70.65)/23.80;
GH_ZB=(GH-71.90)/20.60;
VT_ZB=(VT-58.08)/20.94;
SF_ZB=(SF-81.38)/23.72;
RE_ZB=(RE-76.96)/36.33;
MH_ZB=(MH-72.12)/18.00;
/* OLD */;
PF_ZB=(PF-63.35)/25.94;
RP_ZB=(RP-57.39)/43.24;
BP_ZB=(BP-65.09)/26.68;
GH_ZB=(GH-65.36)/22.04;
VT_ZB=(VT-60.02)/20.90;
SF_ZB=(SF-81.09)/25.58;
RE_ZB=(RE-75.80)/37.87;
MH_ZB=(MH-76.52)/17.21;
/***********************************************************
* MEAN AND SD FROM AUSTRALIAN ADULT POPULATION *
* THE NATIONAL HEALTH SURVEY:SF-36 POPULATION NORMS 1995 *
***********************************************************/
PF_ZC=(PF-83.46290)/23.22864;
ALSWH Data Dictionary Supplement
Section 2 Core Survey Dataset 2.3 Health-related Quality of Life Variables SF-36 – Standardised Component Scores
RP_ZC=(RP-80.28166)/34.83783;
BP_ZC=(BP-76.94163)/24.83714;
GH_ZC=(GH-71.81575)/20.35165;
VT_ZC=(VT-64.47694)/19.77187;
SF_ZC=(SF-85.05929)/22.29047;
RE_ZC=(RE-83.19165)/32.15215;
MH_ZC=(MH-75.97772)/16.96210;
/***********************************************************
* MEAN AND SD FROM US ADULT POPULATION *
* SF-36 Physical & Mental Health Summary Scales: *
* A User's Manual *
***********************************************************/
PF_ZD=(PF-84.52404)/22.89490;
RP_ZD=(RP-81.19907)/33.79729;
BP_ZD=(BP-75.49196)/23.55879;
GH_ZD=(GH-72.21316)/20.16964;
VT_ZD=(VT-61.05453)/20.86942;
SF_ZD=(SF-83.59753)/22.37642;
RE_ZD=(RE-81.29467)/33.02717;
MH_ZD=(MH-74.84212)/18.01189;
/******************************************************************
* COMPUTE SAMPLE RAW FACTOR SCORES WHEN ALL 8 SCALES NON-MISSING *
*******************************************************************/
* Z SCORES ARE FROM ABOVE WITH SCORING COEFFICIENTS FROM *
* A. AUSTRALIAN POPULATION – AGE SPECIFID pg 76 McCALLUM *
* B. ALSWH SAMPLE AT SURVEY 1 *
* C. AUSTRALIAN ADULT POPULATION *
* D. US POPULATION *
*******************************************************************/
/* YOUNG, MID AND OLD */;
prawa =(PF_ZA * .44)+ (RP_ZA * .41) + (BP_ZA * .32) + (SF_ZA * 0.02)+
(MH_ZA * -.31)+(RE_ZA * 0.004) +(VT_ZA * -.08)+(GH_ZA * 0.14);
mrawa =(PF_ZA * -.20) +(RP_ZA * -.17) +(BP_ZA * -.08) +(SF_ZA * .24)+
(MH_ZA * .54) +(RE_ZA * .22) +(VT_ZA * 0.34) +(GH_ZA * 0.11) ;
ALSWH Data Dictionary Supplement
Section 2 Core Survey Dataset 2.3 Health-related Quality of Life Variables SF-36 – Standardised Component Scores
/* YOUNG */;
prawb = (PF_ZB * 0.42104) + (RP_ZB * 0.42107) + (BP_ZB * 0.40355) +
(SF_ZB * -0.00666) + (MH_ZB * -0.14783) + (RE_ZB * -0.21297)+
(VT_ZB * 0.02994) + (GH_ZB * 0.21642) ;
mrawb = (PF_ZB * -0.16728) + (RP_ZB * -0.12072) + (BP_ZB *-0.10649) +
(SF_ZB * 0.27640) + (MH_ZB * 0.37566) + (RE_ZB * 0.37987) +
(VT_ZB * 0.24627) + (GH_ZB * 0.06805) ;
/* MID */;
prawb = (PF_ZB * 0.42505) + (RP_ZB * 0.31254) + (BP_ZB * 0.37490) +
(SF_ZB * -0.02547) + (MH_ZB * -0.19583) + (RE_ZB * -0.19674)+
(VT_ZB * 0.02174) + (GH_ZB * 0.27666) ;
mrawb = (PF_ZB * -0.21184) + (RP_ZB * -0.07672) + (BP_ZB *-0.14692 )+
(SF_ZB * 0.28803) + (MH_ZB * 0.43151) + (RE_ZB * 0.41369) +
(VT_ZB * 0.23619) + (GH_ZB * -0.03099) ;
/* OLD */;
prawb = (PF_ZB * 0.39753) + (RP_ZB * 0.26911) + (BP_ZB * 0.37008) +
(SF_ZB * 0.02453) + (MH_ZB * -0.27163) + (RE_ZB * -0.22946) +
(VT_ZB * 0.13676) + (GH_ZB * 0.24270) ;
mrawb = (PF_ZB * -0.24505) + (RP_ZB * -0.07208) + (BP_ZB *-0.21559 )+
(SF_ZB * 0.24621) + (MH_ZB * 0.58489) + (RE_ZB * 0.52697) +
(VT_ZB * 0.11487) + (GH_ZB * -0.03739) ;
/* YOUNG, MID AND OLD */;
prawc =(PF_ZC * 0.47268)+ (RP_ZC * 0.38210) + (BP_ZC * 0.36750) +
(GH_ZC * 0.18993) + (VT_ZC * -0.01883) + (SF_ZC * -0.01324) +
(RE_ZC * -0.14971) + (MH_ZC * -0.27145);
mrawc =(PF_ZC * -0.24358)+ (RP_ZC * -0.13410) + (BP_ZC * -0.12414) +
(GH_ZC * 0.05271) + (VT_ZC * 0.27100) + (SF_ZC * 0.26460) + (RE_ZC *
0.35922) + (MH_ZC * 0.48753);
prawd =(PF_ZD * 0.42402)+ (RP_ZD * 0.35119) + (BP_ZD * 0.31754) + (GH_ZD *

ALSWH Data Dictionary Supplement
Section 2 Core Survey Dataset 2.3 Health-related Quality of Life Variables SF-36 – Standardised Component Scores
0.24954) + (VT_ZD * 0.02877) + (SF_ZD * -0.00753) + (RE_ZD * -
0.19206) + (MH_ZD * -0.22069);
mrawd =(PF_ZD * -0.22999)+ (RP_ZD * -0.12329) + (BP_ZD * -0.09731) + (GH_ZD
* -0.01571) + (VT_ZD * 0.23534) + (SF_ZD * 0.26876) + (RE_ZD *
0.43407) + (MH_ZD * 0.48581);
/*******************************************************************
* CALCULATE PCS AND MCS *
*******************************************************************/
* A. AUSTRALIAN POPULATION – AGE SPECIFID pg 76 McCALLUM *
* B. ALSWH SAMPLE AT SURVEY 1 *
* C. AUSTRALIAN ADULT POPULATION *
* D. US POPULATION *
*******************************************************************/
/* YOUNG, MID AND OLD */;
PCSA = (prawa*10) + 50 ;
MCSA = (mrawa*10) + 50 ;
PCSWHA = (prawb*10) + 50 ;
MCSWHA = (mrawb*10) + 50 ;
PCS_ABS = (prawc*10) + 50 ;
MCS_ABS = (mrawc*10) + 50 ;
PCS_US = (prawd*10) + 50 ;
MCS_US = (mrawd*10) + 50 ;
ALSWH Data Dictionary Supplement
Section 2 Core Survey Dataset 2.3 Health-related Quality of Life Variables SF-36 – Standardised Component Scores
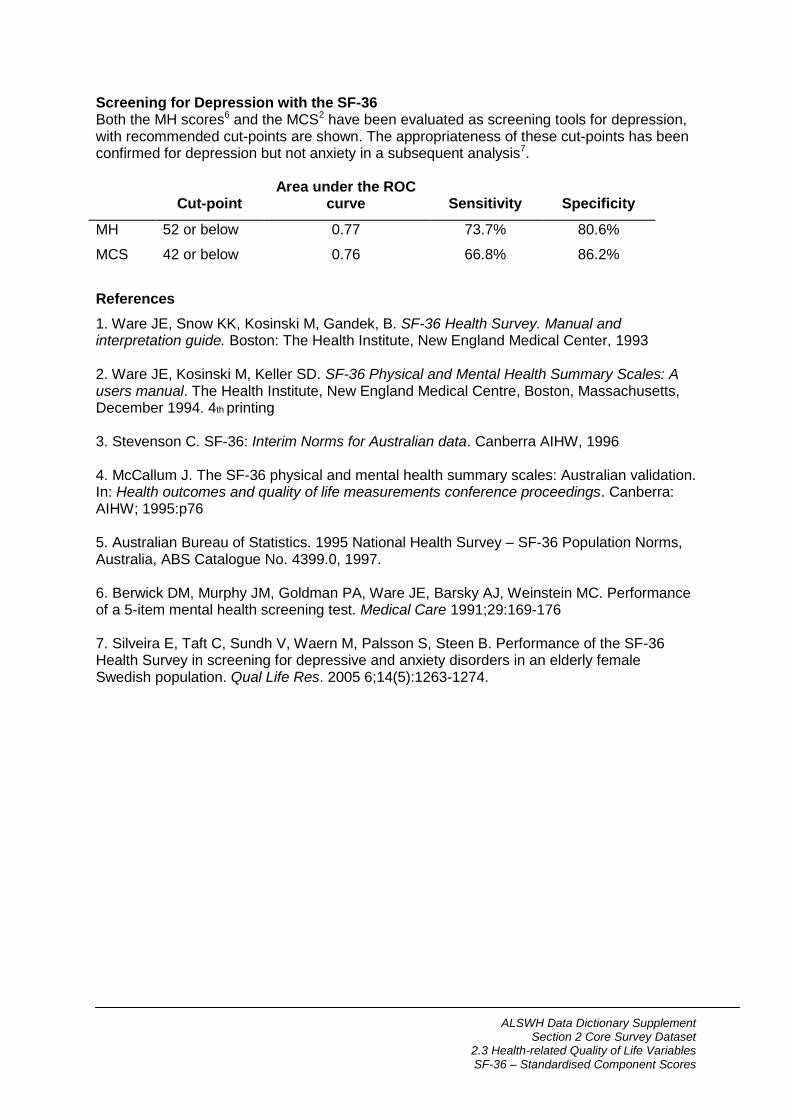
Screening for Depression with the SF-36 Both the MH scores6 and the MCS2 have been evaluated as screening tools for depression, with recommended cut-points are shown. The appropriateness of these cut-points has been confirmed for depression but not anxiety in a subsequent analysis7.
Cut-point Area under the ROC
curve Sensitivity Specificity
MH 52 or below 0.77 73.7% 80.6%
MCS 42 or below 0.76 66.8% 86.2%
References
1. Ware JE, Snow KK, Kosinski M, Gandek, B. SF-36 Health Survey. Manual and interpretation guide. Boston: The Health Institute, New England Medical Center, 1993 2. Ware JE, Kosinski M, Keller SD. SF-36 Physical and Mental Health Summary Scales: A users manual. The Health Institute, New England Medical Centre, Boston, Massachusetts, December 1994. 4th printing 3. Stevenson C. SF-36: Interim Norms for Australian data. Canberra AIHW, 1996 4. McCallum J. The SF-36 physical and mental health summary scales: Australian validation. In: Health outcomes and quality of life measurements conference proceedings. Canberra: AIHW; 1995:p76 5. Australian Bureau of Statistics. 1995 National Health Survey – SF-36 Population Norms, Australia, ABS Catalogue No. 4399.0, 1997. 6. Berwick DM, Murphy JM, Goldman PA, Ware JE, Barsky AJ, Weinstein MC. Performance of a 5-item mental health screening test. Medical Care 1991;29:169-176 7. Silveira E, Taft C, Sundh V, Waern M, Palsson S, Steen B. Performance of the SF-36 Health Survey in screening for depressive and anxiety disorders in an elderly female Swedish population. Qual Life Res. 2005 6;14(5):1263-1274.