Embed Size (px)
Citation preview
MPIDR WORKING PAPER WP 2014-005JUNE 2014
Oliver Wisser ([email protected]) James W. Vaupel ([email protected])
The sex differential in mortality: A historical comparison of the adult-age pattern of the ratio and the difference
Max-Planck-Institut für demografi sche ForschungMax Planck Institute for Demographic ResearchKonrad-Zuse-Strasse 1 · D-18057 Rostock · GERMANYTel +49 (0) 3 81 20 81 - 0; Fax +49 (0) 3 81 20 81 - 202; http://www.demogr.mpg.de
© Copyright is held by the authors.
Working papers of the Max Planck Institute for Demographic Research receive only limited review.Views or opinions expressed in working papers are attributable to the authors and do not necessarily refl ect those of the Institute.
1
The sex differential in mortality: A historical comparison of the adult-age
pattern of the ratio and the difference
Abstract
The ratio (RMR) is the standard measure of sex differentials in mortality. It is
commonly known that the RMR was historically small and increased throughout the
20th
century. However, numerical properties might account for the trend in the RMR
rather than sex differences in risk factors. In this study we examine the age pattern of
the absolute difference in male to female mortality rates (DMR) as an alternative
measure in a historical context and compare it to the RMR pattern. Whereas the RMR
is close to one at every age in the 19th
and early 20th
century and increases until the
present day, the adult age pattern of the DMR is relatively stable throughout the last
150 years. We also found that the DMR is approximately exponentially increasing
from age 40 to 90, implying a universal biological force behind sex differentials in
mortality. However, interactions between biology, behavior and environment are
complicated and have to be considered when interpreting these findings. Moreover,
between ages 15 and 40 the DMR declined in the second half of the 20th
century,
whereas the RMR increased. Hence, the trend in the latter measure is likely to be an
artifact of very different mortality regimes between populations. Therefore, we argue
that it is necessary to consider both measures when conducting comparative analyses
and to be careful in interpreting their time, cross-cultural and age trends, since they
can lead to different conclusion about sex specific underlying risk factors.
2
Introduction
Sex differentials in mortality
It is well documented that in all human populations for which respective vitality data
exist male death rates exceed that of females at virtually every single age year. In
contemporary developed countries, the male disadvantage is universal throughout the
whole lifespan, whereas in various historical and developing countries a female
disadvantage is reported especially during childbearing years. The disparity in life
expectancy between the sexes has been growing throughout the 20th
century. This
diverging trend can partly be explained by the declining rates in maternal mortality.
However, a major element is attributable to sex differences in behavior and biology.
Due to these differences, males and females respond differently to changing
environments in the outcome of mortality. For instance, primary care, specialty care,
emergency treatment, diagnostic services, and annual total charges are all
significantly higher for women, whereas mortality is higher in men (Bertakis et al.
2000). It has been found that this is most likely due to a higher incidence rate of non-
fatal diseases in women and fatal diseases in men, like cardiovascular diseases, rather
than better self-assessment of signs of diseases in women (Case and Paxon 2005).
Hence, biological and behavioral factors, which account for a higher rate of fatal
diseases among men, in combination with improving health care systems affect the
diverging sex gap. In former East-Bloc countries, behavioral risk factors alone
account for extensively high excess male mortality. For example, 15 year old Russian
males faced a 12.6 year lower life expectancy than females in 2000-09. This is
extraordinary high compared to western developed countries (e.g., Germany: 5 years)
and had been attributed to an uncommonly high alcohol and tobacco consumption
rate among Russian males (McCartney et al. 2010). In general, premature deaths due
to risky male behavioral patterns are universal and related to higher rates of homicide
(Gartner et al. 1990), suicide (Möller-Leimkühler 2003), drug abuse (Rehm et al.
2006) and traffic accidents (Wilson and Daly 1985).
Biological sex differences account for some part of this sex gap, but are assumed to
be small and temporarily invariant. In contrast, behavioral patterns and environmental
conditions are suggested as primary causes for variations in the sex gap between
populations (Rogers et al. 2010, Seifarth 2012). However, the specific determinants
and interaction effects of all factors remain unclear (Rogers 2010, Nathanson 1984).
In terms of the diverging sex gap, it had been suggested that the widespread
introduction of cigarettes, which was socially more accepted and common among
males in the first half of the 20th
century, contributed to higher rates of cardiovascular
diseases among men and is therefore an important factor for explaining the increase
in the sex differential in life expectancy (Waldron 1985). Since the 1980s the gender
gap in life expectancy started to converge in westernized countries due to the late
effects of increased tobacco consumption among women (Pampel 2003). Actually,
smoking accounts for 40-80% of the sex gap in European countries (McCartney
2011).
Since behavioral risk patterns show variation over age -a prominent example is the
immense drop in traffic accident rates between young adults versus middle age adults
(e.g., Wilson and Daly 1985)-, an age specific measure of sex mortality differentials
is useful to highlight certain age groups in which males are exposed to an unusually
high risk. This information is important for developing strategies of health and risk
prevention and to understand how environmental or social conditions trigger excess
male mortality. Even though cause specific mortality data would be ideal to identify
3
sex and age specific differentials in risk factors, this information is often not available
or reliable especially for historical data and developing countries. Moreover, cause
specific data may be biased by several factors reducing the reliability of death
certificates (e.g., Modelmog et al. 1992). The most commonly used method in
measuring sex differentials over age in either cause specific or all-cause mortality is
the ratio.
The sex mortality rate ratio in a historical context
Documentations of the ratio in male to female mortality rates (RMR) can be traced
back to a long tradition of studies of the sex gap. One of the pioneers who reported on
increasing age specific RMR in the early 20th
century was Dorothy Wiehl (1938). She
first mentioned a diverging sex gap in the 20th
century by means of the ratio in
mortality rates. Her findings inspired demographers to focus attention on this topic. In
the following decade the ratio had been established as the preferred age specific
measure for sex mortality differentials. Yerushalmy (1943), for instance, studied the
age pattern of the RMR. He reported that the relative mortality risk between males
and females is highest around ages 20 and 60. This ‗two humps‘-pattern of the RMR
is universal in westernized countries in the 20th
century, but rare in 19th
century
Europe (Glei 2005). Based on the first descriptive analyses, researchers focused their
attention on the underlying determinants of the diverging sex gap by analyzing the
RMR for different subpopulations and causes of death.
For example, Martin (1951) conducted an extensive analysis of the RMR in European
countries between the 1870s and the 1940s to identify determinants of the evolving
sex gap. He analyzed the ratio of male to female cause, social class and occupation
specific death rates. He found that occupational risk was the main driver in young
male mortality in the second half of the 19th
century, especially for industrial workers.
With the beginning of the 20th
century safety permanently increased in hazardous
working environments which mainly affected young workers, who did most of the
manual work. This fact puzzles Martin, since the RMR increased, especially at
younger ages. He tried to explain this paradox with rapidly declining maternal
mortality. However, even though maternal mortality dropped rapidly, it might not
explain the increase of the RMR throughout the 20th
century. Moreover, maternal
mortality did not substantially decline anymore in Western European countries after
the 1960s (De Brouwere et al. 1998) and cannot explain the increasing RMR at young
adult ages throughout the last century. Martin (1951) also found that a very high
RMR appears in the highest social class, whereas it was lowest in the poorest class.
This is paradox when considering that in the lowest class males had been exposed to
more hazardous work. Irwin added an interesting explanation of these paradoxes in
the discussion attached to Martin‘s article. By considering that the RMR is inversely
related to the denominator, the observed phenomenon may be explained, at least in
part, by declining mortality rates in the westernized world. Furthermore, it may
explain higher RMR in high social classes, since higher classes experience lower
mortality rates compared to lower classes. Even though this is a reasonable alternative
explanation of the observed trend, Irwin‘s objections have been mostly ignored in
ensuing analyses of the sex differential by means of the mortality rate ratio. The
numerical problem appears to be always when sex differentials in mortality between
populations are compared, which differ in their mortality regime. This is also a
problem when comparing different age groups within the population. Differences in
the RMR may always be affected by differences in mortality levels and, hence,
information about differences in sex specific risk factors can be distorted.
4
In other fields of research, the different implications of absolute and relative measures
had been a topic of great importance. For example, Moser et al. (2007) showed that
both measures can lead to different conclusions about health inequalities across
countries and times. The authors found that for some countries the time change of
health inequalities was either positive or negative depending on the measure. In
medical studies it has been argued, that an absolute measure between control and
treatment group is more useful in rational decision-making of medical treatment in
clinical practice (Tramer 2005).
Even though the methodological problem was mentioned 60 years ago and is debated
in epidemiological and clinical studies, the age pattern of total or cause-specific
mortality rates by means of the ratio in a historical or cross-cultural context is still the
preferred method in recent studies of the sex gap (e.g., Glei 2005, Gjonça, 2005,
Kalben 2000, Kostaki, 2011, Sorenson 2011, Yang and Kozloski 2012, Westerling
2003).
The reasons for the unawareness of the numerical problem of the RMR might be
manifold. One likely explanation is that the widening of the sex difference in life
expectancy throughout the 20th
century perfectly fits into the observation of
increasing RMR‘s. However, Glei (2005) found that the declining sex gap in life
expectancy since the 1980s does not fit into the pattern of the RMR in westernized
countries. This is not entirely surprising, since the sex difference in life expectancy is
not necessarily proportional to the RMR (Pollard 1982, 1988). Another reason for the
uncritical interpretation and acceptance of the RMR might be that it is a simple
comprehensible measure which can be easily communicated to a broader public.
The age pattern of the absolute sex difference in mortality rates
An alternative measure to the RMR is the difference between male and female
mortality rates (DMR). This measure, however, is uncommon among demographers
and only a few studies report on it. For instance, Stolnitz (1956) studied the general
shape of sex differences in age specific survival probabilities, which is equal to the
negative of the sex difference in the probability of dying. Western populations
between 1920 and 1950 show a bathtub-shaped pattern of the difference; the curve
declined from age 0 to age 1 and increased slowly until age 40 and then more rapidly
until the oldest age (Stolnitz 1956). This is in accordance with the age pattern of
RMR found in the US population in 1910, 1965 (Retherford 1975) and 1980
(Wingard 1984). But what was the pattern in the 19th
century when the sex gap in life
expectancy was relatively small and how is it nowadays in contemporary countries?
Did the DMR always increase over age or is its age pattern time variant like for the
RMR? These questions cannot be answered, since no comprehensive analysis of the
DMR exists so far.
Aims of this study
A comprehensive study of the age pattern of the DMR is more than overdue. It is not
known how the age pattern of the DMR behaves in a historical context. In contrast,
the RMR had been extensively studied. It is well known, that its age pattern is very
flat and close to one in historical populations and increased throughout the last
century. However, this increase may partly be due to a substantial drop in overall
mortality levels since the late 19th
century and, hence, might not only reflect changes
in sex specific risk factors. If both sexes equally benefit from some reductions of risk
factors which lead to declining mortality rates over time, this would be reflected by
an increase of the RMR. The DMR, on the other hand, is not affected by reductions in

5
overall mortality levels. Moreover, the sex difference in life expectancy, the
‗currency‘ of the sex gap, is only poorly related to age specific contributions of the
RMR. In contrast, the relation between the DMR and sex differences in life
expectancy is much stronger and approximately proportional (Pollard 1982, 1988).
This study aims to analyze the age pattern of male versus female mortality rates in a
historical context and compare it to the trend of the male versus female mortality rate
ratio to fill in the gap of this underrated topic. For this purpose, we will analyze the
age pattern of the DMR and its historical changes throughout the past 150 years and
compare it to the RMR patterns. Since this study is mainly descriptive, we will only
briefly discuss determinants of the observed age patterns. Moreover, we focus on
adult ages and discuss possible applications in future research.
6
Data and Methods
Age and sex specific, decade-wise death counts (D(x)) and person years lived (E(x))
from the Human Mortality Database (HMD, 2014) were used to calculate age and sex
specific mortality rates (μM(x), μF(x)) as
(1) ( ) ( )
( )
The absolute difference of mortality rates, DMR(x), is calculated as
(2) ( ) ( ) ( )
and the ratio in mortality rates, RMR(x), by
(3) ( ) ( )
( ).
We calculated the DMR and the RMR for three European countries (Sweden, France,
England & Wales) in five decades (1860-9, 1900-9, 1950-9, 1980-9 and 2000-9) for
single age years from 15 to 90. The decade-wise counts of vitality data start at
January 1st of the first year and ends at December 31
st of the last year of the
respective decade.
Even though the HMD provides data up to 110+, we excluded these age groups from
our study, since population counts rapidly decline after age 90 especially in historical
populations. Observed patterns of the sex differentials at very old age might be more
due to statistical perturbations rather than real effects.
All calculations and figures were done using the statistical computing software R
(version 3.01) and the integrated development environment software RStudio (version
0.97.551).
7
Results
The ratio
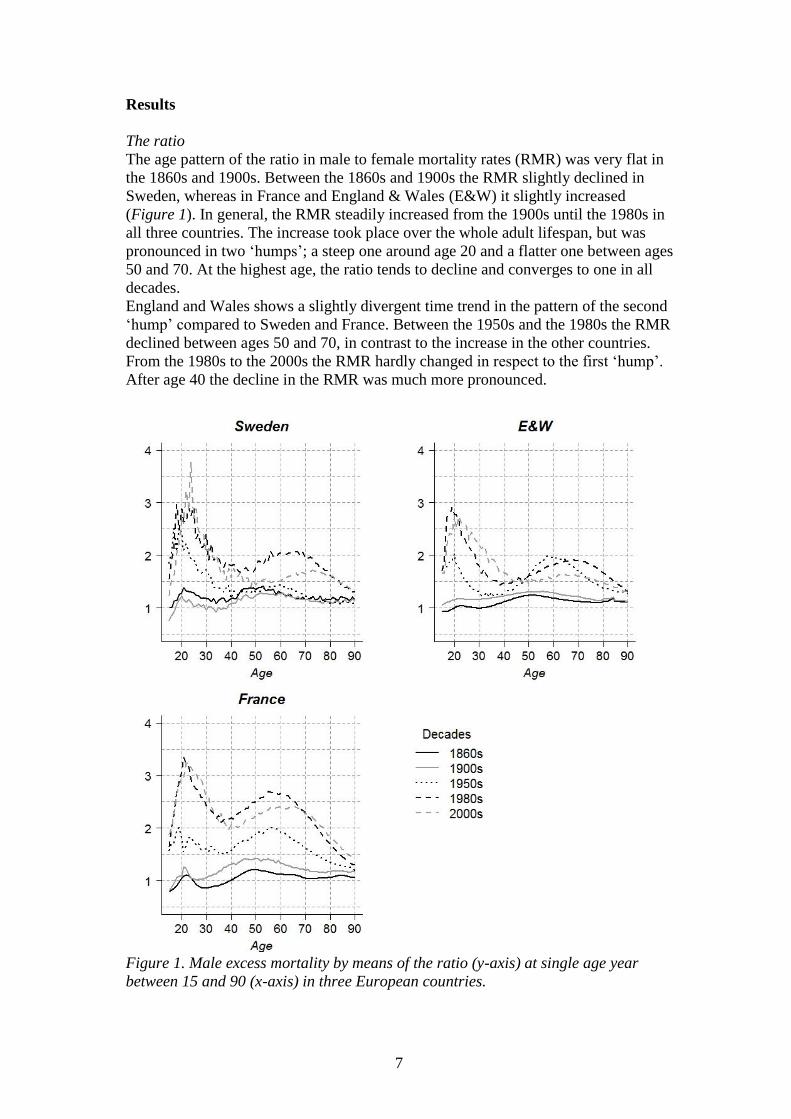
The age pattern of the ratio in male to female mortality rates (RMR) was very flat in
the 1860s and 1900s. Between the 1860s and 1900s the RMR slightly declined in
Sweden, whereas in France and England & Wales (E&W) it slightly increased
(Figure 1). In general, the RMR steadily increased from the 1900s until the 1980s in
all three countries. The increase took place over the whole adult lifespan, but was
pronounced in two ‗humps‘; a steep one around age 20 and a flatter one between ages
50 and 70. At the highest age, the ratio tends to decline and converges to one in all
decades.
England and Wales shows a slightly divergent time trend in the pattern of the second
‗hump‘ compared to Sweden and France. Between the 1950s and the 1980s the RMR
declined between ages 50 and 70, in contrast to the increase in the other countries.
From the 1980s to the 2000s the RMR hardly changed in respect to the first ‗hump‘.
After age 40 the decline in the RMR was much more pronounced.
Figure 1. Male excess mortality by means of the ratio (y-axis) at single age year
between 15 and 90 (x-axis) in three European countries.
8
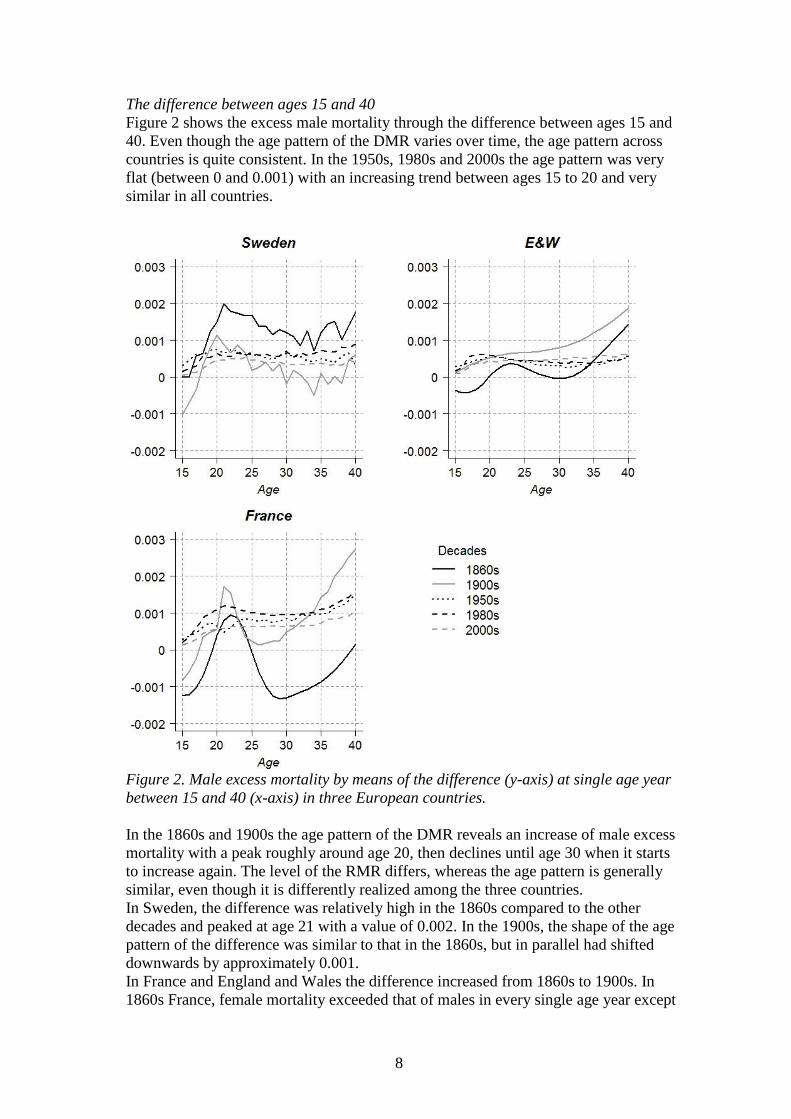
The difference between ages 15 and 40
Figure 2 shows the excess male mortality through the difference between ages 15 and
40. Even though the age pattern of the DMR varies over time, the age pattern across
countries is quite consistent. In the 1950s, 1980s and 2000s the age pattern was very
flat (between 0 and 0.001) with an increasing trend between ages 15 to 20 and very
similar in all countries.
Figure 2. Male excess mortality by means of the difference (y-axis) at single age year
between 15 and 40 (x-axis) in three European countries.
In the 1860s and 1900s the age pattern of the DMR reveals an increase of male excess
mortality with a peak roughly around age 20, then declines until age 30 when it starts
to increase again. The level of the RMR differs, whereas the age pattern is generally
similar, even though it is differently realized among the three countries.
In Sweden, the difference was relatively high in the 1860s compared to the other
decades and peaked at age 21 with a value of 0.002. In the 1900s, the shape of the age
pattern of the difference was similar to that in the 1860s, but in parallel had shifted
downwards by approximately 0.001.
In France and England and Wales the difference increased from 1860s to 1900s. In
1860s France, female mortality exceeded that of males in every single age year except
9
for ages 19 to 25. Around these ages, the DMR is characterized by a peak with a
maximum around 0.001 at age 22. From the 1860s to 1900s the DMR shifted
upwards, with the lowest change around younger ages (0 to 0.0025). However, the
general age pattern was entirely preserved.
In 1860s England and Wales, the difference showed a similar shape compared to
France, but with a less pronounced and lower peak at age 23 (0.00037). In the 1900s
the hump-shape was almost smoothed out and the difference was higher at each
single age year compared to the 1860s.
Throughout the second half of the 20th
century the level of the DMR hardly changed.
The only evident change is that, there is a slightly declining trend in Sweden and
France, whereas in England and Wales the DMR is relatively constant in the three
latest decades.
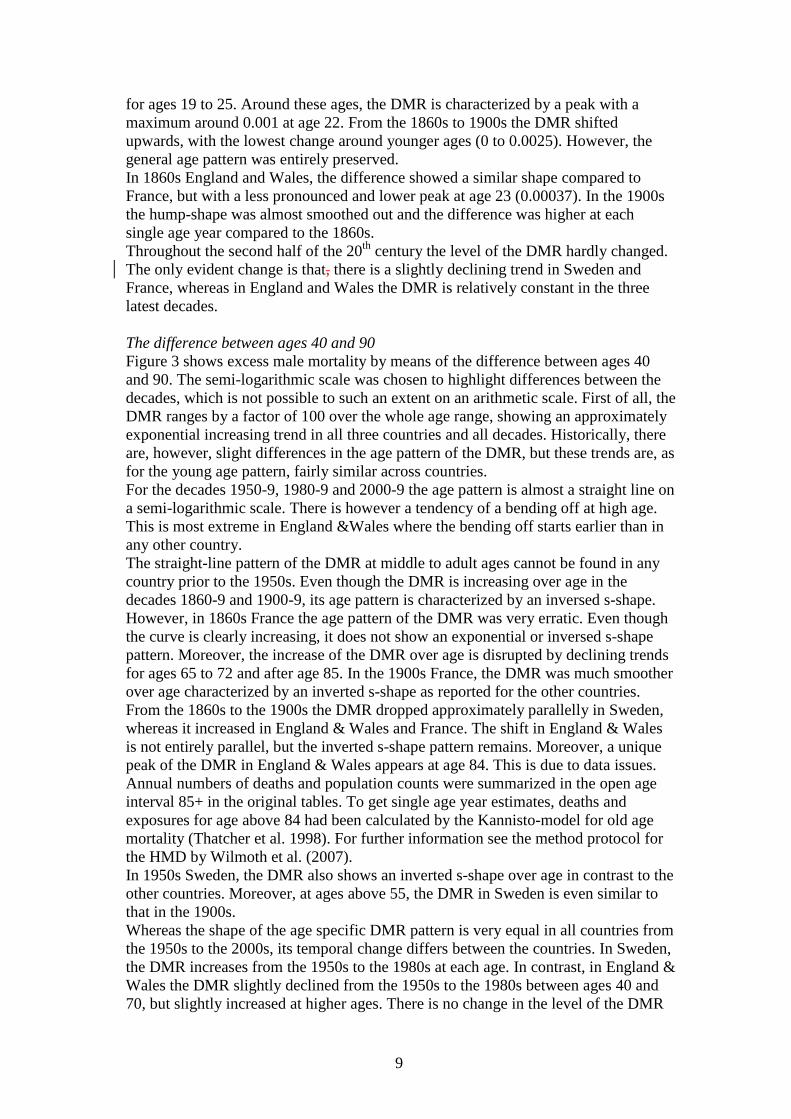
The difference between ages 40 and 90
Figure 3 shows excess male mortality by means of the difference between ages 40
and 90. The semi-logarithmic scale was chosen to highlight differences between the
decades, which is not possible to such an extent on an arithmetic scale. First of all, the
DMR ranges by a factor of 100 over the whole age range, showing an approximately
exponential increasing trend in all three countries and all decades. Historically, there
are, however, slight differences in the age pattern of the DMR, but these trends are, as
for the young age pattern, fairly similar across countries.
For the decades 1950-9, 1980-9 and 2000-9 the age pattern is almost a straight line on
a semi-logarithmic scale. There is however a tendency of a bending off at high age.
This is most extreme in England &Wales where the bending off starts earlier than in
any other country.
The straight-line pattern of the DMR at middle to adult ages cannot be found in any
country prior to the 1950s. Even though the DMR is increasing over age in the
decades 1860-9 and 1900-9, its age pattern is characterized by an inversed s-shape.
However, in 1860s France the age pattern of the DMR was very erratic. Even though
the curve is clearly increasing, it does not show an exponential or inversed s-shape
pattern. Moreover, the increase of the DMR over age is disrupted by declining trends
for ages 65 to 72 and after age 85. In the 1900s France, the DMR was much smoother
over age characterized by an inverted s-shape as reported for the other countries.
From the 1860s to the 1900s the DMR dropped approximately parallelly in Sweden,
whereas it increased in England & Wales and France. The shift in England & Wales
is not entirely parallel, but the inverted s-shape pattern remains. Moreover, a unique
peak of the DMR in England & Wales appears at age 84. This is due to data issues.
Annual numbers of deaths and population counts were summarized in the open age
interval 85+ in the original tables. To get single age year estimates, deaths and
exposures for age above 84 had been calculated by the Kannisto-model for old age
mortality (Thatcher et al. 1998). For further information see the method protocol for
the HMD by Wilmoth et al. (2007).
In 1950s Sweden, the DMR also shows an inverted s-shape over age in contrast to the
other countries. Moreover, at ages above 55, the DMR in Sweden is even similar to
that in the 1900s.
Whereas the shape of the age specific DMR pattern is very equal in all countries from
the 1950s to the 2000s, its temporal change differs between the countries. In Sweden,
the DMR increases from the 1950s to the 1980s at each age. In contrast, in England &
Wales the DMR slightly declined from the 1950s to the 1980s between ages 40 and
70, but slightly increased at higher ages. There is no change in the level of the DMR
10
between 1950s and 1980s France. After the 1980s all countries show a rapid
substantial decline of the DMR.
Figure 3. Male excess mortality by means of the difference (y-axis) at single age
years between 40 and 90 (x-axis) on a semi-logarithmic scale in three European
countries.
11
Discussion
The age pattern of the sex differential by means of the ratio substantially differs from
that by means of the difference. The most striking finding is that the DMR increases
from middle to old age (40 to 90) in all decades and countries in the study. Moreover,
in the three last decades the curve of the DMR is clearly exponentially increasing and
bends off at old age, except for 1950s Sweden. The bending off may be explained by
selection processes. Since males suffer from higher mortality, the proportion of frailer
individuals declines faster in the male population compared to in the female
population. The increase in the DMR is slowed down at higher ages. Such effects
―may be a factor in observed declines and reversals with age of mortality differentials
between pairs of population‖ (Vaupel et al. 1979, p.440). The explanation for the
exponential increase is, however, more challenging. In the 19th
and early 20th
century
the age pattern of the DMR describes an inverse s-shape curve rather than a straight
line. Hence, two DMR-specific curve-types can be found in all three countries in the
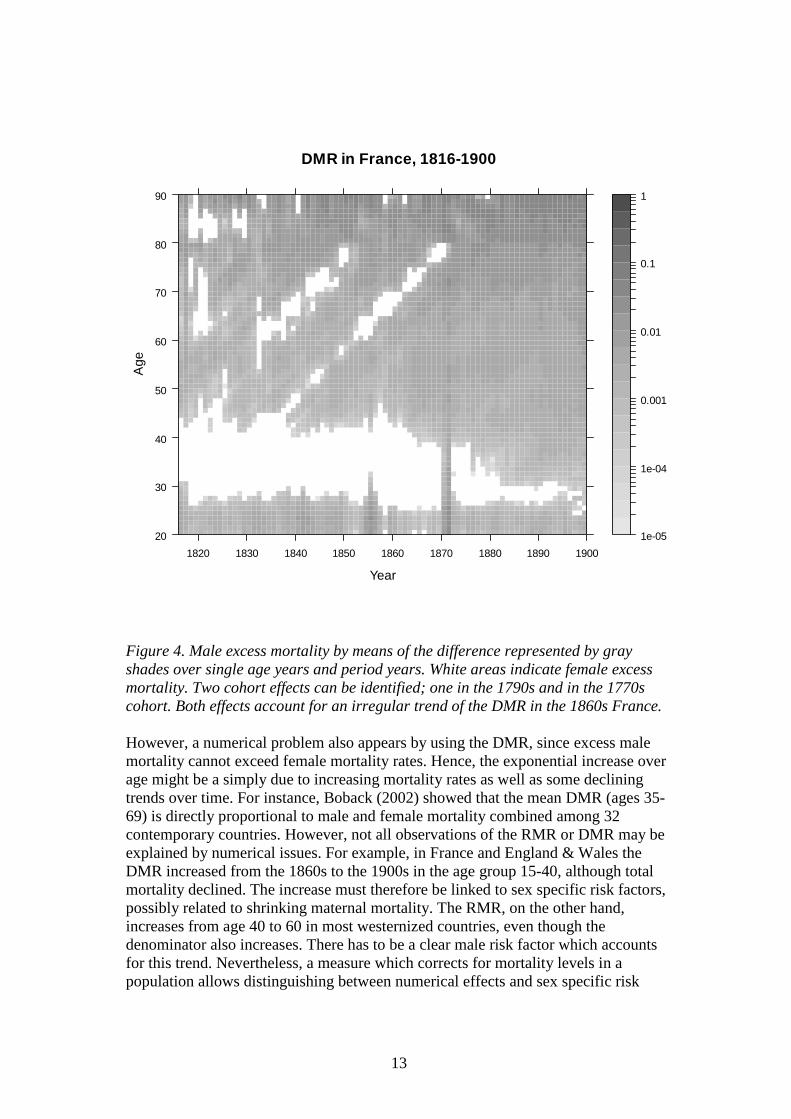
study. The irregular pattern in 1860s France is due to a cohort effect (see Figure 4).
As shown in Figure 4, the cohort effect traces back to the 1770s and 1790s birth
cohorts. This is a rare and remarkable example of female excess mortality throughout
major parts of the adult lifespan. This pattern might be linked to the devastating crop
failure and famine in 1788-89 and the following French revolution. The years around
the 1770s are also characterized by riots due to food shortages. However, shocks,
such as malnutrition in fetuses or early infancy, are only weakly related to mortality
in adult life (Roseboom et al. 2001, Myrskylä 2010) and a female disadvantage in late
life due to famines had not been reported so far. An alternative explanation might be
that the early shocks led to stronger selection among males due to higher infant
mortality compared to females. However, these are only speculations and so far there
is no explanation for the excess female mortality in the 1770s and 1790s cohorts in
France. Therefore, this observation needs further examination in future studies.
Since the age pattern of DMR at adult ages (40-90) is quite stable over time (except
for the special case of France) the underlying mechanism leading to this pattern
should be universal. Since sex differences in biological risk factors are assumed to be
fixed and invariant over time (Seifarth 2013), this explanation may be a good
candidate for driving the age pattern of the DMR. However, biological differences are
also assumed to be small between men and women (Rogers et al. 2010) and may not
account for a large part of the sex gap in mortality rates. For example, Luy (2003)
found that monks and nuns in cloistered populations, which share a similar life style,
have a life expectancy gap of approximately one year. The author concluded that this
difference is mainly attributed to biological differences. So why is the DMR then low
at young age, when external causes are mainly responsible for deaths and high at old
ages, when biological aging processes account for a major part of mortality? A
possible explanation can be found when considering the complexity of death events.
Even though biological sex differences are fixed, environmental and behavioral risk
factors can lead to an exaggeration in sex mortality rate differences due to
interactions with physiological aging processes. In simpler words, a risky behavior at
old age is more likely to be fatal compared to that behavior at a young age.
Environmental and behavioral risk factors have more impact on the chance of dying
with increasing age due to physiological aging processes. If women behave less
riskily, then their probability of mortality increases more slowly from each single age
year to the next compared to men. Hence, the mortality gap diverges over age, even
though biological differences can be small or even absent. Therefore, the exponential
12
increase in DMR may be solely attributed to sex differences in behavioral and
environmental risk factors. Variations over age in the level or shape of the DMR-
curve may be a result of temporal changes of the age pattern of such risk factors. A
good example is the rate of fatal traffic accidents per mile driven. The chance of an
accident declines from young age to middle age, but after a certain age it starts to
increase again until old age and even exceeds that of younger ages (Wilson and Daly
1985). Since this pattern is unlikely to be caused by higher risk taking among the
elderly, lower reaction times and higher frailty are possible determinants.
In contrast to the age pattern of the DMR, the RMR is flat in the 1860s and 1900s and
two ‗hump‘-shaped in the three latest decades, as already documented by several
other studies. Moreover, the RMR implies that the mortality differential had been
growing throughout the 20th
century at each specific age. This is, however, not
supported by the absolute sex difference in mortality rates. For instance, the DMR in
Sweden was much higher in the 1860s between age 17 and age 60 compared to all
other decades in the study. In contrast, the RMR in the 1860s was flat and did not
exceed the level at any single age in the 1980s and 2000s. Actually, male mortality
was generally very high due to alcohol consumption and tuberculosis (Fridlizius
1988) in historical Sweden. Between ages 15-40 the DMR shows a typically ‗hump‘-
shaped pattern in the 1860s and 1900s, whereas the age patterns in later decades are
flattened out. The ‗hump‘-shape is likely linked to maternal mortality. In contrast, the
RMR shows a temporarily reversed age pattern. It is flat in the two oldest decades,
but ‗hump‘-shaped in the three latest ones. Additionally, the DMR at young ages
tends to decline in two of the three countries (Sweden and France) throughout the 20th
century, whereas the ratio clearly increased in all countries. This might be an artifact
of declining mortality levels in the population, because the RMR increases with a
declining denominator.
The numerical problem is also likely to account for inconsistencies of the relative
proportion of changes in the RMR compared to the DMR. For the age group 15-40
the biggest changes in the DMR took place between the 1860s and 1900s, whereas
the biggest changes of the RMR in the same age bend took place from the 1900s until
the 1980s. The increase of the RMR can, at least in parts, be explained by the rapid
drop in mortality rates of both sexes with the beginning of the 20th
century rather than
by a divergence of sex specific risk factors. Therefore, the ratio has to be handled
when interpreting sex differentials in a historical context.
13
Figure 4. Male excess mortality by means of the difference represented by gray
shades over single age years and period years. White areas indicate female excess
mortality. Two cohort effects can be identified; one in the 1790s and in the 1770s
cohort. Both effects account for an irregular trend of the DMR in the 1860s France.
However, a numerical problem also appears by using the DMR, since excess male
mortality cannot exceed female mortality rates. Hence, the exponential increase over
age might be a simply due to increasing mortality rates as well as some declining
trends over time. For instance, Boback (2002) showed that the mean DMR (ages 35-
69) is directly proportional to male and female mortality combined among 32
contemporary countries. However, not all observations of the RMR or DMR may be
explained by numerical issues. For example, in France and England & Wales the
DMR increased from the 1860s to the 1900s in the age group 15-40, although total
mortality declined. The increase must therefore be linked to sex specific risk factors,
possibly related to shrinking maternal mortality. The RMR, on the other hand,
increases from age 40 to 60 in most westernized countries, even though the
denominator also increases. There has to be a clear male risk factor which accounts
for this trend. Nevertheless, a measure which corrects for mortality levels in a
population allows distinguishing between numerical effects and sex specific risk
DMR in France, 1816-1900
Year
Ag
e
20
30
40
50
60
70
80
90
1820 1830 1840 1850 1860 1870 1880 1890 1900
1e-05
1e-04
0.001
0.01
0.1
1

14
factors and provides a promising outlook on future research on the determinants of
the sex gap.
15
References
Bertakis, K. D., Azari, R., Helms, L. J., Callahan, E. J., & Robbins, J. A. (2000).
Gender differences in the utilization of health care services. Journal of Family
Practice, 49(2), 147-152.
Bobak, M. (2003). Relative and absolute gender gap in all-cause mortality in Europe
and the contribution of smoking. European Journal of Epidemiology, 18(1), 15-18.
Case, A., & Paxson, C. (2005). Sex differences in morbidity and mortality.
Demography, 42(2), 189-214.
De Brouwere, V., Tonglet, R., & Van Lerberghe, W. (1998). Strategies for reducing
maternal mortality in developing countries: what can we learn from the history of the
industrialized West?. Tropical Medicine & International Health, 3(10), 771-782.
Fridlizius, G. (1988). Sex differential mortality and socio-economic change, Sweden
1750–1910. Society, Health and Population during the Demographic Transition, 237-
272.
Gartner, R. (1990). The victims of homicide: a temporal and cross-national
comparison. American Sociological Review, 92-106.
Gjonça, A., Tomassini, C., Toson, B., & Smallwood, S. (2005). Sex differences in
mortality, a comparison of the United Kingdom and other developed countries.
Health Stat Q, 26, 6-16.
Kalben, B. B. (2000). Why men die younger: causes of mortality differences by sex.
North American Actuarial Journal, 4(4), 83-111.
King, N.B., Harper, S., Young, M.E. (2012). Use of relative and absolute effect
measures in reporting health inequalities: structured review. BMJ, Vol. 345, 1-8
Kostaki, A., Peristera, P., & Lanke, J. (2011). Modeling the Relationship Between
Male and Female Mortality Patterns in Modern Populations. Journal of Population
Ageing, 4(1-2), 33-63.
Glei, D.A. (2005). The sex gap in mortality: Historical patterns across twenty-four
countries. Paper presented at Section 203: Gender, Health, and Mortality, IUSSP
2005, Tours, France
Luy, M. (2003). Causes of male excess mortality: insights from cloistered
populations. Population and Development Review, 29(4), 647-676.
Martin, W. J. (1951). A comparison of the trends of male and female mortality.
Journal of the Royal Statistical Society. Series A (General), 114(3), 287-306.
Modelmog, D., Rahlenbeck, S., & Trichopoulos, D. (1992). Accuracy of death
certificates: a population-based, complete-coverage, one-year autopsy study in East
Germany. Cancer Causes & Control, 3(6), 541-546.
16
Möller-Leimkühler, A. M. (2003). The gender gap in suicide and premature death or:
why are men so vulnerable?. European Archives of Psychiatry and Clinical
Neuroscience, 253(1), 1-8.
Moser, K., Frost, C., & Leon, D. A. (2007). Comparing health inequalities across
time and place—rate ratios and rate differences lead to different conclusions: analysis
of cross-sectional data from 22 countries 1991–2001. International Journal of
Epidemiology, 36(6), 1285-1291.
Myrskylä, M. (2010). The Relative Effects of Shocks in Early‐and Later‐Life
Conditions on Mortality. Population and Development Review, 36(4), 803-829.
Nathanson, C. A. (1984). Sex differences in mortality. Annual Review of Sociology,
191-213.
Pampel, F. C. (2003). Declining sex differences in mortality from lung cancer in
high-income nations. Demography, 40(1), 45-65.
Pollard, J. H. (1982). The expectation of life and its relationship to mortality. Journal
of the Institute of Actuaries, 109(02), 225-240.
Pollard, J. H. (1988). On the decomposition of changes in expectation of life and
differentials in life expectancy. Demography, 25(2), 265-276.
Retherford, R. D. (1975). The changing sex differential in mortality. Westport, CT::
Greenwood Press.
Rogers, R. G., Everett, B. G., Saint Onge, J. M., & Krueger, P. M. (2010). Social,
behavioral, and biological factors, and sex differences in mortality. Demography,
47(3), 555-578.
Roseboom, T. J., Van Der Meulen, J. H., Ravelli, A. C., Osmond, C., Barker, D. J., &
Bleker, O. P. (2001). Effects of prenatal exposure to the Dutch famine on adult
disease in later life: an overview. Molecular and Cellular Endocrinology, 185(1), 93-
98.
Seifarth, J. E., McGowan, C. L., & Milne, K. J. (2012). Sex and life expectancy.
Gender Medicine, 9(6), 390-401.
Sorenson, S. B. (2011). Gender disparities in injury mortality: consistent, persistent,
and larger than you'd think. Journal Information, 101(S1).
Stolnitz, G. J. (1956). A century of international mortality trends: II. Population
Studies, 10(1), 17-42.
Thatcher, A. R., Kannisto, V., & Vaupel, J. W. (1998). The force of mortality at ages
80 to 120 (Vol. 22). Odense: Odense University Press.
Tramèr, M. R., & Walder, B. (2005). Number needed to treat (or harm). World
journal of surgery, 29(5), 576-581.
17
Vaupel, J. W., Manton, K. G., & Stallard, E. (1979). The impact of heterogeneity in
individual frailty on the dynamics of mortality. Demography, 16(3), 439-454.
Waldron, I. (1985). What do we know about causes of sex differences in mortality? A
review of the literature. Population Bulletin of the United Nations, (18), 59.
Westerling, R. (2003). Decreasing gender differences in``avoidable''mortality in
Sweden. Scandinavian Journal of Public Health, 31(5), 342-349.
Wiehl, D. G. (1938). Sex differences in mortality in the United States. The Milbank
Memorial Fund Quarterly, 145-155.
Wilmoth, J. R., Andreev, K., Jdanov, D., & Glei, D. A. (2007). Methods protocol for
the Human Mortality Database (version 5). Document of a series of discussions held
in Rostock, Germany, and Berkeley, USA Available online as part of the Human
Mortality Database (http://www. mortality. org/Public/Docs/MethodsProtocol. pdf).
Wilson, M., & Daly, M. (1985). Competitiveness, risk taking, and violence: The
young male syndrome. Ethology and sociobiology, 6(1), 59-73.
Wingard, D. L. (1984). The sex differential in morbidity, mortality, and lifestyle.
Annual Review of Public Health, 5(1), 433-458.
Yang, Y., & Kozloski, M. (2012). Change of sex gaps in total and cause-specific
mortality over the life span in the United States. Annals of Epidemiology, 22(2), 94-
103.
Yerushalmy, J. (1943). The age-sex composition of the population resulting from
natality and mortality conditions. The Milbank Memorial Fund Quarterly, 37-63.