Embed Size (px)
Citation preview
3.27 Hearing Loss and Hearing Aids: A PerspectiveM C Killion, Etymotic Research Ltd., Elk Grove Village, IL, USA
ª 2008 Elsevier Inc. All rights reserved.
3.27.1 Background 475
3.27.2 Hearing Loss and Signal-to-Noise Ratio Loss 476
3.27.2.1 Hearing Loss 476
3.27.2.2 Signal-to-Noise Ratio Loss 476
3.27.3 Hearing Aids 477
3.27.3.1 Early Hearing Aids 477
3.27.3.2 Modern Digital Hearing Aids – Limitations 478
3.27.3.3 Modern Digital Hearing Aids – Improvements 479
3.27.4 Satisfaction and Technology 480
3.27.5 Over-the-Counter Hearing Aids 481
3.27.6 The Future 482
References 482
Glossary
automatic gain control (AGC) Nonlinear hearing
aid compression circuitry designed to automati-
cally change gain as signal level changes or limit
output when signal level reaches a specified
criterion.
conductive loss Reduction in hearing sensitivity,
despite normal cochlear function, due to impaired
sound transmission through the external auditory
meatus, tympanic membrane, and ossicular chain.
feedback Sound produced when an amplification
system goes into oscillation, produced by amplified
sound from the receiver reaching the microphone
and being re-amplified.
minimum audible pressure (MAP) Denotes the
sound pressure level (SPL) at the eardrm required
by a listener to detect a tone.
over-the-counter (OTC) Hearing aids hearing
enhancement devices that provide amplification of
sounds, available without the assistance of a hear-
ing professional.
sensorineural loss Hearing loss resulting from
damage to the sensory end organs and/or their
associated nerve fibers.
signal-to-noise ratio (SNR) Relative difference in
decibels between a sound of interest and a back-
ground of noise.
SNR loss Increase in SNR, relative to normal-
hearing performance, required to understand
speech in noise.
sound pressure level (SPL) Magnitude of sound
expressed in decibels above the reference level of
20 mpa.
wide-dynamic-range compression (WDRC) A
form of automatic gain control that provides greater
gain for quiet sounds than for loud sounds, with a
smooth change in gain spread out between the two
conditions.
3.27.1 Background
There are two difficulties that accompany hearing loss:
loss of ability to hear quiet sounds (usually accompa-
nied by a much smaller loss of ability to hear stronger
sounds), and loss of ability to understand speech, espe-
cially speech in noise. The two losses often but not
always go together: either loss can occur without the
other. Someone who cannot even detect quiet speech
may be able to understand almost as well as someone
with normal hearing at an extremely noisy party, while
another person who can still detect quiet speech may
be unable to understand speech in the presence of
noise at any presentation level.
475
476 Hearing Loss and Hearing Aids: A Perspective
The common term sensorineural loss includesboth types of loss whenever they arise from inner-ear or neural pathology. A conductive loss frommiddle-ear pathology causes a sensitivity loss only.Fortunately, the majority of conductive losses can betreated medically or surgically, and will not bediscussed further here.
Hearing aids can do an excellent job of restoringthe ability to hear quiet sounds. As discussed below,the task of improving one’s ability to hear in noise ismuch more difficult to solve. Other problems facinghearing aid wearers – feedback (sometimes that onlyothers can hear), a hollow sound in the wearer’s ownvoice called occlusion effect, disappointing soundquality, size, cost, and an unwillingness to see aprofessional presumably account for the fact thatonly 20% of those who say they need a hearing aidget one. These issues will be discussed below.
3.27.2 Hearing Loss and Signal-to-Noise Ratio Loss
3.27.2.1 Hearing Loss
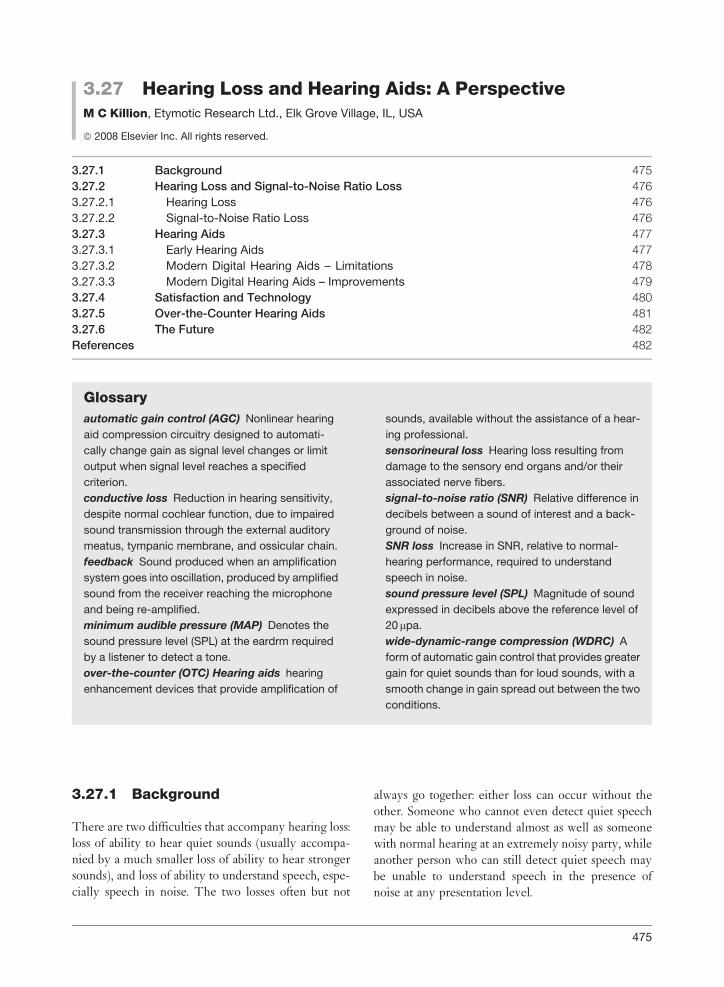
The term minimum audible pressure (MAP) denotesthe sound pressure level (SPL) at the eardrumrequired by a listener to detect a tone. As shown inFigure 1, the average MAP for a normal-hearingperson is about 12 dB SPL between 500 and8000 Hz. (The standards specify that MAP be gener-ated by an earphone. Different numbers come fromthe use of different sound sources and their
125
Zw
islo
cki c
oupl
er S
PL
(dB
)
–10
0
10
20
30
40
250
0.21.2 0.4 0.8 0.0 0.8
–0.9 –1.5 –1.5
500 1000
Frequency
Difference
Mean of 5 studies(transformed to zwislocki coupler SPL)
Estimated map(Killion, 1978)
2000 3000 4000 5000 6000
+
Figure 1 Minimum audible pressure (MAP) at the eardrumestimated from data obtained over a 40-year period (Killion,
1978), plus, five subsequent studies using insert earphones.
From Wilber, L. A., Kruger, B., and Killion, M. C. 1988.
Reference thresholds for the ER-3A insert earphone. J.Accoust. Soc. Am. 83, 669–676, used with permission.
calibrating methods, but all produce the same ear-drum pressure at threshold.)
What is commonly called hearing loss is moreprecisely called pure tone hearing loss. This isdefined as the number of decibels increase in SPL,over normal-hearing response, that is required for apure tone to elicit a response 50% of the time. It isthus a loss of ability to hear quiet tones; that is, asensitivity loss. Normal-hearing performance forSPLs at the eardrum that can be detected 50% ofthe time is shown in Figure 1.
3.27.2.2 Signal-to-Noise Ratio Loss
The second type of hearing loss has recently beendubbed signal-to-noise ratio (SNR) loss, a termderived from the decreased tolerance to noise whenthe listener is trying to understand speech. Speech ishighly redundant. If it was necessary to hear 100% ofthe available speech cues to carry on a conversation,none of us could enjoy noisy social situations wheremuch of the desired talker’s speech is masked by thevoices of other talkers. Fortunately, only about 26%of the speech cues must be heard by normal-hearingpersons in order for them to understand 90% ofsentences correctly. In laboratory experiments, ithas been found that it is possible to carry on a con-versation with all sounds above 800 Hz filtered out,or all sounds below 2200 Hz filtered out, or even allsounds between 600 and 3500 Hz filtered out, each ofwhich corresponds approximately to removing 75%of the speech cues.
Someone who requires more than 26% of speechcues in order to understand speech is said to have anSNR loss. Rather than express SNR loss in the num-ber of speech cues required, we normally express it asthe number of decibels improvement in SNRrequired to reach normal performance. Normal per-formance is about 50% words in sentences correct ata roughly 0 dB SNR (signal and noise at equal levels).Three popular tests, the Hearing In Noise Test(HINT), the Quick Speech in Noise (QuickSIN),and the BKB-SIN test each start with a sentence invirtual quiet and progressively increase the noiseuntil the patient can repeat only 50% of the wordsin sentences correctly. It turns out that if a personrequires twice the number of speech cues (i.e.,requires 52% instead of 26%) of the cues, he or shewill require an 8 dB increase in SNR in order torepeat 50% of the words in sentences correctly.
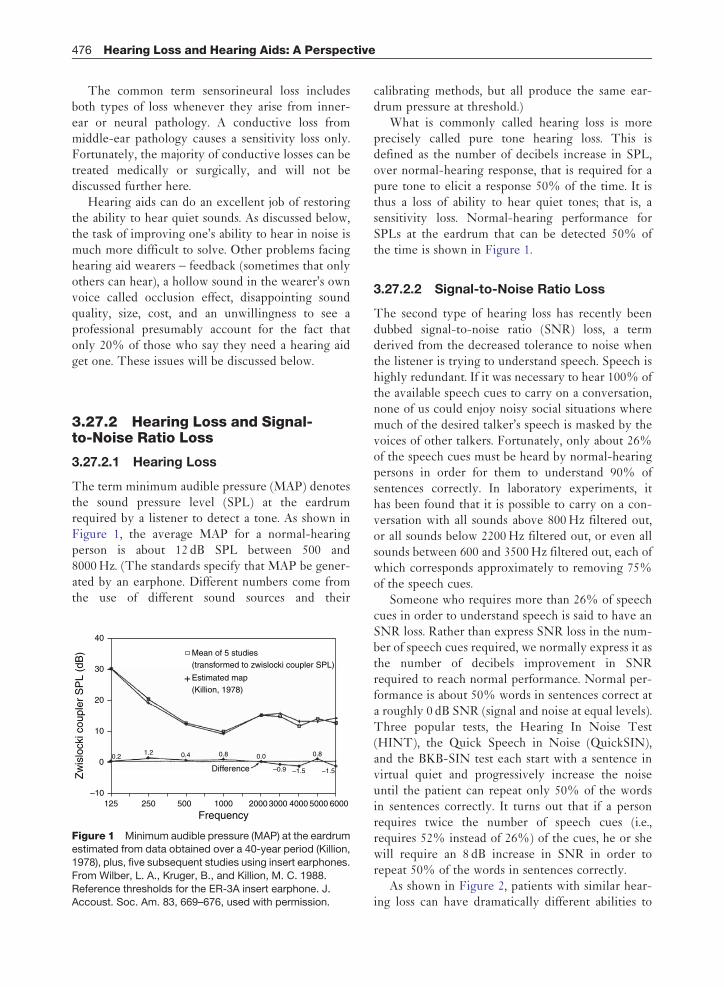
As shown in Figure 2, patients with similar hear-ing loss can have dramatically different abilities to
0–5
0
5
10
15
20
25
10 20
SN
R lo
ss (
dB)
30
Taylor (Sonus) data
40 50 60 70 80 90 100PTA in hearing loss (dB)
Figure 2 Relationship between signal-to-noise ratio
(SNR) loss and pure tone average (PTA) hearing loss for 100
hearing aid wearers. Shaded region of moderate hearing
loss shows range of SNR loss from normal (0 dB) to severeloss (23 dB).
Hearing Loss and Hearing Aids: A Perspective 477
understand speech in noise. A loss in sensitivity mayor may not be accompanied by a significant loss ofability to hear in noise. For example, an SNR lossranging from normal (SNR loss¼ 0 dB) to severelyimpaired (SNR loss¼ 24 dB) is found in persons allof whom have a moderate hearing loss.
The distribution in SNR loss among hearing aidwearers has been reported by several groups.Approximately 50% of subjects have a 5 dB SNRloss or greater, 20% have a 10 dB or greater loss,and 5% have a 15 dB or greater loss. A person witha 15–20 dB loss of ability to hear in noise finds itimpossible to enjoy a dinner out with family andfriends because the restaurant noise makes every-one’s normal speech unintelligible to that person.
3.27.3 Hearing Aids
3.27.3.1 Early Hearing Aids
Pre-electric ear trumpets provided acoustic amplifi-cation in the 1800s and earlier. In the 1930s, hearingaids consisted of table models, thus the brand nameRadio Ear, or relatively large body aids. They usedcarbon microphones (similar to those used intelephones but generally larger and often used inpairs to obtain 6 dB greater gain), a rheostat asvolume control, and an earphone sealed to the ear.The complete electric circuit was battery–micro-phone–rheostat–earphone–battery. When additionalgain was needed, an amplifier consisting of aminiature earphone mechanism connected to aminiature carbon element was added. The carbonelement of the earphone was used as an amplifier.
Such hearing aids had peak real-ear gains of 50 dB,
along with, unfortunately, high distortion and a very
peaky frequency response.By 1952, hearing aids containing miniature
vacuum tubes could provide an amount of gain lim-
ited only by the quality of the seal (to prevent
feedback whistling) between the earmold and the
ear. By 1962, continuing miniaturization of the com-
ponents had made all-in-the-ear hearing aids
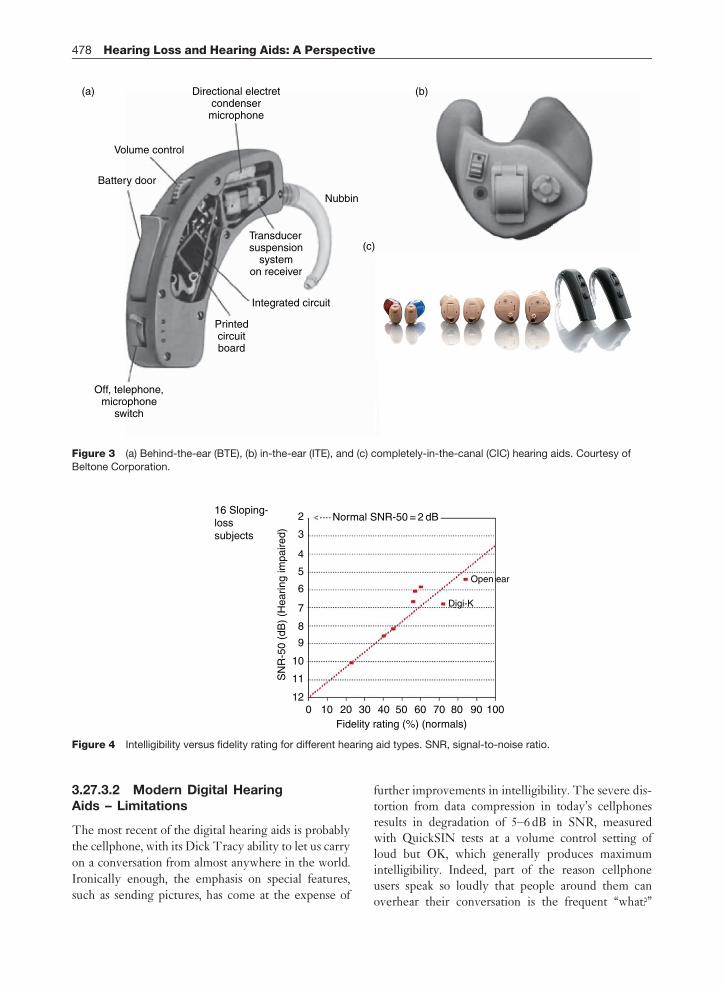
possible. Figure 3 illustrates the three types which
make up the vast majority of hearing aid fittings
today. The smallest completely-in-the-canal hearing
aids can lie deeply enough in the ear canal to be
invisible for all practical purposes.By the early 1980s, integrated circuits had made
improved automatic signal processing possible, the
best-known of which was perhaps the Manhatten
circuit, which dramatically reduced the distortion
for high-level signals by automatically reducing the
gain and low-frequency response of the hearing aid as
the input sound level increased.By 1990, zinc–air batteries and high-efficiency
class D amplifiers made it practical to provide hear-
ing aids with fidelity equal to the best home stereo
systems: 16 kHz bandwidth, low distortion, and an
improved signal-processing scheme called wide-
dynamic-range compression (WDRC). WDRC is
now used in all analog and digital hearing aids. A
WDRC amplifier mainly amplifies the quieter
sounds, especially the high-frequency sounds ren-
dered inaudible by a typical high-frequency hearing
loss, leaving loud sounds with much less amplifica-
tion. While this approach seems obvious now, it met
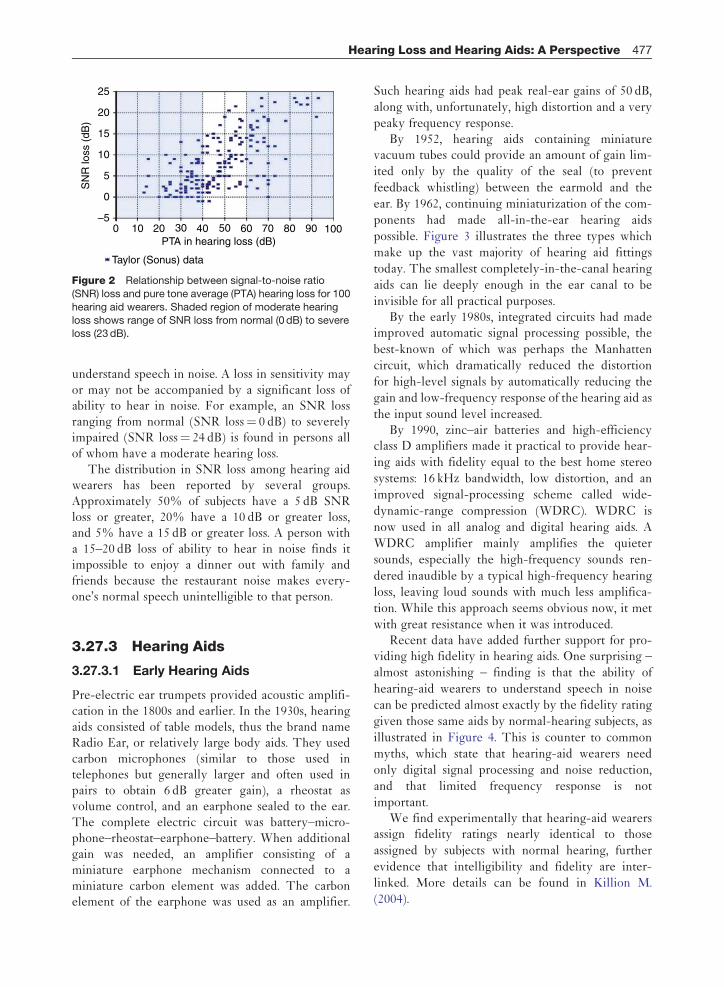
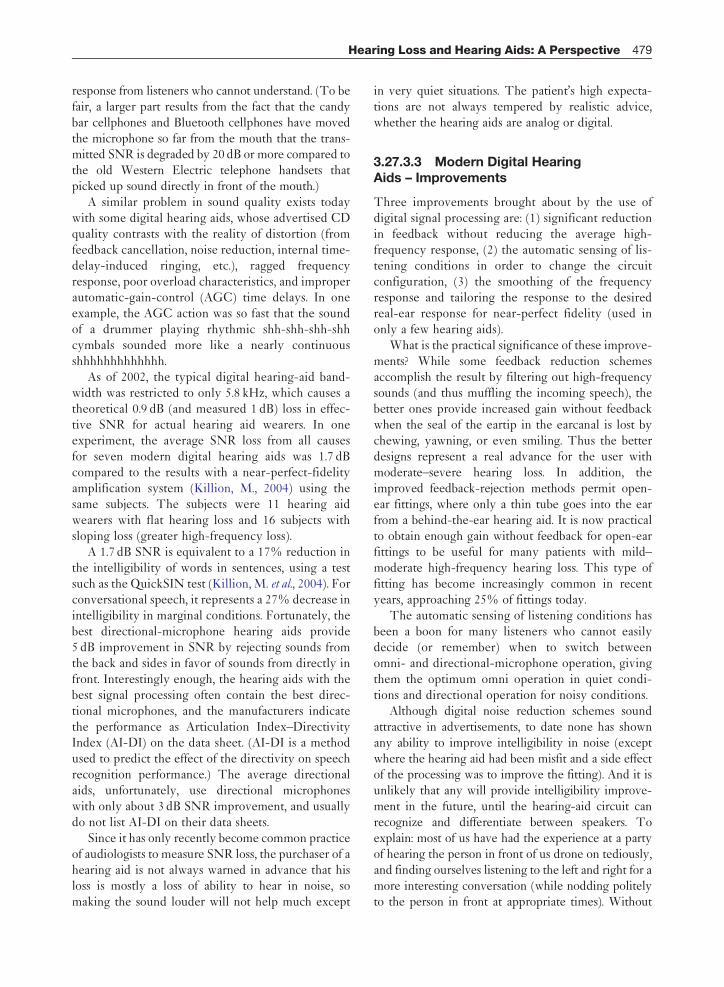
with great resistance when it was introduced.Recent data have added further support for pro-
viding high fidelity in hearing aids. One surprising –
almost astonishing – finding is that the ability of
hearing-aid wearers to understand speech in noise
can be predicted almost exactly by the fidelity rating
given those same aids by normal-hearing subjects, as
illustrated in Figure 4. This is counter to common
myths, which state that hearing-aid wearers need
only digital signal processing and noise reduction,
and that limited frequency response is not
important.We find experimentally that hearing-aid wearers
assign fidelity ratings nearly identical to those
assigned by subjects with normal hearing, further
evidence that intelligibility and fidelity are inter-
linked. More details can be found in Killion M.
(2004).
216 Sloping-losssubjects
Normal SNR-50 = 2 dB
3
4
5
6
7
8
9
SN
R-5
0 (d
B)
(Hea
ring
impa
ired)
10
11
120 10 20 30 40 50
Fidelity rating (%) (normals)60 70 80 90 100
Open ear
Digi-K
Figure 4 Intelligibility versus fidelity rating for different hearing aid types. SNR, signal-to-noise ratio.
Directional electretcondensermicrophone
Volume control
Battery door
Nubbin
Integrated circuit
Printedcircuitboard
Off, telephone,microphone
switch
(a)
(c)
(b)
Transducersuspension
systemon receiver
Figure 3 (a) Behind-the-ear (BTE), (b) in-the-ear (ITE), and (c) completely-in-the-canal (CIC) hearing aids. Courtesy of
Beltone Corporation.
478 Hearing Loss and Hearing Aids: A Perspective
3.27.3.2 Modern Digital HearingAids – Limitations
The most recent of the digital hearing aids is probably
the cellphone, with its Dick Tracy ability to let us carry
on a conversation from almost anywhere in the world.
Ironically enough, the emphasis on special features,
such as sending pictures, has come at the expense of
further improvements in intelligibility. The severe dis-tortion from data compression in today’s cellphonesresults in degradation of 5–6 dB in SNR, measuredwith QuickSIN tests at a volume control setting ofloud but OK, which generally produces maximumintelligibility. Indeed, part of the reason cellphoneusers speak so loudly that people around them canoverhear their conversation is the frequent ‘‘what?’’
Hearing Loss and Hearing Aids: A Perspective 479
response from listeners who cannot understand. (To befair, a larger part results from the fact that the candybar cellphones and Bluetooth cellphones have movedthe microphone so far from the mouth that the trans-mitted SNR is degraded by 20 dB or more compared tothe old Western Electric telephone handsets thatpicked up sound directly in front of the mouth.)
A similar problem in sound quality exists todaywith some digital hearing aids, whose advertised CDquality contrasts with the reality of distortion (fromfeedback cancellation, noise reduction, internal time-delay-induced ringing, etc.), ragged frequencyresponse, poor overload characteristics, and improperautomatic-gain-control (AGC) time delays. In oneexample, the AGC action was so fast that the soundof a drummer playing rhythmic shh-shh-shh-shhcymbals sounded more like a nearly continuousshhhhhhhhhhhhh.
As of 2002, the typical digital hearing-aid band-width was restricted to only 5.8 kHz, which causes atheoretical 0.9 dB (and measured 1 dB) loss in effec-tive SNR for actual hearing aid wearers. In oneexperiment, the average SNR loss from all causesfor seven modern digital hearing aids was 1.7 dBcompared to the results with a near-perfect-fidelityamplification system (Killion, M., 2004) using thesame subjects. The subjects were 11 hearing aidwearers with flat hearing loss and 16 subjects withsloping loss (greater high-frequency loss).
A 1.7 dB SNR is equivalent to a 17% reduction inthe intelligibility of words in sentences, using a testsuch as the QuickSIN test (Killion, M. et al., 2004). Forconversational speech, it represents a 27% decrease inintelligibility in marginal conditions. Fortunately, thebest directional-microphone hearing aids provide5 dB improvement in SNR by rejecting sounds fromthe back and sides in favor of sounds from directly infront. Interestingly enough, the hearing aids with thebest signal processing often contain the best direc-tional microphones, and the manufacturers indicatethe performance as Articulation Index–DirectivityIndex (AI-DI) on the data sheet. (AI-DI is a methodused to predict the effect of the directivity on speechrecognition performance.) The average directionalaids, unfortunately, use directional microphoneswith only about 3 dB SNR improvement, and usuallydo not list AI-DI on their data sheets.
Since it has only recently become common practiceof audiologists to measure SNR loss, the purchaser of ahearing aid is not always warned in advance that hisloss is mostly a loss of ability to hear in noise, somaking the sound louder will not help much except
in very quiet situations. The patient’s high expecta-tions are not always tempered by realistic advice,whether the hearing aids are analog or digital.
3.27.3.3 Modern Digital HearingAids – Improvements
Three improvements brought about by the use ofdigital signal processing are: (1) significant reductionin feedback without reducing the average high-frequency response, (2) the automatic sensing of lis-tening conditions in order to change the circuitconfiguration, (3) the smoothing of the frequencyresponse and tailoring the response to the desiredreal-ear response for near-perfect fidelity (used inonly a few hearing aids).
What is the practical significance of these improve-ments? While some feedback reduction schemesaccomplish the result by filtering out high-frequencysounds (and thus muffling the incoming speech), thebetter ones provide increased gain without feedbackwhen the seal of the eartip in the earcanal is lost bychewing, yawning, or even smiling. Thus the betterdesigns represent a real advance for the user withmoderate–severe hearing loss. In addition, theimproved feedback-rejection methods permit open-ear fittings, where only a thin tube goes into the earfrom a behind-the-ear hearing aid. It is now practicalto obtain enough gain without feedback for open-earfittings to be useful for many patients with mild–moderate high-frequency hearing loss. This type offitting has become increasingly common in recentyears, approaching 25% of fittings today.
The automatic sensing of listening conditions hasbeen a boon for many listeners who cannot easilydecide (or remember) when to switch betweenomni- and directional-microphone operation, givingthem the optimum omni operation in quiet condi-tions and directional operation for noisy conditions.
Although digital noise reduction schemes soundattractive in advertisements, to date none has shownany ability to improve intelligibility in noise (exceptwhere the hearing aid had been misfit and a side effectof the processing was to improve the fitting). And it isunlikely that any will provide intelligibility improve-ment in the future, until the hearing-aid circuit canrecognize and differentiate between speakers. Toexplain: most of us have had the experience at a partyof hearing the person in front of us drone on tediously,and finding ourselves listening to the left and right for amore interesting conversation (while nodding politelyto the person in front at appropriate times). Without
480 Hearing Loss and Hearing Aids: A Perspective
recognition of the speaker by the hearing aid, there isno way for the hearing aid circuit to decide whichvoice is the desired speech and which voices are partof the interfering babble to be suppressed. The bestnoise-reduction schemes we have tested do little harm,but no good. The worst cause serious degradation ofintelligibility in noise (recall Figure 4).
3.27.4 Satisfaction and Technology
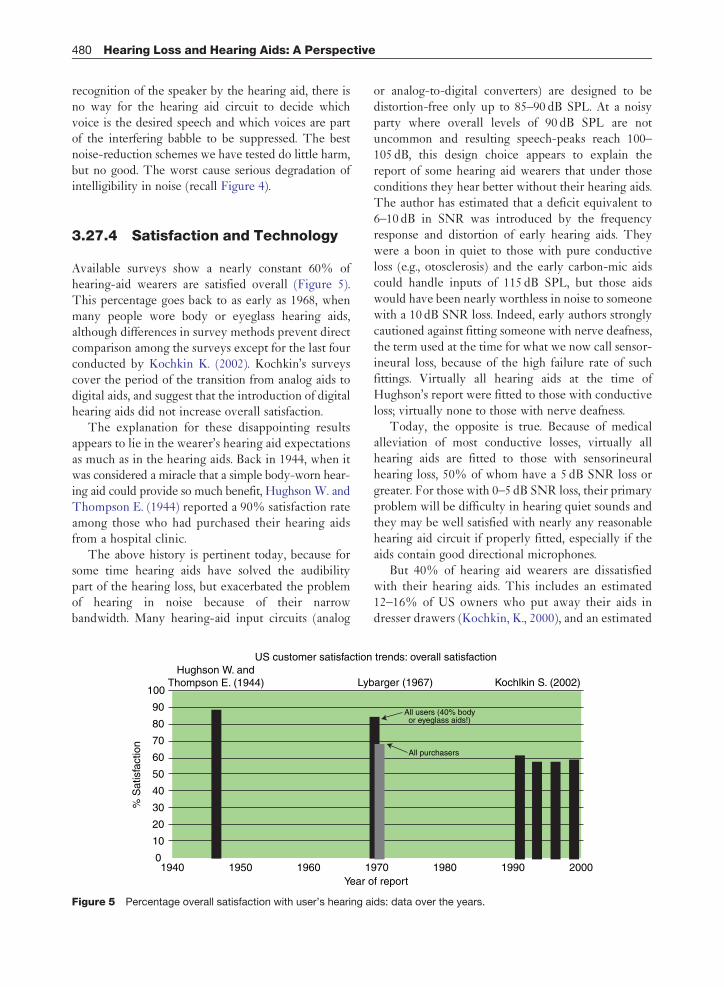
Available surveys show a nearly constant 60% ofhearing-aid wearers are satisfied overall (Figure 5).This percentage goes back to as early as 1968, whenmany people wore body or eyeglass hearing aids,although differences in survey methods prevent directcomparison among the surveys except for the last fourconducted by Kochkin K. (2002). Kochkin’s surveyscover the period of the transition from analog aids todigital aids, and suggest that the introduction of digitalhearing aids did not increase overall satisfaction.
The explanation for these disappointing resultsappears to lie in the wearer’s hearing aid expectationsas much as in the hearing aids. Back in 1944, when itwas considered a miracle that a simple body-worn hear-ing aid could provide so much benefit, Hughson W. andThompson E. (1944) reported a 90% satisfaction rateamong those who had purchased their hearing aidsfrom a hospital clinic.
The above history is pertinent today, because forsome time hearing aids have solved the audibilitypart of the hearing loss, but exacerbated the problemof hearing in noise because of their narrowbandwidth. Many hearing-aid input circuits (analog
US customer satisfactionHughson W. and
Thompson E. (1944) Lyb
Year o
% S
atis
fact
ion
100
90
80
70
60
50
40
30
20
10
01940 1950 1960 1
Figure 5 Percentage overall satisfaction with user’s hearing a
or analog-to-digital converters) are designed to bedistortion-free only up to 85–90 dB SPL. At a noisyparty where overall levels of 90 dB SPL are notuncommon and resulting speech-peaks reach 100–105 dB, this design choice appears to explain thereport of some hearing aid wearers that under thoseconditions they hear better without their hearing aids.The author has estimated that a deficit equivalent to6–10 dB in SNR was introduced by the frequencyresponse and distortion of early hearing aids. Theywere a boon in quiet to those with pure conductiveloss (e.g., otosclerosis) and the early carbon-mic aidscould handle inputs of 115 dB SPL, but those aidswould have been nearly worthless in noise to someonewith a 10 dB SNR loss. Indeed, early authors stronglycautioned against fitting someone with nerve deafness,the term used at the time for what we now call sensor-ineural loss, because of the high failure rate of suchfittings. Virtually all hearing aids at the time ofHughson’s report were fitted to those with conductiveloss; virtually none to those with nerve deafness.
Today, the opposite is true. Because of medicalalleviation of most conductive losses, virtually allhearing aids are fitted to those with sensorineuralhearing loss, 50% of whom have a 5 dB SNR loss orgreater. For those with 0–5 dB SNR loss, their primaryproblem will be difficulty in hearing quiet sounds andthey may be well satisfied with nearly any reasonablehearing aid circuit if properly fitted, especially if theaids contain good directional microphones.
But 40% of hearing aid wearers are dissatisfiedwith their hearing aids. This includes an estimated12–16% of US owners who put away their aids indresser drawers (Kochkin, K., 2000), and an estimated
trends: overall satisfaction
arger (1967)
f report
Kochlkin S. (2002)
970 1980 1990 2000
All users (40% bodyor eyeglass aids!)
All purchasers
ids: data over the years.
Hearing Loss and Hearing Aids: A Perspective 481
25% of owners in England who do the same thing(Davis, A., 2006). Those nonusers presumablyinclude persons whose hearing aids were not prop-erly fitted (or were inappropriate to the loss); thosewhose earmold fit does not prevent feedback or doesnot prevent a hollow voice sound; and a small per-centage who will not be satisfied with having to weara hearing aid under any circumstances.
The most important reason for dissatisfaction bythose with SNR loss in the 10–15 dB range is theirresultant inability to understand speech in the pre-sence of noise at restaurants, parties, etc. Some reportthat they take off their hearing aids in loud socialsituations where audibility is not a problem but theirinability to separate speech from noise (typicallyinterfering with speech) is. For such persons, thebetter analog aids and the best digital aids fail equallyunder those high-noise circumstances: the hearingaids may be solving a problem they do not have inhigh-level noise (audibility), while failing to solve theproblem they do have (SNR loss).
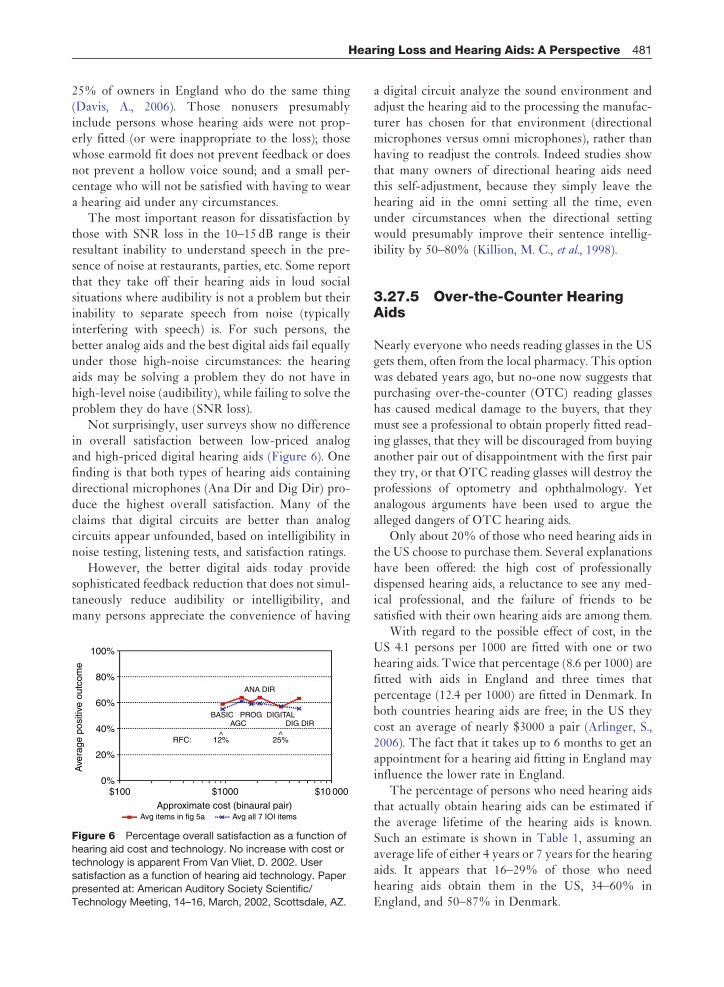
Not surprisingly, user surveys show no differencein overall satisfaction between low-priced analogand high-priced digital hearing aids (Figure 6). Onefinding is that both types of hearing aids containingdirectional microphones (Ana Dir and Dig Dir) pro-duce the highest overall satisfaction. Many of theclaims that digital circuits are better than analogcircuits appear unfounded, based on intelligibility innoise testing, listening tests, and satisfaction ratings.
However, the better digital aids today providesophisticated feedback reduction that does not simul-taneously reduce audibility or intelligibility, andmany persons appreciate the convenience of having
$1000%
20%
40%
60%
80%
100%
$1000
RFC:
Avg items in fig 5a Avg all 7 IOI items
ANA DIR
BASIC PROG DIGITALDIG DIR
12%^
25%^
Ave
rage
pos
itive
out
com
e
Approximate cost (binaural pair)
$10 000
AGC
Figure 6 Percentage overall satisfaction as a function of
hearing aid cost and technology. No increase with cost or
technology is apparent From Van Vliet, D. 2002. User
satisfaction as a function of hearing aid technology. Paperpresented at: American Auditory Society Scientific/
Technology Meeting, 14–16, March, 2002, Scottsdale, AZ.
a digital circuit analyze the sound environment andadjust the hearing aid to the processing the manufac-turer has chosen for that environment (directionalmicrophones versus omni microphones), rather thanhaving to readjust the controls. Indeed studies showthat many owners of directional hearing aids needthis self-adjustment, because they simply leave thehearing aid in the omni setting all the time, evenunder circumstances when the directional settingwould presumably improve their sentence intellig-ibility by 50–80% (Killion, M. C., et al., 1998).
3.27.5 Over-the-Counter HearingAids
Nearly everyone who needs reading glasses in the USgets them, often from the local pharmacy. This optionwas debated years ago, but no-one now suggests thatpurchasing over-the-counter (OTC) reading glasseshas caused medical damage to the buyers, that theymust see a professional to obtain properly fitted read-ing glasses, that they will be discouraged from buyinganother pair out of disappointment with the first pairthey try, or that OTC reading glasses will destroy theprofessions of optometry and ophthalmology. Yetanalogous arguments have been used to argue thealleged dangers of OTC hearing aids.
Only about 20% of those who need hearing aids inthe US choose to purchase them. Several explanationshave been offered: the high cost of professionallydispensed hearing aids, a reluctance to see any med-ical professional, and the failure of friends to besatisfied with their own hearing aids are among them.
With regard to the possible effect of cost, in theUS 4.1 persons per 1000 are fitted with one or twohearing aids. Twice that percentage (8.6 per 1000) arefitted with aids in England and three times thatpercentage (12.4 per 1000) are fitted in Denmark. Inboth countries hearing aids are free; in the US theycost an average of nearly $3000 a pair (Arlinger, S.,2006). The fact that it takes up to 6 months to get anappointment for a hearing aid fitting in England mayinfluence the lower rate in England.
The percentage of persons who need hearing aidsthat actually obtain hearing aids can be estimated ifthe average lifetime of the hearing aids is known.Such an estimate is shown in Table 1, assuming anaverage life of either 4 years or 7 years for the hearingaids. It appears that 16–29% of those who needhearing aids obtain them in the US, 34–60% inEngland, and 50–87% in Denmark.
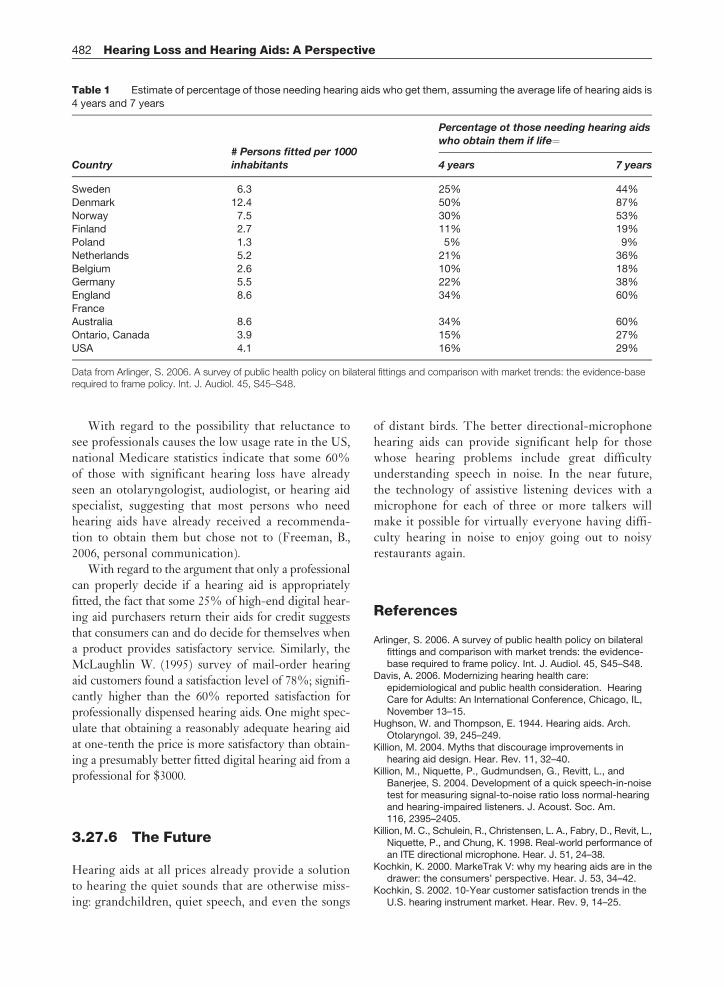
Table 1 Estimate of percentage of those needing hearing aids who get them, assuming the average life of hearing aids is
4 years and 7 years
Country# Persons fitted per 1000inhabitants
Percentage ot those needing hearing aidswho obtain them if life¼
4 years 7 years
Sweden 6.3 25% 44%
Denmark 12.4 50% 87%
Norway 7.5 30% 53%Finland 2.7 11% 19%
Poland 1.3 5% 9%
Netherlands 5.2 21% 36%
Belgium 2.6 10% 18%Germany 5.5 22% 38%
England 8.6 34% 60%
FranceAustralia 8.6 34% 60%
Ontario, Canada 3.9 15% 27%
USA 4.1 16% 29%
Data from Arlinger, S. 2006. A survey of public health policy on bilateral fittings and comparison with market trends: the evidence-baserequired to frame policy. Int. J. Audiol. 45, S45–S48.
482 Hearing Loss and Hearing Aids: A Perspective
With regard to the possibility that reluctance tosee professionals causes the low usage rate in the US,national Medicare statistics indicate that some 60%of those with significant hearing loss have alreadyseen an otolaryngologist, audiologist, or hearing aidspecialist, suggesting that most persons who needhearing aids have already received a recommenda-tion to obtain them but chose not to (Freeman, B.,2006, personal communication).
With regard to the argument that only a professionalcan properly decide if a hearing aid is appropriatelyfitted, the fact that some 25% of high-end digital hear-ing aid purchasers return their aids for credit suggeststhat consumers can and do decide for themselves whena product provides satisfactory service. Similarly, theMcLaughlin W. (1995) survey of mail-order hearingaid customers found a satisfaction level of 78%; signifi-cantly higher than the 60% reported satisfaction forprofessionally dispensed hearing aids. One might spec-ulate that obtaining a reasonably adequate hearing aidat one-tenth the price is more satisfactory than obtain-ing a presumably better fitted digital hearing aid from aprofessional for $3000.
3.27.6 The Future
Hearing aids at all prices already provide a solutionto hearing the quiet sounds that are otherwise miss-ing: grandchildren, quiet speech, and even the songs
of distant birds. The better directional-microphonehearing aids can provide significant help for thosewhose hearing problems include great difficultyunderstanding speech in noise. In the near future,the technology of assistive listening devices with amicrophone for each of three or more talkers willmake it possible for virtually everyone having diffi-culty hearing in noise to enjoy going out to noisyrestaurants again.
References
Arlinger, S. 2006. A survey of public health policy on bilateralfittings and comparison with market trends: the evidence-base required to frame policy. Int. J. Audiol. 45, S45–S48.
Davis, A. 2006. Modernizing hearing health care:epidemiological and public health consideration. HearingCare for Adults: An International Conference, Chicago, IL,November 13–15.
Hughson, W. and Thompson, E. 1944. Hearing aids. Arch.Otolaryngol. 39, 245–249.
Killion, M. 2004. Myths that discourage improvements inhearing aid design. Hear. Rev. 11, 32–40.
Killion, M., Niquette, P., Gudmundsen, G., Revitt, L., andBanerjee, S. 2004. Development of a quick speech-in-noisetest for measuring signal-to-noise ratio loss normal-hearingand hearing-impaired listeners. J. Acoust. Soc. Am.116, 2395–2405.
Killion, M. C., Schulein, R., Christensen, L. A., Fabry, D., Revit, L.,Niquette, P., and Chung, K. 1998. Real-world performance ofan ITE directional microphone. Hear. J. 51, 24–38.
Kochkin, K. 2000. MarkeTrak V: why my hearing aids are in thedrawer: the consumers’ perspective. Hear. J. 53, 34–42.
Kochkin, S. 2002. 10-Year customer satisfaction trends in theU.S. hearing instrument market. Hear. Rev. 9, 14–25.

Hearing Loss and Hearing Aids: A Perspective 483
McLauchlan, W. 1995. Customer satisfaction and benefit withdirect-by-mail hearing instruments. Survey conducted byMcLauchlan & Assoc., Cincinnati, OH.
Van Vliet, D. 2002. User satisfaction as a function of hearing aidtechnology. Paper presented at: American Auditory Society
Scientific/Technology Meeting, 14–16, March 2002,Scottsdale, AZ.
Wilber, L. A., Kruger, B., and Killion, M. C. 1998. Referencethresholds for the ER-3A insert earphone. J. Accoust. Soc.Am. 83, 669–676.