Embed Size (px)
Citation preview
The University of AkronIdeaExchange@UAkron
Honors Research Projects The Dr. Gary B. and Pamela S. Williams HonorsCollege
Spring 2018
The Segregation of Black Students and WhiteStudents in Cuyahoga and Summit County PublicSchoolsAlexandra [email protected]
Please take a moment to share how this work helps you through this survey. Your feedback will beimportant as we plan further development of our repository.Follow this and additional works at: http://ideaexchange.uakron.edu/honors_research_projects
Part of the Social and Philosophical Foundations of Education Commons
This Honors Research Project is brought to you for free and open access by The Dr. Gary B. and Pamela S. WilliamsHonors College at IdeaExchange@UAkron, the institutional repository of The University of Akron in Akron, Ohio,USA. It has been accepted for inclusion in Honors Research Projects by an authorized administrator ofIdeaExchange@UAkron. For more information, please contact [email protected], [email protected].
Recommended CitationBednarz, Alexandra, "The Segregation of Black Students and White Students in Cuyahoga and Summit CountyPublic Schools" (2018). Honors Research Projects. 754.http://ideaexchange.uakron.edu/honors_research_projects/754

Running Head: THE SEGREGATION OF BLACK AND WHITE STUDENTS 1
The Segregation of Black Students and White Students in Cuyahoga and Summit County Public
Schools
Alexandra Bednarz
Department of Education
Honors Research Project
Submitted to
The Honors College
THE SEGREGATION OF BLACK AND WHITE STUDENTS 2
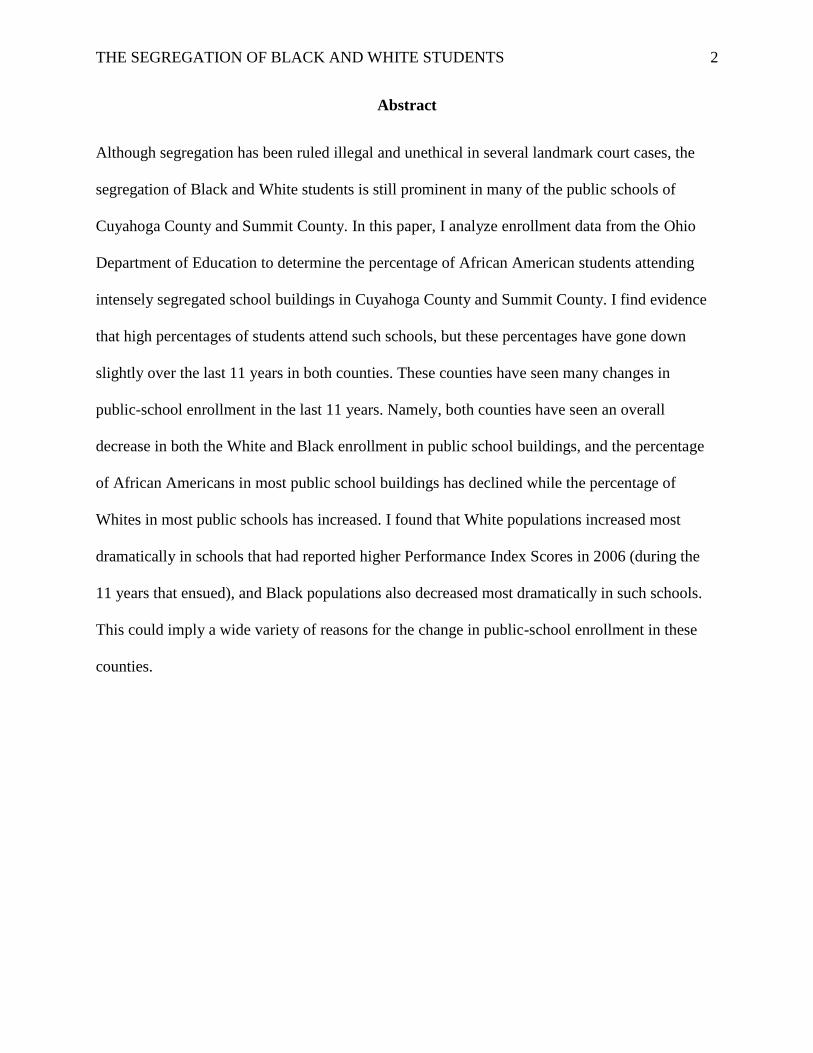
Abstract
Although segregation has been ruled illegal and unethical in several landmark court cases, the
segregation of Black and White students is still prominent in many of the public schools of
Cuyahoga County and Summit County. In this paper, I analyze enrollment data from the Ohio
Department of Education to determine the percentage of African American students attending
intensely segregated school buildings in Cuyahoga County and Summit County. I find evidence
that high percentages of students attend such schools, but these percentages have gone down
slightly over the last 11 years in both counties. These counties have seen many changes in
public-school enrollment in the last 11 years. Namely, both counties have seen an overall
decrease in both the White and Black enrollment in public school buildings, and the percentage
of African Americans in most public school buildings has declined while the percentage of
Whites in most public schools has increased. I found that White populations increased most
dramatically in schools that had reported higher Performance Index Scores in 2006 (during the
11 years that ensued), and Black populations also decreased most dramatically in such schools.
This could imply a wide variety of reasons for the change in public-school enrollment in these
counties.
THE SEGREGATION OF BLACK AND WHITE STUDENTS 3
Background
As a public-school student from Kindergarten to 12th grade, and then as a student teacher
in an inner city public school about to launch my career in education, I noticed several things that
sparked me to do the research in this article.
For example, I grew up attending Garfield Heights City Schools. I began attending
Elmwood Elementary in 2001 and graduated from Garfield Heights High School in 2014. During
my thirteen years attending this district, I noticed massive changes in the school system’s
demographics. For example, I only remember having two students of color in my Kindergarten
class of maybe 25 children, whereas many of my high school classes were only 30%–40%
White. In particular, I noticed the enrollment of Black students increase dramatically. This lead
me to wonder what could be causing such a noticeable change in racial demographics in only
thirteen years, and if this pattern could be seen in other schools.
For my student teaching placement, I was teaching high school mathematics at Buchtel
CLC. Knowing that Akron is a very racially diverse community, I was struck by the fact that
Buchtel’s student body was almost all African American students. I knew from observations that
other schools in the Akron Public School district are not so highly concentrated of one ethnicity,
so this arose my curiosity even more. Buchtel High School’s school zone correlates precisely
with the “West Akron” neighborhood region. According to statisticalatles.com, which gets its
data from the U.S. Census Bureau, the West Akron neighborhood is roughly 82.0% black and
13.9% and white. However, according to the ODE report card data for 2018, black students make
up 93.3% of the student body at Buchtel High School, and white students only account for 1.4%.
This led me to wonder why student enrollment at Buchtel High School is so disproportionate to
the demographics of its neighborhood.

THE SEGREGATION OF BLACK AND WHITE STUDENTS 4
These observations led me to wonder the following questions:
• How do the racial trends that I noticed at Garfield Heights High School and Buchtel CLC
relate to general trends in the United States?
• What racial shifts can be observed in Cuyahoga County (home of GHHS) and Summit
County (home of Buchtel CLC)?
• Does a school’s performance (such as its report card grade on the ODE) affect its
demographics/enrollment in upcoming years?
• Are schools becoming more or less segregated?
To answer these questions, I first reviewed several pieces of literature explaining the history
behind school segregation in the United States. In finer detail, I analyzed the two court cases,
Reed v. Rhodes and Bell v. Board of Education Akron Public Schools, which brought the issue of
desegregation to the forefront in Cleveland and Akron. I then read researched the enrollment and
changing enrollment of several school districts across the United States by reading other
researchers’ recent studies regarding segregation. The summary of these findings is composed in
the review of literature below.
I next downloaded archived data from the Ohio Department of Education for both the 2005-
2006 school year and the 2016-2017 school year. I collected this data to determine what
percentage of the public-school attending population is attending intensely segregated schools. I
looked at the relationship between a school’s Performance Index Score published by the ODE (in
2005-2006) and the change in that school’s enrollment that followed in the next 11 years. I
examined the overall change in public school population for Black Students and White students
over those 11 years. Lastly, I discuss the implications of these findings.

THE SEGREGATION OF BLACK AND WHITE STUDENTS 5
Review of Literature: Racial Segregation and Inequality in the United States Schools
The desegregation of schools has been a long battle in the history of the United States. It
was in 1896 that the morality of segregation was finally questioned in the infamous Plessy v.
Ferguson case. It was also in 1896 that the Supreme Court announced its decision to continue
allowing segregation in school buildings throughout the country, so long as the facilities
remained “equal.” Although the “separate” part of the court’s ruling was well upheld, the “equal”
part was not (Wells, Holme, Revilla, Atanda, 2004). Plessy v. Ferguson merely paved the path
for decades of continued segregation by race in addition to unequal distribution of educational
resources and opportunities
Racial segregation was worst in the southern part of the United States. Fifty years after
Plessy v. Ferguson, racial segregation was still required by law in seventeen states and permitted
in four others. In the south, Black schools were unequivocally disadvantaged; the average
southern state paid 50% more for each White child than for each Black child (Hall, 2005).
Legal segregation continued thusly until the supreme court finally made its pivotal
decision in Brown v. Board of Education in 1954. We owe this ruling mostly to the efforts and
struggles of the NAACP, as well as the courageous protests of many passionate parents, students,
and community members at the time. (Hall, 2005). Five cases in encompassed one, the ruling of
Brown v. Board of Education declared segregating schools by race to be unconstitutional.
However, the end of the “separate but equal” in the United States was not the end of
segregation in the United States. Racial integration was a dangerous undertaking, as evidenced
by everything the heroic Little Rock Nine had to go through to attend the previously all-white
THE SEGREGATION OF BLACK AND WHITE STUDENTS 6
Little Rock Central High School. Across the nation, school districts were sluggish to integrate
their schools.
Even in the northern United States, integration was slow to come. In Cleveland, for
example, 83% of students still attended racially segregated (all Black or all White) schools in
1963, nearly ten years after the Brown v. Board of Education ruling. (Patterson, 2002).
Eventually the city began busing across neighborhood lines to integrate certain school buildings.
Even so, these buildings were still segregated within the school walls. Black students and White
students had separate classes, ate lunch at separate times, and Black students were denied
admittance to many extracurricular activities.
The battle against segregation in Cleveland culminated when an African American
mother sued the Cleveland Board of Education. This case is known is Reed v. Rhodes. On
August 31, 1976, the court ruled that Cleveland public schools were indeed segregated and that
the schools must implement ways to desegregate classrooms and extracurricular activities.
The Akron Board of Education faced a similar dispute in 1980. In the case of Bell v.
Board of Education Akron Public Schools, the plaintiffs argued that the Akron Public Schools
were reinforcing segregation in the school system. They had three basic claims. The first was
that the restructuring of school zones between 1954 and 1965 resulted in intentional segregation
by neighborhood. The second was that the post-1965 school board perpetuated the segregation in
its schools rather than dismantle it. The third was that if the segregation of schools was due to
government policies that resulted in segregated housing, then the segregation in Akron’s schools
ought to have been subject to redress. Most of the first and second claims were dismissed, but in
the third claim, “The District Judge who heard this school segregation complaint found that the
Board of Education, Akron Public Schools, had formulated and put into effect a school
THE SEGREGATION OF BLACK AND WHITE STUDENTS 7
decommissioning plan which amounted to intentional segregation in a portion of the city
schools” (Bell v. Board of Education Akron Public Schools, 1980). The new decommissioning
plan was promptly submitted.
Segregation in United States Schools, unfortunately, did not terminate with the
abundance of court cases following Brown v. Board of Education. Separate and unequal schools
have continued right into the 21st century, and desegregation is a present and trying battle in
many neighborhoods across the nation. Take the Chicago Public Schools (CPS), for example.
Pavlyn Jankov and Carol Caref analyze the segregation of CPS in the decades following the
Brown v. Board of Education decision in their article “Segregation and Inequality in Chicago
Public Schools, Transformed and Intensified under Corporate Education Reform.” They define
an intensely segregated school as one where at least 90% of the students are Black, and report
that in 1971, 85% of Black students at CPS were attending an intensely segregated school. That
percentage dropped only slightly over the coming decades. Even in 2012, they report that 70% of
Black students in Chicago Public Schools are still attending an intensely segregated school.
Other cases of recent segregation are countless. In “School Segregation and
Resegregation in Charlotte and Raleigh, 1989-2010” it is reported that recent policy changes
have resulted in extreme segregation in schools in the Raleigh and Charlotte areas of North
Carolina (Ayscue, Siegel-Hawley, Kucsera, & Woodward, 2018). A similar study done by John
Kuscera, part of the UCLA Civil Rights Project/Proyecto Derechos Civiles, suggests that the
abandonment of desegregation policies has resulted in continued or increased segregation in
schools across the state of New York between 1989 and 2010 (Kuscera, Orfield, 2014). It also
shows that New York city has some of the most intensely segregated schools of the United
States. Another publication by the UCLA Civil Rights Project/Proyecto Derechos Civiles finds
THE SEGREGATION OF BLACK AND WHITE STUDENTS 8
that students of color have experienced intensifying school segregation in Massachusetts over the
last two decades (Ayscue, Greenberg, Kucsera, Siegel-Hawley, Orfield, 2013). Research done by
Meredith Richards in 2014 shows that gerrymandering still increases segregation in school
districts studied across 17 different states (Richards, 2017).
The causes differ from region to region, but the list goes on for reports school districts
that show evidence of continued and even worsening segregation. Instances of intensifying
segregation are especially common in urban areas. One thing is clear: the fight to desegregate our
schools in the United States is ongoing and critically important in many places. An abundance of
research has shown that when schools are racially segregated, this has a negative impact on
student learning. Racially segregated schools tend to receive different resources, different quality
teachers (Richards, 2014). Segregation hurts students.
THE SEGREGATION OF BLACK AND WHITE STUDENTS 9
Methodology
Methods
Most of the enrollment data that I used for this study was collected from the enrollment
data disaggregated by race/ethnicity available on the Ohio Department of Education’s (ODE)
report card website. Unless otherwise stated, all data was collected from the ODE. First, I studied
the percentage of students enrolled in intensely segregated school buildings. Secondly, I studied
the relationship between a school building’s Performance Index Score in 2005-2006 to that
school’s change in enrollment in the coming decade.
First, I performed a similar study to the one done in the Chicago Public Schools by
Pavlyn Jankov and Carol Caref. That is, I defined an intensely segregated school building as one
in which one race/ethnicity composes 90% or more of the student body. Specifically, I identified
intensely segregated schools where 90% of the student body is African American or where 90%
of the student body is White in Cuyahoga County and Summit County. This was done for the
2005-2006 school year, the first year for which the ODE has such data published, and the 2016-
2017 school year, the most recent year for which the ODE has such data published. A total of
470 school buildings were analyzed for 2005-2006, and 477 school buildings were analyzed for
2016-2017.
I then determined the percent of Black students and White students attending intensely
segregated school buildings in the 2005-2006 school year and the 2016-2017 school year. These
percentages are reported for Cuyahoga County and Summit County, as well as for the two
biggest school districts in each: the Cleveland Metropolitan School District and Akron Public
Schools.
THE SEGREGATION OF BLACK AND WHITE STUDENTS 10
The ODE school data that was used for this study is only published for public schools.
Because of this, this analysis may not reflect the complete percentage of students attending
intensely segregated schools for the entire counties of Cuyahoga or Summit.
Another limitation of this study is caused by the fact that the ODE protects the anonymity
of students if fewer than 5% of the school is of a certain race/ethnicity by withholding the exact
percentage. For this reason, any enrollment percentage of <5% was changed to .01% for the
purpose of my calculations, and any enrollment percentage of >95% was changed to 99.9% for
the purpose of my calculations. For such schools, some groups may have been misrepresented by
up to 5% as a result.
Secondly, I paired each school’s enrollment data for the 2005-2006 school year with its
enrollment data for the 2016-2017 school year to determine the change in each racial group’s
percent enrollment. For example, if a school’s student body was 30% White in 2005 and 40%
White, then the school’s change in White enrollment was +10%. Similarly, if a school’s student
body was 55% Black in 2005 and 45% Black in 2006, then that school’s change in Black
enrollment was -10%.
Next, each school building’s Performance Index Score for the 2005-2006 school year was
determined. The Performance Index Score is a summary of a schools’ students’ performance on
standardized tests and is one of the ten graded measures of the report card published every year.
Each school was then plotted on an x-y plane, where the x-axis showed a school’s
Performance Index Score, and the y-axis showed the change in a school’s percentage of either
Black students or White students.
THE SEGREGATION OF BLACK AND WHITE STUDENTS 11
One major limitation of this study was that only school buildings that existed in both
school years studied were used. Schools which had closed since 2006 or which had opened since
2006 could not be studied because my aim was to find the school’s change in enrollment in the
last 11 years. Only 348 schools met these criteria and could be studied.
Results
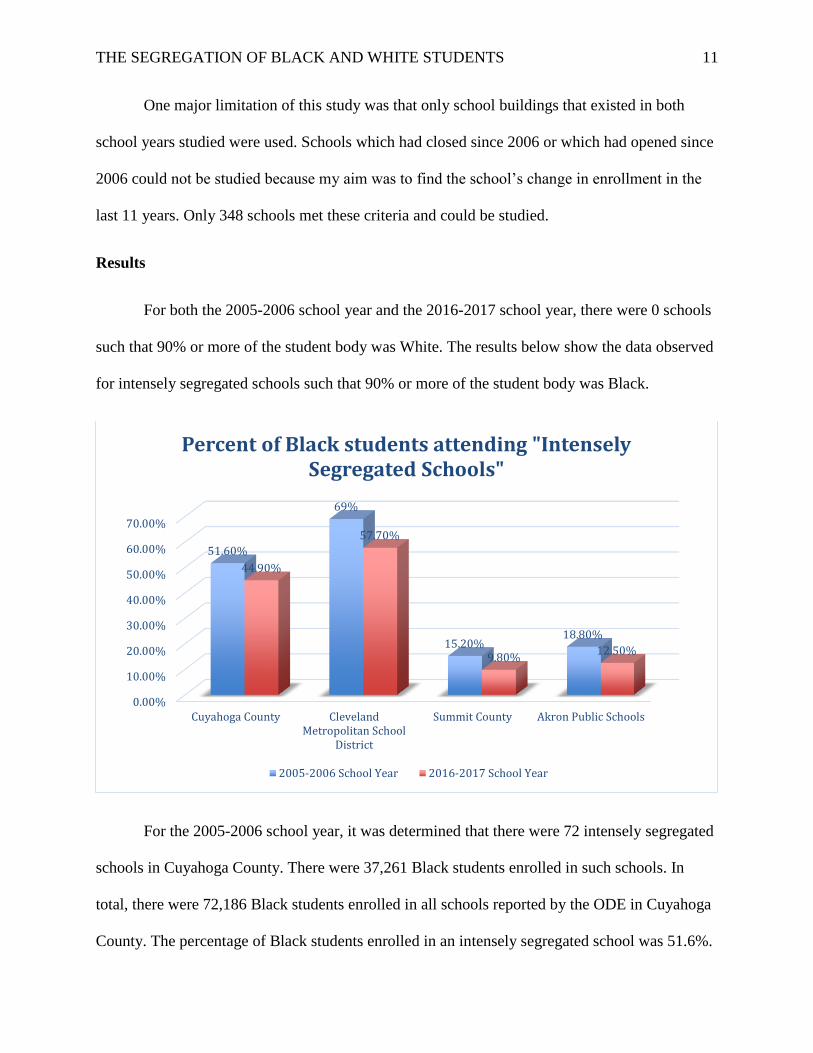
For both the 2005-2006 school year and the 2016-2017 school year, there were 0 schools
such that 90% or more of the student body was White. The results below show the data observed
for intensely segregated schools such that 90% or more of the student body was Black.
For the 2005-2006 school year, it was determined that there were 72 intensely segregated
schools in Cuyahoga County. There were 37,261 Black students enrolled in such schools. In
total, there were 72,186 Black students enrolled in all schools reported by the ODE in Cuyahoga
County. The percentage of Black students enrolled in an intensely segregated school was 51.6%.
0.00%
10.00%
20.00%
30.00%
40.00%
50.00%
60.00%
70.00%
Cuyahoga County ClevelandMetropolitan School
District
Summit County Akron Public Schools
51.60%
69%
15.20%18.80%
44.90%
57.70%
9.80%12.50%
Percent of Black students attending "Intensely Segregated Schools"
2005-2006 School Year 2016-2017 School Year
THE SEGREGATION OF BLACK AND WHITE STUDENTS 12
For the 2005-2006 school year, it was determined that there were 7 intensely segregated
schools in Summit County. There were 2,450 Black students enrolled in such schools. In total,
there were 16,107 Black students enrolled in all schools reported by the ODE in Cuyahoga
County. The percentage of Black students enrolled in an intensely segregated school was 15.2%.
For the 2005-2006 school year, it was determined that there were 52 intensely segregated
schools in the Cleveland Metropolitan School District (CMSD). There were 27,685 Black
students enrolled in intensely segregated schools in the CMSD. A total of 40,122 Black students
attended any school in the CMSD. The percentage of Black students enrolled in an intensely
segregated school within the CMSD was 69.0%.
For the 2005-2006 school year, it was determined that there were 7 intensely segregated
schools in the Akron Public Schools. There were 2,450 Black students enrolled in intensely
segregated schools in the APS. A total of 13,007 Black students attended any school in the APS.
The percentage of Black students enrolled in an intensely segregated school within the APS was
18.8%.
For the 2016-2017 school year, it was determined that there were 87 intensely segregated
schools in Cuyahoga County. There were 29,828 Black students enrolled in such schools. In
total, there were 66,460 Black students enrolled in all schools reported by the ODE in Cuyahoga
County. The percentage of Black students enrolled in an intensely segregated school was 44.9%.
For the 2016-2017 school year, it was determined that there were 3 intensely segregated
schools in Summit County. There were 1,407 Black students enrolled in such schools. In total,
there were 14,428 Black students enrolled in all schools reported by the ODE in Cuyahoga
County. The percentage of Black students enrolled in an intensely segregated school was 9.8%.
THE SEGREGATION OF BLACK AND WHITE STUDENTS 13
For the 2016-2017 school year, it was determined that there were 50 intensely segregated
schools in the Cleveland Metropolitan School District. There were 16,792 Black students
enrolled in intensely segregated schools in the CMSD. A total of 29,120 Black students attended
any school in the CMSD. The percentage of Black students enrolled in an intensely segregated
school within the CMSD was 57.7%.
For the 2016-2017 school year, it was determined that there were 2 intensely segregated
schools in the Akron Public Schools (though, 2 were within half a percent of the threshold).
There were 1,206 Black students enrolled in intensely segregated schools in the APS. A total of
9,639 Black students attended any school in the APS. The percentage of Black students enrolled
in an intensely segregated school within the APS was 12.5%.
-60
-50
-40
-30
-20
-10
0
10
20
30
40
50
60
40 50 60 70 80 90 100 110 120
Ch
ange
in
% o
f B
lack
En
roll
men
t
School Performance Index (2006)
Change in Black Enrollment Percentage from 2006 to 2017 vs. School Performance Index (2006)
THE SEGREGATION OF BLACK AND WHITE STUDENTS 14
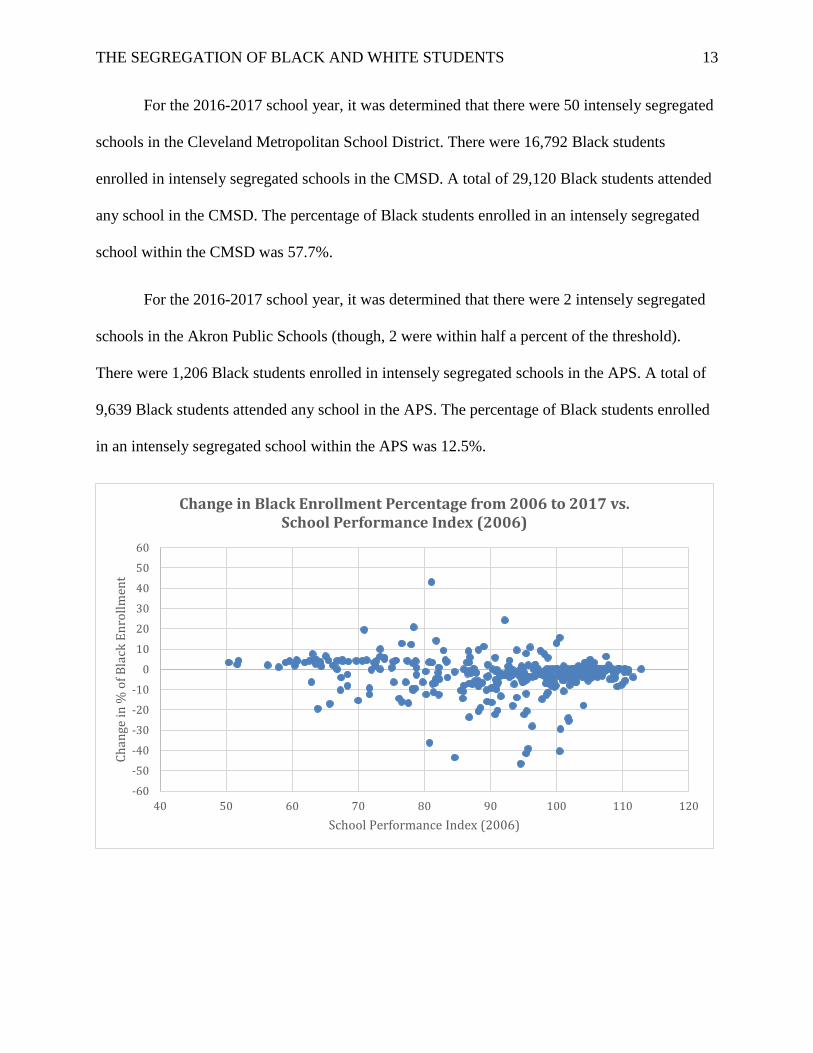
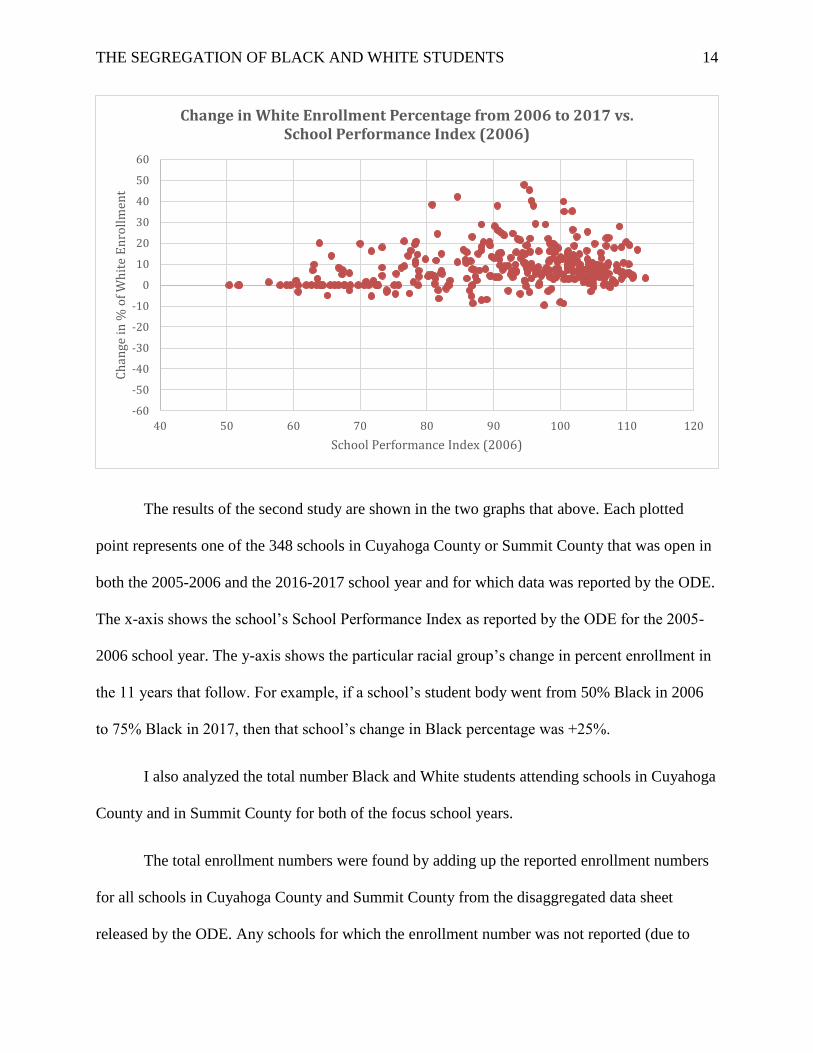
The results of the second study are shown in the two graphs that above. Each plotted
point represents one of the 348 schools in Cuyahoga County or Summit County that was open in
both the 2005-2006 and the 2016-2017 school year and for which data was reported by the ODE.
The x-axis shows the school’s School Performance Index as reported by the ODE for the 2005-
2006 school year. The y-axis shows the particular racial group’s change in percent enrollment in
the 11 years that follow. For example, if a school’s student body went from 50% Black in 2006
to 75% Black in 2017, then that school’s change in Black percentage was +25%.
I also analyzed the total number Black and White students attending schools in Cuyahoga
County and in Summit County for both of the focus school years.
The total enrollment numbers were found by adding up the reported enrollment numbers
for all schools in Cuyahoga County and Summit County from the disaggregated data sheet
released by the ODE. Any schools for which the enrollment number was not reported (due to
-60
-50
-40
-30
-20
-10
0
10
20
30
40
50
60
40 50 60 70 80 90 100 110 120
Ch
ange
in
% o
f W
hit
e E
nro
llm
ent
School Performance Index (2006)
Change in White Enrollment Percentage from 2006 to 2017 vs. School Performance Index (2006)
THE SEGREGATION OF BLACK AND WHITE STUDENTS 15
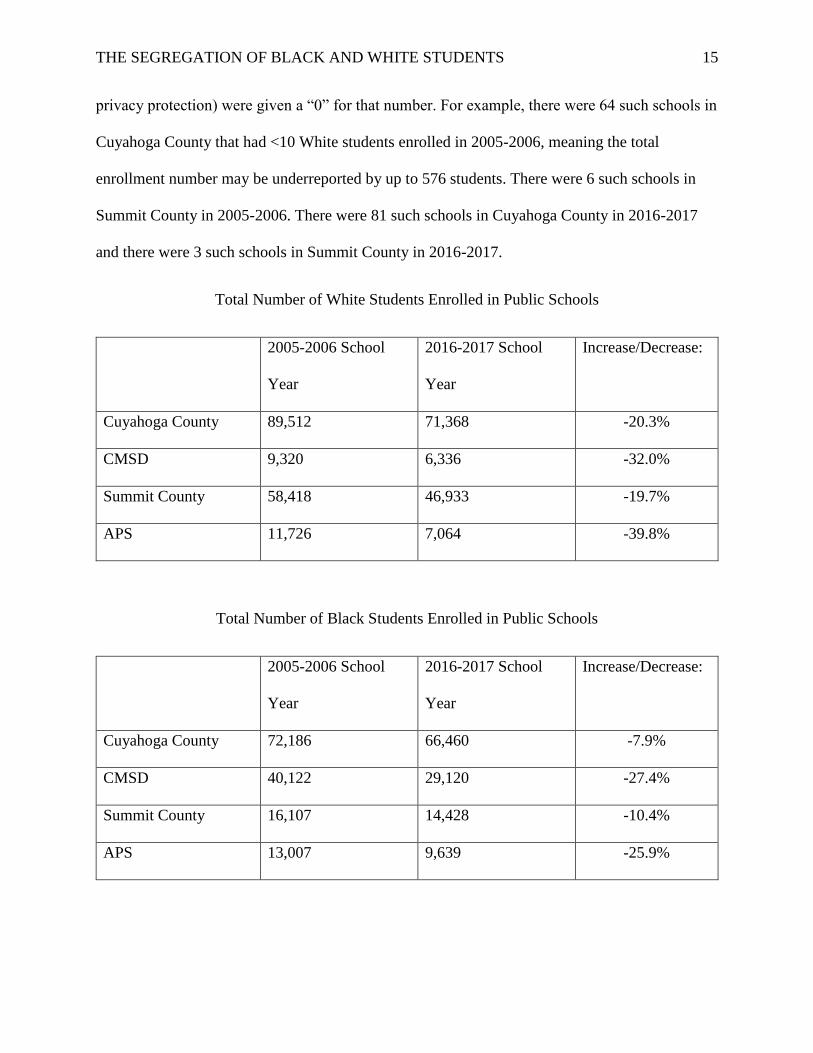
privacy protection) were given a “0” for that number. For example, there were 64 such schools in
Cuyahoga County that had <10 White students enrolled in 2005-2006, meaning the total
enrollment number may be underreported by up to 576 students. There were 6 such schools in
Summit County in 2005-2006. There were 81 such schools in Cuyahoga County in 2016-2017
and there were 3 such schools in Summit County in 2016-2017.
Total Number of White Students Enrolled in Public Schools
2005-2006 School
Year
2016-2017 School
Year
Increase/Decrease:
Cuyahoga County 89,512 71,368 -20.3%
CMSD 9,320 6,336 -32.0%
Summit County 58,418 46,933 -19.7%
APS 11,726 7,064 -39.8%
Total Number of Black Students Enrolled in Public Schools
2005-2006 School
Year
2016-2017 School
Year
Increase/Decrease:
Cuyahoga County 72,186 66,460 -7.9%
CMSD 40,122 29,120 -27.4%
Summit County 16,107 14,428 -10.4%
APS 13,007 9,639 -25.9%

THE SEGREGATION OF BLACK AND WHITE STUDENTS 16
Implications
The percentage of students enrolled in intensely segregated school buildings went down
in both counties over the course of 11 years, but not by much. This mirrors the findings of
Pavlyn Jankov and Carol Caref regarding the Chicago Public Schools. The percentages are still
fairly high, especially in Cuyahoga County. It is also noteworthy that the urban districts, CMSD
and APS, each have a higher percentage of students attending intensely segregated schools than
in their corresponding counties. This is a pattern that was commonly reported in many of the
literature sources that were reviewed.
There are many reasons that the percentage of students attending intensely segregated
schools may have decreased in the last 11 years. It is possible that district policies might be
reinforcing integration and still battling the once-mandatory segregation of the neighborhoods.
However, since the ruling that the segregation in CMSD and APS is “de facto,” not much has
been done to combat segregation of school buildings (such as busing across neighborhoods). It is
also possible that families are naturally desegregating themselves by moving to mixed
neighborhoods and enrolling their children in schools that were previously “intensely
segregated.” Because every intensely segregated school was >90% Black, this would need to
mean that non-Black families have moved to neighborhoods that were predominantly Black
approximately moved decade ago. This could mean that White families are moving to the area,
or that families of other races (which were not studied in this case) are moving to the area,
lowering the overall percentage of Black students attending those schools.
Another possible explanation for the decrease in students attending intensely segregated
schools is the that Black families may be moving out of the most highly segregated school zones.
This is supported most highly by the decrease in overall enrollment of Black students in both

THE SEGREGATION OF BLACK AND WHITE STUDENTS 17
counties and both urban districts. However, since the decline in overall White enrollment is more
drastic in every case, this would still need to be combined with increased enrollment of some
other racial group.
The overall decrease in enrollment for both counties and both urban districts is a curious
result. It is possible that families need not be relocating their residence at all. The change in
school enrollment may reflect that more and more families are opting for private school options
for their children, (and the statistics suggest that this would be a more common choice for White
families than for Black families). Alternatively, it may reflect that there are simply fewer school-
age children living in these counties now than there were 11 years ago.
The scatter plots that show the change in a school’s White percentage or Black
percentage could be attributed to several different factors as well. Notice that the schools that
reported the lowest School Performance Index in 2006 (scores of 50-60) did not see much
change in their enrollment over the next 11 years. This probably shows that very few families
moved into or out of the neighborhoods that attended these schools, and that few families
changed their choice of school (i.e. from public to private) in those years. Notice also that
schools that scored 60-110 in 2006 generally saw increases in White percentage and decreases in
Black percentage over the next 11 years. Very few schools have seen an increase in Black
percentage.
The data shown in these scatter plots suggests a connection between the School
Performance Index published by the ODE for a particular school building and the change in that
school’s enrollment that ensues. If the ODE reports a low rating for a school building (below 60),
it is reasonable to predict that the school will not see much change in enrollment in the coming
years. If the ODE reports a mid-level rating for a school building (60-80), it is reasonable to

THE SEGREGATION OF BLACK AND WHITE STUDENTS 18
predict that the school’s White enrollment percentage will increase slightly and that the school’s
Black enrollment percentage will decrease slightly. If the ODE reports a high rating for a school
building (above 80), it is reasonable to predict that the school’s White enrollment percentage will
increase more drastically and that its Black enrollment percentage will decrease more
dramatically.
This supports the findings that the percentage of Black students in intensely segregated
schools is decreasing (recall that all intensely segregated schools were more than 90% Black).
This means that these schools must be decreasing in their percentage of Black students, and that
the ratio of students of other races, like White students, must be increasing.
Although the percentage of students enrolled in intensely segregated schools has
decreased, these percentages are still very high, especially in the case of Cuyahoga County and
CMSD. Even the lowest percentage of 9.8% means that nearly one in every 10 African American
children attends a school where more than 90% of the school’s population is African American
as well. They are still attending highly segregated school buildings.
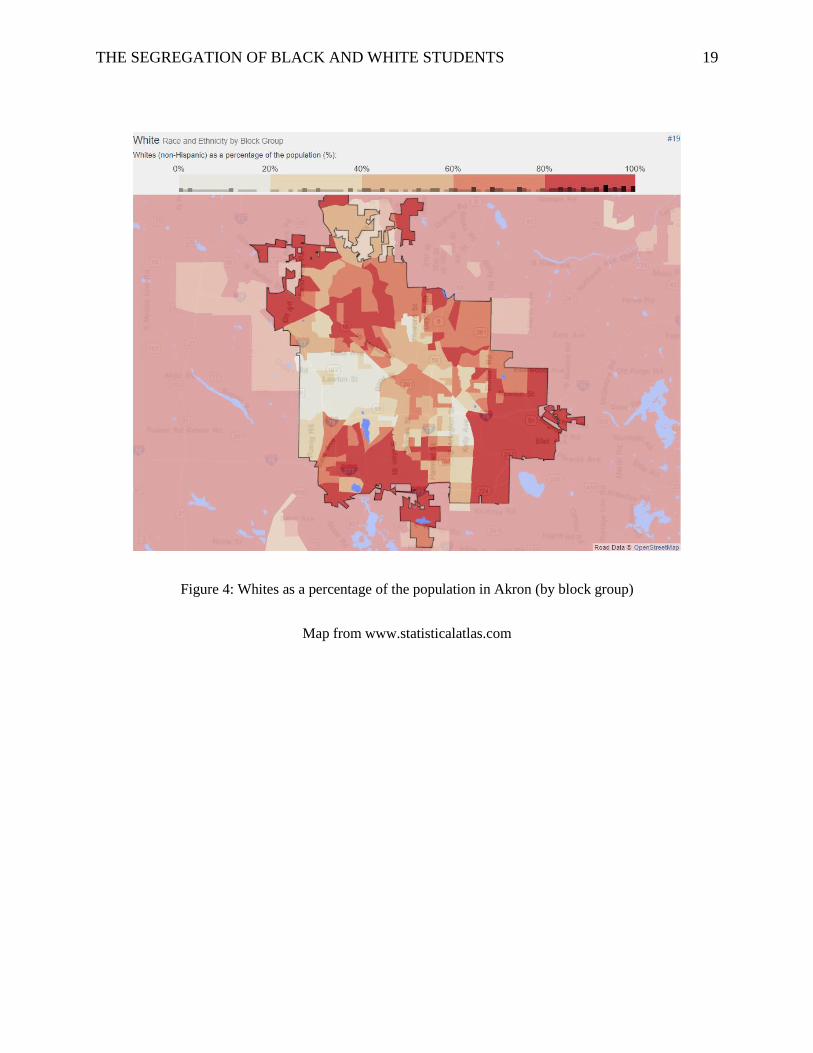
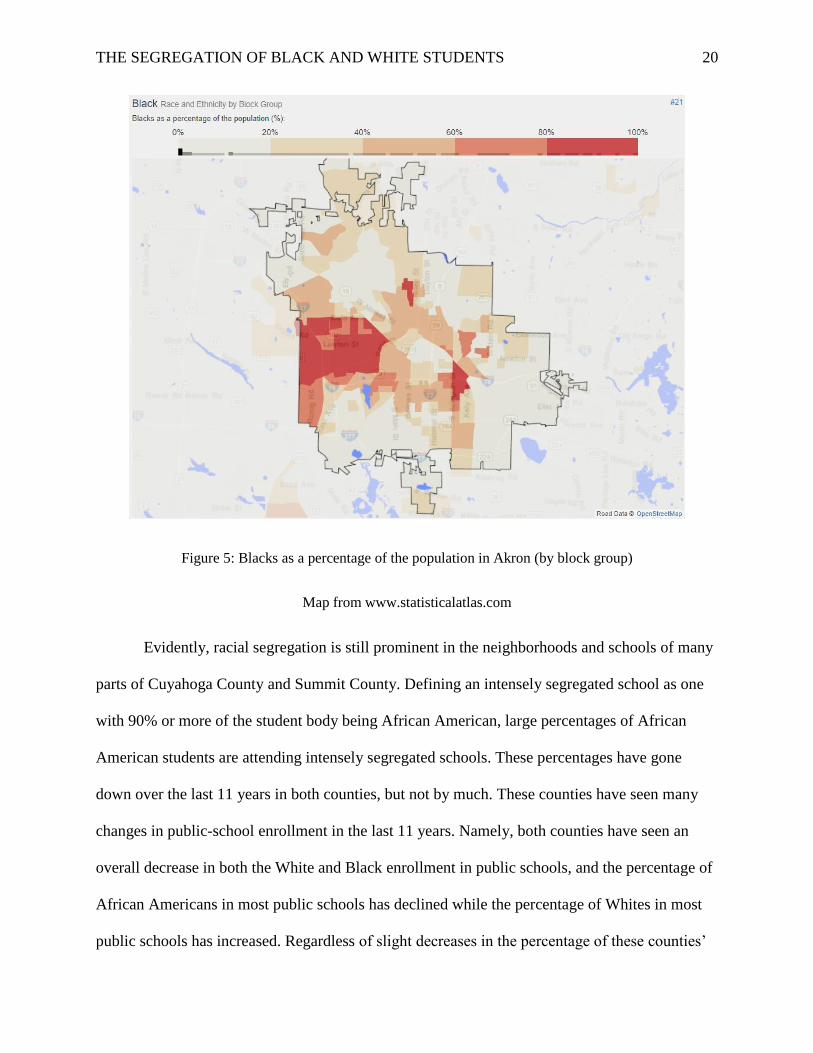
My supposition is that the existence of so many intensely segregated schools is residual
from the intense segregation of neighborhoods, whether it was mandated by law or whether it
was the results of something like “white flight,” when masses of White families leave an area
because of the introduction of things like school integration. It is easy to see the segregation of
neighborhoods in Akron that remains today. Take, for example, these maps (Figures 4 and 5)
from StatisticalAtlas.com, a website that compiles data from the 2010 U.S. census, of White and
Black population in Akron:
THE SEGREGATION OF BLACK AND WHITE STUDENTS 19
Figure 4: Whites as a percentage of the population in Akron (by block group)
Map from www.statisticalatlas.com
THE SEGREGATION OF BLACK AND WHITE STUDENTS 20
Figure 5: Blacks as a percentage of the population in Akron (by block group)
Map from www.statisticalatlas.com
Evidently, racial segregation is still prominent in the neighborhoods and schools of many
parts of Cuyahoga County and Summit County. Defining an intensely segregated school as one
with 90% or more of the student body being African American, large percentages of African
American students are attending intensely segregated schools. These percentages have gone
down over the last 11 years in both counties, but not by much. These counties have seen many
changes in public-school enrollment in the last 11 years. Namely, both counties have seen an
overall decrease in both the White and Black enrollment in public schools, and the percentage of
African Americans in most public schools has declined while the percentage of Whites in most
public schools has increased. Regardless of slight decreases in the percentage of these counties’
THE SEGREGATION OF BLACK AND WHITE STUDENTS 21
students attending intensely schools, and regardless of the cause of the current segregation
situation, it is evident that the battle to desegregate our public schools is far from over, and this is
an issue that needs special attention.
THE SEGREGATION OF BLACK AND WHITE STUDENTS 22
References
Ayscue, J. B, Greenberg, A., Kucsera, J., Siegel-Hawley, G., & Orfield, G. (2013). Losing
ground: School segregation in Massachusetts. UCLA: The Civil Rights Project / Proyecto
Derechos Civiles.
Ayscue, J. B., Siegel-Hawley, G., Kucsera, J., Woodward, B. (2018). School segregation and
resegregation in Charlotte and Raleigh, 1989-2010. Educational Policy, 32(1), 3-54.
Bell v. Board of Education, Akron Public Schools. 491 F. Supp. 916 (N.D. Ohio 1980).
Hall, J.D. (2005). The long civil rights movement and the political uses of the past. Journal of
American History, 91(4), 1233-1263.
Jankov, P., & Caref, C. (2017). Segregation and inequality in Chicago Public Schools,
transformed and intensified under Corporate Education Reform. Education Policy
Analysis Archives, 25(56), 1-35. https://files.eric.ed.gov/fulltext/EJ1144439.pdf
Kuscera, J., & Orfield, G. (2014). UCLA: New York State's extreme school segregation:
Inequality, inaction and a damaged future. UCLA: The Civil Rights Project / Proyecto
Derechos Civiles.
Logan, J. R., Weiwei, Z., & Oakley, D. (2017). Court orders, white flight, and school district
segregation, 1970-2010. Social Forces, 95(3), 1049-1075.
Ohio Department of Education. 2005-2006 Building Disaggregated Race/Ethnicity [Data file].
Retrieved from http://reportcard.education.ohio.gov/Pages/Download-Data.aspx
Ohio Department of Education. 2016-2017 Building Disaggregated Race/Ethnicity [Data file].
Retrieved from http://reportcard.education.ohio.gov/Pages/Download-Data.aspx
THE SEGREGATION OF BLACK AND WHITE STUDENTS 23
Patterson, J. T. (2002). Brown v. Board of Education: a civil rights milestone and its troubled
legacy.New York, Oxford University Press.
Reed v. Rhodes. 422 F. Supp. 708 (N.D. Ohio 1976).
Richards, M. P. (2014). The gerrymandering of school attendance zones and the segregation of
public schools: A geospatial analysis. American Educational Research Journal, 51(6),
1119-1157.
Statistical Atlas (2015). Race and Ethnicity in Akron, Ohio. Retrieved from
https://statisticalatlas.com/place/Ohio/Akron/Race-and-Ethnicity
Wells, A.S., Holme, J.L., Revilla, A.T., Atanda, A.K. (2004). How desegregation changed us:
The effects of racially mixed schools on students and society. Teachers College
Columbia University.