Embed Size (px)
Citation preview

The SEERMAP project: electricity roadmap for the South East European region - preliminary results on Albania
László SzabóPhotovoltaics – The Road towards
Diversification of Renewables in Albania13.04.2017 Tirana
1
OUTLINE
• Introduction of SEERMAP project
• Introduction to the EEMM model, main
assumptions and scenarios
• Preliminary results
• PV considerations in Albania
2
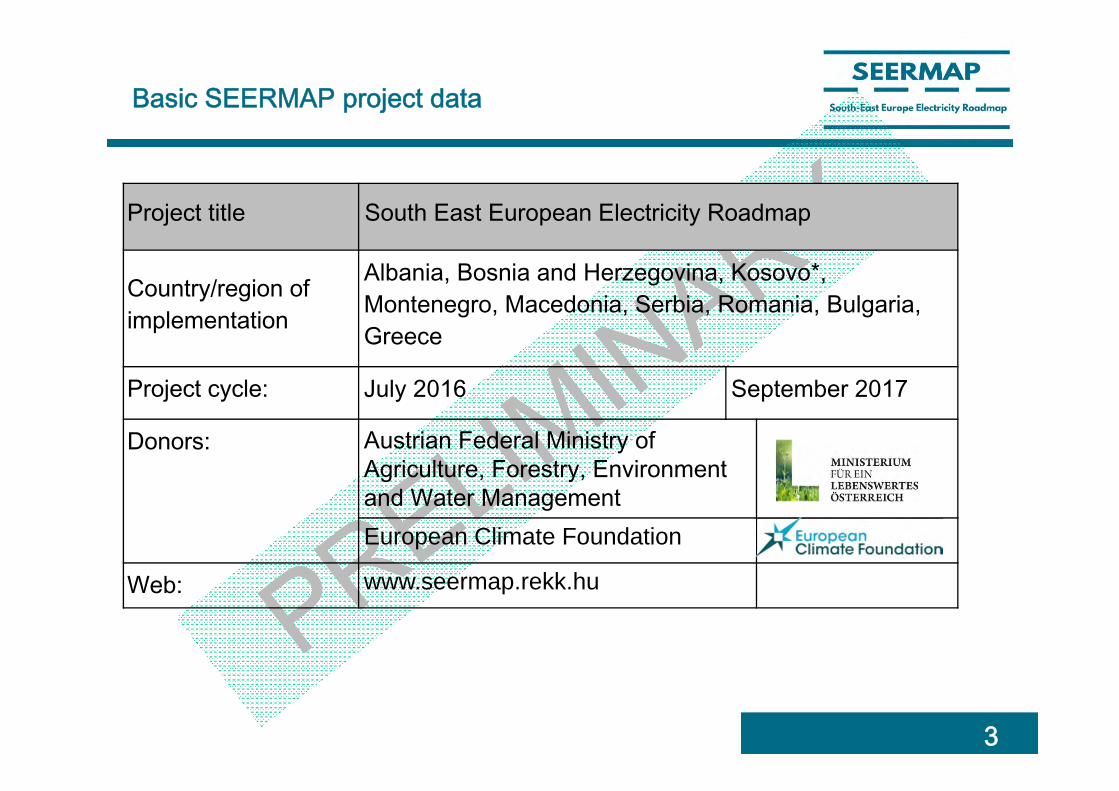
Basic SEERMAP project data
Project title South East European Electricity Roadmap
Country/region of implementation
Albania, Bosnia and Herzegovina, Kosovo*, Montenegro, Macedonia, Serbia, Romania, Bulgaria, Greece
Project cycle: July 2016 September 2017
Donors: Austrian Federal Ministry of Agriculture, Forestry, Environment and Water ManagementEuropean Climate Foundation
Web: www.seermap.rekk.hu
3
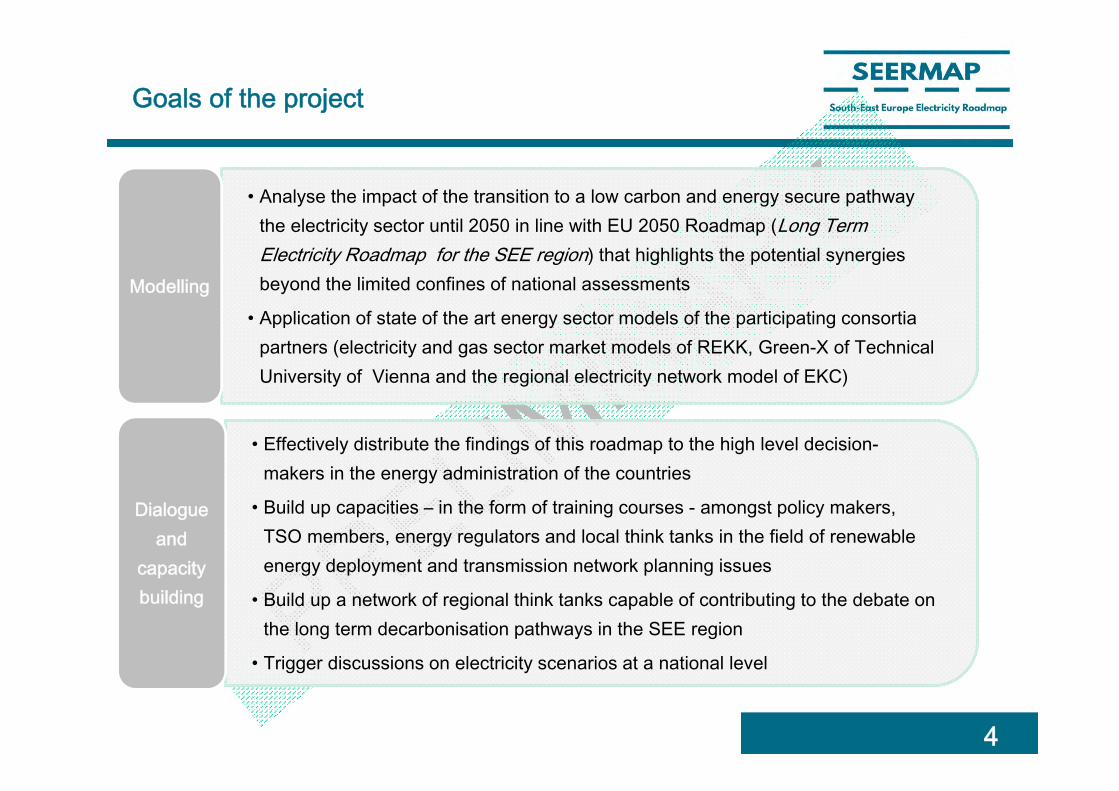
Goals of the project
4
• Analyse the impact of the transition to a low carbon and energy secure pathway the electricity sector until 2050 in line with EU 2050 Roadmap (Long Term Electricity Roadmap for the SEE region) that highlights the potential synergies beyond the limited confines of national assessments
• Application of state of the art energy sector models of the participating consortia partners (electricity and gas sector market models of REKK, Green-X of Technical University of Vienna and the regional electricity network model of EKC)
Modelling
• Effectively distribute the findings of this roadmap to the high level decision-makers in the energy administration of the countries
• Build up capacities – in the form of training courses - amongst policy makers, TSO members, energy regulators and local think tanks in the field of renewable energy deployment and transmission network planning issues
• Build up a network of regional think tanks capable of contributing to the debate on the long term decarbonisation pathways in the SEE region
• Trigger discussions on electricity scenarios at a national level
Dialogueand
capacitybuilding

Consortia and Local Partners
5
Country Local partner organisationsSerbia RES FoundationAlbania POLIS UniversityMacedonia MACEF – Macedonian Center for Energy EfficiencyMontenegro IPER - Institute for Entrepreneurship and Economic DevelopmentKosovo* INDEP – Institute for Development PolicyBosnia and Herzegovina EnovaRomania Energy Policy GroupBulgaria Center for DemocracyGreece FACETS
Consortium partners TaskRegional Centre for Energy Policy Research (REKK) Budapest, Hungary
Overall coordination, electricity and gas sector modelling
Technical University (TU Wien) Vienna, Austria Renewable deployment modelling with GREEN-X model
Electricity Coordinating Centre (EKC) Belgrade, Serbia Network modellingOG Research (Czech Republic) Macroeconomic assessmentEnergy Regulators Regional Association (ERRA) Trainings

European Electricity Market Model (EEMM)
6
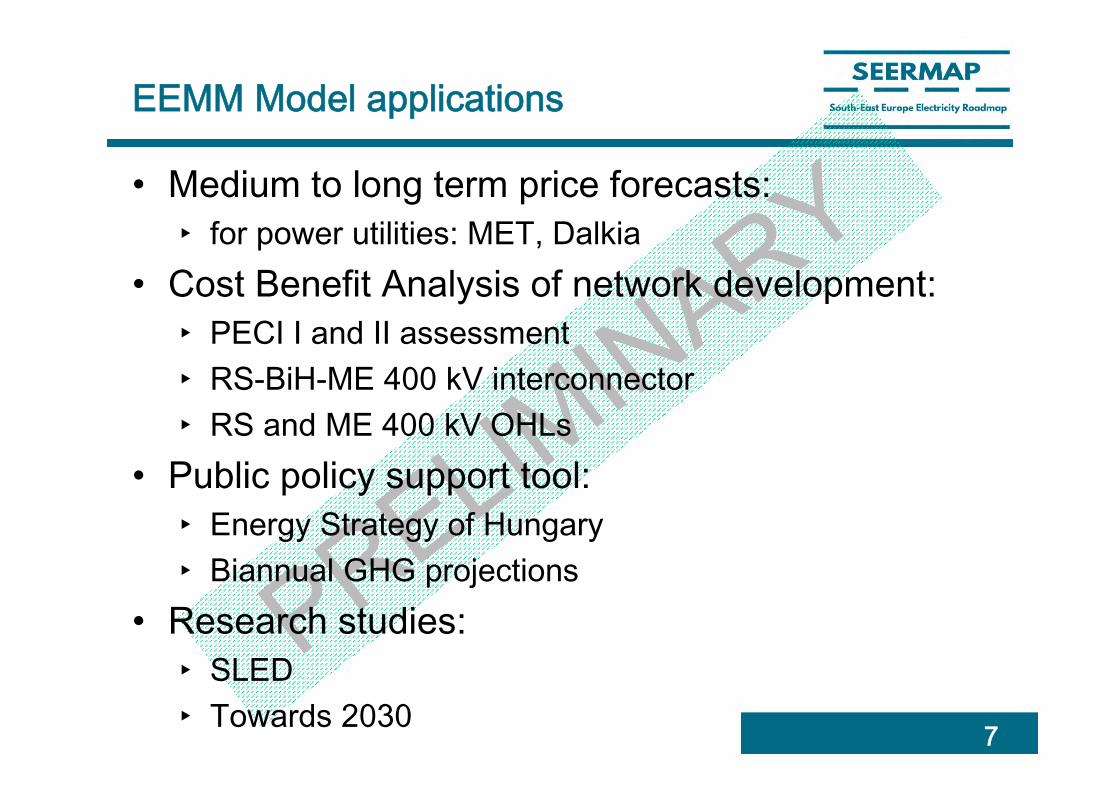
EEMM Model applications
• Medium to long term price forecasts:‣ for power utilities: MET, Dalkia
• Cost Benefit Analysis of network development: ‣ PECI I and II assessment‣ RS-BiH-ME 400 kV interconnector‣ RS and ME 400 kV OHLs
• Public policy support tool:‣ Energy Strategy of Hungary‣ Biannual GHG projections
• Research studies:‣ SLED‣ Towards 2030 7
8
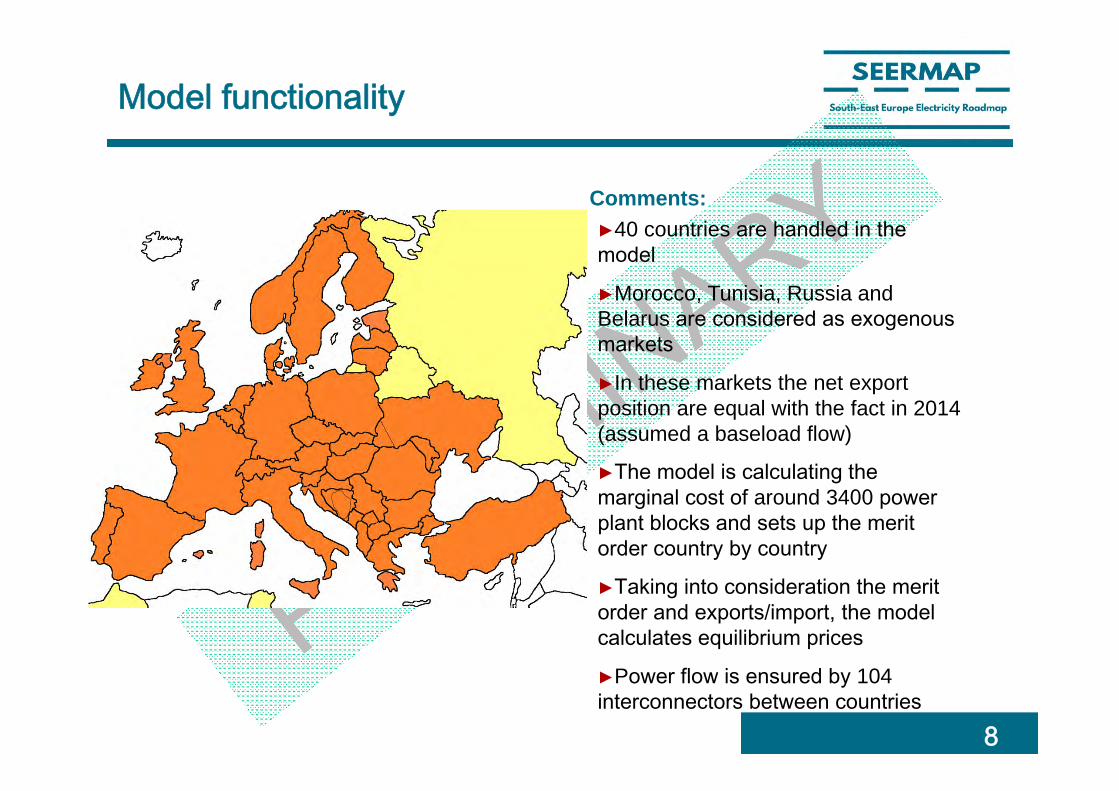
►40 countries are handled in the model
►Morocco, Tunisia, Russia and Belarus are considered as exogenous markets
►In these markets the net export position are equal with the fact in 2014 (assumed a baseload flow)
►The model is calculating the marginal cost of around 3400 power plant blocks and sets up the merit order country by country
►Taking into consideration the merit order and exports/import, the model calculates equilibrium prices
►Power flow is ensured by 104interconnectors between countries
Comments:
Model functionality
9
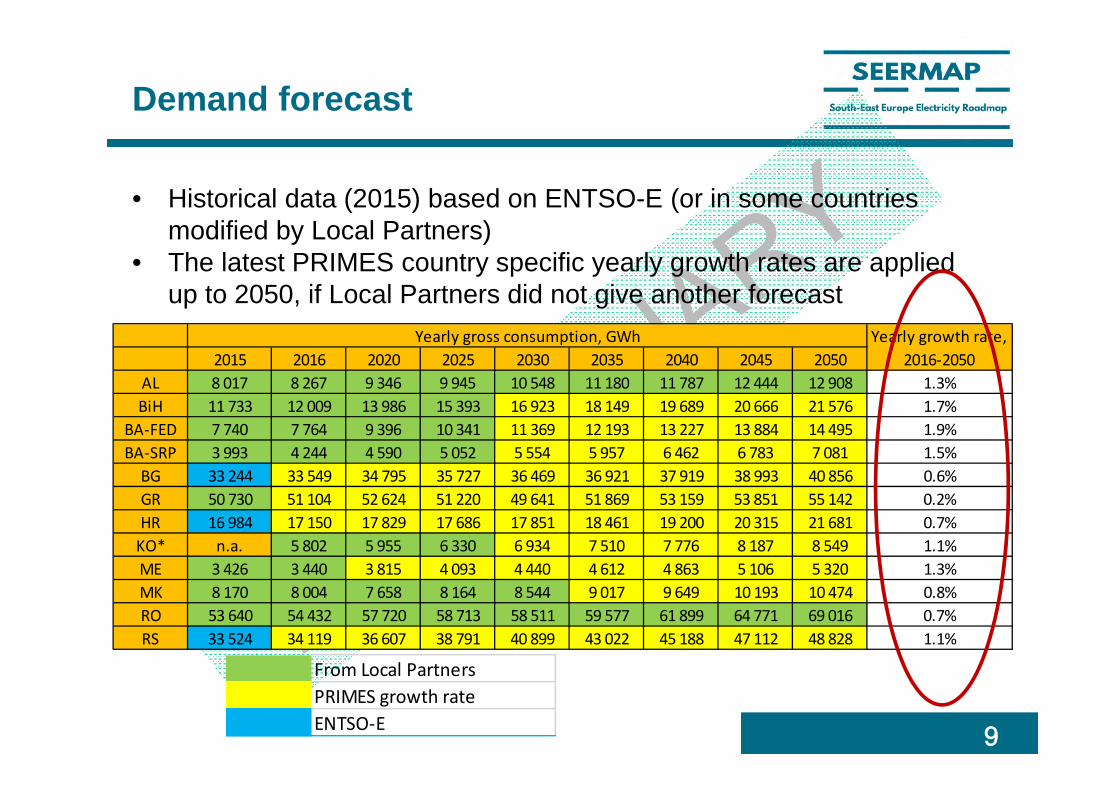
Demand forecast
• Historical data (2015) based on ENTSO-E (or in some countries modified by Local Partners)
• The latest PRIMES country specific yearly growth rates are applied up to 2050, if Local Partners did not give another forecast
From Local PartnersPRIMES growth rateENTSO‐E
2015 2016 2020 2025 2030 2035 2040 2045 2050AL 8 017 8 267 9 346 9 945 10 548 11 180 11 787 12 444 12 908 1.3%BiH 11 733 12 009 13 986 15 393 16 923 18 149 19 689 20 666 21 576 1.7%
BA‐FED 7 740 7 764 9 396 10 341 11 369 12 193 13 227 13 884 14 495 1.9%BA‐SRP 3 993 4 244 4 590 5 052 5 554 5 957 6 462 6 783 7 081 1.5%BG 33 244 33 549 34 795 35 727 36 469 36 921 37 919 38 993 40 856 0.6%GR 50 730 51 104 52 624 51 220 49 641 51 869 53 159 53 851 55 142 0.2%HR 16 984 17 150 17 829 17 686 17 851 18 461 19 200 20 315 21 681 0.7%KO* n.a. 5 802 5 955 6 330 6 934 7 510 7 776 8 187 8 549 1.1%ME 3 426 3 440 3 815 4 093 4 440 4 612 4 863 5 106 5 320 1.3%MK 8 170 8 004 7 658 8 164 8 544 9 017 9 649 10 193 10 474 0.8%RO 53 640 54 432 57 720 58 713 58 511 59 577 61 899 64 771 69 016 0.7%RS 33 524 34 119 36 607 38 791 40 899 43 022 45 188 47 112 48 828 1.1%
Yearly gross consumption, GWh Yearly growth rate, 2016‐2050
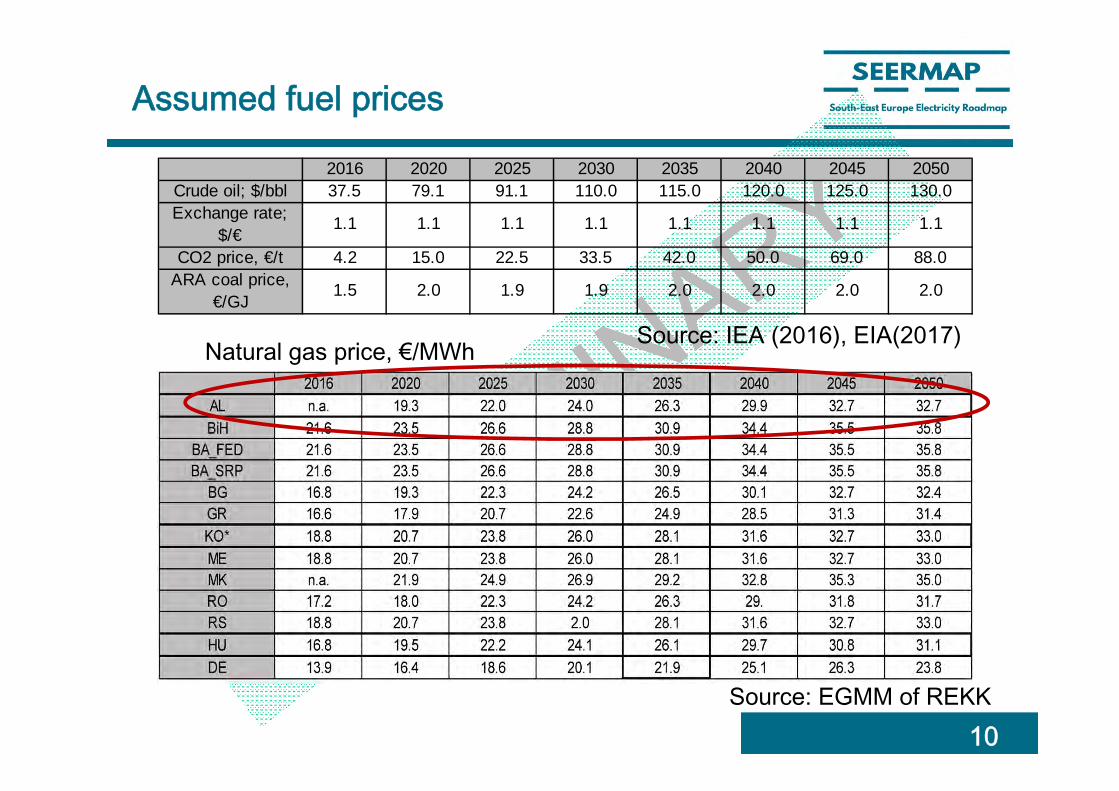
Assumed fuel prices
10Source: EGMM of REKK
Source: IEA (2016), EIA(2017)
2016 2020 2025 2030 2035 2040 2045 2050Crude oil; $/bbl 37.5 79.1 91.1 110.0 115.0 120.0 125.0 130.0Exchange rate;
$/€1.1 1.1 1.1 1.1 1.1 1.1 1.1 1.1
CO2 price, €/t 4.2 15.0 22.5 33.5 42.0 50.0 69.0 88.0ARA coal price,
€/GJ1.5 2.0 1.9 1.9 2.0 2.0 2.0 2.0
Natural gas price, €/MWh

Weighted Average Cost of Capital
• WACC represents the return on investment expectations of investors in a given country
• Higher the WACC, lower the investment• Country, technology and policy related elements of WACC• Assumed convergence to EU average level up to 2050
11
Scenario Definition
12
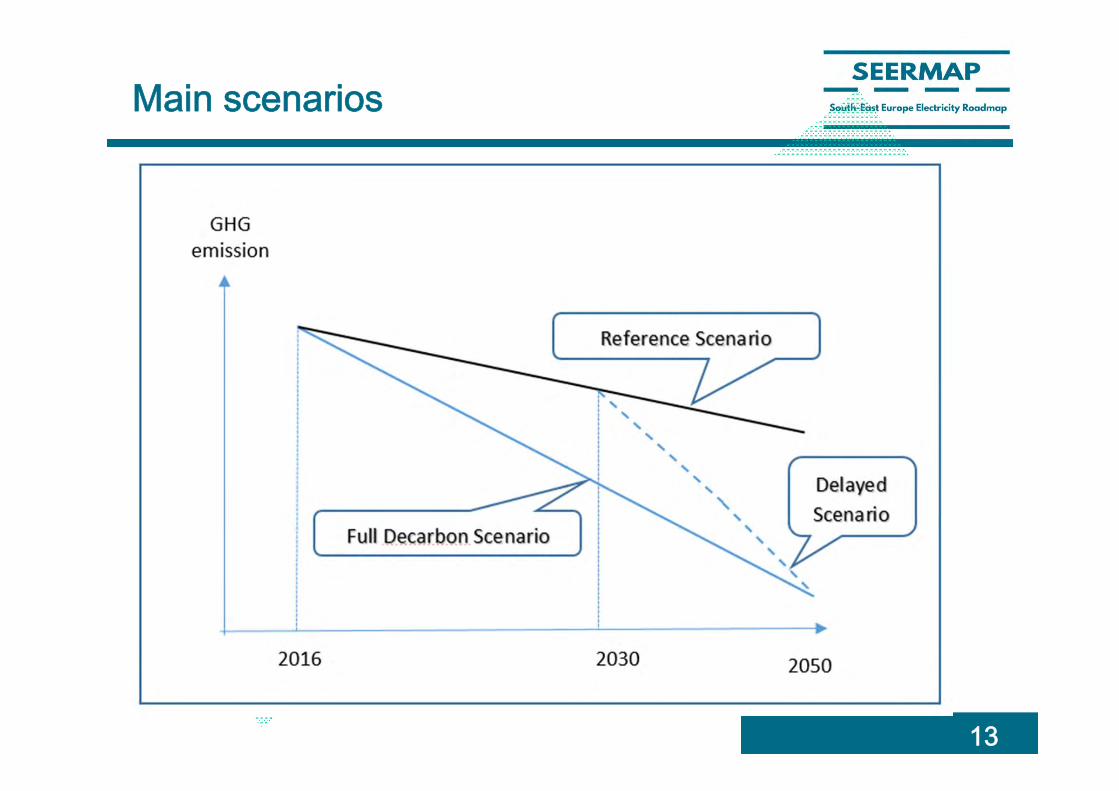
Main scenarios
13
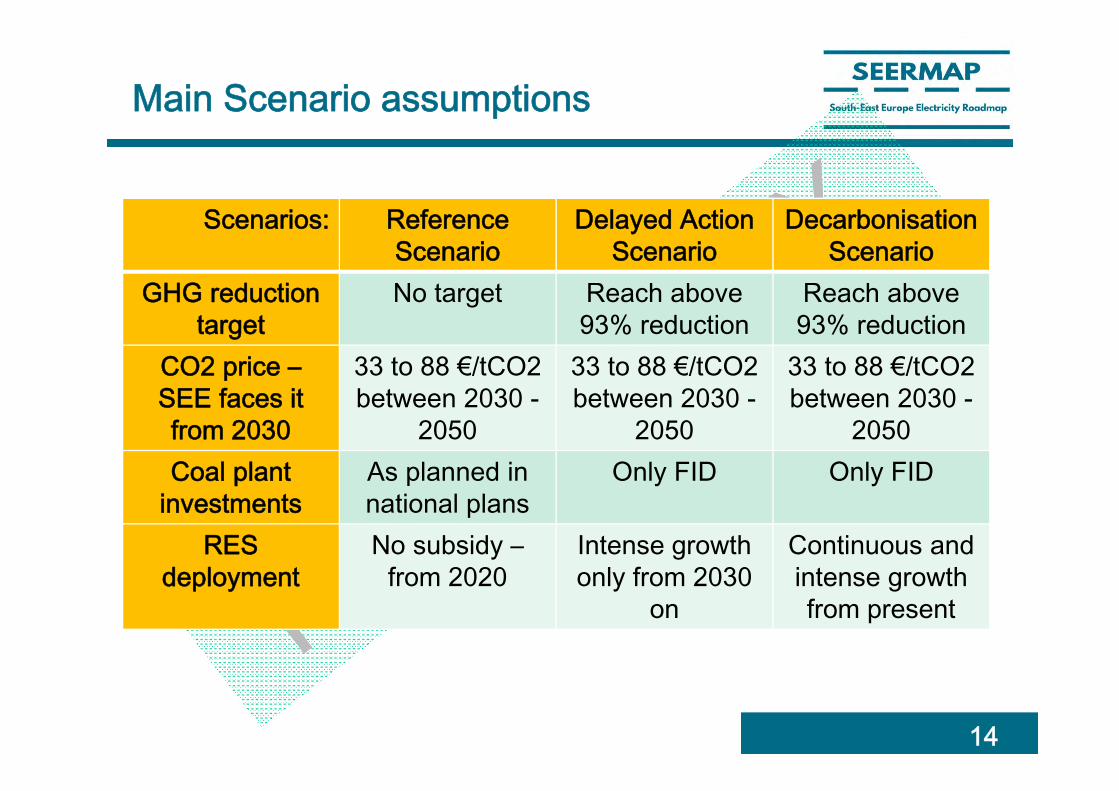
Main Scenario assumptions
Scenarios: Reference Scenario
Delayed Action Scenario
DecarbonisationScenario
GHG reduction target
No target Reach above 93% reduction
Reach above 93% reduction
CO2 price –SEE faces it from 2030
33 to 88 €/tCO2 between 2030 -
2050
33 to 88 €/tCO2 between 2030 -
2050
33 to 88 €/tCO2 between 2030 -
2050 Coal plant
investmentsAs planned in national plans
Only FID Only FID
RES deployment
No subsidy –from 2020
Intense growth only from 2030
on
Continuous and intense growth from present
14

Results
15
Results presented
• Only reference (REF) and DecarbonisationScenarios are analysed yet
• Only draft results• Iteration between EEMM and GREEN-X models
were carried out to ensure consistency between models:‣ EU wide modelling (not only SEERMAP countries)
16

Capacity – SEERMAP region; Reference Scenario
17
‐10 000
0
10 000
20 000
30 000
40 000
50 000
60 000
70 000
80 000
2015 2020 2025 2030 2035 2040 2045 2050
Installed capacity, M
W
Coal, lignite ‐ Existing Coal, lignite ‐ New Natural gas ‐ Existing Natural gas ‐ New
Nuclear ‐ Existing Nuclear ‐ New HFO/LFO Hydro
Wind Solar Other RES
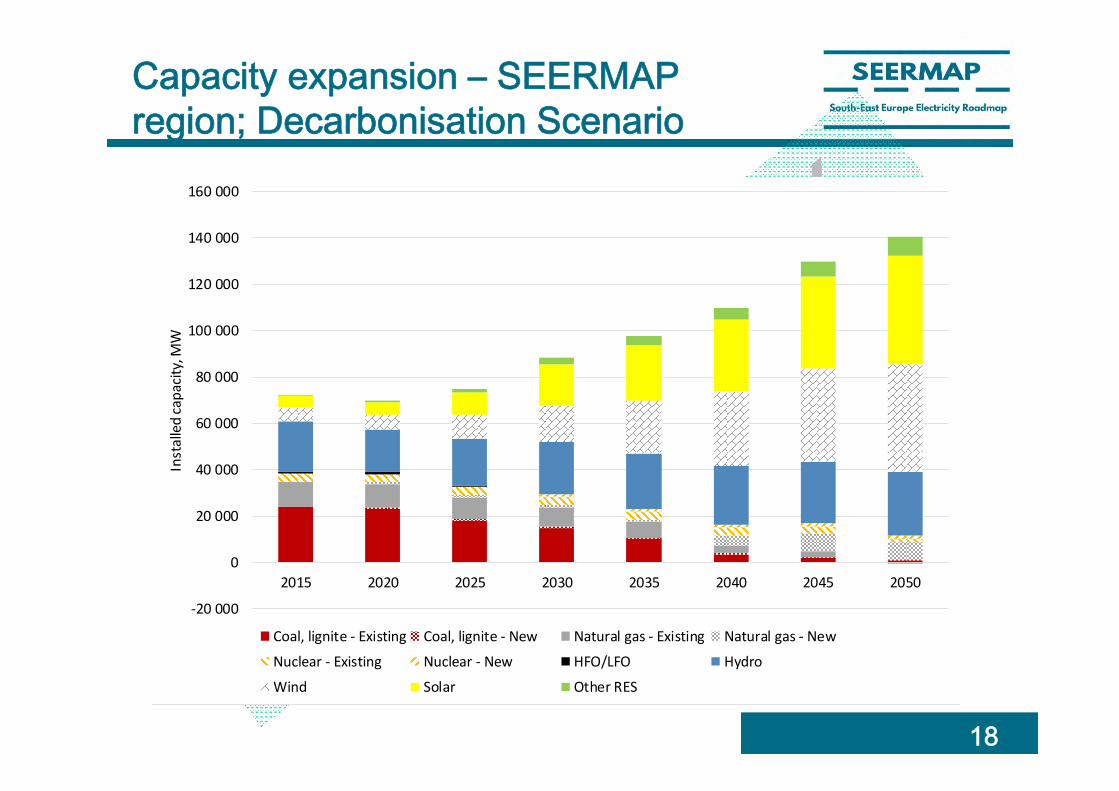
Capacity expansion – SEERMAP region; Decarbonisation Scenario
18
‐20 000
0
20 000
40 000
60 000
80 000
100 000
120 000
140 000
160 000
2015 2020 2025 2030 2035 2040 2045 2050
Installed capacity, M
W
Coal, lignite ‐ Existing Coal, lignite ‐ New Natural gas ‐ Existing Natural gas ‐ New
Nuclear ‐ Existing Nuclear ‐ New HFO/LFO Hydro
Wind Solar Other RES
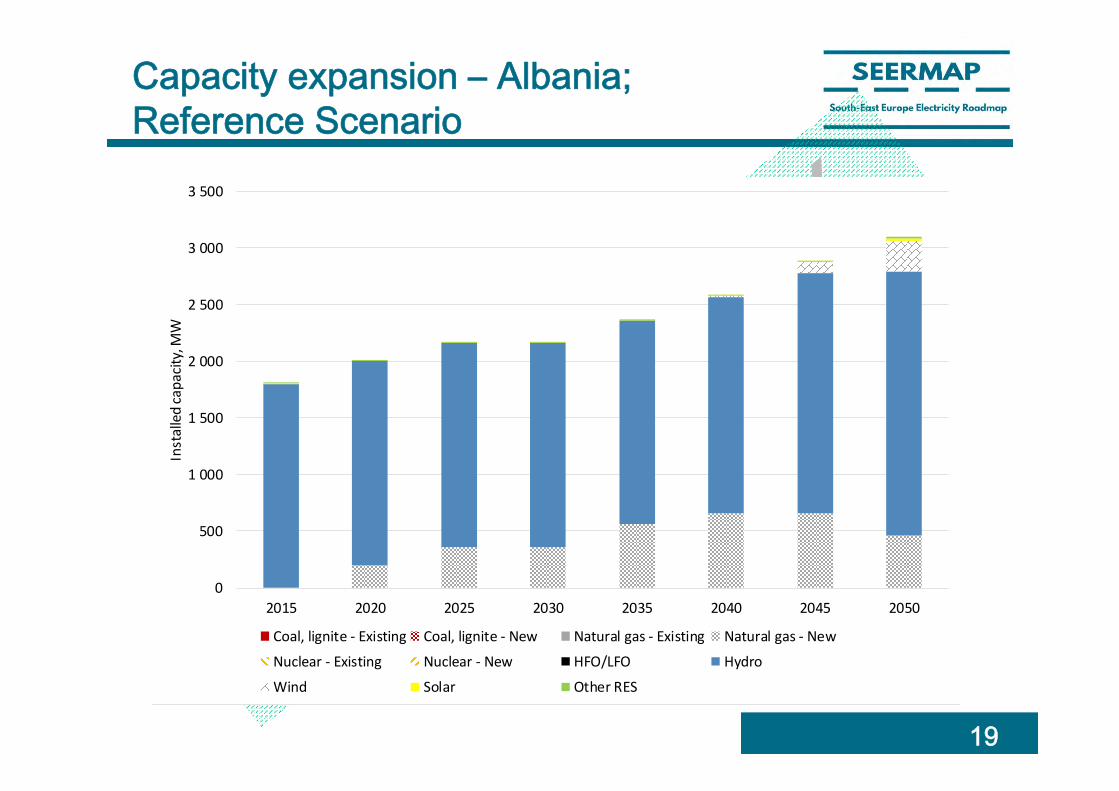
Capacity expansion – Albania; Reference Scenario
19
0
500
1 000
1 500
2 000
2 500
3 000
3 500
2015 2020 2025 2030 2035 2040 2045 2050
Installed capacity, M
W
Coal, lignite ‐ Existing Coal, lignite ‐ New Natural gas ‐ Existing Natural gas ‐ New
Nuclear ‐ Existing Nuclear ‐ New HFO/LFO Hydro
Wind Solar Other RES
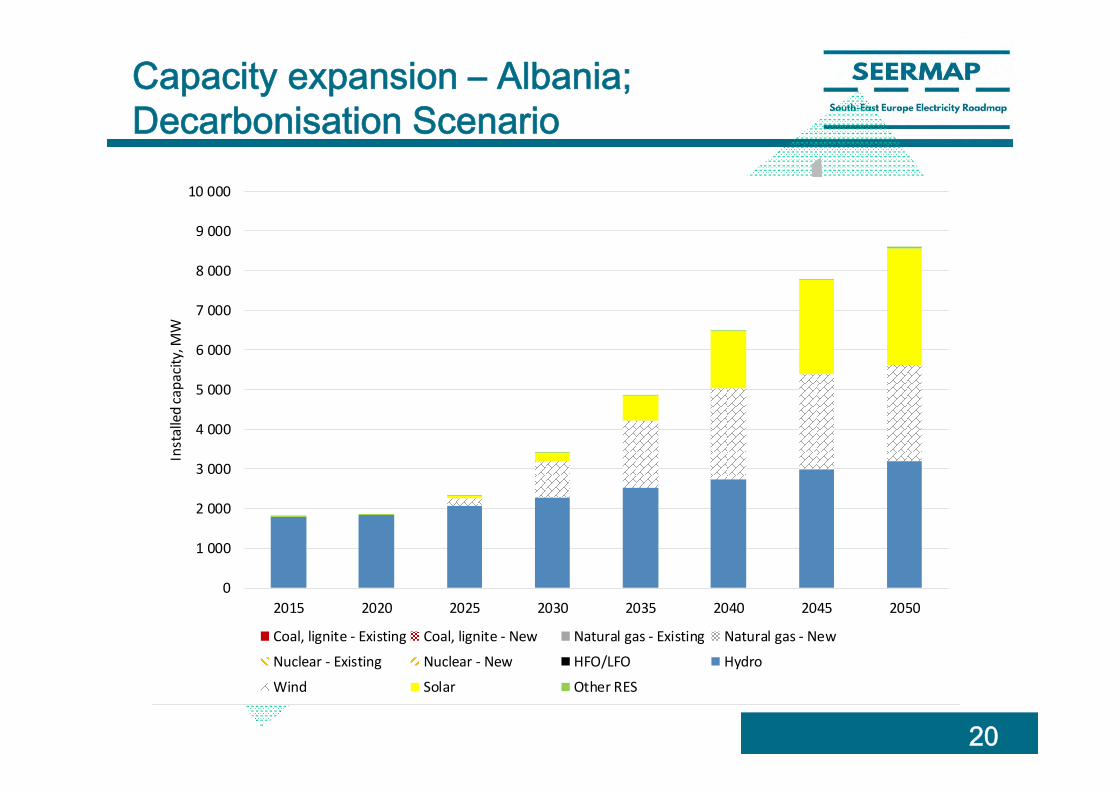
Capacity expansion – Albania; Decarbonisation Scenario
20
0
1 000
2 000
3 000
4 000
5 000
6 000
7 000
8 000
9 000
10 000
2015 2020 2025 2030 2035 2040 2045 2050
Installed capacity, M
W
Coal, lignite ‐ Existing Coal, lignite ‐ New Natural gas ‐ Existing Natural gas ‐ New
Nuclear ‐ Existing Nuclear ‐ New HFO/LFO Hydro
Wind Solar Other RES

Electricity mix – Albania– Decarbon Scenario
100%
100%
0
2
4
6
8
10
12
14
16
18
20
2016 2020 2025 2030 2035 2040 2045 2050
RES‐E share, %
TWh
Other RES Solar WindHydro Nuclear Natural gasCoal and lignite Consumption RES‐Share
21
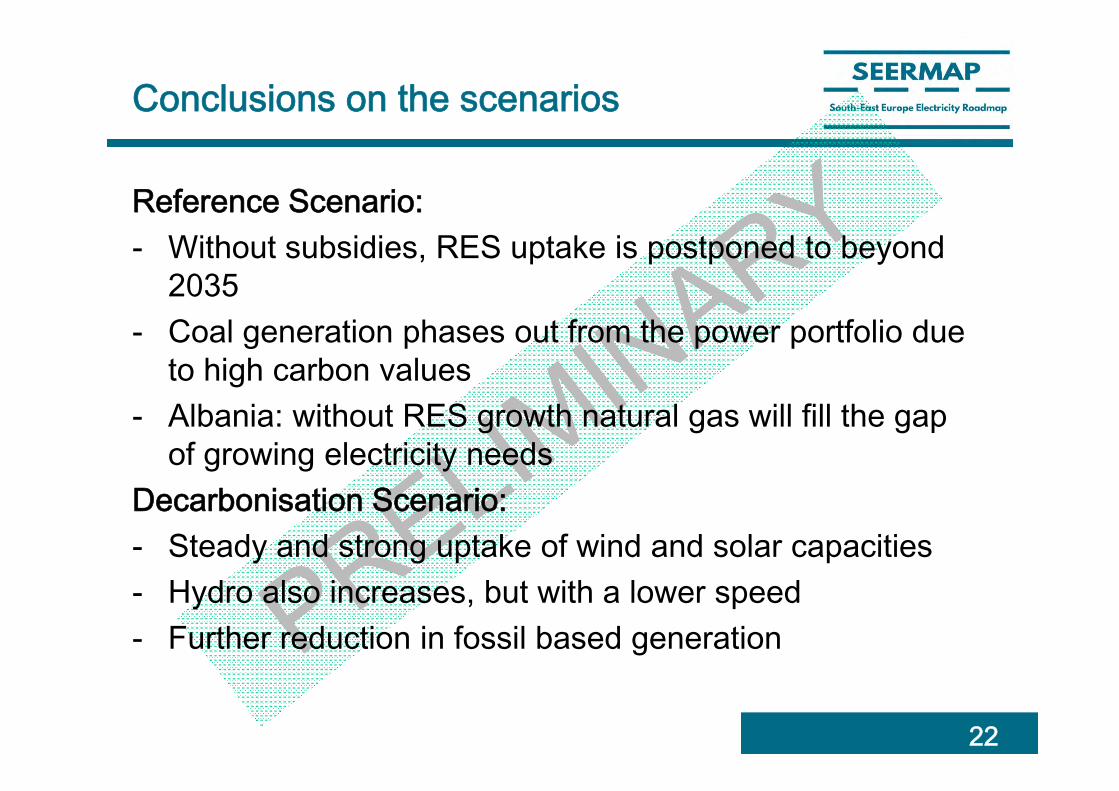
Conclusions on the scenarios
Reference Scenario:- Without subsidies, RES uptake is postponed to beyond
2035- Coal generation phases out from the power portfolio due
to high carbon values- Albania: without RES growth natural gas will fill the gap
of growing electricity needsDecarbonisation Scenario:- Steady and strong uptake of wind and solar capacities- Hydro also increases, but with a lower speed- Further reduction in fossil based generation
22

Policy questions and further steps
• What type of infrastructure development helps most the energy transition process in the region?‣ Gas infrastructure‣ Electricity interconnectors
• What power generation technologies are profitable on the 2050 horizon?
• What is the impact of CO2 price on the electricity mix?‣ Timing and level
Further steps in the SEERMAP project:‣ Sensitivity assessment (carbon value, demand, gas price)‣ Macroeconomic modelling of impacts‣ Electricity network modelling
23
The role of PV in Albania and in the region
24

WACC across the EU

WACC – LCOE correspondence
Source: BVG associates 2016 and REKK calculations- example of wind farm with 25 year lifetime and typical OM and capital cost, but presently PV is in this range as well

PV considerations for Albania (1)
• Risk premiums should be reduced in the region:‣ Country risk – role of government‣ Technology risk: it is a global trend‣ Regulatory risk: needs actions, but could be reduced
• If WACC is high – net metering could be a tool to start investments in a region:‣ Lower return expectation of participants in a
net metering scheme:• They are consumers already in the market• Their aim is to self-consume, and not excess
generation 27

PV considerations for Albania (2)
• A power portfolio of a mix of PV plus hydro production can better cover demand in the long term:‣ Expected higher demand in the summer due to higher
cooling demand (air conditioning)‣ More efficient heating (from resistant heating to
inverters) will also reduce demand from the winter peak
‣ Hydro shortages of summer months could be substituted away by PV generation
‣ Increasing interconnectedness with neighbours will allow higher RES trade, including PV
28