Embed Size (px)
Citation preview
The SEC’s Elimination of 20-F Reconciliation and the Cost of Bank Loans
Saiying Deng*, Southern Illinois University
Lucy Huajing Chen, Villanova University
Parveen P. Gupta, Lehigh University
Heibatollah Sami, Lehigh University
(Abstract)
We examine the impact of SEC’s elimination of 20-F reconciliation on cost of bank
loans. To the extent that information production is costly, the elimination of 20-F reconciliation
is associated with increased information collection costs. Consistent with such view, we find that
banks charge higher interest spread to IFRS firms after the elimination rule, to compensate for
the information loss. Furthermore, we document such effect is more pronounced in IFRS firms
borrowing from distant lenders such as foreign banks, and in IFRS firms with more opaque
financial reporting and less proprietary information. Our main results are robust to several
sensitivity checks.
First Draft: April 27, 2014
Preliminary draft, please do not quote.
JEL Classification: G31 and M48
Key Words: 20-F reconciliation; cost of bank loans; information loss; loan spread
* Corresponding author. Department of Finance, College of Business, Southern Illinois
University, Carbondale, IL 62901. Email: [email protected], phone: 618-453-1418.
1
1. Introduction
To respond to the global accounting convergence and especially the adoption of
International Financial Reporting Standards (IFRS) by the European Union, the U.S. Securities
and Exchange Commission (SEC) adopted a rule to accept financial statements from foreign
private issuers prepared in accordance with IFRS as issued by the International Accounting
Standards Board (IASB) without reconciliation to the U.S. Generally Accepted Accounting
Principles (GAAP) (SEC 2007) on December 21, 2007. This new rule became effective on
March 4, 2008, for all foreign private issuers with fiscal years ending on and after November 15,
2007. Prior to the adoption of this rule, foreign private issuers which prepared their financial
statements using accounting standards other than U.S. GAAP were required to file Form 20-F
reconciliation with the SEC.1
Prior studies document that reconciliation provides useful information to shareholders in
the U.S. equity market to assess the financial condition of the foreign private issuers and suggest
that the elimination of the reconciliation is “premature” (e.g., Harris and Muller 1999; Chen and
Sami 2008, 2013; Henry, Lin, and Yang 2009). On the other hand, more recent studies find
there are no significant economic consequences in the equity market associated with the
elimination of 20-F reconciliation (e.g., Kim, Li, and Li 2012; Jiang, Petroni, and Wang 2010).
However, there is scant empirical evidence on how the 20-F reconciliation information is used
by private lenders such as banks and the economic consequence of the elimination rule in private
debt market. In this paper, we attempt to fill this void by examining whether the elimination of
1 Form 20-F is an annual report filed by foreign private issuers with the SEC. Foreign firms were required to file
form 20-Fs within six months after fiscal year end. On Form 20-Fs, foreign firms reported the quantitative and
qualitative differences between their primary accounting standards, either home country GAAP or IFRS, and the
U.S. GAAP under item 17 or item 18.
2
20-F reconciliation is associated with cost of bank loans in the U.S. for foreign private issuers
that prepared their financial statements under IFRS as issued by the IASB.2
We focus on bank loans because they become the primary source of corporate debt
financing in the past decade (Sufi 2009). We argue that the impact of elimination of 20-F
reconciliation on the private debt market may differ from that of equity market for the following
reasons: First, banks act as delegated monitor (Diamond 1984) and are specialized in information
collection and processing. Banks collect borrower-specific information over time and across
multiple products, perform due diligence and act as delegated monitors to borrowers. This
information advantage makes lending relationship banks special (Fama 1985; James 1987;
Lummer and McConnell 1989; Gande and Saunders 2012;), compared to arm’s-length investors
such as stockholders.3 To the extent that information production is costly, the elimination of 20-F
reconciliation may result in higher information collection costs for banks.
Second, banks, if possible, collect both soft and hard information about borrowers to
help assess their credit quality and reduce information uncertainty (Petersen 2004). Soft
information comes from onsite visits, and face-to-face interactions, etc., while hard information
primarily comes from financial statements, including 20-F reconciliation. Although the U.S.
GAAP continues to converge with IFRS, understanding the differences between these two
accounting standards is informative when establishing debt covenants, especially in cross-border
transactions (PWC 2013). From this perspective, 20-F reconciliation provides valuable
supplemental information for lenders to better interpret the financial statements and confirm the
2 The standards developed and approved by the IASB since 2001 are IFRS. Before that, they were International
Accounting Standards (IAS). For convenience, we refer to IFRS as both IFRS and its predecessor IAS. 3 The information advantage may make banks less susceptible to the information loss associated with the
elimination of 20-F reconciliation, even if reconciliation can be value relevant to arm’s length investors as
documented in Harris et al. (2009), and Chen and Sami (2013).
3
accounting numbers. Unlike shareholders, banks have asymmetric payoff structure: they bear
substantial downside risk without the potential of reaping upside benefits (Watts 2003).
Accordingly, banks could be more sensitive to information risk engendered by the elimination of
20-F reconciliation.
Lastly, many cross-listed firms get syndicated loans in international loan market, of
which most of the lead arrangers are foreign banks. Lenders may find the cost of collecting soft
information about and monitoring borrowers at a great distance (i.e., foreign borrowers)
prohibitive, and may rely more on hard information to make loan decision. Therefore, we expect
the information loss associated with elimination of 20F reconciliation is more pronounced for
lenders that are at great distance from their borrowers. To sum up, the information loss
associated with elimination of 20-F reconciliation, coupled with greater information collection
and monitoring costs associated with geographic distance, may lead the banks to charge higher
interest rate to foreign private issuers after the elimination of 20-F reconciliation.
Based on the arguments presented above, we predict that banks charge higher interest
rates to IFRS firms after the elimination rule. We also predict that such effect is more
pronounced in IFRS firms that borrow from distant banks such as foreign banks, where the
borrower’s headquarters is located in a different country from the country of syndication of the
syndicated loan.
It is notable that there are alternative information sources such as corporate voluntary
disclosures that may aid a lender to evaluate its borrowers’ creditworthiness. The impact of
elimination of 20-F on information loss crucially depend on the usefulness of the alternative
information sources in assessing borrowers’ credit quality.
4
We also examine whether a firm’s financial reporting opacity affects the association
between the elimination of 20-F and cost of bank loans. According to Franco et al. (2012),
“because banks rely primarily on periodic financial accounting reports and disclosure, along with
private information, to assess the creditworthiness (Spiro 2007), if a firm’s financial reporting is
more opaque, then the demand for private information and other supplemental and
complementary information that help interpret financial statements will be greater.” We thus
expect that 20-F reconciliation provides more useful information for lenders to interpret financial
statements in more opaque reporting firms. Consequently, lenders may charge higher interest
spread in firms with more opaque financial reporting after the elimination of 20-F reconciliation.
We further investigate whether a firm’s proprietary information affect the cost of bank
loans after the elimination rule. Banks need to collect more soft information in firms with more
proprietary information to make prudential lending decision. On the contrary, banks rely more on
hard information in firms with less proprietary information to make wise lending decision.
Therefore, we postulate that 20-F reconciliation provides more useful information for firms with
less proprietary information. As a result lenders charge higher interest spread in firms with less
proprietary information after the elimination of 20-F reconciliation.
We test our hypotheses using foreign private issuers that borrow at least one bank loan
before and after the elimination rule during 2005─2012 sample period. Our test sample consists
of foreign firms that prepared financial statements under IFRS as issued by the IASB and did not
reconcile to U.S. GAAP after the elimination of 20-F reconciliation. Our control firms include
foreign firms that prepared financial statements under their home country GAAP or U.S. GAAP;
that is, firms that do not change their reconciling behavior after the no-reconciliation rule. We
5
use a difference-in-differences approach and cluster standard errors at firm level with industry
fixed effects.
Our findings are generally consistent with our predictions. We find that loan spread
increases significantly in the post-elimination period for the test firms vis-a-vis the control firms.
Our result is consistent with our conjecture that there is significant information loss associated
with the elimination rule to private lenders, and in turn banks charge higher loan spread to IFRS
firms. We also find that IFRS firms borrowing from foreign banks experience a significantly
higher loan spread after the elimination of 20-F reconciliation compared to the control firms,
while there is no association between loan spread and the elimination of 20-F reconciliation for
IFRS firms borrowing from domestic banks. The evidence is consistent with our predication that
the elimination of 20-F reconciliation is a significant information loss event for private lenders
especially foreign banks that are far away from borrowers. It also suggests that the increasing
geographic distance between the borrower and banks leads to a more pronounced information
loss due to the elimination of 20-F reconciliation, as a result lenders charge a higher loan spread.
Third, We further document foreign IFRS firms with greater financial reporting opacity and less
proprietary information experience higher loan spread after the elimination rule. The result is
consistent with our predication that 20-F reconciliation provides more useful information for
firms with more opaque financial reporting/less proprietary information; as a result lenders
charge higher interest spread to compensate for the greater information loss.
Our paper contributes to the literature in the following ways: first, to the best of our
knowledge, this is the first paper to examine the economic consequence of elimination of 20-F
reconciliation in private debt market. Banks are special, and have information collection and
monitoring advantages over dispersed arm’s-length investors (Rajan, 1992). The elimination of
6
20-F reconciliation may impose a significant information loss for lenders, especially
geographically distant ones, which rely more on hard information provided by financial
statements in their lending decisions. We find that the elimination of 20-F reconciliation is
associated with significant increase in loan spread, suggesting that there is a significant
information loss associated with the elimination of 20-F reconciliation in private debt market.
Second, our study is related to Kim et al. (2012) who find no evidence that the
elimination of 20-F reconciliation has a significant impact on market liquidity, probability of
informed trading, cost of equity, analyst forecasts, institutional ownership, and stock price
efficiency and synchronicity. Our results contrast with theirs as we document that banks charge
higher loan spread to IFRS borrowers after the elimination rule. Furthermore, we find a more
pronounced information loss effect for IFRS firms borrowing from distant banks such as foreign
banks, since great distance makes information collection and monitoring prohibitive and erodes
lenders’ information advantage. We do not find information loss when the IFRS firms borrow
from domestic lenders. We argue that banks are better at collecting and processing information,
compared to arm’s-length investors in the equity market. 20-F reconciliation provides important
supplemental information for banks to interpret the financial statements, while shareholders may
not rely on the 20-F reconciliation to assess the credit worthiness of borrowers, and therefore
there are no significant economic consequences associated with the elimination rule in the equity
market. 4
Third, our study complements existing studies on why banks are special (James 1987;
Lummer and McConnell 1989; Gande and Saunders 2012; etc.). We show that banks are
4 In addition, cross-listed firms possess much thinner trading volume than their underlying local markets
(Chakravarty, Chiyachantana, and Jiang 2011), which may make it harder to detect any price impact in these
markets using equity data.
7
different from shareholders or bondholders in the public market and experience significant
information loss due to the elimination of 20-F reconciliation, especially when the lender-
borrower distance increases.
Fourth, our study relates to an emerging stream of literature on how geography affects
important financial outcomes and how geographic proximity is related to information advantage
of being local. For example, Chen, Hong, Huang and Kubik (2004), Coval and Moskowitz
(1999 and 2001) document that mutual fund managers investing in geographically proximate
companies enjoy superior returns due to the informational advantage from selecting nearby
stocks. Francis, Hasan, and Waisman (2007) find that rural firms experience a higher cost of
debt than urban firms because of the difficultly associated with monitoring their activities.
Similarly, Butler (2008) documents that local investment banks sell municipal bonds at lower
yields and charge lower fees than their non-local counterparts do. Such pricing advantage arises
from local investment banks’ soft information advantage. Using the elimination of 20-F
reconciliation as a unique setting, our study complements this stream of research by documenting
that distant lenders lose information advantage and charge a higher loan spread to foreign IFRS
firms after the elimination rule.
Finally, our paper contributes to the ongoing debate that challenges whether the SEC was
judicious in eliminating the 20-F reconciliation requirement. We document that eliminating the
20-F reconciliation requirement is associated with higher cost of bank debt for foreign IFRS
issuers. From this perspective, our result is more in line with Henry et al. (2009) and Chen and
Sami (2013) that reconciliation may provide some useful information to a subset of investors.
Overall, our findings shed some light on the economic consequences in the private debt market
8
associated with SEC’s decision to eliminate the 20-F reconciliation requirement for foreign
private issuers.
The remainder of the paper proceeds as follows: Section II presents related literature and
hypotheses development. Section III describes sample selection and research design. Section IV
presents the empirical results. Section V concludes.
II. Related literature and hypotheses development
2.1 Existing studies on 20-F reconciliation
There are split views about the economic consequences of elimination of 20-F
reconciliation in equity market. Hopkins et al. (2008), representing American Accounting
Association’s Financial Accounting and Reporting Section of the Financial Reporting Policy
Committee, argues that reconciliation provides useful information to assess the financial
condition of the foreign private issuers and suggests that the elimination of the reconciliation is
“premature” (Hopkins et al. 2008). Consistent with this view, prior literature provides empirical
evidence that reconciliation to U.S. GAAP contains some information content beyond IFRS.5 For
example, Harris and Muller (1999) find that earnings reconciliation from International
Accounting Standards (IAS) (forerunner to the current IFRS) to U.S. GAAP is value relevant in
the market valuation model, although earnings reconciliation per share is not associated with
price per share. In addition, Chen and Sami (2008) find that investors in the U.S. capital markets
trade on the earnings reconciliation from IAS to U.S. GAAP during the 1995-2004 period.
Henry, Lin, and Yang (2009) document that both net income reconciliation and book value
reconciliation from IFRS to U.S. GAAP are value relevant in the market valuation model but the
5 The standards developed and approved by the IASB since 2001 are IFRS. Before that, they were International
Accounting Standards (IAS). For convenience, we refer to IFRS as both IFRS and its predecessor IAS.
9
net income reconciliation is not value relevant in the long-term return model during the 2005-
2006 period. Also, Gordon, Jorgensen, and Linthicum (2008) show that accrual reconciliation
from IFRS to U.S. GAAP provides incremental information content beyond IFRS accruals from
2004 to 2006. Chen and Sami (2013) report that the relation between abnormal trading volume
and earnings reconciliation from IFRS to U.S. GAAP during the 2005-2006 period is driven by
first-time IFRS users with low institutional ownership.
On the other hand, Jamal et al. (2008), representing American Accounting Association’s
Financial Accounting Standards Committee, argue that the cost of preparing and auditing 20-F
reconciliation is substantial and “allowing foreign companies to use IFRS without costly
reconciliations to U.S. GAAP is likely to make U.S. stock exchanges more competitive and
provide useful feedback to U.S. accounting standard-setters about the efficacy of their standards”
(Jamal et al. 2008). There are also empirical studies echoing such view. For example, Kim et al.
(2012) compare foreign IFRS firms in the year before with the year after the no-reconciliation
rule. They find no evidence that removing the reconciliation has a negative impact on these
firms’ market liquidity, probability of informed trading, cost of equity, analyst forecasts,
institutional ownership, and stock price efficiency and synchronicity. Overall, their results do not
support information loss for equity investors. Similarly, Jiang et al. (2010) document no
abnormal trading volume, abnormal return volatility, or bid-ask spread during the short term
window around the release of 20-F in the year after the rule. In addition, Jiang et al. (2010) find
an accelerated filing of 20-F in the year after the rule compared to the year before, which they
interpret as an indication of the cost savings for these foreign IFRS firms.
2.2 Information, geographic distance, and bank lending
10
Banks collect borrower-specific information over time and across multiple products,
perform due diligence and act as delegated monitor to borrowers (Diamond 1984). This
information advantage makes lending relationship banks special (Fama 1985; Lummer and
McConnell 1989; Gande and Saunders 2012;). Banks can collect two types of borrower-specific
information: (i) Soft information, which is information loan officers collect through face-to-face
interaction with a potential borrower, onsite visits, and local contacts, etc., including
entrepreneur’s competence, honesty, management style, employee morale, etc.). Soft information
is hard to verify and credibly transfer within an organization hierarchy. (ii) Hard information,
which is information that is verifiable and can be credibly transferred (i.e. faxed or emailed)
within an organization hierarchy. The major sources of hard information are financial statements
and credit scoring, etc. 20-F reconciliation provides useful supplemental information about the
borrowers, which may help lenders especially lenders at a great distance from borrowers confirm
the accounting numbers. More specifically, reconciling to U.S. GAAP provides banks an
opportunity to confirm the IFRS-based accounting numbers, which potentially improves the
precision of information, provides additional assurance on the financial reporting quality, and
reduces information risk. Therefore the elimination of 20F reconciliation creates information loss
for lenders that rely on hard information to make loan decisions, for which lenders may charge
higher loan spread. Based on the above arguments, our first hypothesis is as follows:
H1: IFRS firms experience higher interest rates on bank loans after the elimination of 20-
F reconciliation.
However, there are alternative information sources such as corporate voluntary
disclosures that aid a lender to evaluate the borrowers’ creditworthiness. Those could become
countervailing forces against this prediction. IFRS firms may adopt voluntary disclosures to
11
make up the information loss associated with the elimination rule. Kim et al. (2012), Jiang et al.
(2010) find that none of their sample firms provide voluntary reconciliation after the rule. In
contrary, Yu (2011) find that IFRS firms significantly increase their overall voluntary disclosures
in annual financial reports and earnings announcement press releases after the elimination of 20-
F reconciliation. However, according to Cheng, Liao, and Zhang (2013), voluntary disclosure
does not serve as a credible commitment mechanism as mandatory disclosure.
Existing studies document that distance is related to information collection and
monitoring. Agarwal and Hauswald (2010) find that borrower proximity facilitates lenders to
collect soft information, thereby enhancing banks’ private information quality, and thus their
information advantage. Petersen and Rajan (2002) and Berger et al. (2005) document as the
physical distance between a lender and its borrowers increases, soft information collection
becomes more difficult and costly, eroding banks’ information advantage. Mian (2006)
document that foreign banks are willing to make transaction loans based on hard information, but
they are at a comparative disadvantage when making relational loans based on soft information.
Similarly, Hauswald and Marquez (2006) argue that lenders that are geographically
proximate to borrowers act as more effective monitors, and the quality of banks’ information
generation process is a decreasing function of lender-borrower distance. Along a similar vein,
Almazan (2002), and Sussman and Zeira (1995) indicate that a bank’s monitoring expertise is a
decreasing function of lender-borrower distance, and lenders’ monitoring costs are an increasing
function of distance. Hollander and Verriest (2011) find that distance erodes lenders’ ability to
collect and process borrower-specific information, as a result, lenders rely more on covenants to
resolve contracting frictions. Ayers, Ramalingegowda and Yeung (2011) posits that institutional
investor’s cost of acquiring monitoring information increases with the distance between a firm
12
and institutional investor, and find that local institutional investors lead to less financial reporting
discretion by the corporate managers.
Based on the above arguments, banks located closer to their borrowers enjoy significant
information advantage and more efficient monitoring, resulting in lower cost of information
collection and monitoring which the bank may pass on to borrowers in the form of lower interest
spread. On the other hand, banks may charge higher interest rates to distant borrowers due to the
greater information and monitoring costs. Therefore we propose the following hypothesis:
H2: IFRS firms that borrow from distant banks experience higher interest rates on bank
loans after the elimination of 20-F reconciliation.
2.3. Financial reporting opacity
We examine whether a firm’s financial reporting opacity may exacerbate the information
loss associated with the elimination rule. According to Franco et al. (2012), in a firm with more
opaque financial reporting, the demand for private information and other supplemental and
complementary information that may aid interpreting financial statements becomes greater. We
expect 20-F reconciliation provides more useful information in firms with more opaque financial
reporting. Therefore lenders may charge higher loan spread in firms with opaque financial
reporting after the elimination of 20-F, accordingly we propose the following hypothesis:
H3: IFRS firms that have more opaque financial reporting experience higher interest
rates on bank loans after the elimination of 20-F reconciliation.
2.4. Proprietary information
We investigate whether 20-F reconciliation provides more useful information in firms
with less proprietary information. In firms with more proprietary information, the demand for
banks collecting soft information is greater. In contrary, lenders rely more on hard information
13
(i.e., 20-F reconciliation) when making loans to firms with less proprietary information.
Therefore elimination of 20-F reconciliation leads to a greater information loss for banks that
lend to firms with less proprietary information. As a result, we expect cost of bank loan increase
more in firms with less proprietary information after the elimination of 20-F. Accordingly we
propose the following hypothesis:
H4: IFRS firms that have less proprietary information costs experience higher interest
rates on bank loans after the elimination of 20-F reconciliation.
III. Data and empirical methodology
3.1. Sample selection
We obtain syndicated loan data from the Dealscan database provided by the Loan Pricing
Corporation of Thomson Reuters, which contains detailed information on bank loans worldwide,
such as borrower and lender identities, loan amounts, LIBOR spread, issuing and maturity dates,
etc. We link the Dealscan and the Compustat database using a link file compiled by Chava and
Roberts (2008).6 Loan-specific, borrower-specific, and stock return information are obtained,
respectively, from Dealscan, Compustat, and CRSP databases. We hand collect the accounting
standard data from the SEC website. Since syndicate structure and loan contract terms (e.g., loan
amount, maturity, pricing) differ across different facilities in a deal, our analysis is conducted at
the loan facility level. Our sample spans from January 1, 2005 to December 31, 2012. We start
on January 1, 2005 as the European Union (EU) mandated all EU-listed companies adopt IFRS
beginning on January 1, 2005. As the elimination rule is effective for all foreign private issuers
with fiscal years ending on and after November 15, 2007, we classify the pre-elimination loan as
6 We would like to thank Michael R. Roberts for generously providing us the Dealscan-Compustat link file.
14
loan originated from January 1, 2005 to November 14, 2007 and the post-elimination loan as
loan originated from November 15, 2007 to December 31, 2012.
The sample selection process is as follows: We first hand collect accounting standard
information for 992 cross listed firms between January 1, 2005 and December 31, 2012. We
delete 147 firms which switch accounting standard before and after the elimination rule and
hence obtain 845 cross listed firms which use the same accounting standard during the entire
sample period. From these 845 firms, we extract Compustat data to construct firm-specific
variables and obtain 4,123 firm-year observations with 781 unique firms after deleting missing
values. We then merge these 4,123 observations with Dealscan dataset through Dealscan-
Compustat link file compiled by Chava and Roberts (2008). After deleting observations with
missing values, awe get 808 loan facilities for 179 unique cross listed firms over 2005~2012
sample period. There are 56 IFRS firms with 292 facilities, and 123 non-IFRS control firms with
516 facilities.
3.2. Research design
To investigate the effect of elimination of 20-F reconciliation on bank loan pricing, we
follow Graham, Li, and Qiu (2008) by controlling for firm-specific, loan-specific, and
macroeconomic factors that may affect loan pricing. We include industry fixed effects in all
models. We estimate the models with standard errors clustered at firm level.
LoanSpread=α+β×IFRS+γ×After+ƥ×IFRS×After+¢×Firm-specific-factors+θ×Loan-specific-
factors+ρ×Macroeconomic-factors+ ε (1)
Since loan contract terms (e.g., loan amount, maturity, pricing) vary across different
facilities in a deal, we estimate model (1) using facility level data. Following Graham, Li, and
Qiu (2008), and Kim, Song, and Zhang (2011), we measure the interest rate spread using the all-
15
in-drawn spread (Spread) from Dealscan, the amount a borrower pays the lender each year in
basis points over LIBOR for each dollar borrowed, and take the log of Spread to proxy for
LoanSpread. IFRS is an indicator for firms which use IFRS accounting standard. After takes the
value of one for the post-elimination period loan, and zero for the pre-elimination period loan.
The post-elimination (pre-elimination) period loans consist of loans originate from November
15, 2007 to December 31, 2012 (from January 1, 2005 to November 14, 2007). Our variable of
interest is the interaction term between IFRS and After. If the elimination rule leads to
information loss to the test firms in private debt market, we expect the coefficient on the
interaction term positive.
Following prior studies (e.g., Graham, Li, and Qiu, 2008; Deng, Willis, and Xu, 2013),
we include the following firm-specific variables as control variables: firm size, market-to-book
ratio, Leverage, Profitability, Tangibility, cash flow volatility, and Z-Score. All variables are
defined in appendix A1. Larger firms usually have lower default risk and hence lower cost of
debt. Firms with more growth opportunities generally have lower default risk and are more likely
to have lower cost of debt. Firms with higher Leverage borrow more debt, resulting in higher
default risk and in turn a higher cost of debt. More profitable firms pay lower cost of debt as they
usually have lower default risk. Firms with more tangible assets pay lower cost of borrowing as
lenders may liquidate these assets when borrower defaults. Firms with higher cash flow volatility
have higher cost of debt because of the increased uncertainty for them to make timely debt
payments. Since higher Z-score implies lower insolvency risk, we expect an inverse relation
between Z-score and cost of borrowing.
We also control for loan-specific variables including loan size and maturity, etc. We
expect loan size to be negatively related to the cost of debt due to the economies of scale effect.
16
We expect maturity to be positively related to cost of debt. We include performance pricing, loan
type (e.g., term loan, revolving loan) and loan purpose (e.g., debt repayment, working capital
needs) dummies in the model. In addition, we include credit spread and term spread to control
for macroeconomic conditions.
3.3. Financial reporting opacity
Following Bharath et al. (2008), we construct our measure of financial reporting opacity
as the first principal component from three standard absolute abnormal operating accrual
measures that have been widely used in accounting literature (UAA1, UAA2, and UAA3). The
first measure is based on Dechow and Dichev (2002). We first define total current accrual TCA
as follow:
TCAit = − (∆ARit + ∆INVit + ∆APit + ∆TAXit + ∆OCAit) (2)
where ∆AR is the decrease (increase) in accounts receivable, ∆INV is the decrease (increase) in
inventory, ∆AP is the increase (decrease) in accounts payable, ∆TAX is the increase (decrease) in
taxes payable, and ∆OCA is the net change in other current assets.
We then estimate the following model based on Dechow and Dichev (2002) for each year
for each of the Fama and French (1997) industry groups:
where TCA is defined as above, CFO is the operating cash flows from continuing operations
from the statement of cash flows, and ATA is the average total assets. We obtain the coefficient
estimate from the above regression to compute the fitted value for the normal current accruals
and define the first accrual measure UAA1 as the absolute value of the residual from the
above regression.
17
For the second accrual measure UAA2, we estimate the following regression based on the
industry-year groups following Teoh et al. (1998).
where A is total assets, and ∆REV is the change in revenues from year t-1 to year t. We then use
the coefficient estimates from equation (4) to compute the normal current accruals (NCA) as:
where ∆AR is the change in accounting receivable between year t-1 and t for firm i. We then
compute our second accrual measure UAA2 as the absolute value of the difference between
TCAit/Ai,t-1 and NCAit.
Our third accrual measure UAA3 is based on the Jones model (Jones 1991) as modified
by Dechow et al. (1995). We first run the following regression for each of the industry-year
groups as:
where TA, total accrual, is defined as the difference between earnings before extraordinary items
and discontinued operations and the operating cash flows, and PPE is the gross value of property,
plant, and equipment. We then use the coefficient estimates from equation (6) to compute the
firm-specific normal accruals (NA) as follow:
Our third accrual measure UAA3 is the absolute value of the difference between total
accruals (TAit/Ai,t-1) and the fitted normal accruals NAit. We construct financial reporting opacity
as an indicator variable that equals one if the first principal component of three accrual measures
18
UAA1, UAA2, and UAA3 as discussed above is greater than the sample median and zero
otherwise.
3.4. Proprietary information
Following Franco et al. (2012), Ellis, Fee, and Thomas (2011), and Jones (2007), we use
two proxies for proprietary information. The first one is R&D expenditures. We construct a R&D
dummy which equals one if the research and development (R&D) expenditures of firm scaled by
lagged total assets are greater than the sample median, and zero otherwise. The second proxy for
proprietary information we employ is intangibility. We construct an intangibility dummy which
equals one if the one minus the sum of current assets and property, plant, and equipment scaled
by total assets are greater than the sample median, and zero otherwise. In firms with more
proprietary information, the need for banks to collect soft information is greater. In contrast,
lenders rely more on hard information including 20-F reconciliation in firms with less
proprietary information. We argue that there is a greater information loss associated with the
elimination of 20-F reconciliation in firms with less proprietary information. Therefore, we
expect firms with less proprietary information experience greater increase in interest spread
following the elimination rule.
IV. Empirical Results
4.1 Univariate analysis
We present univariate comparison of the major control variables included in our
empirical model for both IFRS and non-IFRS firms in Table 1. Panels A and B contain firm-
level and loan level characteristics, respectively. Compared to non-IFRS firms, IFRS firms are
significantly larger in firm size, have fewer tangible assets, and are less likely to experience
financial distress. Compared to loans issued by non-IFRS firms, loans issued by IFRS firms are
19
significantly larger in loan size, have lower loan spread and longer maturity. Panel C presents the
univariate comparison of loan terms before and after the elimination of 20-F reconciliation rule.
Firms obtain loans with significantly shorter maturity, pay significantly higher loan spread after
the elimination of 20-F reconciliation. This provides support to our hypothesis that cost of bank
loans increases after the elimination of 20-F reconciliation.
Table 2 presents the Pearson correlation matrix among the major variables. Logspread is
negatively and significantly correlated with firm size, MB, Profitability, Zscore, LogLoanSize,
and Cfvolatility, and positively and significantly correlated with Leverage and loan Maturity,
while insignificantly correlated with Tangibility.
Insert Table 1 and Table 2 Here
4.2 Multivariate regression results
4.2.1 Baseline results
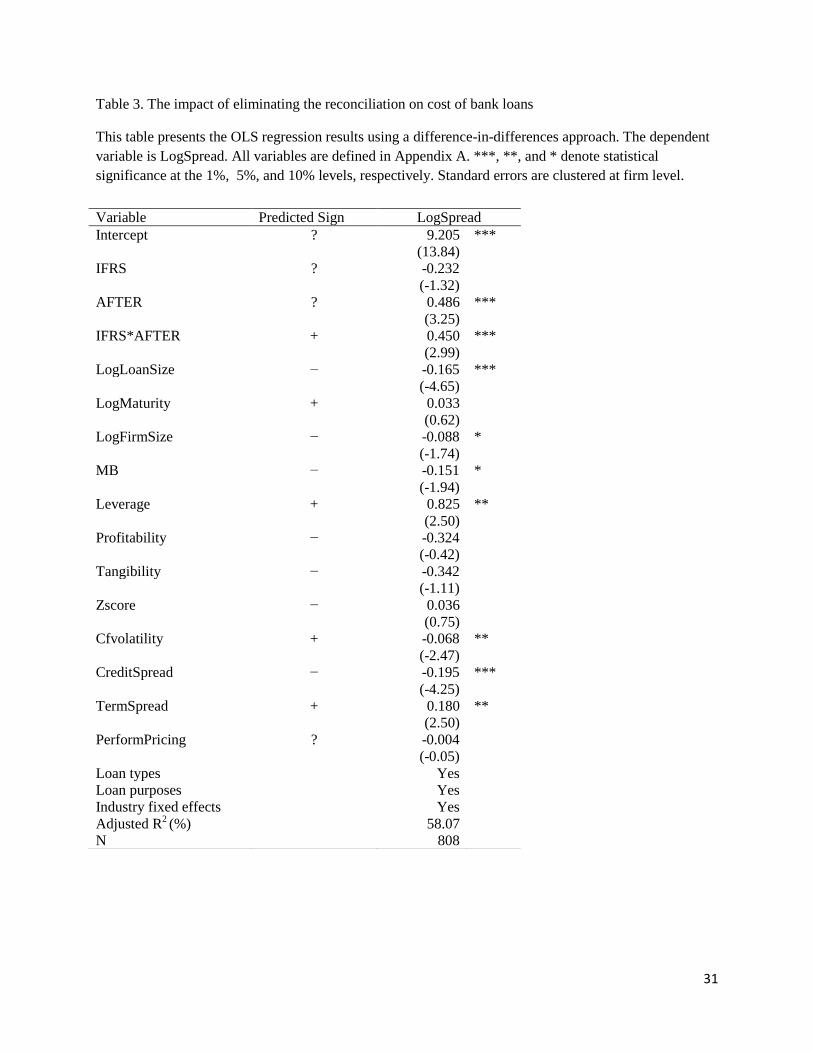
We report the regression result of the effect of eliminating the reconciliation on cost of
bank debt in Table 3. We cluster standard errors at firm level and include industry fixed effects.
The coefficient on IFRS is negative yet insignificant. The coefficient on After is positive and
significant (coefficient=0.486 , p-value<0.01), suggesting firms pay a 48.6% increase in loan
spreads after the elimination rule. The result is economically significant. The mean loan spread
of the sample firms is 107.148 basis points before the elimination rule. Therefore a 48.6%
increase implies, ceteris paribus, that the loan spread increases by approximately 52.074 basis
points after the elimination rule. Given the average loan issue size is $1338.156 million for the
sample firms after the elimination rule, the post- elimination increase of 52.074 basis points in
the loan spread implies an average increase of $6.968 million ($1338.156million × 0.0052074)
per loan in annual interest payments after elimination.
20
The variable of interest, IFRS*AFTER has a positive and significant coefficient
(coefficient=0.45, p-value<0.01). The result indicates that IFRS firms pay 45% higher loan
spread after the elimination of 20-F reconciliation, compared to non-IFRS firms. The result lends
support to hypothesis H1, and is consistent with our conjecture that there is a significant
information loss to private lenders after the elimination of 20-F reconciliation, and in turn banks
charge higher loan spread. The result is also economically significant. The mean loan spread of
the sample IFRS firms is 148.725 basis points before the elimination rule. Therefore a 45%
increase implies, ceteris paribus, that the loan spread increases by approximately 66.926 basis
points after the elimination rule. Given the average loan issue size is $2085.725 million for the
sample IFRS firms, the post- elimination increase of 66.926 basis points in the loan spread
implies an average increase of $13.959 million ($2085.725 million × 0.0066926) per loan in
annual interest payments after elimination.
The result contrasts with Kim et al. (2012) which documents insignificant economic
consequence in equity market, suggesting banks are special and different from public
shareholders in pricing the information risk associated with the elimination rule. Loan size, firm
size, cash flow volatility, and growth opportunity all have a negative and significant impact on
cost of bank debt, while Leverage has a positive and significant effect on cost of bank loans,
suggesting that larger firms with lower Leverage ratio and high growth opportunity, and firms
that borrow larger loans, pay lower interest rate on bank loans. The coefficient on credit spread is
negative and significant, which is consistent with our expectation that credit rating is inversely
related to loan spread. The coefficient on term spread is positive and significant, which is
consistent with our expectation that maturity is positively related to loan spread.
Insert Table 3 Here
21
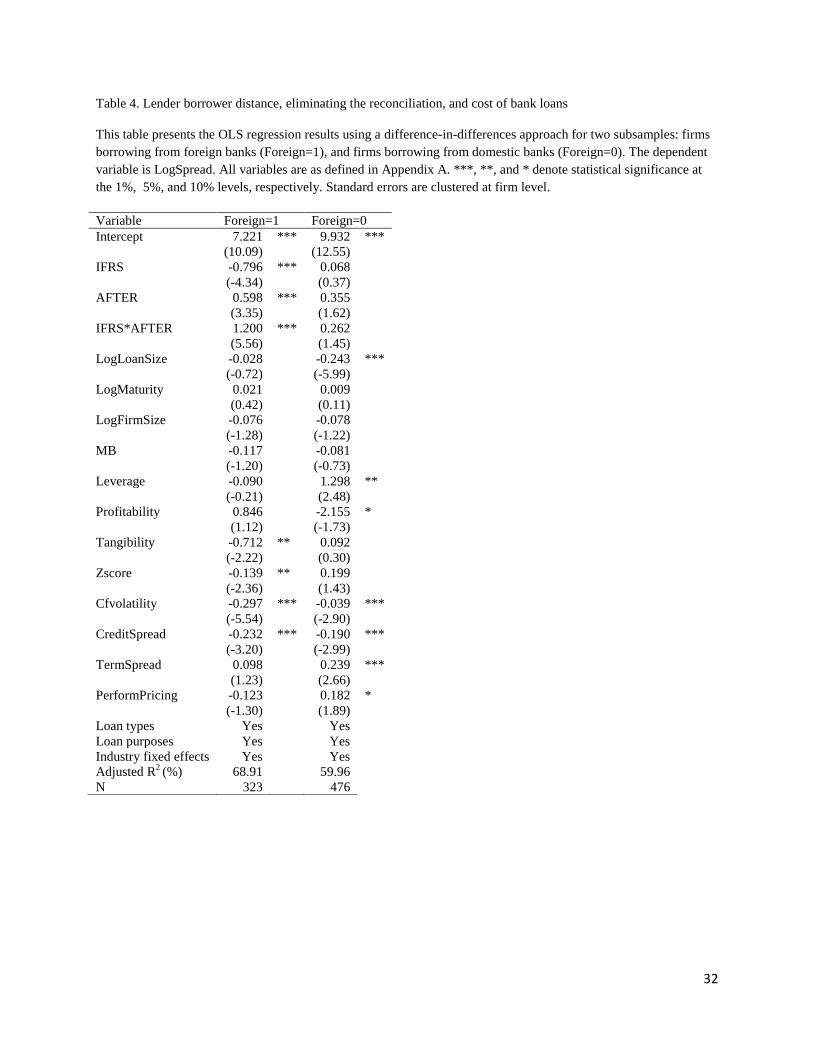
4.2.2 Lender-borrower distance
When partitioning the sample into two groups: firms borrowing from foreign banks, and
firms borrowing from domestic banks. We find that firms borrowing from foreign banks in
general pay a significantly lower loan spread before the elimination rule, and pay a higher loan
spread after the elimination rule. More interestingly, IFRS firms borrowing from foreign banks
pay a significantly higher loan spread after the elimination rule (p-value < 0.01), while we do not
find such evidence for IFRS firms borrowing from a domestic bank. The result is consistent with
hypothesis H2 in that foreign lenders which are more geographically distant from the borrowers,
rely more on hard information including the supplemental information provided by 20-F
reconciliation, charge a higher loan spread after the elimination rule to compensate for the
greater information loss. We also find both the magnitude and statistical significance of the
interaction term between IFRS and After are greater for IFRS firms borrowing from foreign
banks, compared to IFRS firms in the pooled sample. This evidence is consistent with the notion
that geographic distance matters in information collection and in turn in loan pricing.
Insert Table 4 Here
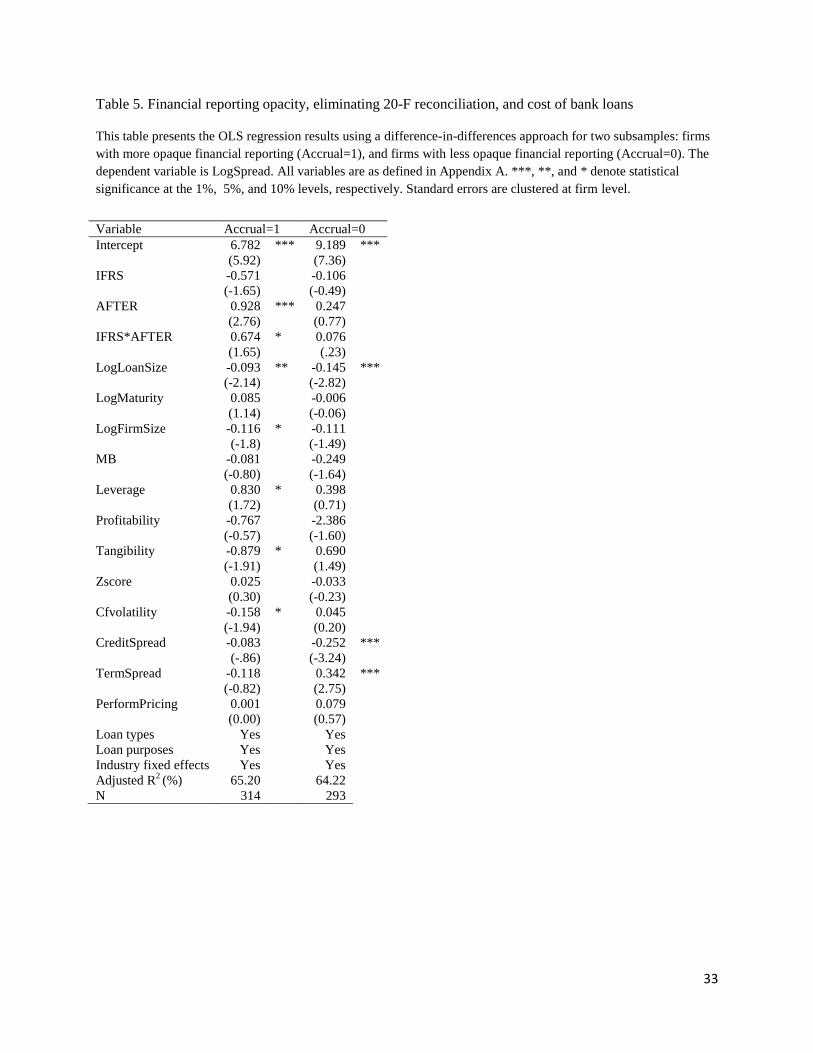
4.3 Financial reporting opacity
Partitioning results based on financial reporting opacity is reported in Table 4. We find
firms with more financial reporting opacity pay a higher loan spread after the elimination rule (p
value <0.10), while firms with lower financial reporting opacity do not pay a higher loan spread.
The result is consistent with hypothesis H3. The demand for private information and other
supplemental information that may help interpret financial statements is greater in firms with
more opaque financial reporting. Therefore we expect 20-F reconciliation provides more useful
22
information in opaque reporting firms and its elimination results in greater information loss and
hence a higher cost of bank debt.
Insert Table 5 Here
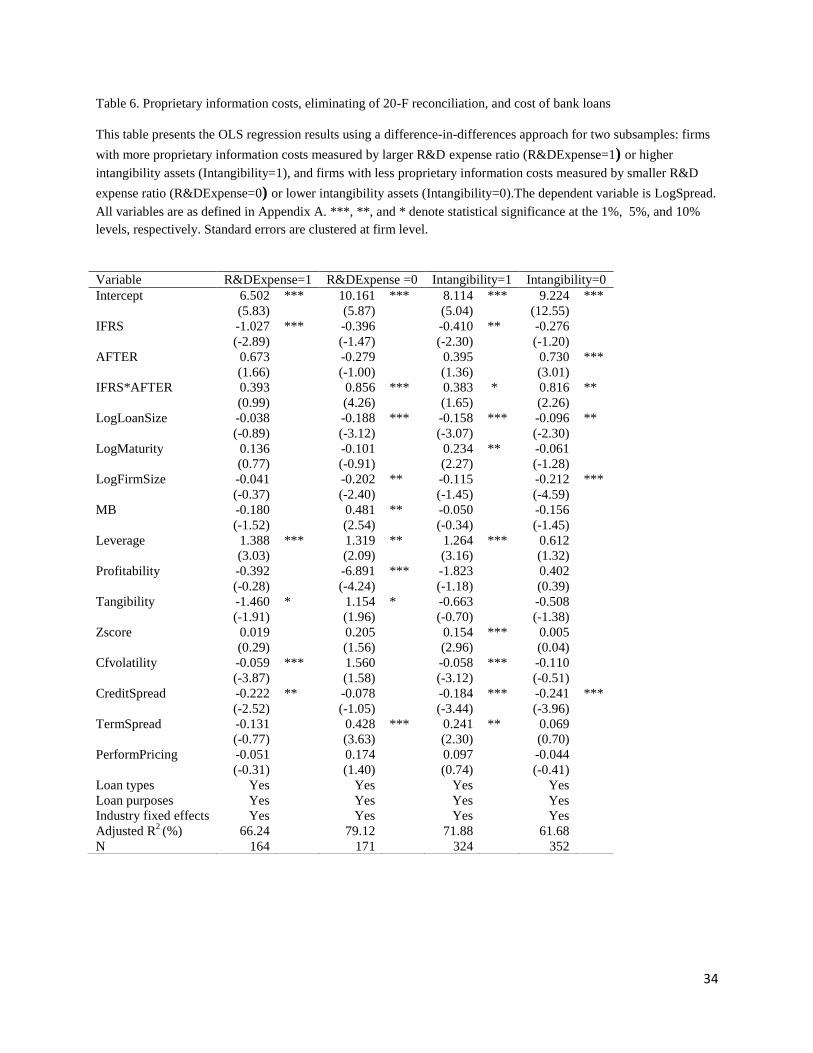
4.4 Proprietary information
Partitioning results based on proprietary information are reported in Table 5. We find
firms with lower proprietary information proxied by either R&D expenses (Column 1 and 2) or
Intangibility (Column 3 and 4) pay a higher loan spread after the elimination rule. The result
supports our hypothesis H4 in that in firms with less proprietary information banks rely more on
hard information such as 20-F reconciliation, and the elimination of 20-F results in more
information loss, and in turn lenders charge a higher loan spread.
Insert Table 6 Here
4.5 Robustness check
4.5.1 Alternative control sample
We include firms that use US GAAP or home country GAAP in the control sample.
There are likely systematic differences between the firms that use US GAAP from those that use
local GAAP. To address this concern, we separate these two groups of control firms and re-
estimate the models. Results are reported in Column 1 and 2 of Table 6. The results indicate that
our main results still hold, that IFRS firms experience higher cost of bank loans after the
elimination rule compared to US GAAP control firms (p-value <0.01), or home country GAAP
control firms (p-value < 0.01).
4.5.2 Constant pre- and post-elimination period

23
We also eliminate 2011 and 2012 data so that the post-elimination period is about three
years, similar to the pre-elimination period. Results are reported in Column 3 of Table 6. The
results show that our main results are robust, that IFRS firms experience higher cost of bank
loans after the elimination rule compared to non-IFRS control firms (p-value <0.05).
4.5.3 Influence of extreme values
Given the relatively small sample size, particularly for IFRS firms, we examine whether
our inferences are affected by extreme values by winsorizing all continuous variables at 1% and
99% and re-estimate the cost of bank loans model (1). Results are presented in Column 4 of
Table 7. We obtain qualitatively similar results, suggesting that our results are not driven by
extreme values.
4.5.4 Financial crisis effect
Since our sample period partially overlaps with the 2007-2009 financial crisis, we
investigate whether our results are driven by financial crisis effect by including a financial crisis
dummy in model (1). We define Crisis dummy equal one if the sample period falls between the
3rd
quarter of 2007 and the 2nd
quarter of 2009, and zero otherwise. Results are reported in
Column 5 of Table 7. The coefficient on Crisis is negative yet insignificant, while the coefficient
on IFRS*AFTER is still positive and significant, suggesting that our inferences are not affected
by financial crisis effect.
Insert Table 7 Here
V. Conclusion
24
In this study we examine how the elimination of 20-F reconciliation affects cost of bank
debt of foreign IFRS firms. Empirical evidence indicates that cost of bank debt increases after
the elimination rule for foreign IFRS firms. We also document that loan spread is higher for
firms borrowing from distant lenders (i.e., foreign banks), consistent with distant banks rely
more on hard information to make loan pricing decision. Furthermore we find that firms with
more opaque financial reporting pay higher loan spread after the elimination rule, consistent with
the demand for supplemental information is higher in such firms, and there is a more pronounced
information loss associated with the elimination rule in such firms. Lastly we find that firms with
less proprietary information costs pay higher loan spread after the elimination of 20-F
reconciliation, consistent with the conjecture that banks rely more on hard information (i.e., 20-F
reconciliation) when making loans to firms with less proprietary information costs. The
elimination of 20-F results in greater information loss and in turn banks charge a higher loan
spread.
The findings of this study are potentially important for several reasons: First, our study
sheds some light on private debt market consequences of SEC’s decision to eliminate the 20-F
reconciliation requirement for foreign private issuers. Our results suggest that the elimination
rule has a significant economic consequence in the private debt market, in that lenders charge
higher loan spread to compensate for the information loss. Second, our study complements prior
studies on the relationship between the elimination of 20-F reconciliation and the economic
consequences in equity market (e.g., Kim et al., 2012; Jiang et al., 2010). Third, our study
complements to existing studies on why banks are special. Fourth, our study relates to extant
studies on how geography affects important financial outcomes and how geographic proximity is
related to information advantage of being local. Using the elimination of 20-F reconciliation as a
25
unique setting, our study complements this stream of research by documenting that distant
lenders lose information advantage and charge a higher loan spread to foreign IFRS firms after
the elimination rule. Finally, our findings contribute to the ongoing debate whether the SEC was
judicious in eliminating the 20-F reconciliation requirement.
References
Agarwal, Sumit, and Robert Hauswald, 2010. Distance and private information in lending.
Review of Financial Studies 23 (7): 2757-2788.
Almazan, Andres, 2002. A model of competition in banking: bank capital vs. expertise. Journal
of Financial Intermediation 11, 87-121.
Altman, E., 1968. Financial Ratios, Discriminant Analysis and the Prediction of Corporate
Bankruptcy. The Journal of Finance 23, 589609.
Ayers, Benjamin c., Santhosh Ramalingegowda, and P. Eric Yeung, 2011. Hometown advantage:
the effects of monitoring institution location on financial reporting discretion. Journal of
Accounting and Economics 52, 41-61.
Berger, Allen N., Nathan H. Miller, Mitchell A. Petersen, Raghuram G. Rajan, and Jeremy
C. Stein, 2005. Does function follow organizational form? Evidence from the lending
practices of large and small banks. Journal of Financial Economics 76, 237–69.
Bharath, S., Sunder, J., Sunder, S., 2008. Accounting quality and debt contracting. Accounting
Review 23, 1–28.
Butler, Alexander, 2008. Distance still matters: evidence from municipal bond underwriting.
Review of Financial Studies 21, 763-784.
Chava, S., and M. Roberts, 2008. How Does Financing Impact Investment? The Role of Debt
Covenants. The Journal of Finance 63, 20852121.
Chen, Joseph, Harrison Hong, Ming Huang, and Jeffrey D. Kubik, 2004, Does fund size erode
mutual fund performance? American Economic Review 94, 1276-1302.
Chen, L. H., Sami, H., 2008. Trading volume reaction to the earnings reconciliation from IAS to U.S.
GAAP. Contemporary Accounting Research 25 (1), 1553.
Chen, L, H., Sami, H., 2013. The impact of firm characteristics on trading volume reaction to the earnings
reconciliation from IFRS to U.S. GAAP. Contemporary Accounting Research 30 (2), 697-718.
26
Cheng, Lin, Scott Liao, and Haiwen Zhang, 2013. The commitment effect versus information
effect of disclosure─Evidence from smaller reporting companies. The Accounting Review
88(4): 1239-1263.
Coval, Joshua D., and Tobias J. Moskowitz, 1999, Home bias at home: Local equity preference
in domestic portfolios. Journal of Finance 104, 2045-2073.
Coval, Joshua D., and Tobias J. Moskowitz, 2001, The geography of investment: Informed
trading and asset prices. Journal of Political Economy 109, 811-841.
Dechow, P. M., R. Sloan, and A. Sweeney. 1995. Detecting earnings management. The
Accounting Review 70 (2), 193–225.
Dechow, P. M., and I. Dichev. 2002. The quality of accruals and earnings: The role of accrual
estimation errors, The Accounting Review 77, 35–59.
Deng, S., R. Willis, and L. Xu, 2013. Shareholder Litigation, Reputational Loss, and Bank Loan
Contracting. Journal of Financial and Quantitative Analysis, forthcoming.
Diamond, D. 1984. Financial Intermediation and Delegated Monitoring. Review of Economic
Studies 51: 393-414.
Ellis, J., C. E. Fee, AND S. E. Thomas. 2010. Proprietary costs and the disclosure of information
about customers. University of Pittsburgh, Working Paper.
Fama, Eugene, 1985. What’s different about banks? Journal of Monetary Economics 15 (1), 29-
39.
Focarelli, D., Casolaro, L., Pozzolo, A.F., 2008. The pricing effect of certification on
syndicated loans. Journal of Monetary Economics 55, 335-349.
Francis, Bill, Iftekhar Hasan, and Maya Waisman, 2007, Does geography matter to
bondholders?, Federal Reserve Bank of Atlanta Working Papers Series (Federal Reserve
Bank of Atlanta, Atlanta, GA).
Franco, Gus De, Alexander Edwards, and Scott Liao, 2012. Banks’ Competitor-Specific
Knowledge in Loan Markets. Working paper, University of Toronto.
Gande, A. and A. Saunders. 2012. Are banks still special when there is a secondary market for
loans? Journal of Finance 67 (5): 1649-1684.
Gordon, E. A., Jorgensen, B. N., Linthicum, C. L., 2008. Could IFRS replace US GAAP? A comparison
of earnings attributes and informativeness in the US market. Working paper, Temple University,
Columbia University, and University of Texas – San Antonio.
27
Graham, J., and S. Li, and J. Qiu. “Corporate Misreporting and Bank Loan Contracting.” Journal
of Financial Economics, 89 (2008), 4461.
Harris, M.S., Muller, K. A., 1999. The market valuation of IAS versus US-GAAP accounting measures
using Form 20-F reconciliations. Journal of Accounting and Economics 26 (1-3), 285-312.
Hauswald, Robert, and Robert Marquez, 2006. Competition and strategic information acquisition
in credit markets. Review of Financial Studies 19 (3), 967-1000.
Henry, E., Lin, S., Yang, Y., 2009. The European-U.S. “GAAP Gap”: IFRS to U.S. GAAP Form 20-F
reconciliations. Accounting Horizons 23 (2), 121150.
Hollander, Stephan, and Arnt Verriest, 2011. Location and Debt Contracts. Working paper,
Tilburg University.
Hopkins, P. E., Botosan, C. A., Bradshaw, M. T., Callahan, C. M., Ciesielski, J., Farber, D. B., Hodder,
L. D., Kohlbeck, M. J., Laux, R., Stober, T. L., Stocken, P. C., Yohn, T. L., 2008. Response to the
SEC release, “Acceptance from foreign private issuers of financial statements prepared in accordance
with international financial reporting standards without reconciliation to U.S. GAAP File No. S7–13–
07.” Accounting Horizons 22 (2), 223–40.
Jamal, K., Benston, G. J., Carmichael, D. R., Christensen, T. E., Colson, R. H., Moehrle, S. R.,
Rajgopal, S., Stober, T. L., Sunder, S., Watts, R. L., 2008. A perspective on the SEC’s
proposal to accept financial statements prepared in accordance with international financial
reporting standards (IFRS) without reconciliation to U.S. GAAP. Accounting Horizons 22
(2), 241–48.
James, C., 1987. Some evidence on the uniqueness of bank loans. Journal of Financial
Economics 19, 217–36.
Jiang, J. X., Petroni, K. R., Wang, I. Y., 2010. Did eliminating the 20-F reconciliation between IFRS and
US GAAP matter? Working Paper, Michigan State University.
Jones, J., 1991. Earnings management during import relief investigations. Journal of Accounting
Research 29, 193–228.
Jones, D. A. 2007. Voluntary disclosure in R&D-intensive industries. Contemporary Accounting
Research 24, 489–522.
Kim, J., B. Song, and L. Zhang. “Internal Control Weakness and Bank Loan Contracting:
Evidence from SOX Section 404 Disclosures.” The Accounting Review, 86 (2011), 1157–
1188.
28
Kim, Y., Li, H., Li, S., 2012. Does eliminating the Form 20-F reconciliation from IFRS to U.S. GAAP
have capital market consequences? Journal of Accounting and Economics 53 (1-2), 249−270.
Lummer and McConnell, 1989. Further evidence on the bank lending process and the capital-
market response to bank loan agreements. Journal of Financial Economics 25 (1), 99-122.
Mian, A., 2006. Distance constraints: the limits of foreign lending in poor economies. Journal of
Finance 61(3): 1465-1505.
Petersen, M., 2004. Information: Hard and Soft. Working Paper, Northwestern University.
Petersen, M., and R. Rajan, 2002. Does distance still matter? The information revolution in small
business lending. Journal of Finance 57, 2533-2570.
Rajan, R.G., 1992. Insiders and outsiders: the choice between informed and arm’s-length debt.
Journal of Finance 47 (4): 1367-1400.
Securities and Exchange Commission (SEC), 2007. Final Rule: Acceptance from Foreign Private
Issuers of Financial Statements Prepared in Accordance with International Financial
Reporting Standards without Reconciliation to U.S. GAAP. Washington, D.C.: SEC,
December 21.
Securities and Exchange Commission (SEC), 2008. Final Rule: Foreign issuer reporting
enhancements. Washington, D. C.: SEC, September 23.
Spiro, A. 2007. The architecture of information distribution in the loan market. In A. Taylor and A.
Sansone’s, The Handbook of Loan Syndications & Trading (186-207). New York: McGraw-Hill.
Sufi, A., 2009. Bank Lines of Credit in Corporate Finance: An Empirical Analysis. Review of
Financial Studies 22(3): 1057-1088.
Sussman, O., and J. Zeira, 1995. Banking and development. CEPR, London.
Teoh, S. H., I. Welch, and T. J. Wong. 1998. Earnings management and the underperformance of
seasoned equity offerings. Journal of Financial Economics 50: 63–99.
Watts, R. L., 2003. Conservatism in accounting Part I: Explanations and implications.
Accounting Horizons 17 (3), 207−221.
Yu, Julia, 2011. The Interaction of Voluntary and Mandatory Disclosures: Evidence from the
SEC’s Elimination of the IFRS-U.S. GAAP Reconciliation. Working Paper, University of
Georgia.
29
Table 1. Univariate comparisons
This table reports the univariate comparisons of major firm- and loan-specific variables for IFRS and non-IFRS
firms, and before and after the elimination rule. All variables are defined in Appendix A.
Panel A. Univariate comparison of firm-specific characteristics for IFRS and non-IFRS firms
IFRS Firms(N=56) Non-IFRS Firms(N=123) Test of Difference
Variable Mean Median Mean Median
Mean
(T-Stat)
Median
(Z-Value)
LogFirmSize 9.820 9.959 7.968 7.832 7.24*** 6.44***
MB 1.508 1.334 1.580 1.399 -0.75 0.18
Leverage 0.302 0.293 0.315 0.274 -0.58 -0.09
Profitability 0.129 0.118 0.132 0.127 -0.33 -0.14
Tangibility 0.294 0.292 0.507 0.537 -6.01*** -4.59***
Zscore 1.239 1.157 0.872 0.905 2.39*** 2.20**
Cfvolatility 0.216 0.129 0.550 0.119 -1.26 -0.33
Panel B. Univariate comparison of loan-specific characteristics issued by IFRS and non-IFRS firms
IFRS Firms(N=292) Non-IFRS Firms(N=516) Test of Difference
Variable Mean Median Mean Median
Mean
(T-Stat)
Median
(Z-Value)
Logspread 4.435 4.284 4.765 4.828 -4.37*** -3.99***
Allindrawn 148.725 72.5 162.93 125 -1.34*** -3.99***
FacilityAmt ($million) 2085.725 1115.960 814.392 277.500 6.37*** 10.71***
LogLoanSize 20.612 20.833 19.392 19.441 11.03*** 10.71***
Maturity (months) 62.115 60.833 56.899 60.867 2.19** 1.03
LogMaturity 3.964 4.108 3.859 4.109 2.14** 1.03
Panel C. Univariate comparison of loan-specific characteristics before and after the elimination rule
Before elimination (N=434) After elimination (N=374) Test of Difference
Mean Median
Variable Mean Median Mean Median (T-Stat) (Z-Value)
AllInDrawn 107.148 72.500 216.572 187.500 11.27*** 12.14***
Logspread 4.263 4.284 5.090 5.234 13.40*** 12.14***
FacilityAmt ($million) 1218.404 411.525 1338.156 500 0.66 2.40**
LogLoanSize 19.692 19.835 19.996 20.030 2.67*** 2.40**
Maturity 62.746 60.867 54.186 59.650 -3.75*** -4.48***
LogMaturity 3.948 4.109 3.838 4.088 -2.34** -4.48***
30
Table 2. Pearson correlation matrix
This table reports the Pearson correlation matrix for major variables. All variables are defined in Appendix A. Correlations significant at the 1%–10% level are
highlighted in bold.
Logspread LogLoanSize LogMaturity LogFirmSize MB Leverage Profitability Tangibility Zscore Cfvolatility
LogLoanSize -0.365 1
LogMaturity 0.087 -0.137 1
LogFirmSize -0.296 0.638 -0.043 1
MB -0.126 -0.057 -0.067 -0.149 1
Leverage 0.186 -0.160 0.101 -0.171 -0.134 1
Profitability -0.075 0.049 0.082 0.126 0.457 -0.029 1
Tangibility -0.016 -0.141 0.024 -0.172 -0.126 0.171 0.026 1
Zscore -0.087 0.058 -0.101 0.157 0.322 -0.236 0.443 -0.055 1
Cfvolatility -0.075 -0.068 0.025 -0.149 0.153 -0.218 -0.053 -0.101 -0.255 1
31
Table 3. The impact of eliminating the reconciliation on cost of bank loans
This table presents the OLS regression results using a difference-in-differences approach. The dependent
variable is LogSpread. All variables are defined in Appendix A. ***, **, and * denote statistical
significance at the 1%, 5%, and 10% levels, respectively. Standard errors are clustered at firm level.
Variable Predicted Sign LogSpread
Intercept ? 9.205 ***
(13.84)
IFRS ? -0.232
(-1.32)
AFTER ? 0.486 ***
(3.25)
IFRS*AFTER + 0.450 ***
(2.99)
LogLoanSize − -0.165 ***
(-4.65)
LogMaturity + 0.033
(0.62)
LogFirmSize − -0.088 *
(-1.74)
MB − -0.151 *
(-1.94)
Leverage + 0.825 **
(2.50)
Profitability − -0.324
(-0.42)
Tangibility − -0.342
(-1.11)
Zscore − 0.036
(0.75)
Cfvolatility + -0.068 **
(-2.47)
CreditSpread − -0.195 ***
(-4.25)
TermSpread + 0.180 **
(2.50)
PerformPricing ? -0.004
(-0.05)
Loan types Yes
Loan purposes Yes
Industry fixed effects Yes
Adjusted R2 (%) 58.07
N 808
32
Table 4. Lender borrower distance, eliminating the reconciliation, and cost of bank loans
This table presents the OLS regression results using a difference-in-differences approach for two subsamples: firms
borrowing from foreign banks (Foreign=1), and firms borrowing from domestic banks (Foreign=0). The dependent
variable is LogSpread. All variables are as defined in Appendix A. ***, **, and * denote statistical significance at
the 1%, 5%, and 10% levels, respectively. Standard errors are clustered at firm level.
Variable Foreign=1 Foreign=0
Intercept 7.221 *** 9.932 ***
(10.09) (12.55)
IFRS -0.796 *** 0.068
(-4.34) (0.37)
AFTER 0.598 *** 0.355
(3.35) (1.62)
IFRS*AFTER 1.200 *** 0.262
(5.56) (1.45)
LogLoanSize -0.028 -0.243 ***
(-0.72) (-5.99)
LogMaturity 0.021 0.009
(0.42) (0.11)
LogFirmSize -0.076 -0.078
(-1.28) (-1.22)
MB -0.117 -0.081
(-1.20) (-0.73)
Leverage -0.090 1.298 **
(-0.21) (2.48)
Profitability 0.846 -2.155 *
(1.12) (-1.73)
Tangibility -0.712 ** 0.092
(-2.22) (0.30)
Zscore -0.139 ** 0.199
(-2.36) (1.43)
Cfvolatility -0.297 *** -0.039 ***
(-5.54) (-2.90)
CreditSpread -0.232 *** -0.190 ***
(-3.20) (-2.99)
TermSpread 0.098 0.239 ***
(1.23) (2.66)
PerformPricing -0.123 0.182 *
(-1.30) (1.89)
Loan types Yes Yes
Loan purposes Yes Yes
Industry fixed effects Yes Yes
Adjusted R2 (%) 68.91 59.96
N 323 476
33
Table 5. Financial reporting opacity, eliminating 20-F reconciliation, and cost of bank loans
This table presents the OLS regression results using a difference-in-differences approach for two subsamples: firms
with more opaque financial reporting (Accrual=1), and firms with less opaque financial reporting (Accrual=0). The
dependent variable is LogSpread. All variables are as defined in Appendix A. ***, **, and * denote statistical
significance at the 1%, 5%, and 10% levels, respectively. Standard errors are clustered at firm level.
Variable Accrual=1 Accrual=0
Intercept 6.782 *** 9.189 ***
(5.92) (7.36)
IFRS -0.571 -0.106
(-1.65) (-0.49)
AFTER 0.928 *** 0.247
(2.76) (0.77)
IFRS*AFTER 0.674 * 0.076
(1.65) (.23)
LogLoanSize -0.093 ** -0.145 ***
(-2.14) (-2.82)
LogMaturity 0.085 -0.006
(1.14) (-0.06)
LogFirmSize -0.116 * -0.111
(-1.8) (-1.49)
MB -0.081 -0.249
(-0.80) (-1.64)
Leverage 0.830 * 0.398
(1.72) (0.71)
Profitability -0.767 -2.386
(-0.57) (-1.60)
Tangibility -0.879 * 0.690
(-1.91) (1.49)
Zscore 0.025 -0.033
(0.30) (-0.23)
Cfvolatility -0.158 * 0.045
(-1.94) (0.20)
CreditSpread -0.083 -0.252 ***
(-.86) (-3.24)
TermSpread -0.118 0.342 ***
(-0.82) (2.75)
PerformPricing 0.001 0.079
(0.00) (0.57)
Loan types Yes Yes
Loan purposes Yes Yes
Industry fixed effects Yes Yes
Adjusted R2 (%) 65.20 64.22
N 314 293
34
Table 6. Proprietary information costs, eliminating of 20-F reconciliation, and cost of bank loans
This table presents the OLS regression results using a difference-in-differences approach for two subsamples: firms
with more proprietary information costs measured by larger R&D expense ratio (R&DExpense=1) or higher
intangibility assets (Intangibility=1), and firms with less proprietary information costs measured by smaller R&D
expense ratio (R&DExpense=0) or lower intangibility assets (Intangibility=0).The dependent variable is LogSpread.
All variables are as defined in Appendix A. ***, **, and * denote statistical significance at the 1%, 5%, and 10%
levels, respectively. Standard errors are clustered at firm level.
Variable R&DExpense=1 R&DExpense =0 Intangibility=1 Intangibility=0
Intercept 6.502 *** 10.161 *** 8.114 *** 9.224 ***
(5.83) (5.87) (5.04) (12.55)
IFRS -1.027 *** -0.396 -0.410 ** -0.276
(-2.89) (-1.47) (-2.30) (-1.20)
AFTER 0.673 -0.279 0.395 0.730 ***
(1.66) (-1.00) (1.36) (3.01)
IFRS*AFTER 0.393 0.856 *** 0.383 * 0.816 **
(0.99) (4.26) (1.65) (2.26)
LogLoanSize -0.038 -0.188 *** -0.158 *** -0.096 **
(-0.89) (-3.12) (-3.07) (-2.30)
LogMaturity 0.136 -0.101 0.234 ** -0.061
(0.77) (-0.91) (2.27) (-1.28)
LogFirmSize -0.041 -0.202 ** -0.115 -0.212 ***
(-0.37) (-2.40) (-1.45) (-4.59)
MB -0.180 0.481 ** -0.050 -0.156
(-1.52) (2.54) (-0.34) (-1.45)
Leverage 1.388 *** 1.319 ** 1.264 *** 0.612
(3.03) (2.09) (3.16) (1.32)
Profitability -0.392 -6.891 *** -1.823 0.402
(-0.28) (-4.24) (-1.18) (0.39)
Tangibility -1.460 * 1.154 * -0.663 -0.508
(-1.91) (1.96) (-0.70) (-1.38)
Zscore 0.019 0.205 0.154 *** 0.005
(0.29) (1.56) (2.96) (0.04)
Cfvolatility -0.059 *** 1.560 -0.058 *** -0.110
(-3.87) (1.58) (-3.12) (-0.51)
CreditSpread -0.222 ** -0.078 -0.184 *** -0.241 ***
(-2.52) (-1.05) (-3.44) (-3.96)
TermSpread -0.131 0.428 *** 0.241 ** 0.069
(-0.77) (3.63) (2.30) (0.70)
PerformPricing -0.051 0.174 0.097 -0.044
(-0.31) (1.40) (0.74) (-0.41)
Loan types Yes Yes Yes Yes
Loan purposes Yes Yes Yes Yes
Industry fixed effects Yes Yes Yes Yes
Adjusted R2 (%) 66.24 79.12 71.88 61.68
N 164 171 324 352
35
Table 7. Robustness Check
This table presents the OLS regression results using a difference-in-differences approach to check the robustness of our main results. Column (1) uses U.S.
GAAP firms as the control firms; Column (2) uses home country GAAP firms as the control firms; Column (3) presents the results after deleting 2011 and 2012
observations; Column (4) presents the results after winsorizing all continuous variables at 1% and 99% level. Column (5) reports the results by accounting for
the recent 2007~2009 financial crisis effect. The dependent variable is LogSpread. Crisis is an indicator for the recent 2007~2009 financial crisis, which equals
one for 2007Q3 and 2009Q2, and zero otherwise. All variables are as defined in Appendix A. ***, **, and * denote statistical significance at the 1%, 5%, and
10% levels, respectively. Standard errors are clustered at firm level.
(1) (2) (3) (4) (5)
Variable US GAAP Home country GAAP Deleting 2011 and 2012 Excluding extreme values Crisis effect
Intercept 9.806 *** 9.428 *** 8.971 *** 10.515 *** 9.158 ***
(14.38) (13.14) (12.18) (17.73) (13.54)
IFRS -0.314 * 0.174 -0.253 -0.178 -0.234
(-1.76) (0.99) (-1.43) (-1.12) (-1.33)
AFTER 0.421 ** 0.435 ** 0.239 0.484 *** 0.419 ***
(2.14) (2.09) (1.21) (3.09) (2.90)
IFRS*AFTER 0.499 *** 0.558 *** 0.389 ** 0.409 *** 0.458 ***
(3.02) (3.07) (2.20) (2.70) (2.95)
LogLoanSize -0.195 *** -0.198 *** -0.158 *** -0.187 *** -0.166 ***
(-5.67) (-6.00) (-4.24) (-5.83) (-4.69)
LogMaturity 0.094 -0.010 0.048 0.045 0.038
(1.54) (-0.13) (0.76) (0.66) (0.72)
LogFirmSize -0.078 -0.178 *** -0.099 * -0.096 * -0.086 *
(-1.47) (-3.72) (-1.82) (-1.91) (-1.71)
MB -0.200 ** -0.042 -0.127 -0.224 ** -0.138 *
(-2.02) (-0.42) (-1.55) (-2.57) (-1.67)
Leverage 0.552 0.905 * 0.857 *** 0.007 0.818 **
(1.30) (1.80) (2.67) (0.01) (2.46)
Profitability 1.199 -1.118 -1.032 -0.016 -0.405
(1.37) (-1.04) (-1.14) (-0.02) (-0.52)
Tangibility -0.375 0.560 -0.331 -0.513 * -0.335
(-1.13) (1.49) (-1.04) (-1.81) (-1.09)
Zscore -0.088 0.022 0.081 ** -0.057 0.035
(-0.77) (0.26) (1.98) (-0.58) 0.71
Cfvolatility -0.040 *** -0.208 ** -0.064 *** -1.425 *** -0.07 **
(-3.47) (-2.28) (-2.87) (-3.52) (-2.47)
36
CreditSpread -0.247 *** -0.184 *** -0.121 ** -0.220 *** -0.149 **
(-4.74) (-3.35) (-2.27) (-4.42) (-1.98)
TermSpread 0.243 *** 0.196 ** 0.258 *** 0.208 *** 0.204 ***
(3.23) (1.99) (3.01) (2.96) (2.96)
PerformPricing 9.806 *** 9.428 *** 8.971 *** 0.014 -0.001
(14.38) (13.14) (12.18) (0.19) (-0.02)
Crisis -0.09
(-0.67)
Loan types Yes Yes Yes Yes Yes
Loan purposes Yes Yes Yes Yes Yes
Industry fixed effects Yes Yes Yes Yes Yes
Adjusted R2 (%) 65.75 63.60 59.28 60.73 58.13
N 579 521 676 701 808
37
Appendix A. Variable definitions
Variable Names Definitions
Firm Characteristics
Accrual Estimated from the modified Jones model for the fiscal year
(Dechow, Sloan, and Sweeney, 1995).
MB Market to book ratio, which equals Market value of equity plus
book value of liabilities and preferred stock) divided by Total
Assets.
Cfvolatility Standard deviation of quarterly cash flows from operations (Δ
quarterly OANCFY FQTR) over a five-year rolling window.
IFRS An indicator which equals one if a firm adopt IFRS accounting
standard, and zero otherwise.
Intangibility An indicator which equals one if one minus net property, plant and
equipment/total assets is above sample median, and zero otherwise.
Leverage (Long-term debt + debt in current liabilities)/total assets.
LogFirmSize Firm size measure, equals natural log of total assets.
Profitability EBITDA/total assets.
Tangibility Net property, plant and equipment/total assets.
R&DExpense An indicator which equals one if research and development (R&D)
expenditures scaled by lagged total assets is above sample median,
and zero otherwise.
Zscore Modified Altman (1968) Z-score = (1.2 × working capital+1.4 ×
retained earnings+3.3 × EBIT+0.999 × sales)/total assets.
Loan Characteristics
AFTER An indicator which equals one if a loan is issued in the 5 year period
after November 15, 2007, and zero if a loan is issued in the 3 year
period before November 15, 2007.
Foreign An indicator which equals one if a borrower’s headquarters are in the
same country as the country of syndication of a syndicated loan, and
zero otherwise.
LoanPurpose Indicator variables for loan purposes, including corporate purposes,
debt repayment, working capital, takeover.
38
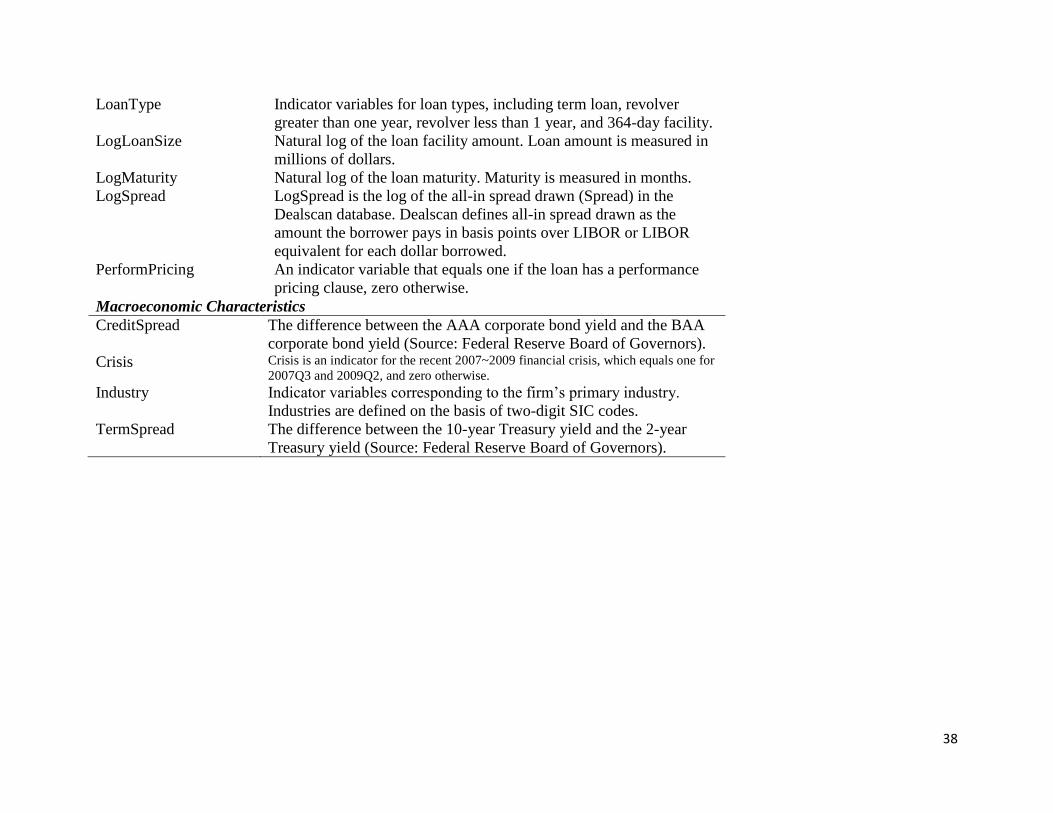
LoanType Indicator variables for loan types, including term loan, revolver
greater than one year, revolver less than 1 year, and 364-day facility.
LogLoanSize Natural log of the loan facility amount. Loan amount is measured in
millions of dollars.
LogMaturity Natural log of the loan maturity. Maturity is measured in months.
LogSpread LogSpread is the log of the all-in spread drawn (Spread) in the
Dealscan database. Dealscan defines all-in spread drawn as the
amount the borrower pays in basis points over LIBOR or LIBOR
equivalent for each dollar borrowed.
PerformPricing An indicator variable that equals one if the loan has a performance
pricing clause, zero otherwise.
Macroeconomic Characteristics
CreditSpread The difference between the AAA corporate bond yield and the BAA
corporate bond yield (Source: Federal Reserve Board of Governors).
Crisis Crisis is an indicator for the recent 2007~2009 financial crisis, which equals one for
2007Q3 and 2009Q2, and zero otherwise. Industry Indicator variables corresponding to the firm’s primary industry.
Industries are defined on the basis of two-digit SIC codes.
TermSpread The difference between the 10-year Treasury yield and the 2-year
Treasury yield (Source: Federal Reserve Board of Governors).