Embed Size (px)
Citation preview
Overbuilt?
The Seattle MD Apartment
Market Report
The question circulating around the
commercial real estate community as of late, has
been whether or not the Seattle-Bellevue-Everett
MD apartment market is becoming overbuilt. The
simple answer to this question is, it depends.
When looking at the Seattle-Bellevue-Everett
MD (King and Snohomish County) apartment
market as a whole, no, it is not being overbuilt,
but when the various submarkets are analyzed
individually, it is possible to conclude that some
areas may become overbuilt. (We will refer to
the Seattle-Bellevue-Everett MD as the Seattle
MD for the remainder of the newsletter.)
For instance, approximately 70% of all
units that are under construction in the Seattle
MD are located in the Seattle submarket. Even
within the Seattle submarket the units under
construction are relatively concentrated. In the
Seattle core there are 7 high-rise apartment
towers (approx. 4,000 units) under construction.
That represents nearly 35% of all apartment units
under construction in the Seattle MD. The other
areas with most of the construction activity are
Ballard and the University District. This implies
that the Eastside, Snohomish, and Southend
submarkets actually have a lack of supply in the
pipeline.
The Seattle MD had a total apartment
demand figure of 5,349 units for the year 2012.
This figure far outpaced the 2012 new supply
figure of 3,274 units. As a result, the vacancy
rate fell from 4.1% at year-end 2011 to 3.5% at
year-end 2012. Looking forward, we expect
demand to increase to nearly 7,000 units per
year, for the next two years. This is relatively
unprecedented demand growth and we expect
unprecedented supply as well. We estimate, over
the next two years, 14,540 new apartment units
will enter the Seattle MD apartment market. By
examining this alone, one may conclude that
supply and demand appear to be on track for
relative balance in the Seattle MD for the next
two years. This is true to some extent but
because of the discrepancy in the geographic distribution of
supply, each submarket is going to be affected differently.
(Please refer to our map of current projects under
construction on pg. 8 of the report)
As expected, in the second half of 2012 we saw a rise
in the vacancy rate in the Seattle submarket, rising from the
mid-year rate of 2.4% to the year-end rate of 3.0%. We
expect this trend to continue within the Seattle submarket
through 2014. The Eastside submarket is expected to see
vacancies rise to approximately 4.0% by early 2014 due to
some supply entering the market. These rates are expected to
decline to around 3.4% by the end of 2014. The Southend and
Snohomish submarkets are expected to experience a steady
decline in vacancy throughout our forecast because of the
lack of the supply.
~Brian O’Connor, MAI
Volume 11, Issue 1, February 2013
Sub % 2 Year 2 Year S/D 2 Yr. Vac.
Market Vacant Demand Supply Net Rate**
Seattle 3.0% 8,220 10,559 2,339 4.0%
Eastside 3.4% 2,141 2,159 18 3.4%
Southend 4.2% 1,658 457 (1,201) 2.9%
Snohomish 4.2% 1,796 1,366 (430) 3.7%
Seattle MD* 3.5% 13,815 14,540 725 3.6%
**2 Year Vacancy Rate is 1st Quarter 2015
* Weighted Average
Seattle Metro Market Summary
Year-End Mid-Year Year-End
Submarket 2011 2012 2012
Seattle 3.2% 2.4% 3.0%
Eastside 3.5% 2.8% 3.4%
Southend 5.9% 4.8% 4.2%
Snohomish 4.7% 4.7% 4.2%
Metro Total 4.1% 3.4% 3.5%
Seattle-Bellevue-Everett MD Vacancy History
Mid-Year Year-End Mid-Year
Submarket 2013 2013 2014
Seattle 2.8% 3.3% 3.9%
Eastside 3.2% 3.8% 3.6%
Southend 3.9% 3.4% 3.1%
Snohomish 3.9% 3.5% 3.4%
Metro Total 3.3% 3.5% 3.6%
Seattle-Bellevue-Everett Vacancy Forecast

Vacancy Forecast
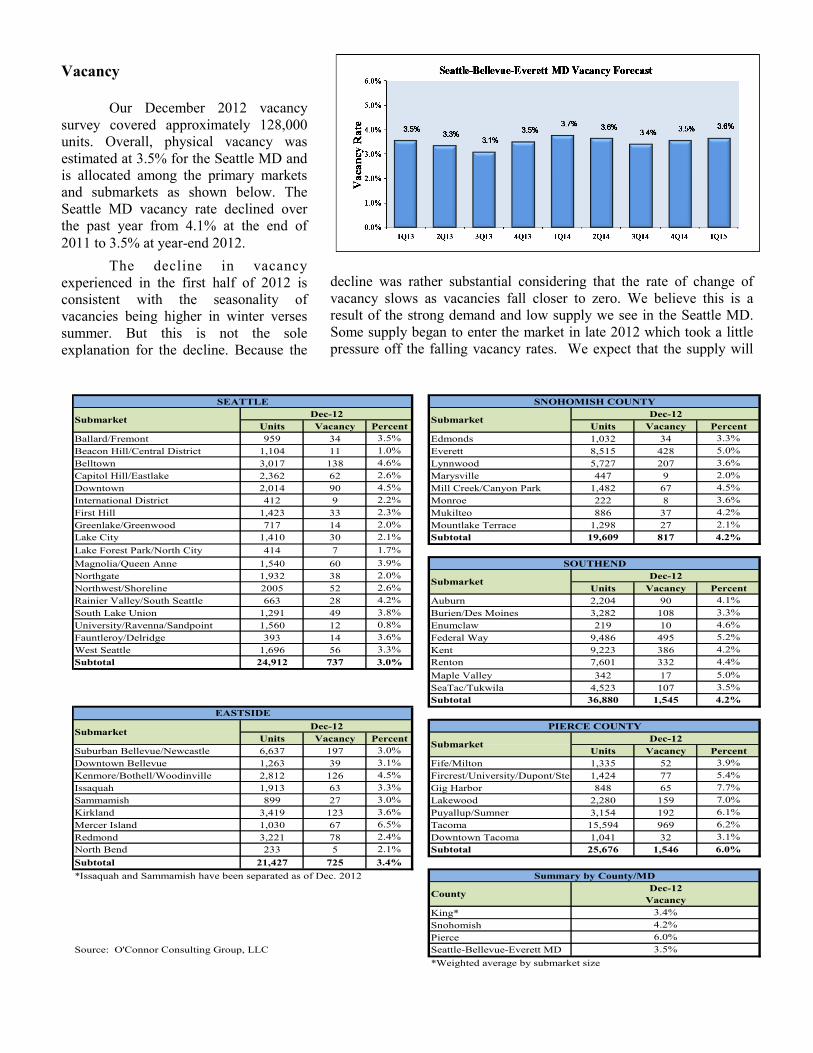
The graphs below illustrate our
vacancy forecast for each of the four
primary Puget Sound markets.
Please note that these graphs reflect
physical vacancy, not economic
vacancy. Economic vacancies are
typically one or two points above
physical vacancies. Currently, we
estimate that there has been a shift
because of the new supply, and there
is now upward pressure on vacancy
rates in the Seattle submarket. All
other submarkets remain having
downward pressure in the near term.
T a b l e o f C o n t e n t s
Vacancy Forecast………………..1
Vacancy Forecast Charts……….2
V a c a n c y ………………………… . . 3
A b s o r p t i o n ……………………… . 4
Employ ment Fo reca st…………4
Population Forecast……………..4
Apartment Demand……………..5
Supply Forecast………………….5
Supply and Demand…………….6
Rental Rate Forecast……………7
C o n c l u s i o n ……………………… . 7
Under Construction Map…………...8
The Seattle Apartment Market
Report is a publication of the
O’Connor Consulting Group, a
Seattle-based real estate appraisal
and consulting firm specializing
in mixed-use multifamily and
commercial property valuation
and consultation.
For more information regarding
these services please contact
Brian O’Connor, MAI at
206-622-5100
The Seattle Apartment Market
Report is edited by:
Casey O’Connor, Associate.
Vacancy
Our December 2012 vacancy
survey covered approximately 128,000
units. Overall, physical vacancy was
estimated at 3.5% for the Seattle MD and
is allocated among the primary markets
and submarkets as shown below. The
Seattle MD vacancy rate declined over
the past year from 4.1% at the end of
2011 to 3.5% at year-end 2012.
The decline in vacancy
experienced in the first half of 2012 is
consistent with the seasonality of
vacancies being higher in winter verses
summer. But this is not the sole
explanation for the decline. Because the
decline was rather substantial considering that the rate of change of
vacancy slows as vacancies fall closer to zero. We believe this is a
result of the strong demand and low supply we see in the Seattle MD.
Some supply began to enter the market in late 2012 which took a little
pressure off the falling vacancy rates. We expect that the supply will
Units Vacancy Percent Units Vacancy Percent
Ballard/Fremont 959 34 3.5% Edmonds 1,032 34 3.3%
Beacon Hill/Central District 1,104 11 1.0% Everett 8,515 428 5.0%
Belltown 3,017 138 4.6% Lynnwood 5,727 207 3.6%
Capitol Hill/Eastlake 2,362 62 2.6% Marysville 447 9 2.0%
Downtown 2,014 90 4.5% Mill Creek/Canyon Park 1,482 67 4.5%
International District 412 9 2.2% Monroe 222 8 3.6%
First Hill 1,423 33 2.3% Mukilteo 886 37 4.2%
Greenlake/Greenwood 717 14 2.0% Mountlake Terrace 1,298 27 2.1%
Lake City 1,410 30 2.1% Subtotal 19,609 817 4.2%
Lake Forest Park/North City 414 7 1.7%
Magnolia/Queen Anne 1,540 60 3.9%
Northgate 1,932 38 2.0%
Northwest/Shoreline 2005 52 2.6% Units Vacancy Percent
Rainier Valley/South Seattle 663 28 4.2% Auburn 2,204 90 4.1%
South Lake Union 1,291 49 3.8% Burien/Des Moines 3,282 108 3.3%
University/Ravenna/Sandpoint 1,560 12 0.8% Enumclaw 219 10 4.6%
Fauntleroy/Delridge 393 14 3.6% Federal Way 9,486 495 5.2%
West Seattle 1,696 56 3.3% Kent 9,223 386 4.2%
Subtotal 24,912 737 3.0% Renton 7,601 332 4.4%
Maple Valley 342 17 5.0%
SeaTac/Tukwila 4,523 107 3.5%
Subtotal 36,880 1,545 4.2%
Units Vacancy Percent
Suburban Bellevue/Newcastle 6,637 197 3.0% Units Vacancy Percent
Downtown Bellevue 1,263 39 3.1% Fife/Milton 1,335 52 3.9%
Kenmore/Bothell/Woodinville 2,812 126 4.5% Fircrest/University/Dupont/Steilacoom1,424 77 5.4%
Issaquah 1,913 63 3.3% Gig Harbor 848 65 7.7%
Sammamish 899 27 3.0% Lakewood 2,280 159 7.0%
Kirkland 3,419 123 3.6% Puyallup/Sumner 3,154 192 6.1%
Mercer Island 1,030 67 6.5% Tacoma 15,594 969 6.2%
Redmond 3,221 78 2.4% Downtown Tacoma 1,041 32 3.1%
North Bend 233 5 2.1% Subtotal 25,676 1,546 6.0%
Subtotal 21,427 725 3.4%
*Issaquah and Sammamish have been separated as of Dec. 2012
King*
Snohomish 4.2%
Pierce 6.0%
Source: O'Connor Consulting Group, LLC Seattle-Bellevue-Everett MD 3.5%
*Weighted average by submarket size
SEATTLE SNOHOMISH COUNTY
SubmarketDec-12
SubmarketDec-12
SOUTHEND
EASTSIDE
SubmarketDec-12 PIERCE COUNTY
SubmarketDec-12
SubmarketDec-12
County
Summary by County/MD
Dec-12
Vacancy
3.4%

Employment Forecast
National economic conditions
have begun to improve, though at a pace
that is frustratingly slow for most
metropolitan areas. Thankfully, the
Seattle MD remains an uncommon gem
among the national scene with
unemployment trending downward and
healthy job growth in forward-looking
industries being estimated for the area.
As of December 2012, national
unemployment was at 7.8%, Washington
state was at 7.6%, and the Seattle MD
was at 6.5%.
To gain a little perspective on
the current employment forecast, it is
worth rewinding a couple years to give
the reader some context. The year 2009
was a difficult year for the Seattle MD.,
with a total annual loss of approximately
76,500 jobs. A loss of this magnitude
implied a negative growth rate of 5.5%
for that year. A further 26,100 jobs were
lost in 2010. However, most of these
loses occurred in January of that year,
with generally positive gains thereafter.
The year 2011 marked a turn-
around for Seattle MD job seekers.
According to the most recent data, the
Seattle MD increased employment by
33,200 new jobs in 2011, which
represents a healthy 2.4% growth rate.
Th e ye a r 2 0 1 2 w a s
characterized by positive job growth,
with an over-the-year percent
employment increase of 2.8%. This
represents the addition of approximately
39,600 jobs for the year 2012.
Local economists Dick
Conway and Doug Pederson predict
strong job growth in the Seattle MD of
2.8% in 2013, 2.5% in 2014, and 2.3%
in 2015. These increases in job growth
would represent approximately 115,600
new jobs over the next three years.
Population Forecast
Our forecast of vacancy and
rental changes are driven primarily by
anticipated population growth in the
region. The chart below displays the
historical relationship between net
migration and net employment growth in
the Seattle metropolitan area.
As is evident in the chart
below, net migration is heavily
dependent upon net employment
growth.. Migration rates are sensitive to
both local economic conditions as well
as economic conditions elsewhere. The
pattern of future job growth will
determine the pattern of net migration
and thus population growth and
household growth.
Based on the April 1, 2012,
population increase of 20,300 people, we
had a net migration figure -1,996 people
in 2011, and an estimated 3,300 in 2012.
Net migration averaged 11,363 people
from 2001 to 2012.
It is fascinating that despite
historically lower net migration figures,
the Seattle MD continues to absorb a
healthy amount of apartment units. We
believe that this is due in large part to a
shift in household tenureship. We are
currently experiencing a significant shift
away from ownership and toward the
rental market. Despite historically low
interest rates, there are a multitude of
factors that are currently acting upon
potential buyers that make renting a
more attractive option. We believe that
this trend may be the most significant
factor acting upon the Seattle MD
apartment market today and strongly
encourage the reader to download our
PDF on Housing Tenure, which can be
found on the same download page as this
newsletter.
Despite the hiccup in net
migration experienced in 2010/2011,
Seattle remains one of the healthier
regional economies in the nation. Due to
this factor, we believe net migration will
be pos i t ive moving fo rward
(approximately 8,700-13,800 per annum)
despite the notably slow national
recovery.

Apartment Demand
Despite the economic turmoil
of years past, the Seattle MD is one of
the most economically attractive regions
in the nation, regularly receiving
attention in nation-wide publications due
to the area’s strong base with forward-
looking industries such as aerospace,
biotechnology, and software design.
Given the area’s strong fundamentals,
expected net positive migration, and the
recent employment forecast by Dick
Conway and Doug Pederson, we believe
that positive growth will continue, on an
annual basis, through 2015.
The year 2012 went as
expected for the most part. We
witnessed vacancy rates drop
significantly in the first half but began to
level off in the second half due to some
new supply entering the market. As
strong as the demand was in 2012 (5,349
units), we predict even stronger demand
in 2013 and 2014. However, the
relationship between supply and demand
may vary greatly depending on the
submarket. For instance, Eastside
demand is tending to shift to the
Southend and Snohomish submarkets as
rent rates increase on the Eastside.
Looking forward, our positive
expectations have resulted in healthy
es timates of fu ture demand.
Historically, an approximate average of
35% of all new households have been
expected to choose apartments. We
expect that the proportion of new
households that will choose rental
housing is currently hovering around
50% to 55%. Please see the PDF on our
website titled Housing Tenure for more
on this topic.
Supply Forecast
Our estimate of new multi-
family supply is derived from a survey of
all units currently in lease-up, projects
under construction, and known projects
in their pre-development stage. To
gauge the number of units in the
pipeline, we track all multifamily
building permits, physically inspect the
permitted sites, and reconfirm the
number of units and the property type
(apartment or condominium). This
information was calculated for each of
the four major markets within the Seattle
metropolitan area.
As of our year 2012 survey, the
Seattle MD has a total of 11,932
apartment units under construction, and
another 2,382 new units currently in the
lease-up phase. The majority of those
units under construction will be
impacting the Seattle MD in our two year
forecast. The Seattle submarket deserves
special mention as approximately 75% of
all region wide construction is centered
in Seattle. More specifically, 4,103 of
those units, or 35% of all units under
construction throughout the Seattle MD,
are located within the Seattle core.
Absorption
The Seattle absorbed 3,274
new units and 2,075 existing units in
2012. Important to take note, out of the
3,274 new units absorbed, the Seattle
submarket captured 70% of the 2012
new unit demand. For reference, the
Seattle submarket historical captures
approximately 45% of the demand.
Also worth mentioning, the Eastside
submarket captured only 8.6% of
demand in 2012. Historically, the
Eastside’s capture rate is usually around
25%-30%.
Submarket 2010 2011 2012
Vacancy Rate 4.2% 4.1% 3.5%
Market Size 358,128 360,278 363,552
Occupied Units 343,177 345,419 350,768
New Units Absorbed 4,443 2,150 3,274
Existing Units Absorbed 4,988 92 2,075
Total Demand 9,431 2,242 5,349
Submarket 2013 2014
Seattle 4,289 3,932
Eastside 899 1,242
Southend 830 828
Snohomish 899 897
Metro Total 6,917 6,897
New Units New Units Abs. Average
Submarket in 2012 in 2012 Absorption/Mo.
Seattle 3,060 2,282 18.8
Eastside 628 383 8.9
Southend 260 358 10.4
Snohomish 386 351 14.3
Metro Total 4,334 3,374 13.2
2012 Absorption Summary
Multifamily Demand Forecast by Submarket (in Units)
Metro Area Market Demand Summary
December Average Vacant Units Total
Sub 2012 Absorption Units In Under Two Year
Market % Vacant Complex/Mo. Lease-Up Construction Pipeline
Seattle 3.0% 18.8 1,771 9,019 10,790
Eastside 3.4% 8.9 68 1,879 1,947
Southend 4.2% 10.4 129 140 269
Snohomish 4.2% 14.3 414 894 1,308
Seattle MD * 3.5% 13.2 2,382 11,932 14,314
* Weighted Average
Seattle Metro Supply Survey

Supply and Demand Summary
The table below illustrates our
forecast for both apartment supply and
demand within each major submarket in
the Metropolitan area. Vacancies are
expected to stabilize over the next two
years as supply steadily catches up with
demand.
As opposed to years past, the
Seattle MD apartment market in 2012 is
best characterized by analyzing the
individual submarkets within the Seattle
MD. It is because of the events of the
previous years, such as the recession,
lack of available financing, and pent up
demand that has lead to this supply
boom that the Seattle MD is now
entering. The vast majority of the
supply entering the market in the next
two
years is going to be in the Seattle
submarket. The Seattle submarket can
expect 10,559 new units over the next
two years. The next closest submarket is
the Eastside with 2,159 new units over
the next two years. In the Southend, we
expect only 457 new units to enter the
market. The Snohomish submarket will
see 1,366 new units over our forecast
period.
The discrepancies in the
geographic distribution of supply
mentioned above have caused some
interesting patterns in demand to occur.
In the Eastside submarket, we have seen
some of the demand shift to the
Southend and Snohomish submarkets
because of lack of new supply and rising
rents. This is a trend we expect to
continue throughout our forecast period.
As the reader can see, we
expect the Southend and Snohomish
submarkets to see a significant drop in
their vacancy rates, while the Eastside
vacancy rate will largely remain
unchanged over the next two years.
In the table below, we can see
that our in-house supply/demand models
predict vacancies at 3.6% in the Seattle
MD. Demand is expected to peak at
approximately 6,900 in 2013, decreasing
to 5,500 units incrementally by 2016,
Supply is expected to respond to this
healthy demand as the national economy
continues to improve.
Sub Market % No. 2 Year 2 Year S/D 2 Yr. Mkt 2 Yr. Vac. Total
Market Size Vacant Vacant Demand Supply Net Size Rate** Vacant
Seattle 154,977 3.0% 4,585 8,220 10,559 2,339 165,536 4.0% 6,695
Eastside 65,069 3.4% 2,202 2,141 2,159 18 67,228 3.4% 2,281
Southend 81,680 4.2% 3,422 1,658 457 -1,201 82,137 2.9% 2,366
Snohomish 61,826 4.2% 2,576 1,796 1,366 -430 63,192 3.7% 2,345
Metro * 363,552 3.5% 12,784 13,815 14,540 725 378,092 3.6% 13,693
**Two-Year Vacancy rate is end of 1st quarter 2015
Seattle Metro Market Summary
* Weighted Average
Apartment Data
Net Apartments Year End Average
Total Percent Total Percent Total Percent Total New Under Vacancy Rent
Year Persons Change Jobs Change Households Change Units Absorp. Construction Rates Change
2003 2428024 0.88% 1,322,825 -1.12% 977,671 0.89% 347,423 3,947 4,976 6.57% 0.1%
2004 2449561 0.89% 1,334,983 0.92% 987,860 1.04% 348,343 396 6,507 6.72% 1.9%
2005 2476345 1.09% 1,370,925 2.69% 1,004,035 1.64% 347,155 4,648 4,902 5.06% 2.0%
2006 2521335 1.82% 1,416,017 3.29% 1,020,257 1.62% 345,185 3,959 4,853 3.37% 13.0%
2007 2560412 1.55% 1,460,300 3.13% 1,033,178 1.27% 347,625 2,021 5,944 3.47% 8.5%
2008 2590455 1.17% 1,478,283 1.23% 1,043,575 1.01% 350,105 -3,035 6,931 5.02% 1.4%
2009 2615099 0.95% 1,399,900 -5.30% 1,054,885 1.08% 353,989 1,202 2,856 5.72% -10.3%
2010 2644584 1.13% 1,376,850 -1.65% 1,062,338 0.71% 358,128 9,435 3,320 4.18% 4.0%
2011 2659600 0.57% 1,405,475 2.08% 1,069,930 0.71% 359,996 2,086 3,114 4.12% 7.70%
2012 2679900 0.76% 1,450,456 3.20% 1,081,455 1.08% 363,552 3,274 11,932 3.52% 5.43%
5 Yr. Avg. 0.9% -0.1% 0.9% 2592 5631 4.5% 1.6%
Total Percent Total Percent Total Percent Total Total Vacancy Rent
Year Persons Change Jobs Change Households Change Units Demand Rates Change
2013 2,711,551 1.18% 1,492,281 2.88% 1,095,290 1.28% 370,697 6,917 3.5% 4.8%
2014 2,747,117 1.31% 1,530,239 2.54% 1,109,085 1.26% 378,092 6,897 3.6% 4.5%
2015 2,781,245 1.24% 1,566,044 2.34% 1,121,230 1.10% 384,404 6,072 3.6% 3.4%
2016 2,810,351 1.05% 1,597,281 1.99% 1,132,377 0.99% 389,204 5,574 3.3% N/A
2017 2,837,806 0.98% 1,623,420 1.64% N/A N/A N/A N/A N/A N/A
5 Yr. Avg. 1.2% 2.3% 1.16% 5,747 3.5% 4.2%
10 Yr. Avg. 1.0% 1.1% 1.0% 4,044 4.0% 2.6%
O'CONNOR CONSULTING GROUP,LLC: Brian R. O'Connor, MAI
Employment Forecast Household Forecast Apartment Demand Forecast
(1) Population as of April 1st.
(2) Excludes Military & Self-Employed
Metropolitan Area is King & Snohomish Counties
Sources: WA State Employment Security & WA State Office of Financial Management
(3) Total households are estimates
Apartment Demand Forecast
Seattle MD, 2013-2017
Population Forecast
Seattle Metropolitan Apartment Market Data & ForecastApartment Trend Analysis
Seattle MD, 2003-2012
Population Estimates (1) Employment (2) Households (3)

Rental Rate Forecast
The two tables to the right illustrate the
recent history and our forecast of
changes in rental rates for each
submarket of the Seattle MD. During
2010 Seattle MD vacancies were
continuing to decline, which lead to an
increase of 6.8% in rents. Responding to
a rapid drop in vacancies, Seattle MD
rents grew by 9.1%% in 2011. In 2012,
as some supply entered the market, rents
stabilized somewhat yet we still saw an
increase of 5.4%. Based upon our
estimates of new apartment supply and
demand, we estimate healthy rent
growth going forward. As new supply
enters the market, we expect rents to
stabilize.
Submarket 2010 2011 2012
Seattle 6.5% 9.0% 6.0%
Eastside 7.3% 12.6% 8.0%
Southend 2.4% 5.3% 3.9%
Snohomish 4.6% 10.8% 3.3%
Seattle MD Total* 6.8% 9.1% 5.4%
Submarket 2013 2014 2015
Seattle 4.0% 3.0% 2.0%
Eastside 6.0% 7.0% 4.0%
Southend 5.0% 5.0% 5.0%
Snohomish 5.0% 5.0% 4.0%
Seattle MD Total* 4.8% 4.5% 3.4%
*Weighted Average
Seattle-Bellevue-Everett MD Rental Rate History
*Weighted Average
Seattle-Bellevue-Everett MD Rental Rate Forecast
Employment in Core Areas
The “Seattle Core” consists of
(Downtown, South Lake Union, and
parts of Capitol Hill, First Hill, Queen
Anne, and the International District).
The “Bellevue Core” consists of the
Downtown Bellevue area.
Within the Seattle MD, the
Seattle Core deserves special attention
with regards to employment. Over the
last decade, the Seattle Core has aver-
aged over a 14% (or approx. 200,00
jobs) share of the total employment in
the Seattle MD (1,450,456 jobs in 2012).
This has made it an attractive place for
commercial real estate investment fol-
lowing turbulent economic times. As a
result, approximately 35% of all apart-
ment units currently under construction
are located in the Seattle Core.
The Bellevue Core is smaller
geographically and in total population
than the Seattle Core, yet still contrib-
utes a significant amount of the overall
employment for the Seattle MD. Over
the past decade, the Bellevue Core has
averaged a 2.6% (or approx. 38,000
jobs) share of total employment in the
Seattle MD. In 2010 and 2011 the
Bellevue Core has had a 3.1% (or
45,000 jobs) share of total employment.
35,704 35,652
32,08231,111
29,85632,117
37,50838,440 38,929
35,893
42,78943,743
0
5,000
10,000
15,000
20,000
25,000
30,000
35,000
40,000
45,000
50,000
2000 2001 2002 2003 2004 2005 2006 2007 2008 2009 2010 2011
Bellevue Core Total Jobs 2000-2011
Source: Wa State Employment Security Dept., PSRC
216,097
203,815
198,667
194,466
190,987192,217
197,015
202,629
209,165
198,148
189,358
194,603
175000
180000
185000
190000
195000
200000
205000
210000
215000
220000
2000 2001 2002 2003 2004 2005 2006 2007 2008 2009 2010 2011
Seattle Core Total Jobs 2000-2011
Source: WA State Employment Security Dept., PSRC

The following map is of the Seat-
tle-Bellevue-Everett MD that consists of
every apartment project currently under
construction . By mapping the locations of
each project clearly illustrates the geo-
graphic distribution of supply.
When looking at the map of the
entire Seattle MD, the reader can see that
the vast majority of projects currently un-
der construction are in the Seattle submar-
ket. Within the Seattle submarket, the pro-
jects are focused in the “Seattle Core” ,
Ballard, and the University District .
The map as a whole represents an
astounding 11,932 units currently under
construction. The Seattle submarket has
approximately 75% or 9,000 of those
units. The Seattle core has approxi-
mately 35% or 4,000 of all the units
under construction.
One noteworthy company is
the internet based retailer, Amazon,
who is rapidly expanding in the Seattle
Core. They currently employ 10,000
people in the Seattle Downtown area
and currently have three major blocks
in South Lake Union under contract to
build an additional three million square
feet of office space. That amount of
square footage will support approxi-
mately 12,000 new employees.
Map of Apartment Projects Under Construction
As this map illustrates,
apartment construction is almost en-
tirely focused in centrally located
Seattle neighborhoods. The centrally
located distribution is not a coinci-
dence. As we were coming out of the
recession, developers were able to
finance their projects in the areas with
the least amount of risk. Many of
those projects happened to be in the
Seattle Core, where many of the jobs
are located.
This trend that we have seen
for the last few years, will likely tran-
sition to more projects developed
outside of the Seattle Core.

For more information on services offered by the
O’Connor
Consulting
Group, LLC
please contact Brian O’Connor, MAI at (206) 622-5100 or visit
our website at: www.ocgp.com