Embed Size (px)
Citation preview
U. S. Department of Justice Bureau of Justice Statistics
The Seasonality of Crime Victimization
May 1988 NCJ-111033
U.% mpa~tmen t of Jwfiee Bureau of Justice Statistics
Steven R, Schlesinger Mrector
Acknowledgmentg. This report was written by Richard W, Dodge of the Bureau of Justice Statistics. Bruce M. Taylor of BJS provided statistical review. Frank D, Balog supplied editorial assistance. Statisticaf assistance was provided by Gertrude Thomas, and production assistance was furnished by Tina Dorsey. Marilyn Marbrook administered pub- lication, assisted by Jeanne Harris, Christina Roberts, and Millie J. Baldea.
National Crime Survey data collection and general processing activities are conducted by the Bureau of the Census. The program is currently under the supervision of Lawrence McGinn, Chief, Crime Sur- veys Branch, Demographic Surveys Mvision. We is assisted by Patricia Bowles, Marilyn Monahan, Gherrie Sohama, Janice &bold, Carol gpivey, and Bruce Wflder, In the Bureau of Justice Statistics the data collestion pro@am is monitored by Miehael 8, Rand.
wecia1 contributions to this repart were made by Charlea Alexander, Btatfstioal Methods Dhieion, Bureau of the Census, assisted by David nubble and Frank Vitrano, in deval- oping the Coefficient of &asonal Vwiation and in guiding the author in its use; by Marshall BeBerry, BJS, in producing the special computer runs that underlie the report; and by Marianne Zawitz, BJS, in developing the graphical presentation.
The Assistant Attorney General, Office of Justice Programs, coor- dinates the activities of the following program offices and bureaus: the Bureau of Justice Statistics, National Institute of Justice, Bureau of Justice Assist- ance, Office of Juvenile Justice and Delinquency Prevention, and the Off ice for Victims of Crime.
ii The Seasonality of Crime Victimization
Contents
Introduction and highlights 1 Definition of seasonality 4 Background 4 Seasonality and consistency
for all NCS crimes 5 Crimes reported to the police 6 Crimes not reported to the police 7 Comparison of seasonality and con-
sistency in crimes reported and not reported to the police 7
Patterns of seasonality 10 Technical appendix 11
1. Criteria for rating the seasonality and consistency of NCS crimes 4
2. Seasonality and eomistency for all NCS crimes 5
3. hasonality and consistency for NCS crimes reported to the police 6
4, Seasonality and conefstency for NCB crimes not regorted to the police 6
6. Relatke amount of seaatonality and aonsistency in crimes reported to the police, compared with crimes not reported to the poliae 7
1. Violent crime viotimi~atfon rates, 1973-84 2
2. Personal and household larceny victimization rates, 1973-84 3
3. Burglary and motor vehicle theft victimization rates, 1973-84 3
4. Analysis of the amount of season- ality as measured by the percent difference from the mean 5
5. Differences in the amount of seasonality for rape and robbery 5
6. Differences in the amount of seasonality for personal and household larceny 8
7, Patterm of seasonality 9
8. Similar amounts of seasonality with different seasonal patterns for reported personal larceny with con- tact and unlawful entry and for not reported personal larceny without contact of less than $50 and forcible entry 10
&asonalIty in the occurrence of crime has been noted b many ob- servers over the years.' National Crime Survey (NC8) data have been analyzed from this perspective usi g the first 5 years of survey results. !! This report is a further examination of seasonality in erime using NCS data from 1973 through 1964.
The National Crime Survey is a continuous survey of a nationally representative sample of households. Data for 1984, for example, were based on interviews with approxi- mately 114,000 individuab age 12 and older living in 54,000 howe- holds. The NCS foeuses on selected crimes, including those not reported to the police, that we of major con- cern to the general public and to law enforcement authorities8 specifi- cally, the personal erimea of rape, robbery, assault, and laraeny and the household orlmes of burglary, larceny, and melor vehicle theft,
The major findings on sewonality may be summari.ted as PoUows:
Barred on tot& wfelimlzatfsm, the hiahlv ssaaonal arf rntssr arc? housahsld l ak iny $60 or more, r a p , huehold la~cenv lem than $60, and unlawful entry.-Those arfmw axhibiting the least amount of eewonalfty are person& larceny without @ontact $60 or more, motor vehicle theft, robbery, forcfble entry, and simple assault.
e In general, the amount of seasonal- ity obhlerved for a partiodar crime ia similar for both those orlmas that are reported to the police and those that are not. However, there are notable exceptiom, such as simple assault and forcible entry.
Despite the general similarity between reported and nonreported crimes in the amount of seasonality, where there are differences, crimes reported to the police tend to be more seasonal,
l ~ o ra bibliography of analyses of seasonality in crime, see Block, Carolyn R., Is Crime Seasonal?, Statistical Analysis Center, Illinois Criminal Justice Information Authority, Chicago, Illinois, 1984, pp. 31-40.
ILC- and~easonelily,eauof Justice Statistics, NCJ-64818, Nay 1980,
The Seasonality of Crime Victimization 1
Introduction and highlights
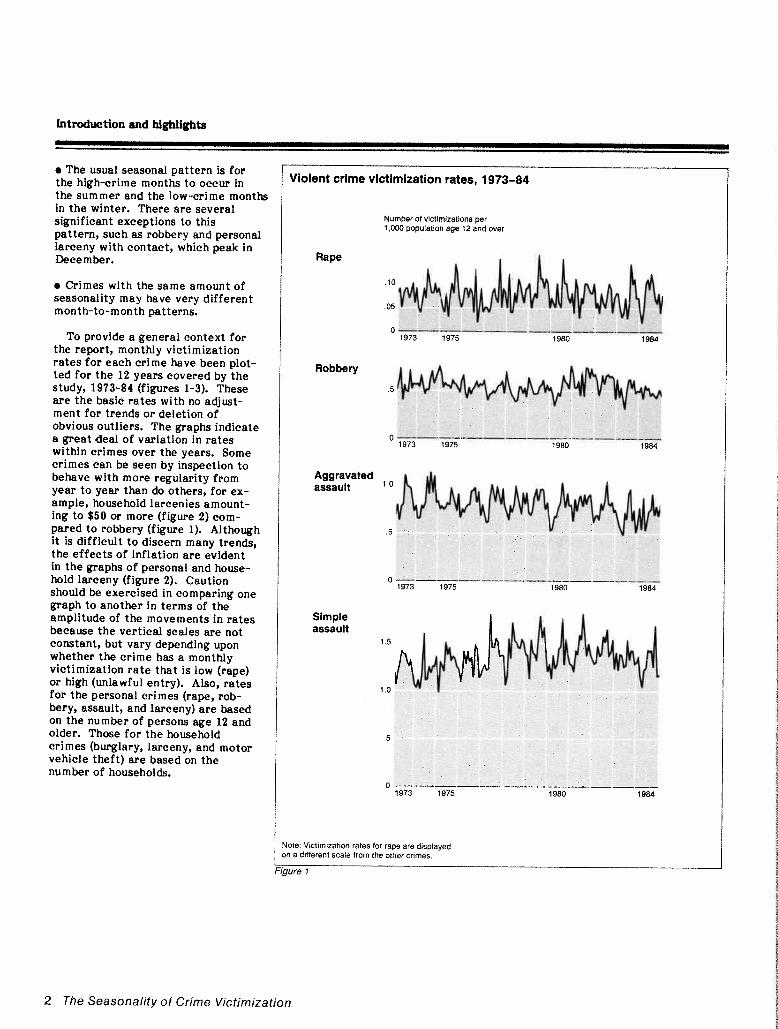
a The usual seasonal pattern is for the high-crime months to occur in the summer and the low-crime months in the winter. There are several significant exceptions to this pattern, such as robbery and personal larceny with contact, which peak in December.
Crimes with the same amount of seasonality may have very different month-to-month patterns.
To provide a general context for the report, monthly victimization rates for each crime have been plot-ted for the 12 years covered by the study, 1973-84 (figures 1-3). These are the basic rates with no adjust-ment for trends or deletion of obvious outliers. The graphs indicate a great deal of variation in rates within crimes over the years. Some crimes can be seen by inspection to behave with more regularity from year to year than do others, for ex-ample, household larcenies amount-ing to $50 or more (figure 2) com-pared to robbery (figure 1). Although it is difficult to discern many trends, the effects of inflation are evident in the graphs of personal and house-hold larceny (figure 2). Caution should be exercised in comparing one graph to another in terms of the amplitude of the movements in rates because the vertical scales are not constant, but vary depending upon whether the crime has a monthly victimization rate that is low (rape) or high (unlawful entry). Also, rates for the personal crimes (rape, rob-bery, assault, and larceny) are based on the number of persons age 12 and older. Those for the household crimes (burglary, larceny, and motor vehicle theft) are based on the number of households.
, Violent crime victimization rates, 1973-84
Number of vlctlmtzattonsper 1,000populat~onage 12 and over
Rape
10
05
Robbery
5
Aggravated
5
Simple assault
1 5 n 1 0
Note: Victimizationrates for rape are displayed on a differentscale from the other crimes,
Figure 1
2 The Seasonality of Crime Victimization
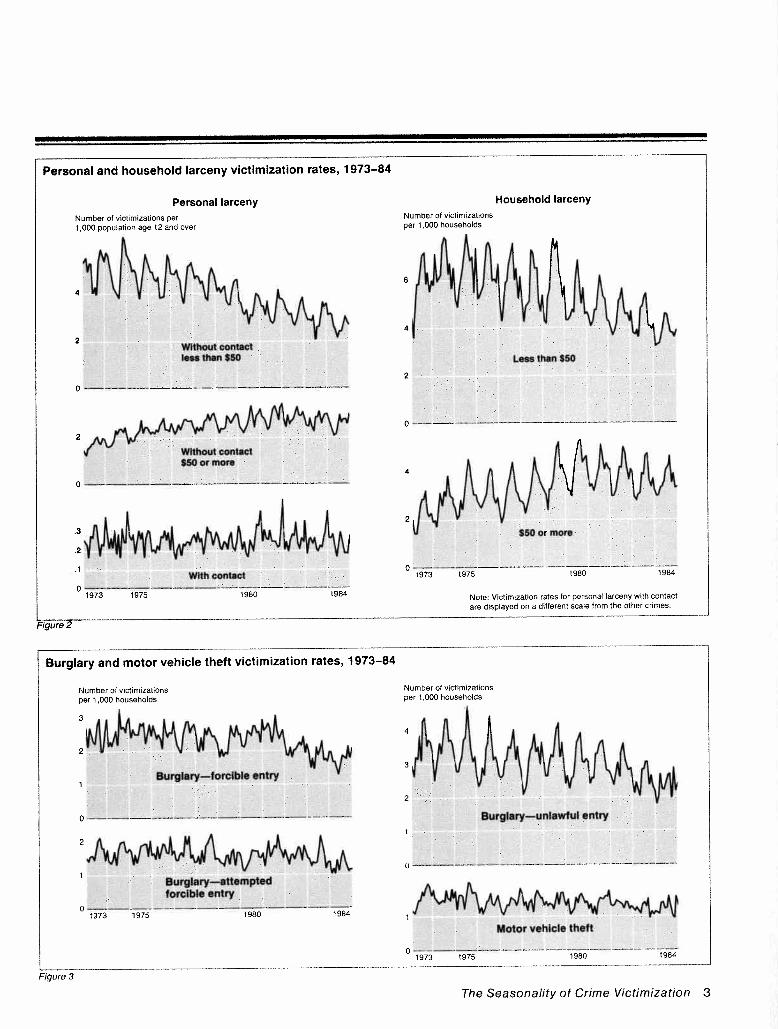
Personaland household larceny victimization rates, 1973-84
Personal larceny Number of victimizations per 1,000 populationage t2 and over
Household larceny Number of victimizations per 1,000 households
Note: Victimlzatlonrates for personal larceny with contact are displayedon a differentscale from the other crimes.
Burglary and motor vehicle theft victimization rates, 1973-84
1 Number of victim~zatlons Der 1.000 households
Number of victimizat~ons per t ,000 households
W V
Motor
0 ------ --1973 t975 1980 t 984
Figure 3
The Seasonality of Crime Victimization 3
Definition of seasonality
Individual behavior patterns change with the seasons and with them the opportunity for crime to occur. For example, people spend more time outside in the warmer weather, increasing the number of potential targets for street crime. Doors and windows in homes are more apt to be open or left unlocked at these times and thus provide easier access to intruders. More household articles are likely to be left outside, serving as invitations to theft. Patterns of economic activity may also be related to ebbs and flows of crime, especially the purchase of retail goods and serv- ices. The data in this report attempt to describe seasonal patterns in crime and to swcuhte on the reasons behind them.
As Block has observed, whether a particular time series is seasonal depends to a great ext nt on how seasonality is defined.' h this study, the crimes are examined from two perspectives, One analyzes the total variation of the average monthly victimization rates from the mean for the 12-year period and con- structs a standardized index that enables each crime to be ranked ac- cording to the amount of variation it exhibits. This statistic is dmignated as the Coefficient of &asom1 Varia- tion (CSV), md the specific values are referred to as indicators of sea- sonality. The other measure ir the Coefficient of Deter nation, more commonly known ss $,and indi- cates the proportion of the variation in the montNy vfctlmfzatlon rates that is exglsined by dl ferences be-Igtween months. The R toeuerrs on the esnsisbency sf the stemonal pat- terns from yearts yearttndthw more nearly correswnds to the defi- nition of seesaaal%tyaa reourring patterns of similar timing arleamplitude. In this report, R values are referred to as neeswes of consistency.
3 ~ e efootnote I ,
However, the R 2 is affected by sampling error, which may result in substantial variation in crime rates for a specific month over the 12-year period. For crimes that occur infrequently, and therefore have Bigh relative sampling errors, the R figure will be substantially depressed. In this circumstance it is impossible to know how much of this low rating is due to true variation of the victimization rates for that month and how much can be ascribed to sampling error. fFor crimes of high volume, the R is a better measure of consistency because the effect of sampling error is minimal. The advantage of the CSV is that it is less sensitive to the effects of sampling error in the crimes of low frequency.
In the earlier NCS report on season- ality, the X-11 program, developed primarily for use in economic time series, was used to determine which crimes were seasonal. The R2 meas-ure produces results that are very similcy: to those from the X-11, but the R is the preferred measure be- cause its distributional properties are better known so that tests can be made to determine differences be- tween crimes.
Both the CSV and the E l 2 are ex- pressed in numbers that, in this study, range from -115 to ,728, with higher values fndioating more sea- sonality or consistency in the series. Moat effects of trend on the ob- served patterm over the 1%-year period have be n removed, Tqether, 5the CSV and R statfstioer oan provide a more complete picture of the seasonality in crime than either measure om by itself.
High seltllonality ,440 or more Moderate seasonality ,330 to ,440 Little or no seasonality Less than ,330
Consistency-Caef lcient of aDetermination (R ) High consistency
Background
The crimes included in this study will be discussed in terms of the two measures mentioned earlier--the amount of seasonality, indicated by the CSV, and the consistency of the se sonal pattern, indicated by the Rd. Crimes are classified as highly seasonal, moderately seasonal, or possessing little or no seasonality. Similarly, consistency of the sea- sonal pattern is divided into three groups--high, moderate, and low. Tests of significance have been computed to examine differences betwe n crimes for both the CSV dand R measures. Unless otherwise indicated, crimes in any of these three groupings--whether by amount of seasonality or consistency--are statistically different from those in the other two groups. Frequently, there are meaningful differences within groups.
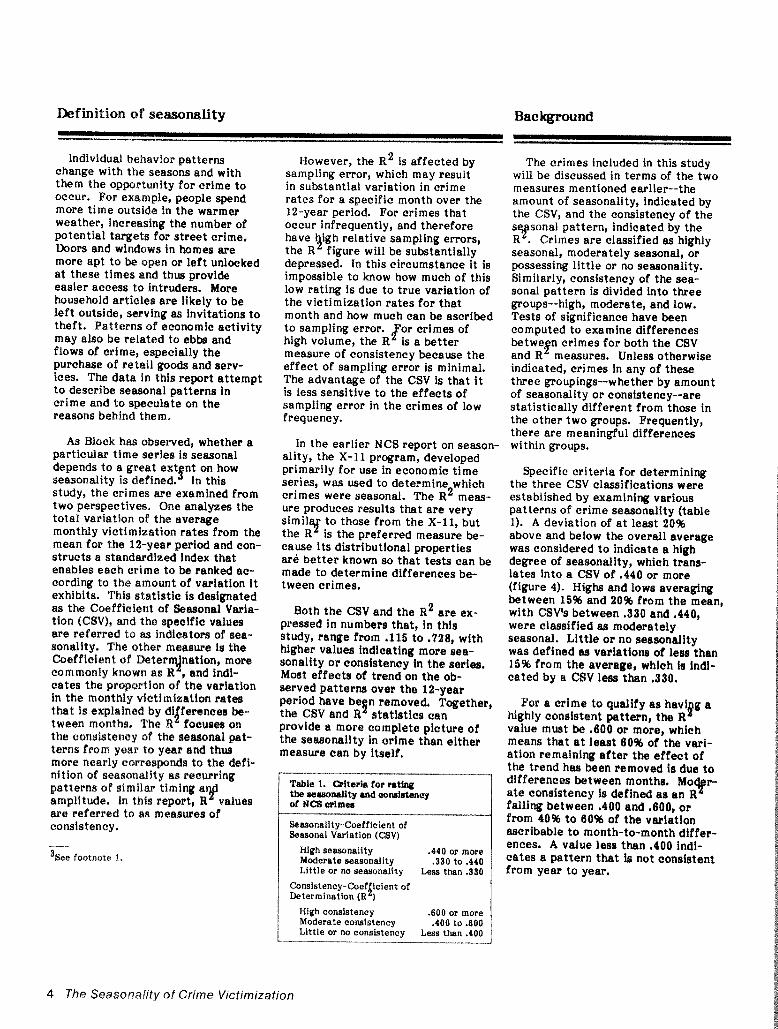
Specific criteria for determining the three CSV classifications were established by examining various patterns of crime seasonality (table 1). A deviation of at least 20% above and below the overall average was considered to indicate a high degree of seasonality, which trans- lates Into a CSV of .440 or more (figure 4). Highs and lows averaging between 15% and 20% from the mean, with CSVis between .330 and ,440, were cleasified as moderately seasonal. Little or no seasonality was defined as variatiom of leers than 1596 from the average, whioh fa fndf-cated by a CBV leas than ,330.
For a crime to qualify 8s havi g a highly conrfstent pattern, the Rf value must be .6QO or more, whioh meam that at lbaet 60% of the vm1- ation remaining after the effect of the trend hart be-en removed is due to differences ktween monthtr. Mo ate oonklistency is defined as an R9r-
fall iq between ,400 and ,800, or from 40% to 60% of the variation ascribable to month-to-month differ- ences. A value Less than ,400 indi- cates a pattern that is not oonsbtent from year to year.
4 The Seasonality of Crime Victimization
Seasonality and consistency for all NCS crimes
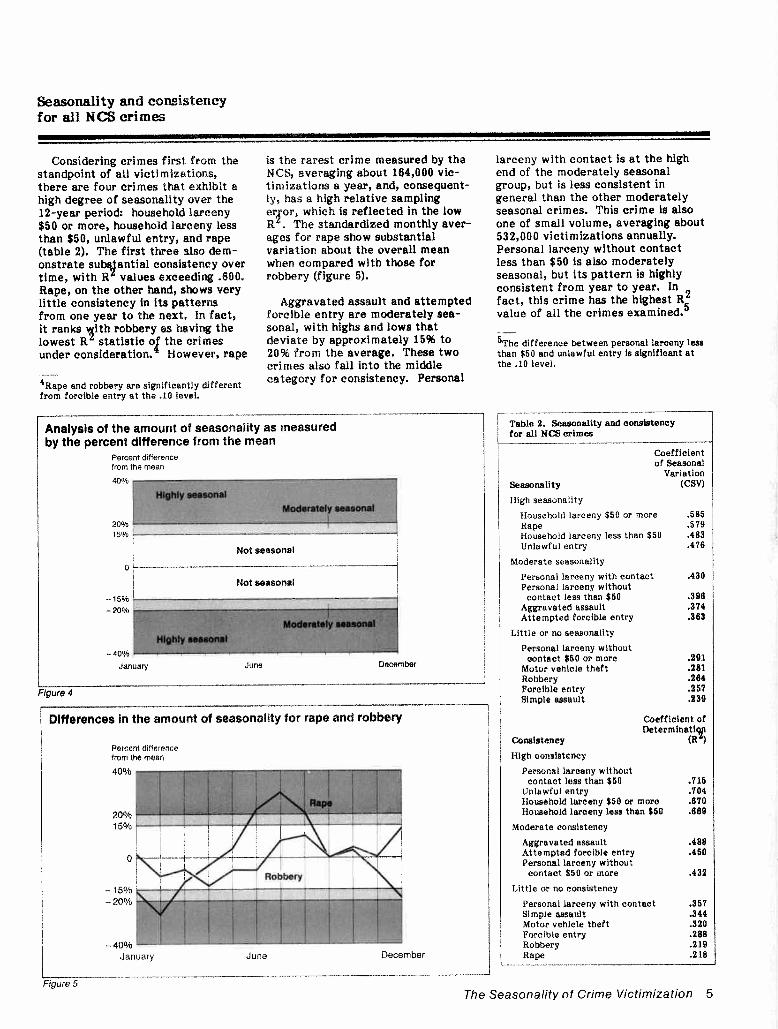
Considering crimes first from the is the rarest crime measured by the larceny with contact is at the high standpoint of all victimizations, NCS, averaging about 164,000 vic- end of the moderately seasonal there are four crimes that exhibit a timizations a year, and, consequent- group, but is less consistent in high degree of seasonality over the lyr has a high relative sampling general than the other moderately 12-year period: household larceny er or, which is reflected in the low seasonal crimes. This crime is also4$50 or more, household larceny less R . The standardized monthly aver- one of small volume, averaging about than $50, unlawful entry, and rape ages for rape show substantial 532,000 victimizations annually. (table 2). The first three also dem- variation about the overall mean Personal larceny without contact onstrate suyant ia l consistency over when compared with those for less than $50 is abo moderately time, with R values exceeding .800, robbery (figure 5). seasonal, but its pattern is highly Rape, on the other hand, shows very consistent from year to year. In little consistency in its patterns Aggravated assault and attempted fact, this crime has the highest R2 from one year to the next, In fact, forcible entry are moderately sea- value of all the crimes examined.5
it ranks ith robbery as having the sonal, with highs and lows that9 -lowest R statistic 0 the crimes deviate by approximately 15% to 5 ~ h edifference between personal larceny less under consideration! However, r a p 208 from the average. These two than $50 and unlawful entry is significant at
crimes also fall into the middle the .10 level. -4 ~ a p eand robbery are significantly different category for consistency. Personal from forcible entry at the .I0 level.
1 r I
Analysis of the amount of seasonalsty as measured by the percent difference from the mean
Percent difference from the mean
I Not seasonal I
I Not seasonal I
-15010 1 -
j HII -40% .---
January June Decsmber
Figure 4
Table 2. Swsonality and oonsistency for all NCS crimes
Coefficient of Seasonal
Variation Seasonality (CSV)
High seasonality
Household larceny $50 or more 3 8 5 Rape 3 7 9 Household larceny less than $50 .483 Unlawful entry .476
Moderate seasonality
Personal larceny with contact ,430 Personal larceny without
contact less than $50 .396 Aggravated assault .374 Attempted forcible entry .363
Little or no seasonality
Personal larceny without oontact $50 or more ,281
Motor vehicle theft ,281 Robbery .a84 Forcible entry 3 6 7 Simple aesault .238
Difference8 in the amount of ~so?rttonalilyfor rape and robbery Coefficient of
Peroent dlftefen~e from the mean High consfatency
Per~tlnallarceny without contact lem than $50
Nomehold laraany less than $50 .669
Moderate cowistency
Aggravated assault Attempted forcible entry Personal larceny without
contact $50 or more
Little or no oonaistency
Personal larceny with contact
Figure 5 The Seasonality of Crime Victimization 5
Seasonality and consistency for all NCS crimes
Any crime with monthly values that deviate less than 15% from its overall average is considered as not having a meaningful seasonal pat- tern. Motor vehicle theft, robbery, forcible entry, and simple assault fall into this category. These four crimes also rank toward the bottom of the consistency scale with, at most, about one-third of the total variation explained by differences between months. Personal larcenies with losses of $50 or more also show evidence of little seasonality, but their behavior is more predictable than the other four crimes.
Table 3. Seasonality and consistency for NCS crimes reported t o the ~ o l i c e
Coefficient of Seasonal
Variation Seasonality (CSV)
High seasonality
Household larceny $50 or more .725 Personal larceny with contact 3 6 3 Rape .542 Unlawful entry .514 Household larceny less than $50 .506 Simple assault .468 Aggravated assault .455
Moderate seasonality
Personal larceny without contact $50 or more .379
Attempted forcible entry .377
Little or no seasonality
Robbery .280 Motor vehicle thef t .262 Personal larceny without
contact less than $50 .243 Forcible entry .238
Coefficient of Determinati
Consistency (R?f) High consistency
Household larceny $50 or more .705
Moderate consistency
Unlawful entry 3 5 9 Simple assault .488 Personal larceny without
contact $50 or more .462 Aggravated assault .443 Household larceny less than $50 .439
Little or no consistency
Attempted forcible entry .262 Personal larceny with contact .252 Motor vehicle thef t .241 Forcible entry .200 Personal larceny without
contact less than $50 .I88 Robbery .I54 Rape .I15
Crimes reported to the police
Seasonal patterns can be examined for those crimes that are reported to the police and those that are not. Although for many crimes the amount of seasonality is similar whether or not the police were notified, there are some significant exceptions.
Considering crimes reported to the police, there are more crimes that rank as highly seasonal (seven) than was true for the total victimization category (table 3). Four are the same crimes that ranked high on total victimizations: household larceny $50 or more, household lar- ceny less han $50, unlawful entry, and rape.' In addition, both aggravated and simple assault and personal larceny with contact display highly seasonal patterns. One crime, household larceny of $50 or more, is extremely seasonal, with a CSV of .725, or an average deviation from the mean of more than 30%. I t also ranks at the top among crimes re- ported to the police in the consis- tency of its seasonal pattern from year to year. Personal larceny with contact and rape, despite high sea- sonality, rank low on the measure of consistent patterns. The other highly seasonal crimes demonstrate a moderate amount of consistency, with unlawful entry second only to the more costly household larcenies.
Personal larcenies with losses of $50 or more and attempted forcible entry display a moderate amount of seasonality in their rates of crimes reported to the police. For the lar- cenies, this is a fairly consistent pattern, but attempted forcible entry ranks low on this measure.
6 ~ o w e v c r , rape is not significantly different from the two crimes in t he moderate category.
In the little or no seasonality category are 3 of the 4 crimes that were also low on total victimiza- tions: motor vehicle theft, robbery, and forcible entry. The fourth crime is personal larceny less than $50. All four crimes rank near the bottom in the consistency of their patterns.
Table 4. Seasonality and consistency for NCS crimes not reported t o the police
Coefficient of Seasonal
Variation ~ e a s ~ n a l i t y (CSV)
High seasonality
Rape .701 Household larceny less than $50 .485 Household larceny $50 or more .478 Unlawful entry .458 Personal larceny with contact .452 Personal larceny without
contact less than $50 .445 Forcible entry .443
Moderate seasonality
Attempted forcible entry .380 Motor vehicle thef t .353
Little or no seasonality
Robbery .306 Aggravated assault .305 Personal larceny without
contact $50 or more .253 Simple assault .I44
Coefficient of Determinati
Consistency (R?f) High consistency
Personal larceny without contact less than $50 .728
Household larceny less than $50 .66O
Moderate consistency
Unlawful entry 3 8 4 Household larceny $50 or more .459 Attempted forcible entry .409
Little or no consistency
Forcible entry .338 Personal larceny with contact .300 Personal larceny without
contact $50 or more .277 Aggravated assault .229 Motor vehicle thef t .I94 Rape .I75 Robbery .I61 Simple assault .I15
6 The Seasonality of Crime Victimization
Crimes not reported to the police
There are also seven crimes that meet the test of high seasonality for those victimizations not reported to the police (table 4). Five were among those rated highly seasonal as reported cri mes: rape, household larceny more and less than $50, un- lawful entry, and personal larceny with contact. The two additions are forcible entry and personal larcenies without contact with losses less than $50. Although rape is at the top of the CSV rankings, it again falls into the low group for year-to-year con-sistency. Forcible entry and per- sonal larceny with contact also are characterized by little consistency, but they both rank higher on this measure than rape. The two noncon- tact larcenies with losses less than $50 are not only highly seasonal, but consistently so, especially perso ?Plarceny, which has the highest R value. Unlawful entry and household larceny of $50 or more place in the middle category on consistency.
There are only two crimes in the moderately seasonal range, accord- ing to the CSV, attempted for ble entry and motor vehicle theft? The former crime falls in the moderately consistent category, but the latter displays very little consistency.
Personal larcenies without contact of $50 or more and simple assault, in addition to robbery and aggravated assault, display little or no season- ality as well as a low degree of con- sistency from year to year.
7 ~ o t o rvehicle theft does not differ signifi- cantly from robbery and aggravated assault in the lowest category.
Corn parison of seasonality and consistency in crimes reported and not reported to the police
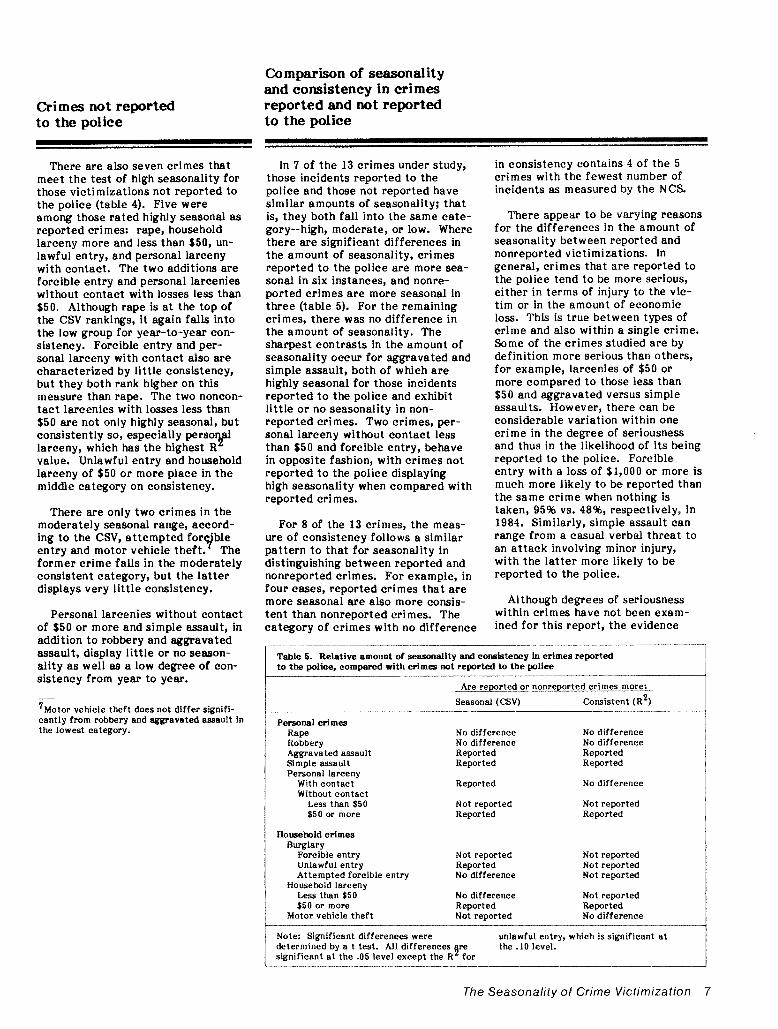
In 7 of the 13 crimes under study, those incidents reported to the police and those not reported have similar amounts of seasonality; that is, they both fall into the same cate- gory--high, moderate, or low. Where there are signif icant differences in the amount of seasonality, crimes reported to the police are more sea- sonal in six instances, and nonre- ported crimes are more seasonal in three (table 5). For the remaining crimes, there was no difference in the amount of seasonality. The sharpest contrasts in the amount of seasonality occur for aggravated and simple assault, both of which are highly seasonal for those incidents reported to the police and exhibit little or no seasonality in non- reported crimes. Two crimes, per- sonal larceny without contact less than $50 and forcible entry, behave in opposite fashion, with crimes not reported to the police displaying high seasonality when compared with reported crimes.
For 8 of the 13 crimes, the meas- ure of consistency follows a similar pattern to that for seasonality in distinguishing between reported and nonreported crimes. For example, in four cases, reported crimes that are more seasonal are also more consis- tent than nonreported crimes. The category of crimes with no difference
in consistency contains 4 of the 5 crimes with the fewest number of incidents as measured by the NCS.
There appear to be varying reasons for the differences in the amount of seasonality between reported and nonreported victimizations. In general, crimes that are reported to the police tend to be more serious, either in terms of injury to the vic- tim or in the amount of economic loss. This is true between types of crime and also within a single crime. Some of the crimes studied are by definition more serious than others, for example, larcenies of $50 or more compared to those less than $50 and aggravated versus simple assaults. However, there can be considerable variation within one crime in the degree of seriousness and thus in the likelihood of its being reported to the police. Forcible entry with a loss of $1,000 or more is much more likely to be reported than the same crime when nothing is taken, 95% vs. 48%, respectively, in 1984. Similarly, simple assault can range from a casual verbal threat to an attack involving minor injury, with the latter more likely to be reported to the police.
Although degrees of seriousness within crimes have not been exam- ined for this report, the evidence
I Table 5. Relative amount of seasonality and consistency in crimes reported t o the police, compared with crimes not reported t o the police
Are reported or nonreported crimes more:
Personal crimes Rape Robbery Aggravated assault Simple assault Personal larceny
With contact Without contact
Less than $50 $50 or more
Household erimes Burglary
Forcible entry Unlawful entry Attempted forcible entry
Household larceny Less than $50 $50 or more
Motor vehicle theft
Seasonal (CSV)
No difference No difference Reported Reported
Reported
Not reported Reported
Not reported Reported No difference
No difference Reported Not reported
Consistent (R2)
No difference No difference Reported Reported
No difference
Not reported Reported
Not reported Not reported Not reported
Not reported Reported No difference
Note: Significant differences were unlawful entry, which is significant at determined by a t test. All differences y e the .10 level. significant at the .05 level except the R for
The Seasonaiity of Crime Victimization 7
and consistency in doom reported m d not mparIed to the police
indicates that the more serious kinds of both aggravated and simple assault occur in a seasonal pattern, whereas the less serious forms of these crimes, especially simple assault, are spread relatively evenly thfoughout the year. Both amravated and simple assault occur more frequently in the warmer months when people spend more time outdoors. The data sug-gest that a disproportionately large share of these warm-weather inci-dents are of the more serious (that is, reportable) kind,
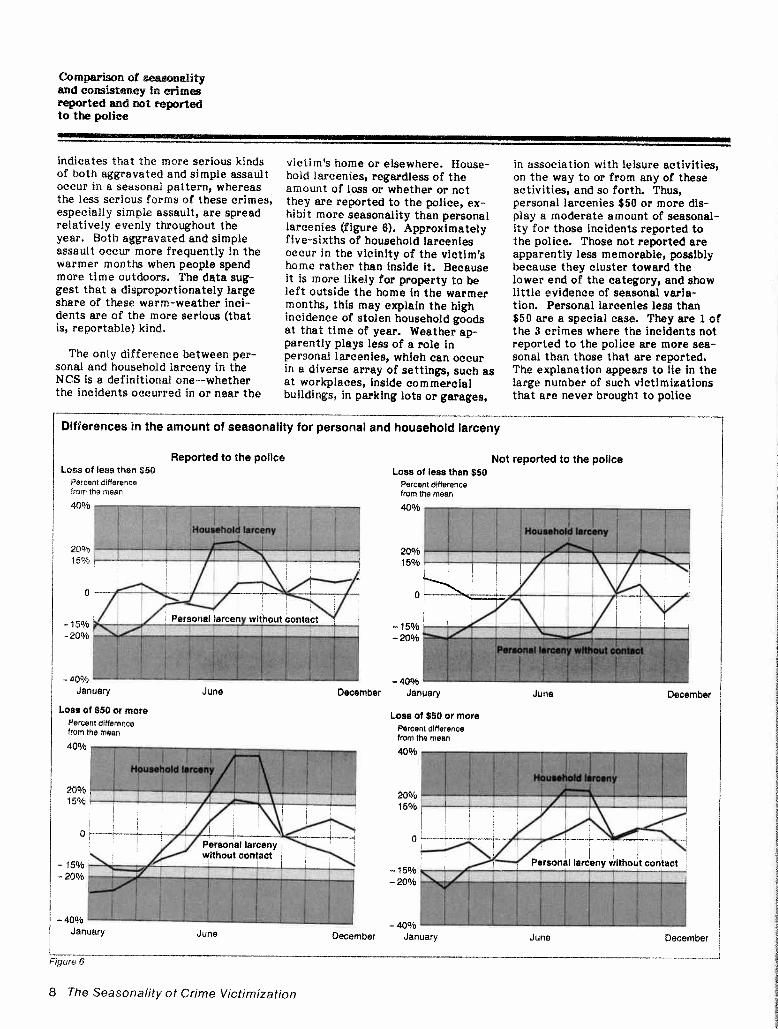
The only difference between per-sonal and household larceny in the NCS is a definitional one--whether the incidents occurred in or near the
victim's home or elsewhere. House-hold larcenies, regardless of the amount of loss or whether or not they are reported to the police, ex-hibit more seasonality than personal larcenies (figure 6). Approximately five-sixths of household larcenies occur in the vicinity of the victim's home rather than inside it. Because it is more likely for property to be left outside the home in the warmer months, this may explain the high incidence of stolen household goods at that time of year. Weather ap-parently plays less of a role in personal larcenies, which can occur in a diverse array of settings, such as at workplaces, inside commeroial buildings, in parking lots or garages,
in association with leisure activities, on the way to or from any of these activities, and so forth. Thus, personal larcenies $50 or more dis-play a moderate amount of seasonal-ity for those incidents reported to the police. Those not reported are apparently less memorable, possibly because they cluster toward the lower end of the category, and show little evidence of seasonal varfa-tion. Personal larcenies less than $50 are a special case. They are 1of the 3 crimes where the incidents not reported to the police are more sea-sonal than those that are reported. The explanation appears to lie in the large number of such victimizations that are never brought to police
Reported to the police Lose of less than $80
Percent difference from the mean
Not reported to the police Loss of less than $50
Percentdifference from the mean
I January June December January June December
LQBL of $90 01 mere Percentdlfferenc~ from the meen
I '
-40% 11I 1 i / I j
January June December
Loss of $50 or more Peroent differenoe from the mean
-40% January June December
Figure 6
8 The Seasonaiity of Crime Victimization
I
attention and in the locations where the greatest number of such crimes occurs. Approximately 7 out of 8 of these thefts are not reported to the police, and roughly one-third occur inside schools or on school property (compared to 10% for personal larce- nies of $50 or more). Thefts occur- ring on school property are frequently reported to school authorities, but seldom become matters of police con- cern. Unlike other larcenies, the peak months for personal larcenies less than $50 are in the fall at t e start of the school year. The R' statistic of .728 demonstrates that this pattern is highly consistent from year to year.
r
I Patterns of seasonality
The other two crimes that display more seasonality in incidents not reported to the police are forcible entry and motor vehicle theft. Of the 13 crimes included in this report, these are the 2 with the highest police reporting rates, 73% and 69%, respectively, in 1984. These are obviously considered by victims to be serious crimes, and most will be re- ported whenever they occur through- out the year. In the case of motor vehicle theft, 86% of completed thefts were reported to the police in 1984, but only 40% of attempted thefts became part of the police record. Attempted thefts, which dominate nonreported motor vehicle
Personal crimes
thefts, are apparently more ~ e a ~ o n a l , but the pattern from year to year is highly variable. Nonreported forci- ble entries, which are largely situa- tions where little or nothing of value is taken, are in the highly seasonal category.
8
Household crimes 1
, Reported crimes At or near Above elo ow Reported crimes Below At or near Above E
L
L I
Aggravated Iassault I
Slmple assault I* I * I l-
1 1 l 1
-1
e
1
Forcible entry
Unlawful entry
Attempted forcible entry
Household larceny less than $50
I I
Personal larceny wlth contact C I I . I ! Z ~ = - ~ ~ . ~ . ~ $50 or more
wlthout contact lass than 850 E--- Motor vehlcle
theft wlthout contact
850 or more Jan. Mar. May July Sept. Nov.
Jm Mar. May July Sept. Nov, Fab. Apr. June Aug, Qct, Befi,
Peb, Apr. June Aug. Oot. Dec.
Not reported orlmer Below Abcve At or near Not reported orlmsr elo ow Above At or near everage average average
Rape
Robbery [. . - . - . . - - - .. . m
Aggravated C------I--....
--. .-
--.---. -. . .. ...-..
.
.
. . .
---. .
-. -.-
-.
. .
---..-1--.,sault * -. *. 1.. T -.... . . 1
- - ."- - -- .--pa-SImplo as~ault -r--.'n -_I-- -. -. -__._
Personal larceny -.--.-.-.. ..
with contact K- . -- .. I:-: 'LI.:IZlZl wlthout contact r r X - - - ----
leas lhan $50 - -. ...--wlthout contact
850 or more
averaoe
Forolblr entry
Unlawful entry rz Attempted
forclblm entrv
Household larceny less than $50
Houlehold larceny $50 or more
Motor vehicle theft- .
I l l l I i l l l l l l J Jan Mar May July Sept Nov
Feb Apr June Aug Oct Dec Jan Mar May July Sept Nov
Feb Apr June Aug Oct Dec I
'skgntlcant at the 10 level I-- -- - - - - - - -- 1
Figure 7
The Seasonality of Crime Victimization 9
1
1
Patterns of seasonality
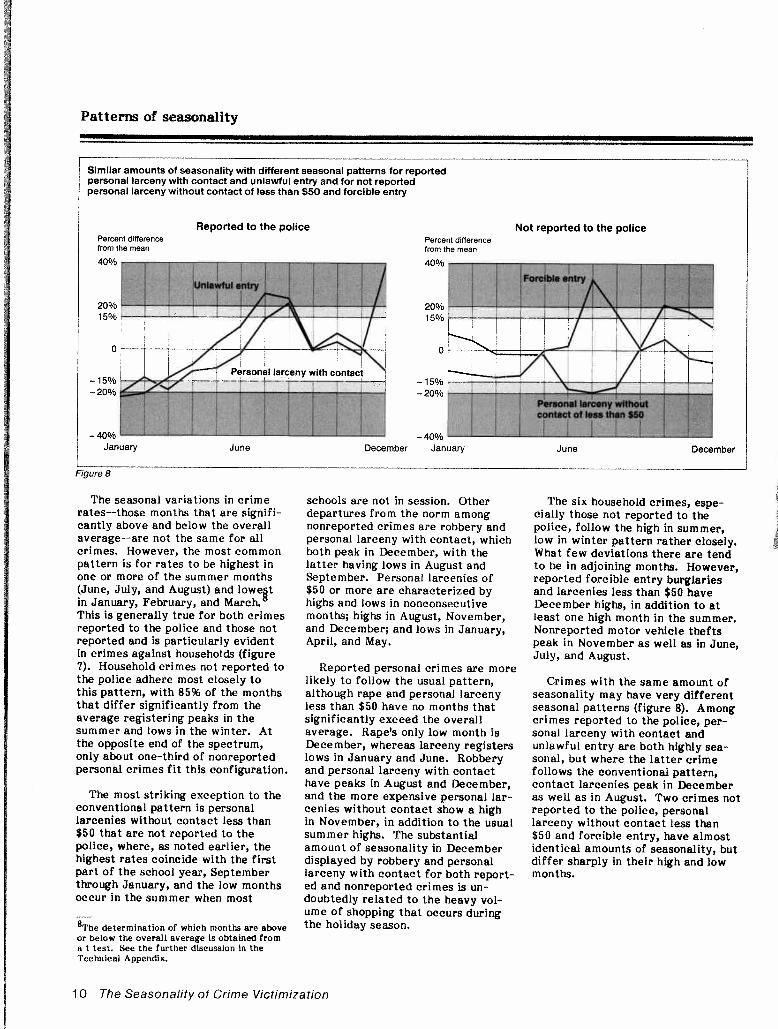
Similar amounts of seasonalitywith different seasonal patterns for reported personal larcenywith contact and unlawful entry and for not reported personal larcenywithout contact of less than $50 and forcible entry
Reported to the police Not reported to the police Percent dtfference Percent dtfference from the mean from the mean
December January
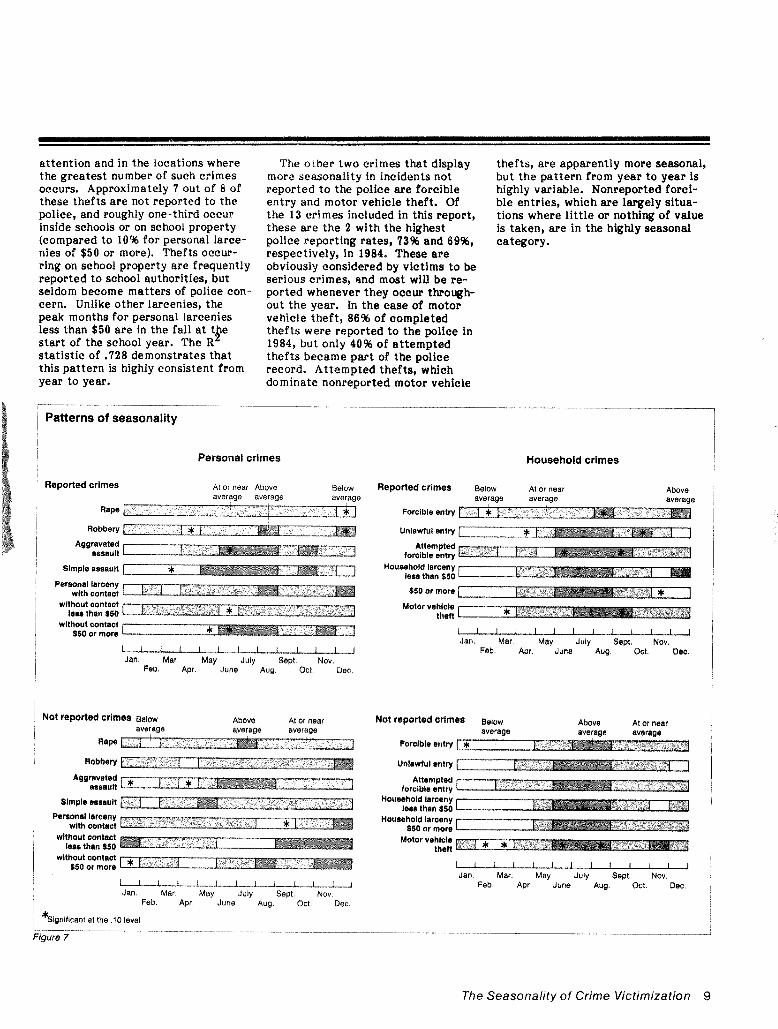
The seasonal variations in crime schools are not in session. Other The six household crimes, espe-rates--those months that are signifi- departures from the norm among cially those not reported to the cantly above and below the overall nonreported crimes are robbery and police, follow the high in summer, average--are not the same for all personal larceny with contact, which low in winter pattern rather closely. i crimes. However, the most common both peak in December, with the What few deviations there are tend pattern is for rates to be highest in latter having lows in August and to be in adjoining months. However, one or more of the summer months September. Personal larcenies of reported forcible entry burglaries (June, July, and August) and lowe t $50 or more are characterized by and larcenies less than $50 have in January, February, and March. ' highs and lows in nonconsecutive December highs, in addition to at This is generally true for both crimes months; highs in August, November, least one high month in the summer. reported to the police and those not and December; and lows in January, Nonreported motor vehicle thefts reported and is particularly evident April, and May. peak in November as well as in June, in crimes against households (figure July, and August. 7). Household crimes not reported to Reported personal crimes are more the police adhere most closely to likely to follow the usual pattern, Crimes with the same amount of this pattern, with 85% of the months although rape and personal larceny seasonality may have very different that differ significantly from the less than $50 have no months that seasonal patterns (figure 8). Among average registering peaks in the significantly exceed the overall crimes reported to the police, per-summer and lows in the winter. At average. Rape's only low month is sonal larceny with contact and the opposite end of the spectrum, December, whereas larceny registers unlawful entry are both highly sea-only about one-third of nonreported lows in January and June. Robbery sonal, but where the latter crime personal crimes f i t this configuration. and personal larceny with contact follows the conventional pattern,
have peaks in August and December, contact larcenies peak in December The most striking exception to the and the more expensive personal lar- as well as in August. Two crimes not
conventional pattern is personal cenies without contact show a high reported to the police, personal larcenies without contact less than in November, in addition to the usual larceny without contact less than $50 that are not reported to the summer highs, The substantial $50 and forcible entry, have almost police, where, as noted earlier, the amount of seasonality in December identical amounts of seasonality, but highest rates coincide with the first displayed by robbery and personal differ sharply in their high and low part of the school year, September larceny with contact for both report- months. through January, and the low months ed and nonreported crimes is un-occur in the summer when most doubtedly related to the heavy vol-
ume of shopping that occurs during-
he determinatton of which months are above the or below the overall average is obtained from a t test. See the further discussion in the Technical Appendix.
10 The Seasonaltty of Crtme V~cttmlzat~on
I
Technical appendix
This report on seasonality in crime differs in a number of ways from the 1980 report, Crime and Seasonality. Twelve years of data were used in- stead of 5. Rape, personal larceny with contact, and attempted forcible entry were added to the crimes studied. Four crimes, whose sub- categories have been separately ana- lyzed in this report, were eliminated (assault, personal larceny without contact, burglary, and household larceny). In addition to examining the seasonal movement of all victim- izations for a particular crime, separate analyses were made of crimes reported to the police and those not reported. Two analytical techniques were used that, in addi- tion to describing seasonal patterns, made it possible to determine differ- ences in the amount of seasonality among the various crimes and in the consistency of seasonal patterns over time.
The two measures of seasonality used in this report, the Coefficient of Seasonal Variation (CSV) and Coefficient of Determination (R fLh"), are both derived from a multiple regression model and assume a linear relationship between the independent and dependent variables. The months of the year and a trend variable con- stitute the independent variables in the regression equation. Month is expressed as a dummy variable, with September left out of the equation because for most crimes it is the month with victimization rates that are closest to the annual average. The dependent variable is the month- ly victimization rate for each crime over the 12-year period 1973 through 1984. Thus, the mode1 represents each month's effect on the victimi- zation rate for a given crime, with an adjustment for any trend that may be present in the series.
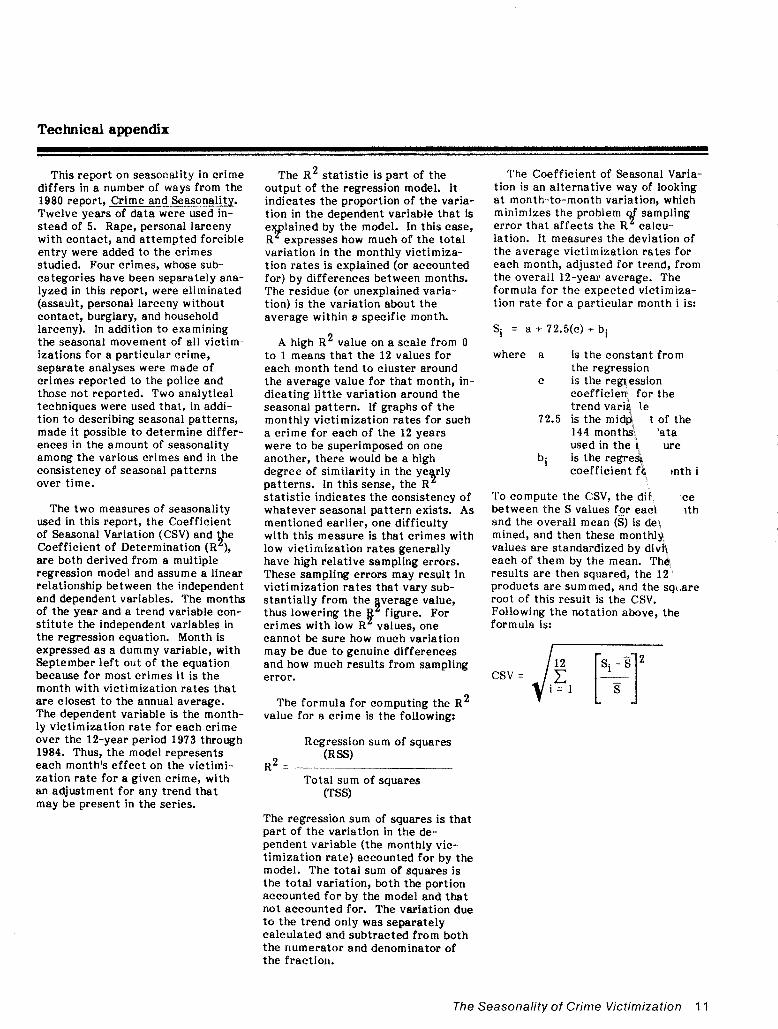
The R2 statistic is part of the output of the regression model. It indicates the proportion of the varia- tion in the dependent variable that is elplained by the model. In this case, R expresses how much of the total variation in the monthly victimiza- tion rates is explained (or accounted for) by differences between months. The residue (or unexplained varia- tion) is the variation about the average within a specific month.
A high R2 value on a scale from 0 to 1 means that the 12 values for each month tend to cluster around the average value for that month, in- dicating little variation around the seasonal pattern. If graphs of the monthly victimization rates for such a crime for each of the 12 years were to be superimposed on one another, there would be a high degree of similarity in the ye rly 9patterns. In this sense, the R statistic indicates the consistency of whatever seasonal pattern exists. As mentioned earlier, one difficulty with this measure is that crimes with low victimization rates generally have high relative sampling errors. These sampling errors may result in victimization rates that vary sub- stantially from the verage value, thus lowering the Bf figure. For crimes with low R values, one cannot be sure how much variation may be due to genuine differences and how much results from sampling error.
The formula for computing the R~ value for a crime is the following:
Regression sum of squares (RSS)
R2 = Total sum of squares
(TSS)
The regression sum of squares is that part of the variation in the de- pendent variable (the monthly vic- timization rate) accounted for by the model. The total sum of squares is the total variation, both the portion accounted for by the model and that not accounted for. The variation due to the trend only was separately calculated and subtracted from both the numerator and denominator of the fraction.
The Coefficient of Seasonal Varia- tion is an alternative way of looking at month-to-month variation, which minimizes the problem sampling error that affects the R calcu-lation. It measures the deviation of the average victimization rates for each month, adjusted for trend, from the overall 12-year average. The formula for the expected victimiza- tion rate for a particular month i is:
where a is the constant from the regression
c is the regression coefficien for the trend varig le
72.5 is the midp t of the 144 months 'ata used in the r ure
bi is the regrea coefficient fe )nth i
To compute the CSV, the dif ~ c e between the S values f_or eacl ~ t h and the overall mean (S) is dei mined, and then these monthlg, values are standardized by divfr each of them by the mean. Tha results are then squared, the 12 products are summed, and the sqi'are root of this result is the CSV. Following the notation above, the formula is:
The Seasonality of Crime Victimization 1 1
Teohnioal appendix
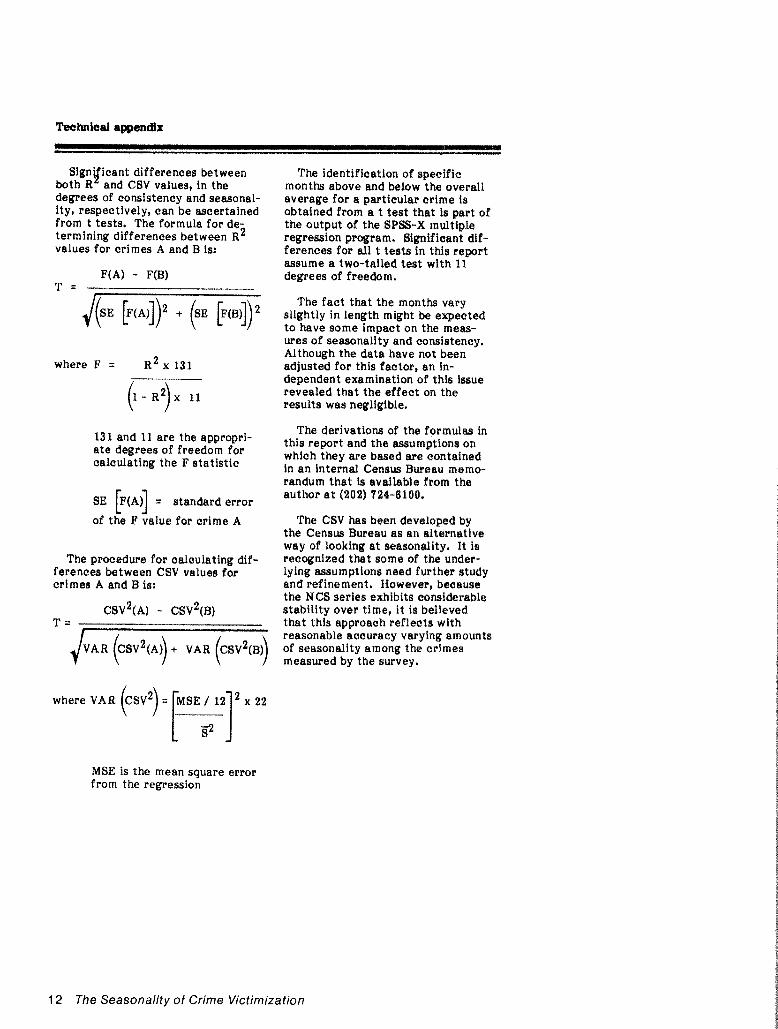
Signyicant differences between both R and CSV values, in the degrees of consistency and seasonal- ity, respectively, can be ascertained from t tests. The formula for de- termining differences between R2 values for crimes A and B is:
where F = R 2 x 131
131 and 11 are the appropri- ate degrees of freedom for calculating the F statistic
= standard error
of the F value for crime A
The procedure for odculating dif- ferences between C8V values for crimes A and B is:
The identification of specific months above and below the overall average for a particular crime is obtained from a t test that is part of the output of the SPBS-X multiple regression program. Significant dif- ferences for all t tests in this report assume a two-tailed test with 11 degrees of freedom.
The fact that the months vary slightly in length might be expected to have some impact on the meas- ures of seasonality and comistency, Although the data have not been adjusted for this factor, an in- dependent examination of this issue revealed that the effect on the results was negligible.
The derivations of the formulas in this report and the assumptions on which they are based are contained in an internal Census Bureau memo- randum that is available from the author a t (202) 724-6100,
The CSV has been developed by the Cenew Bureau as an slternative way sf looking at seassndity. It is recognized that some of the under- lying assumptions need further study and refinement. However, because the NCS series exhibits considerable stability over time, it fa believed that this approach reflects with reasonable accuracy varying amounts of seasonality among the crimes measured by the survey.
where VAR (C S V ~= MSE / 12 1-1 ) x 22
MSE is the mean square error from the regression
12 The Seasonality of Crime Victimization


![Seasonality PM Group[1]](https://img.pdfslide.us/doc/110x75/577cd3441a28ab9e789703ef/seasonality-pm-group1.jpg)
