Embed Size (px)
Citation preview

The Search for Peer Firms: When Do Crowds Provide Wisdom?
Charles M.C. Lee Paul Ma Charles C.Y. Wang
Working Paper 15-032
Working Paper 15-032
Copyright © 2014, 2016 by Charles M.C. Lee, Paul Ma, and Charles C.Y. Wang
Working papers are in draft form. This working paper is distributed for purposes of comment and discussion only. It may not be reproduced without permission of the copyright holder. Copies of working papers are available from the author.
The Search for Peer Firms: When Do Crowds Provide Wisdom?
Charles M.C. Lee Stanford University
Paul Ma University of Minnesota
Charles C.Y. Wang Harvard Business School

The Search for Peer Firms:When Do Crowds Provide Wisdom?∗
Charles M.C. LeeStanford University
Graduate School of Business
Paul MaUniversity of Minnesota
Carlson School of Management
Charles C.Y. WangHarvard Business School
November 2nd, 2016
Abstract
In knowledge-based economies, many businesses enterprises defy traditional indus-try boundaries. In this study, we evaluate six “big data” approaches to peer firmidentifications and show that some, but not all, “wisdom-of-crowd” techniques per-form exceptionally well. We propose an analytical framework for understandingwhen crowds can be expected to provide wisdom and show, theoretically and em-pirically, that their efficacy is related to crowd sophistication and task complexity.Consistent with this framework, we find that a “crowd-of-crowds” approach, whichcombines EDGAR user co-searches and analyst co-coverage, dominates other state-of-the-art methods for identifying investment benchmarks.
JEL: D83, G11Keywords: peer firm, performance benchmarking, EDGAR co-search, analyst co-coverage, wisdom of crowds, crowd of crowds
∗The authors can be contacted at [email protected], [email protected], [email protected]. We have benefited from advice and suggestions from Santiago Baz-dresch, Alan Benson, Ryan Buell, Kai Du, Akash Chattopadhyay, Paul Healy, Boris Groysberg, AndrewJing Liu, Daniel Malter, Colleen Manchester, Miguel Minutti-Mezza, Tatiana Sandino, Aaron Sojourner,Pian Shu, Martin Szydlowski, Akhmed Umyarov, Joel Waldfogel, Aaron Yoon, and seminar participantsat Bloomberg Research Labs and the National University of Singapore. We are grateful to discussantsDirk Black and Zhaoyang Gu at the AAA annual meeting and the MIT Asia Conference respectively.We also thank Scott Bauguess at the Securities and Exchange Commission for assistance with theEDGAR search traffic data, and Kyle Thomas for outstanding research assistance. All errors remainour own. Data on search-based peers and analyst co-coverage peers are available upon request.

The Search for Peer Firms 1
1. Introduction
Academic researchers and corporate managers often need to identify peer firms for eco-
nomic benchmarking purposes. For example, peer firms’ market-based pricing multiples
are frequently applied to a base firm’s fundamental variables to derive an estimate of the
latter’s value to investors. These multiple-based valuations are ubiquitous in investment
bankers’ fairness opinions and in sell-side analysts’ reports. They are also commonly used
in pricing initial public offerings (IPOs), leveraged buyouts, mergers and acquisitions, and
other business investments.1 In academic research, peer firms frequently serve as coun-
terfactuals to help evaluate some aspect of a base firm’s operating performance and/or
valuation. For examples, in executive compensation analysis, peer firms are helpful in
inferring whether an outcome is more attributable to luck or skill.2 Likewise, in asset
pricing, peer firms are used to control for returns earned by economically-similar compa-
nies over a given time period.3 In these and many other settings, the central challenge
is to objectively and judiciously select a group of economically comparable peer firms.
Despite the widespread usage of peer firms, very little academic research is available to
guide their selection. Some financial practitioners even suggest that the choice of com-
parable firms is “an art form” that should be left to valuation/investment professionals.4
Nevertheless the aura of mystique that surrounds the peer selection process is discom-
forting from a scientific perspective. In fact, the degree of subjectivity often involved in
peer selection can ultimately serve to undermine the credibility of peer-based pricing as
a serious alternative in equity valuation. In this study, we conduct a systematic eval-
uation of a number of novel peer identification solutions that are currently available to
1See, for example, DeAngelo (1990); Alford (1992); Kaplan and Ruback (1995); Kim and Ritter (1999);Liu, Nissim, and Thomas (2002); Bhojraj and Lee (2002); Damodaran (2012).
2For example, Antle and Smith (1986); Albuquerque (2009); Gong, Li, and Shin (2011); Dikolli,Hofmann, and Pfeiffer (2013); Jenter and Kanaan (2015); Lewellen (2015); Ma, Shin, and Wang (2016).
3Key studies that popularized characteristic-based benchmarking in asset pricing include Daniel,Grinblatt, Titman, and Wermers (1997) and Barber and Lyon (1997).
4For example, Golz.Jr (1986) and Woodcock (1993).

The Search for Peer Firms 2
researchers and corporate managers. Unlike traditional benchmarking techniques that
rely primarily on industry groupings, many of these new approaches bring “big data”
methodologies to bear on this age-old problem. We summarize these new approaches and
evaluate their efficacy in explaining out-of-sample variations in base firms’: (a) stock re-
turns, (b) valuation multiples, (c) growth rates, (d) leverage, and (e) profitability ratios.
We consider six peer identification schemes. Three of these approaches, which we collec-
tively refer to as Product-Market Schemes, are based on similarities in firms’ products
markets or business operations; three other approaches, which we collectively refer to as
Wisdom-of-Crowd Schemes, feature algorithms that extract latent intelligence from
the actions of multiple investors or market participants. As a point of reference, we
compare the performance of these six candidate schemes to the performance of the peers
identified using six-digit industry codes from the Global Industry Classification Scheme
(GICS6).5 The three Product Market Schemes we consider are: Capital IQ (“CIQ”),
Google Finance (“GOOG”), and Text Network Industry Classification (“TNIC”). CIQ
and GOOG are commercially available peer groupings. Capital IQ constructs its peer
firm list (CIQ) by culling the self-reported set of competitors from base firms’ regulatory
filings.6 Google identifies its list of“related companies”using a proprietary algorithm that
includes input from a detailed product-market database.7 Finally, TNIC is a scheme for
identifying product market competitors, developed by Hoberg and Phillips (2010, 2014)
based on analyzing textual similarities in companies’ 10-K business descriptions. The
three Wisdom-of-Crowd Schemes we examine are: Analyst Co-Coverage Peers (“ACP”),
Search-based Peers (“SBP”), and Yahoo Finance Peers (“YHOO”). Lee, Ma, and Wang
5Bhojraj, Lee, and Oler (2003) show GICS is the best performing Industry Classification Scheme forpeer identification. Specifically, they show that GICS outperforms SICS codes, NAICS codes, and Famaand French (1997) industry classification codes. We therefore use GICS as a point of reference in ourtests.
6Studies that use versions of Capital IQ peers include Rauh and Sufi (2012) and Lewellen (2015).7Google Finance provides this list of “related companies” on the web page for each base company.
These peer firms are not identical to co-search-based peers identified by Google Knowledge Graph. Ourunderstanding is this list is at least partially based on input from Fact Set Research (previously RevereData), a supplier of detailed product-by-product data on market competitors.

The Search for Peer Firms 3
(2015) (heretofore LMW) identified the SBP firms using investors’ information co-search
patterns on the Securities and Exchange Commission’s EDGAR website.8 ACP identifies
economically-related peers on the basis of shared co-coverage (or being co-covered) by
the same sell-side analysts (Ramnath, 2002; Israelsen, 2016, Forthcoming; Kaustia and
Rantala, 2015; Muslu, Rebello, and Xu, 2014). Finally, YHOO consists of peers identi-
fied using co-searched ticker symbols on Yahoo Finance (Leung, Agarwal, Konana, and
Kumar, 2013). All six candidate schemes are described in detail in the Appendix. Our
study proceeds in two stages. In the first stage, we run a “horse race” between these six
peer identification schemes and present large-sample empirical evidence on their perfor-
mance. Our results show the two top-performing peer identification algorithms, in rank
order, are SBPs and ACPs. In particular, among S&P1500 base firms, SBPs registered a
median improvement of 56.6% over GICS6 peers, in explaining cross-sectional variations
in base firm’s next year stock returns and financial ratios. In similar comparisons, ACPs
registered a median improvement of 35.5% over GICS6. In contrast, the Product Market
Peers (CIQ, GOOG, and TNIC) generally performed on par with, or worse than, the
GICS6 peers. Interestingly, YHOO peers - those whose information are most commonly
co-searched with the base firms’ on Yahoo Finance - perform quite poorly. In sum, two of
the wisdom-of-crowd approaches (SBP and ACP) strongly outperform while one sharply
underperforms. The stark difference in the performance of the three crowd-based algo-
rithms (SBP, ACP, and YHOO) motivates the second stage of this study. In this second
stage, we use the peer identification setting to address a common question from the “wis-
dom of crowds” literature: when does information aggregation across a heterogeneous
population of agents lead to better decisions? To provide intuition, we develop a simple
model of aggregated co-search (co-coverage) decisions. The model features a population
of agents, each of whom receives a private signal on the similarity between the base firm
8Specifically, LMW computed a “co-search fraction”, which captures the share of co-searches of thebase firm owned by each peer firm. Their results show peer firms with the highest co-search fraction aremost similar to the base firms on multiple dimensions.

The Search for Peer Firms 4
and the candidate peer firm. In the context of this model, we show that the usefulness
of information aggregation will depend on the precision of investors’ signals about the
firm, due to either (a) the inherent sophistication/skill of the set of individuals involved
(e.g., retail vs. professional investors) or (b) the complexity of the task at hand (e.g.,
information environment of the firm). The model makes two primary predictions. First,
the degree of crowd agreement about a base firm’s best peers will be higher (i.e., higher
co-search or co-coverage fractions) when investors receive more precise signals about the
firm, either because the investors are more sophisticated or because the firms are relatively
easy to analyze. Second, the performance of peers firms identified from wisdom-of-crowd
approaches will improve when the crowd is more sophisticated in relation to the task
at hand. We find empirical support for these theoretical predictions. Using three base
firm characteristics as proxies for the average signal precision of investors’ beliefs, we find
that the degree of intra-crowd agreement, as measured by the co-search or co-coverage
fractions, (a) increases with the size of the base firm, (b) decreases with its number of
operating segments, and (c) increases with the base firm’s investor and analyst attention.
Moreover, we show that the peers identified by aggregating the wisdom of investment
crowds are more effective when the crowd is more sophisticated and when the informa-
tion environment of the firm is better. The fact that ACPs and SBPs perform so well
and YHOO peers do not, is also consistent with the model’s prediction that the noisier
the agents’ signal (or the lower their sophistication) the less informative are co-search (or
co-coverage) fractions. Prior research suggests YHOO are likely generated by searches of
retail investors (Lawrence, Sun, Ryans, and Laptev, 2016, Forthcoming), while analyst
co-coverage and EDGAR co-search patterns reflect the revealed decisions of relatively
more sophisticated agents (sell-side stock analysts and EDGAR users). The model also
provides a framework for understanding information aggregation across disparate crowds
(i.e. the factors that affect “inter-crowd” agreement). We use this framework to ana-
lyze how the degree of agreement between EDGAR users (SBPs) and analysts (ACPs)

The Search for Peer Firms 5
varies as a function of base firm characteristics. Findings from prior studies suggest the
information contained in ACPs is unlikely to be fully subsumed by SBPs.9 Broadly speak-
ing, SBPs reflect the choices of buy-side participants (investors) while ACPs reflect the
choices of sell-side analysts. Consistent with model predictions, we show that the level
of inter-crowd agreement between EDGAR users and sell-side analysts, as reflected in
the similarities between ACPs an SBPs: (a) increases with the size of the base firm, (b)
decreases with its number of operating segments, and (c) increases with the base firm’s
investor and analyst attention. Finally, we create a composite solution for identifying
economically related firms by combining the two best performing algorithms (SBP and
ACP). The model suggests this “crowd-of-crowds” approach could further improve the
identification of investment peers, particularly when agents have relatively noisy signals
about firms. Indeed, we find that the combination of top peer firms from both SBP and
ACP outperforms SBPs significantly. For example, their combination explains 22.1% of
the out-of-sample cross-sectional variation in returns for the S&P500 base firms, which
compares quite favorably to the GICS6 peers, who are only able to explain 14.2% of the
return variation. The composite peer performance is also significantly better than each
of the two individual schemes (SBP or ACP) operating on a standalone basis. Notably,
the improvement in performance from composite peers is concentrated among smaller
firms, where the information environment is relatively poor and investors have less pre-
cise signals. Taken together, our results provide a compelling case for the broader use
of “wisdom of crowd” techniques in identifying economically-similar firms for investment
purposes. Our analyses show that the efficacy of this approach will depend on the intrin-
sic sophistication of the individuals in the population (i.e., the inherent level of collective
wisdom attainable through sampling), and the quality and complexity of the information
9In particular, prior studies show sell-side analysts’ stock recommendations tend to favor larger growthfirms with glamor characteristics (Jegadeesh, Kim, Krische, and Lee, 2004). At the same time, due toresource constraints (Peng and Xiong, 2006; Van Nieuwerburgh and Veldkamp, 2010), sell-side analyststend to specialize by industries or sectors, and are less likely to cover stocks with widely-diverging businesseconomics (Liang, Riedl, and Venkataraman, 2008; Groysberg and Healy, 2013; Brown, Call, Clement,and Sharp, 2015).

The Search for Peer Firms 6
environment surrounding the firm. For the moment, it would appear that the state-of-
the-art benchmarking methodology is one that combines firms identified as SBPs and
ACPs. To assist future researchers, we have created a complete database of these top-
performing peers (combining SBP and ACP) for each base firm in the S&P1500. This
database is available upon request. Our work is directly related to a growing literature in
financial economics that uses “big data” methodologies to improve economic benchmark-
ing (Hoberg and Phillips, 2014; Lewellen, 2015; Rauh and Sufi, 2012; Leung, Agarwal,
Konana, and Kumar, 2013; Kaustia and Rantala, 2015; Lee, Ma, and Wang, 2015). A
glaring gap in this literature is the absence of a direct comparison of these state-of-the-art
peer identification schemes. We provide this benchmarking exercise by bringing together
a number of disparate approaches and testing them on a comprehensive set of performance
metrics.
Our work is also related to two prior studies Bhojraj, Lee, and Oler (2003) and Lee,
Ma, and Wang (2015) that used the same performance tests to evaluate peer identifica-
tion schemes. In Bhojraj, Lee, and Oler (2003), these tests were used to compare the
performance of alternative Industry Classification Algorithms. In Lee, Ma, and Wang
(2015), these tests were used to evaluate the performance of SBP peers. We extend
these two studies by: (a) examining a comprehensive set of “big data” peer identification
schemes, (b) developing a model of efficient information aggregation across crowds, (c)
providing empirical evidence on crowd/task attributes that impact information aggrega-
tion, and (d) designing a “crowd-of-crowds” solution to the peer identification problem
and showing that it significantly outperforms other methods. Our paper helps explain
seemingly disparate findings in Antweiler and Frank (2004)and Chen, De, Hu, and Hwang
(2014). Both papers aggregate user-generated content on Internet websites to predict fu-
ture stock returns - with varying success. Chen, De, Hu, and Hwang (2014) find that
aggregated user-generated articles on Seeking Alpha predict both future stock returns
and earnings surprises. Antweiler and Frank (2004) find a statistically significant but

The Search for Peer Firms 7
economically insignificant result by aggregating user-content from Yahoo and Raging
Bull’s message boards. Consistent with our results and model, aggregated content from
Seeking Alpha, an arguably more sophisticated user base, were more informative of future
outcomes than aggregated content from Yahoo and Raging Bull. More broadly, our paper
also contributes to an interdisciplinary literature on the wisdom of the crowds. Across
many diverse scientific fields, researchers have been attempting to harness the wisdom
of crowds with varying success (Simmons, Nelson, Galak, and Frederick, 2011; Lorenz,
Rauhut, Schweitzer, and Helbing, 2011; Muchnik, Aral, and Taylor, 2013; Mollick and
Nanda, 2015). More recently in accounting and finance, researchers have crowd-sourced
earnings estimates (Jame, Johnston, Markov, and Wolfe, 2016) and even forecasted stock
returns from Twitter feeds (Azar and Lo, 2016). In most of these settings, it is difficult
to objectively measure the value added by crowd-based solutions. However, in the peer
identification setting, we are able to deploy a set of performance metrics that quantify
the improvement from crowd-based results. We are also able to provide some prelimi-
nary insights on which crowd/task attributes have a significant impact on the efficacy of
crowd-based solution. The question of crowd efficacy has been of open interest in a wide
range of fields including the study of fantasy baseball selection (Goldstein, McAfee, and
Suri, 2014), identification of early stage cancer from medical imagery (Kurvers, Herzog,
Hertwig, Krause, Carney, Bogart, Argenziano, Zalaudek, and Wolf, 2016), and the qual-
ity of general knowledge (Wikipedia) vs expert journalists (Greenstein and Zhu, 2014).
Like us, these papers also find that crowd sophistication and task complexity are critical
to its efficacy. To our knowledge, we are the first study to explore financial economic
data and provide such insights into this growing field. We caveat that the wisdom-of-
crowd approach examined in this paper may not be appropriate in certain peer-selection
contexts. For example, for purposes of identifying product market competitors, alterna-
tive approaches, such as TNIC, may be more suitable. Nevertheless, our work provides
a practical solution to the peer identification problem faced by a broad set of financial

The Search for Peer Firms 8
professionals. In particular, the union set of SBP and ACP firms represents an objec-
tively selected and highly effective peer group for investment and performance evaluation
decisions. In addition, these wisdom-of-crowd peers can also help in research settings
that involve performance benchmarking. Recently, for example, Ma, Shin, and Wang
(2016) examined the efficacy of the benchmark peers chosen by firms that practice ex-
plicit relative performance evaluation (RPE), by comparing the extent to which RPE
benchmarks explains the common component of firm returns relative to SBPs (i.e., a
normative benchmark).10 The remainder of the paper is organized as follows. We begin
in Section 2 with an analysis of the performance of the various classification schemes rel-
ative to six-digit GICS. In Section 3, we provide an analytical framework to understand
conditions under which wisdom of the crowds will lead to better peer identification and
testable implications. Section 4 investigates the empirical implications of the model with
respect to both the degree of intra-crowd agreement (within ACPs and SBPs) and also
inter-crowd agreement (SBP vs ACPs) and provides evidence on the performance of a
composite revealed-choice-based benchmarking solution. Section 5 concludes.
2. Comparing Alternative Benchmarking Schemes: Prod-
uct Market vs. Wisdom of Investment Crowds
We begin by assessing the relative performance of two broad classes of benchmark-
ing schemes: product-market-based and wisdom-of-the-crowd-based. All six candidate
schemes employ some form of “big data” methodology. Together, they represent the
frontier of peer identification schemes proposed by both industry and academia.
10A central prediction of performance-based contracting models is that the principal should design con-tracts that filter out common shocks to performance i.e. that are outside the CEO’s control. (Holmstrom,1979).
The Search for Peer Firms 9
2.1. Benchmarking Candidates
We consider three state-of-the-art product-market-based approaches to identifying
peers. The first candidate comes from Capital IQ (CIQ), who identifies firms’ product
market competitors named in SEC disclosures. In particular, CIQ collects the set of
companies that a given firm i considers to be its competitors (coded as “Named by Com-
pany”), as self-disclosed in the company’s SEC filings, the set of companies that considers
firm i a competitor (coded as “Named by Competitor”), as disclosed in their SEC filings,
and finally the set of firms considered to be firm i’s competitors as disclosed in third
party firms’ SEC filings (coded as “Named by Third Party”). We define a firm’s “CIQ”
peers to be those competitors who are “Named by Company” or “Named by Competi-
tor,” similar to Rauh and Sufi (2012) and Lewellen (2015). The second candidate comes
from Google Finance, who generates a list of each firm’s “Related Companies” (GOOG
peers) through a proprietary algorithm with FactSet Research’s own proprietary product-
market-based industry classification as one of its inputs. Finally, we consider the “Text
Network Industry Classification” (TNIC), developed by Hoberg and Phillips (2010) and
Hoberg and Phillips (2014). This scheme infers product market peers by analyzing and
quantifying textual similarities in firms’ self-reported business descriptions in their 10-
K filings. We also consider three wisdom-of-the-crowd approaches for identifying peers.
The first is “Search-Based Peers” (SBPs), developed by Lee, Ma, and Wang (2015), which
identifies economically related firms based on EDGAR users’ co-search patterns. The
fundamental premise of SBPs is that more frequently co-searched peer firms tend to be
more relevant investment benchmarks. This premise seems reasonable given that EDGAR
users are collectively searching for firm fundamentals to aid their investment decisions,
and that an important part of this process involves the comparison of these fundamen-
tals to economically related benchmarks. We also consider the set of peers commonly
co-searched by the users of Yahoo! Finance (“YHOO peers”). For example, when search-

The Search for Peer Firms 10
ing for Google’s information Yahoo Finance reports “People viewing GOOG also viewed
PCLN AMZN BIDU AAPL MA NFLX.” These peers are similar in concept to SBPs,
but are derived from a different population. Prior evidence shows Yahoo! Finance users
are predominately retail investors, who are likely to be less professional and sophisticated
than EDGAR users.11 Finally, we extend the idea of aggregating revealed preferences
of crowds by examining the collective wisdom of sell-side analysts. Like SBPs, Analyst
Co-Coverage Peers (ACPs) are based on the premise that the collective decisions of the
crowd—in this case, coverage of firms—are at least in part driven by, and thus informative
of, underlying economic comparability between firms.12 Our thesis is that like patterns
of co-search for firm fundamentals, aggregate patterns of analysts’ co-coverage decisions
can be informative of fundamental similarities between firms.13 The details of the data
construction for each peer identification scheme can be found in the appendix.
We compare the performance of these six “big data” schemes to that of the six-digit
Global Industry Classification System (GICS6). GICS is a product of a collaboration
between Standard & Poor’s (S&P) and Morgan Stanley Capital International. It is based
on the judgment of a team of financial analysts who group firms on the basis of their
11According to Lawrence, Sun, Ryans, and Laptev (2016, Forthcoming), “Yahoo Finance is the mostpopular web site for financial information in the U.S. with over 30 million unique daily users, the vastmajority of which are retail investors rather than professional investors.”
12In theory, analysts have an incentive to cover economically similar firms because of the reduced costof information acquisition (e.g., Peng and Xiong, 2006); empirically, research has shown that sell-sideanalysts tend to specialize in industries and cover multiple firms belonging to her primary industry ofexpertise (e.g., Liang, Riedl, and Venkataraman, 2008), and that a firm’s fundamental similarity to theanalyst’s existing coverage portfolio is an important aspect of his decision to cover a particular firmBrown, Call, Clement, and Sharp (2015). On the other hand, there can be various other factors — forexample, relating to the analysts’ incentives or brokerage house characteristics — that drive analysts’coverage decisions. Liang, Riedl, and Venkataraman (2008) documents that analysts are more likelyto cover a firm based on reasons idiosyncratic to the brokerage house: when the brokerage house hashad a recent investment banking relationship with the firm or when the firm was previously followed byanother analyst employed in but who is no longer forecasting for the same brokerage house. The evidencedocumented in Liang, Riedl, and Venkataraman (2008) and Brown, Call, Clement, and Sharp (2015) isalso consistent with the possibility that there are systematic biases in analysts’ coverage decisions: forexample, analysts are more likely to cover high growth firms or firms that have investment bankingrelationships with the analysts’ employers.
13The idea of identifying related firms based on analysts’ coverage choices have been explored inthe works of Ramnath (2002), Israelsen (2016, Forthcoming), Kaustia and Rantala (2015), and Muslu,Rebello, and Xu (2014).
The Search for Peer Firms 11
principal business activity. A number of empirical research papers have provided evi-
dence that GICS6 outperforms alternative industry classification schemes, such as the
traditional SIC or NAICS codes (Bhojraj, Lee, and Oler, 2003; Chan, Lakonishok, and
Swaminathan, 2007). Table 1 reports summary statistics of the peer sets that we col-
lected. Product-market-based peers are grouped in columns 1 to 4 while the wisdom of
investment crowd peers are grouped in columns 5 to 7. For each peer set, we report the
number of base firms in either the S&P500, S&P1000, or S&P1500 for which we have
available peer data. This number varies from peer set to peer set e.g. there are 1075
base firms with CIQ peers, but 1,465 base firms with TNIC peers. We also report the
average number of peer firms for each set. For example, there are on average 5.1 CIQ
peers, 7.7 GOOGLE peers, 79.2 TNIC peers, and 5 YHOO peers. Finally, we report the
fraction of a scheme’s peer firms which share the same six-digit GICS code as the base
firm. For example, 59% of CIQ peer firms have the same six-digit GICS code as the base
firm, 69% of GOOGLE peers, 48% of TNIC peers, 69% of ACPs, 61% of SBPs, and 28%
of YHOO. It is perhaps not surprising to learn that the product-market-based peer (CIQ,
GOOGLE, NIC) schemes appear to have greater overlap with GICS than the investment
crowd peers (ACPs, SBP, YHOO).
2.2. Return and Accounting Co-Movement Performance Tests
We begin by comparing the six peer identification schemes in terms of their usefulness
in explaining the cross-sectional variations in base firms’ stock and accounting perfor-
mance. These tests are common in the literature for assessing the fundamental similarity
and comparability between firms (Bhojraj, Lee, and Oler, 2003; Lewellen and Metrick,
2010; Lee, Ma, and Wang, 2015), and provides a useful framework for assessing the
usefulness of alternative peer classification schemes for either investment purposes or per-
formance benchmarking. Our tests estimate contemporaneous cross-sectional regressions

The Search for Peer Firms 12
of the following form:
V ari,t = αt + βtV arpi,t + εi,t, (1)
where V ari,t and V arp,t refer to the fundamental performance variable of interest over
period t for the base firm (i) and its portfolio of peers (p). We then assess the relative
performance across alternative peer schemes based on the average R2s produced from
these regressions. As noted in Lewellen and Metrick (2010) and Lee, Ma, and Wang
(2015), higher R2s reflect greater similarity and comparability between base firms and
their peer firms. Specifically, using GICS6 as the benchmark for evaluation, we assess
the relative performance of the alternative peer-identification schemes by comparing the
average R2 produced by cross-sectional regressions using benchmark portfolios of all firms
(excluding the base firm) selected from the base firms’ GICS6 industries versus the aver-
age R2 produced by portfolios of the base firms’ peers. In conducting these tests, we form
portfolios using the peer firms identified by the respective schemes. Our product market
peer candidates, GICS6, CIQ, GOOG, and TNIC, are formed based on an equal-weighted
portfolio of all of the peers that are identified by the respective schemes.14 We obtained
June 2014 snapshots of CIQ, GOOG, and YHOO peers, and conservatively applied these
peers to the years 2012 and 2013 in our tests. By contrast, GICS6, TNIC, ACP, and
SBP have data from 2003 to 2013. Following Lee, Ma, and Wang (2015), for ACP and
SBP we form a value-weighted portfolio of a base firm’s top 10 peers, weighting by the
relative magnitudes of the co-coverage and co-search fractions, respectively. We form
equal-weighted portfolios for YHOO peers since there are no natural weights to apply
as we do not observe the co-search fractions that underly Yahoo! Finance’s algorithms.
Table 2 reports the results of these tests across an array of fundamental performance
14We also considered value-weighted GOOGLE peer portfolios. Google Finance reports a rank orderingof peers based on some proprietary algorithm; our value-weighted portfolio weights each peer firm basedon the order in which it appears in Google Finance’s listing of “Related Firms.” For example, the firmthat is reported first out of ten will receive the weight of 10∑10
i=1 i= 2
11 . We find qualitatively similar
results using this value-weighted approach. We only consider equal-weighted portfolios for CIQ peerssince there is no meaningful ranking that we can observe.

The Search for Peer Firms 13
variables for the set of base firms belonging to the S&P1500 index. The first row con-
siders returns regressions, where we run cross-sectional monthly regressions using CRSP
monthly cum-dividend return for each base firm i, taken from the CRSP monthly files,
and Rpi,t is the average monthly returns for a portfolio of benchmark firms specific to base
firm i. The odd-numbered columns report the average R2 where the portfolio p consists
of peer firms identified by each of the six candidate peer identification schemes. The
even-numbered columns report the difference between the R2 produced by the various
alternative schemes named in the column header and GICS6 peers. Positive (negative)
values represent distances when the candidate scheme achieved higher (lower) R2 than
the GICS6 peers. We report in this fashion because the underlying set of common firms
to GICS6 and each scheme is different for each alternative scheme.15 The results indicate
that none of the alternative product market peer identification schemes outperform GICS6
in explaining the cross-sectional variation in base firms’ returns. In fact, CIQ and TNIC
produce R2 values that are statistically significantly lower than those by GICS6. Both
ACP and SBP significantly outperform GICS6, producing R2s that are 0.131 and 0.141
higher than those of GICS6 peers, both statistically significant at the 1% level. Inter-
estingly, the remaining wisdom-of-crowd candidate, YHOO, significantly underperforms
GICS6. Rows 2-9, Table 2, complement the above results by comparing the performance
of the alternative peer identification schemes in explaining the cross-sectional variation
in valuation multiples and financial performance ratios. To perform these additional
tests, we gather quarterly data from Compustat to compute each firm’s price-to-book
multiples (pb), enterprise value-to-sales multiples (evs), price-to-earnings multiples (pe),
returns on net operating assets (rnoa), returns on equity (roe), asset turnover (at), profit
15Lee, Ma, and Wang (2015) formed GICS6 portfolios using 10 randomly chosen GICS6 peers. Inthis study, we use all available GICS6 firms outside of the base firm. We made this choice for thefollowing reasons 1) the benchmark maps more closely to GICS6 fixed effects, 2) empirically using allpeers improves GICS performance vs 10 random peers, and 3) the traffic weighted SBPs’ performanceis stable with respect to the number of peers due to weighting and hence differences in performance areunlikely to stem from the number of peers chosen relative to GICS (see Figure 5 in Lee, Ma, and Wang(2015)).
The Search for Peer Firms 14
margins (pm), leverage (lev), and one-year-ahead realized sales growth (salesgrowth).
The exact computation of these variables (as well as all others used in this paper) is
detailed in Table 2. These additional test results suggest that, overall, none of the al-
ternative product market peer identification schemes systematically outperform GICS6
in explaining the cross-sectional variation of base firms’ fundamentals. While CIQ peers
nearly always significantly underperform, the performances of GOOG and TNIC are more
mixed, significantly outperforming GICS6 in certain variables (e.g., evs, at, pm) but sig-
nificantly underperforming in others (e.g., pb and salesgrowth). Both ACP and SBP
outperform GICS6 systematically; in fact, both significantly outperform GICS6 in all
eight fundamental variables considered. Unlike the other two wisdom-of-crowd schemes,
the performance of YHOO is mixed, significantly outperforming GICS6 in three of the
eight fundamental variables (pb,roe,lev) but significantly underperforming in four (evs,
at, pm, salesgrowth). Table 3 summarizes the overall performance of the six alternative
peer identification schemes. The odd-numbered columns report the median rank for each
scheme in terms of the % change in R2 relative to that produced by GICS6, across the
nine fundamental variables examined. The even-numbered columns report the median
% improvement in R2 over GICS6. Among the set of S&P1500 base firms, reported in
columns 1 and 2, we find that the overall best-performing peer identification schemes
are SBP and ACP, with median % improvement in R2 of 56.6% and 35.5%. The worst-
performing peer identification schemes are CIQ and YHOO, with median % improvement
in R2 of -37.8% and -14.4%. Columns 3–4 and columns 5–6 report comparable summary
of test results among the subset of S&P500 and S&P1000 base firms. These sub-sample
tests provide similar conclusions: SBP and ACP are consistently the best-performing
schemes while CIQ and YHOO are consistently the worst-performing schemes. These
results pose an interesting empirical puzzle. Wisdom-of-crowd candidates, formed by
aggregating the revealed choices of economic agents, simultaneously produced both the
best and the worst performing peers. In the remainder of the paper, we explore and an-

The Search for Peer Firms 15
alyze the conditions under which information aggregated across crowds provide wisdom
in identifying appropriate investment peers.
3. A Framework for Analyzing the Wisdom from Aggre-
gating Crowd Decisions
In this section, we propose a stylized model to provide a framework to understand
why, and under what circumstances, aggregating the collective choices (e.g., co-search)
by investors can be expected to uncover the underlying fundamental similarities between
firms as well as testable comparative statics. This model is anchored on the assumptions
that investors, who intend to make an investment decision for some base firm, are per-
forming benchmarking analyses to put the base firm’s fundamentals into context. While
the premise of the model is anchored on co-search, the intuition and predictions can be
extended to the analyst co-coverage context without loss of generality.
3.1. Model framework
There is a population of N homogeneous investors each interested in searching for
comparative firms to benchmark against base firm 0’s performance. For simplicity, assume
there are two potential candidate firms, 1 and 2, whose fundamental similarities to firm
0 are characterized by distances d1 ≥ 0 and d2 ≥ 0. Without loss of generality, assume
that firm 1 has greater similarity to the base firm 0, hence implying that d1 < d2. While
the true values of d1 and d2 are unobserved, each individual investor i receives a noisy
private signal of d1 and d2:
d1 = d1 + εi,1
d2 = d2 + εi,2 (2)

The Search for Peer Firms 16
where (εi,1, εi,2)′ ∼iid N(µ,Σ). Here, µ = (c1, c2) capture the collective biases that in-
vestors may have about d, and Σ = (σ21, σ
22, σ12) captures the covariance structure of
the investor’s signals, whose elements are assumed to be finite. After receiving the pri-
vate signals, each investor i makes a singular choice of a benchmarking firm (1 or 2) to
co-search along with base firm 0.16
3.2. Co-search fraction and comparative statics
Under this framework, investor i will pick firm 1 if and only if d1 < d2, or equivalently
when
εi,1 − εi,2 < d2 − d1. (3)
Thus for any given investor, the probability of selecting firm 1 is Φ
((d2−d1)−(c1−c2)√
σ21+σ
22−2σ12
),
where Φ is the CDF of a standard normal distribution, and (σ21, σ
22, σ12) represent the
variances of the errors and their covariance, respectively. As the sample of investors
N → ∞, the population of investors that co-search fundamentals for base firm 0 and
peer firms 1 and 2 will be equal to the following co-search fractions fi,j:
f0,1 = Φ
((d2 − d1)− (c1 − c2)√
σ21 + σ2
2 − 2σ12
), and
f0,2 = 1− Φ
((d2 − d1)− (c1 − c2)√
σ21 + σ2
2 − 2σ12
)(4)
where the co-search fraction can be interpreted as the degree of agreement between in-
vestors about which candidate peer firm is most similar to the base firm.
16We limit this choice to simplify the model but the implications are without loss of generality if thechoice set expanded to N firms.

The Search for Peer Firms 17
3.2.1. Implication 1
This basic model generates a number of insights. First, the collective wisdom of
investors reflected in the aggregated co-search fractions will capture the correct rank
ordering of the most fundamentally similar benchmarks d1 < d2 if and only if
(d2 − d1)− (c1 − c2)√σ21 + σ2
2 − 2σ12> 0 or d1 + c1 < d2 + c2 (5)
In other words, as long as investors’ biases in co-searching (e.g., from non-benchmarking
motives, informational errors, or behavioral biases), µ = (c1, c2), are order preserving,
then in large sample, investors’ aggregated search fractions reveal the correct rank order-
ing of fundamental similarities between firms. Although this assumption is not directly
testable, the next two implications, which are empirically testable, rely on this implication
being true.
3.2.2. Implication 2
A second set of implications is that, under the assumption that investors’ biases are
order preserving, the model generates a number of testable comparative statics relating
the level of the co-search fraction Φ, or the level of agreement among the crowd, to the
precision of investors’ signals about the candidate peer firms (σ21 and σ2
2). In particular,
the co-search fraction (f0,1) will be higher (i.e., more crowd agreement) when i) the degree
of fundamental dissimilarity between the two candidate peer firm (d2− d1) is higher, and
ii) investors possess greater precision of information about the base firm (i.e., a lower σ21).
In other words, there will be greater agreement among the crowd when i) one peer firm
is much more obvious of a candidate than the other peer firm (the gap between d1 and
d2 is large), and ii) when investors have better information (low σ21) about the degree of
similarity between the candidate peer firm and the base firm.17
17These results follow directly from the observation that the function in Eq. 4 is monotonic in φ.

The Search for Peer Firms 18
3.2.3. Implication 3
The last implication is that, under the assumption that investors’ biases are order pre-
serving, the noisier the investors’ signals, e.g., due to either greater task complexity (firms
with poorer information environments) or lower user sophistication (retail vs non-retail
investors), the less wisdom that can be gleaned from aggregating the crowd’s revealed
choices. This follows from the observation that the maximum sampling variation of the
co-search fraction is obtained for Φ(0) = 12.18 Thus increasing the noisiness in investors’
signals—increasing σ21 or σ2
2 and pushing Φ
((d2−d1)−(c1−c2)√
σ21+σ
22−2σ12
)towards Φ (0)—tends to in-
crease the sampling variation in the sample co-search fraction Φ, making the aggregation
less informative for identifying the best peers.
4. Empirical Evidence of Model Implications
This simple model provides a framework for understanding the relative performance
of SBP, ACP, and YHOO reported in Table 3. The fact that ACPs and SBPs perform so
well and YHOO peers do not, is consistent with the model’s prediction that the noisier
the investors’ signal (or the lower their sophistication) the less informative are co-search
(or co-coverage) fractions. Whereas YHOO peers are likely generated by a disproportion-
ate number of retail investors (Lawrence, Sun, Ryans, and Laptev, 2016, Forthcoming),
analyst co-coverage and EDGAR co-search patterns reflect the revealed decisions of rel-
atively more sophisticated sell-side stock analysts and EDGAR users. The on-average
poorer performance of SBPs, ACPs, and YHOO among small firms (S&P1000), relative
to large firms (S&P500), is also consistent with this prediction. Since investors tend to
have less precise information about smaller firms, either due to their relatively poorer
18In finite samples with N investors, the number of investors that choose firm 1, the correct bench-mark, is distributed Binomial(N ,Φ), and the observed finite sample search fraction f0,1 has a sampling
distribution with a mean of Φ and variance of Φ(1−Φ)N .

The Search for Peer Firms 19
information environment or due to a relatively low attention to such firms,19 the ag-
gregating investors’ revealed choices would be less informative. Below we consider the
model’s predictions more rigorously, by first testing the implication that co-search and co-
coverage fractions (i.e., the level of agreement in the crowd) are increasing in the precision
of investors’ signals about fundamental similarity. We then use the model’s predictions
to examine the circumstances under which the collective decisions of the crowd are most
likely to provide useful information about investment peers. Finally, having validated
the intuition provided by this model, we illustrate the efficacy of combining the wisdom
across different crowds.
4.1. Intra-Crowd Agreement and Signal Precision
In this section, we investigate Implication 2, the relationship between the degree of
intra-crowd agreement, Φ, about candidate peer firms and the precision of investors’
signals about fundamental similarity (σ2). We focus our analysis on SBPs and ACPs be-
cause we do not empirically observe Yahoo co-search fractions and because we believe the
order preserving bias assumption is more likely to hold for these two groupings given the
results in Table 3.20 Borrowing from the information uncertainty literature (Jiang, Lee,
and Zhang, 2005), we capture a firm’s information environment through the following
proxies: market capitalization, the number of 2-digit SIC-based operating segments, and
finally the amount of revealed investor or analyst attention. We conjecture that larger
firms who command investor and or analyst attention have richer information environ-
ments and therefore should result in greater crowd agreement with respect to peer firms.
In contrast, Cohen and Lou (2012) show that information concerning operationally com-
plicated firms are harder to process, and we, therefore, expect more disagreement with
19For example, Da, Engelberg, and Gao (2011) finds a positive association between abnormal GoogleTrends searches (a measure of retail investor interest) and firm size.
20In particular, if the order preserving bias did not hold, then the greater precision in investors’ signalsabout firms (i.e., large firms) the less informative would be the search fractions.

The Search for Peer Firms 20
respect to peer firms. These conjectures motivate the following regression specification:
Φi,t = β0 + β1SizeDecilesi,t−1 + β2NOperatingSegmentsi,t−1 + β3Sparsityi,t−1
+GICS2i,t + Yeart + εi,t (6)
where SizeDecilesi,t−1 refers to the within-sample decile of market cap measured at the
end of the year prior to the formation of the co-search or co-coverage fractions Φi,tfor firm
i. To be consistent with the model, we only include the closest peer’s Φ in the regres-
sion above.21 NOperatingSegmentsi,t−1 refers to the number of distinct SIC2 operating
segments as reported in the Compustat Historical Segment files, and Sparsityi,t−1 is a
dummy variable which equals 1 if the base firm in year t − 1 ranks below the 25th per-
centile in the distribution of firms, as sorted by their total number of co-searches (or total
number of analyst co-coverages). Finally, all specifications include GICS2 and year fixed
effects. Standard errors are double clustered at the firm and year level. Table 4 reports re-
sults of the empirical specification in Eq. 6. Recall that the model predicts that co-search
(co-coverage) will be increasing in the quality of the information environment— i.e. larger
firms operating a single segment. with a lower sparsity of co-search (co-coverage). Panel
A examines the determinants of the co-search fraction of the highest ranked SBP for each
base firm in the sample period. In column 1, SizeDeciles is positively and significantly
associated with co-search fraction at the 1% level. In column 2, NOperatingSegments is
negatively and significantly associated with co-search fraction at the 1% level. In column
3, SparseSBP is also negatively and significantly associated with the co-search fraction.
Finally, in column 4, all of the information uncertainty proxies are included, and again all
of the coefficients remain significant with signs consistent in the direction of the model’s
predictions. Panel B of the same table reports analogous tests explaining the co-coverage
fraction. We find similar results to Panel A in columns 1 to 3 with the exception that
21Results are qualitatively similar if we expand to the entire list of top 10 SBPs or ACPs.

The Search for Peer Firms 21
NOperatingSegements is not significant, but with the expected sign. However, when we
combine all of the determinants in column 4, each determinant is significant and signed
in the expected direction. Overall, the co-search and co-coverage fractions behave in a
way consistent with the comparative statics of the model. That is, there is more agree-
ment about benchmark firms when investors’ signals are more precise, due to either the
information environment of the firm or the inherent complexity of the firm.
4.2. Efficacy of Performance Benchmarking and Signal Precision
Implication 3 of the model states that we should find variation in the efficacy of
performance benchmarking based on the signal precision of the crowd. In particular, co-
search (co-coverage) fractions are more informative of appropriate investment peers when
the underlying precision of signals from the crowd is greater. We test this implication
by re-performing the R2 comparison in Table 2 for alternative sets of SBPs and ACPs
generated from stratifications of the crowd based on measures of signal precision. The
first dimension of signal precision we focus on is the selectiveness of co-search decisions.
We operationalize selectiveness by examining the intensity of co-search of EDGAR users.
In particular, EDGAR users whose daily number of unique pair-wise co-searches ranks
below the 95th percentile in the distribution of users, are classified as “selective”, while
those above the 99th percentile are classified as “unselective” users.22 Intuitively, unse-
lective users co-search a larger number of firms, thus each individual co-search decision
is less likely to be informative of fundamental similarity.23 Panel A of Table 5 tests for
this difference in the efficacy of SBPs across the dimension of selective vs unselective
users. Rows 1 and 2 construct SBPs conditioning on the underlying set of selective and
unselective users within the crowd. Relative to GICS6, SBPs formed from the selective
22The 95th and 99th percentile cutoffs are based on our observation that any user in the 99th percentileor above is almost certainly robotic, and any below the 95th percentile is highly likely to be human. Noneof our main results are sensitive to reasonable perturbations in these cutoff rules.
23Peng and Xiong (2006) and Van Nieuwerburgh and Veldkamp (2010) provide a model of informationacquisition behavior under search costs in a manner consistent with this line of argument.

The Search for Peer Firms 22
crowd perform 39.2% better in R2 whereas SBPs formed from the unselective crowd per-
form 49% worse. Consistent with the model, these differences are economically large
and statistically significant at the 1% level. We also examine the second dimension of
signal precision which we label as sparsity and is a measure of the degree of investors’
attention to the base firm. For each base firm-year, we calculate the number of unique
co-searches for base firm i and any other firm j. We classify base firms as sparse annually
when their annual co-search levels are in the bottom 25% of the sample distribution and
non-sparse otherwise. We interpret sparse firms as those operating in poor information
environments and hence lower signal precision in the context of the model. We find that
the performance of SBPs is 49.5% greater in R2 relative to GICS6 in the set of non-sparse
base firms. Among our sparse co-search base firm group, there is a small but statistically
insignificant difference between SBPs and GICS6 in R2. In Panel B of the same table,
we perform analog tests for analyst co-coverage. We define co-coverage selectiveness in
the same intuitive manner by classifying it based on analysts whose number of followed
firms falls below the 90% in the distribution of followed firms in a given calendar year.24
Analysts who follow more firms than the cutoff are classified as unselective. Rows 1 and
2 of Panel B indicate that selective ACPs outperform GICS by 24% whereas unselec-
tive ACPs underperform GICS6 by 14%, with both differences statistically significant.
When we examine co-coverage sparsity, which is defined in the same manner as co-search
sparsity using the 25% cut-off rule, we find that non-sparse base firm ACPs outperform
GICS6 by 42.8% whereas sparse base firms ACPs’ performance is statistically and eco-
nomically indistinguishable from GICS6. Again, these results are broadly consistent with
the predictions of the model and the findings in Panel A for SBPs. We note that these
findings are not an immediate implication of the results of Table 4. That is, the fact that
there is greater agreement among investors when their signals about firms are more pre-
cise does not imply that the resultant search fractions are necessarily more informative.
24The annual 90% cutoff ranges from 17-22 firms in our sample period. Results are qualitatively similarwhen we use alternative cutoffs such as 95%.

The Search for Peer Firms 23
If investors have (non-order-preserving) biases about firms, in particular, having more
precise signals could, in fact, lead to less informative search fractions. Thus, our results
in Table 5 suggest that, on average, the order-preserving bias assumption is met among
sell-side analysts and EDGAR users.
4.3. Inter-Crowd Agreement and Signal Precision
Having established that intra-crowd agreement within SBPs and ACPs and their ef-
ficacy for performance benchmarking is broadly consistent with the model’s predictions,
we now use the intuition gleaned from this analytical framework to analyze the usefulness
of combining different crowds: EDGAR users and sell-side analysts. The model can be
easily extended for an inter-crowd analysis, since, without loss of generality, we only need
to re-interpret the individual investor in the model as a crowd of investors. We begin
by exploring the extent to which agreements between SBPs and ACPs are associated
with the characteristics of the underlying base firm. Implication 2 of our model predicts
that agreement between the two crowds in identifying similar firms should increase in the
precision of the crowds’ signals about firm similarity. To test this prediction, we estimate
the following analog specification of Eq. 6 below:
Agree(SBP,ACP )i,t = π′Ψi,t−1 + GICS2i,t−1 + Yeart + εi,t (7)
where the new outcome variable is the degree of agreement between the top ten SBPs
and ACPs firms of a given base firm i in year t. Agree(SBP,ACP ) ranges from 0
to 1, where 0 denotes no overlap between a firm’s top 10 SBPs and top 10 ACPs and
1 denotes 100% overlap.25 Ψi,t is vector of identical base firm characteristics used in
Table 4 such as SizeDeciles, NOperatingSegments, SparseACP, and SparseSBP. Table
6 reports estimates of Eq. 7. In column 1, SizeDecilesi,t−1 is positively and signifi-
25However, the rank ordering of the peers need not be identical across the two peer identificationschemes.
The Search for Peer Firms 24
cantly associated with agreement between ACPs and SBPs at the 1% level. In column 2,
NOperatingSegmentsi,t−1 is negatively and significantly associated with agreement. In
column 3, both SparseSBPi,t−1 and SparseACPi,t−1 are negatively and significantly as-
sociated with agreement. Finally, when we include all proxies of information uncertainty
and task complexity in column 4, the coefficients each remain significant with signs in the
expected directions. These results are broadly consistent with the results in Table 4 and
provide further evidence about the behavior of investors and analysts in their information
acquisition in a manner consistent with the toy model.
4.4. Performance of Crowd-of-Crowds
Finally, we investigate the usefulness of combining the wisdom of different crowds.
In other words, we seek to know whether there is incremental information captured by
the disagreements between SBPs and ACPs. For example, despite the generally superior
performance of SBPs and ACPs, there may still be incremental information in ACPs
missing in SBPs and vice versa. In Table 7, we investigate whether a hybrid approach
that combines both sets of revealed-choice-based benchmarks is incremental to the stand-
alone performance of either ACPs or SBPs. This exercise is informative to researchers
and practitioners who are interested in the practical question of peer selection for the
purpose of performance benchmark. We focus here on the price co-movement test from
Eq (1). Columns 1 to 3 of Table 7 reports the R2 of the regressions for GICS6, standalone
SBPs, and standalone ACPs, respectively to establish the baseline performances of each
group. Column 4 reports results using the union of the set of top 10 SBPs and ACPs
(“SBP∪ACP”). Across both the S&P1500 base firm sample (row 1), the S&P500 subsam-
ple of larger base firms (row 2), and the S&P1000 subsample of smaller base firms (row
3), we find that the union of the peer sets modestly outperform the standalone SBP and
ACP grouping. These improvements range from a 2.8% to 9.2% relative to standalone
SBPs in column 5 and 12.2% to 13% relative to standalone ACPs in column 6. In par-

The Search for Peer Firms 25
ticular, the incremental improvement is greater among the smaller base firms, suggesting
that there is a greater value in aggregating and combining the collective wisdom gleaned
from the behavior of different types of sophisticated market participants. The findings
in this section provide a best-performing set of revealed-choice-based benchmarks that
combines the collective wisdom of EDGAR users and sell-side analysts. Moreover, our
analysis here illustrates how the analytical framework proposed in this paper can be used
to understand the circumstances under which aggregating economic agents’ revealed de-
cisions, or combining the wisdom produced between disparate crowds, are likely to be
fruitful in producing investment benchmarks.
5. Conclusion
In today’s knowledge-based economy, sharp distinctions between services and goods
are becoming more difficult to draw. Top business enterprises are combining human
and organizational capital in new ways that defy traditional industrial boundaries. For
example, it is no longer unusual to see an online retailer (i.e., Amazon) compete with
a web engine (i.e., Google) and an electronic hardware manufacturer (i.e. Apple) to
supply cloud-based enterprise software and storage solutions. In this brave new world,
financial researchers often need to reach beyond traditional industry groupings to find
suitable peer firms for economic benchmarking purposes. In this paper, we consider six
state-of-the-art peer firm identification schemes currently available to researchers and
managers. While all six schemes deploy some sort of ”big data” methodology, they fall
into two distinct categories: 1) algorithms that identify peers through similarities in
firms’ product-market or business description, and 2) algorithms that identify peers by
distilling the wisdom in investment crowds. We compute a wide set of performance
metrics that help quantify the performance of these different schemes relative to a set
of industry-based peers. Specifically, we evaluate each scheme’s efficacy in explaining
out-of-sample variations in base firms’: (a) stock returns, (b) valuation multiples, (c)
The Search for Peer Firms 26
growth rates, (d) financial leverage, and (e) profitability ratios. Our results show that
two wisdom-of-crowd approaches perform particularly well. Specifically, we find that
SBPs, which aggregate EDGAR users’ perceptions of fundamentally related benchmarks,
and ACPs, which are gleaned from aggregate patterns of analysts’ co-coverage decisions,
substantially outperformed GIC6 peers across all our test metrics. In stark contrast,
peers identified by investors co-searching on Yahoo Finance, perform poorly. The product-
market based schemes performed on par with or somewhat worse than the GIC6 peers. To
contextualize these findings, we develop an analytical framework that provides guidance
on the conditions under which a crowd is more likely to deliver wisdom. This framework
delivers two key implications which we test and verify in the data. The first implication
is that the degree of intra-crowd and inter-crowd agreement about a base firm’s best
matched peers will vary as a function of the precision of the information available about
that base firm. The second implication is that the efficacy of the crowd-based solution
will also depend on the precision of the information signal received by each agent, which
varies with agent sophistication and task complexity. Collectively, our work provides a
practical and straightforward solution to the peer identification problem faced by many
finance professionals. We show that a combination of the peers identified by EDGAR
users (SBP) and sell-side analysts (ACP) dominates the other peer identification schemes
in our tests. Thus, the union set of SBP and ACP firms represents an objectively selected
and highly effective peer group for investment and performance evaluation decisions. To
assist future researchers, we make available our dataset of these top-matching peers for
each firm in the S&P1500 and for each year in our sample. More broadly, our work also
contributes to an interdisciplinary literature on the wisdom of crowds. In this literature,
it is often difficult to objectively measure the value added by crowd-based solutions. We
use the peer identification setting to quantify the improvement from crowd-based results.
To our knowledge, this is the first study using financial economic data to provide such
insights to a growing field. We are also able to provide some preliminary insights on which

The Search for Peer Firms 27
crowd/task attributions have a significant impact on the efficacy of crowd-based solutions.
It is our hope and expectation that these findings will stimulate further research on the
usefulness and limitations of information aggregation across crowds.

The Search for Peer Firms 28
References
Albuquerque, A. (2009): “Peer firms in relative performance evaluation,” Journal ofAccounting and Economics, 48(1), 69–89.
Alford, A. W. (1992): “The effect of the set of comparable firms on the accuracy ofthe price-earnings valuation method,” Journal of Accounting Research, pp. 94–108.
Antle, R., and A. Smith (1986): “An empirical investigation of the relative perfor-mance evaluation of corporate executives,” Journal of Accounting Research, pp. 1–39.
Antweiler, W., and M. Z. Frank (2004): “Is all that talk just noise? The informationcontent of internet stock message boards,” The Journal of Finance, 59(3), 1259–1294.
Azar, P., and A. W. Lo (2016): “The wisdom of twitter crowds: Predicting stockmarket reactions to FOMC meetings via twitter feeds,” Available at SSRN 2756815.
Barber, B. M., and J. D. Lyon (1997): “Detecting long-run abnormal stock re-turns: The empirical power and specification of test statistics,” Journal of FinancialEconomics, 43(3), 341–372.
Bhojraj, S., and C. M. C. Lee (2002): “Who is my peer? A valuation-based approachto the selection of comparable firms,” Journal of Accounting Research, 40(2), 407–439.
Bhojraj, S., C. M. C. Lee, and D. K. Oler (2003): “What’s my line? A comparisonof industry classification schemes for capital market research,” Journal of AccountingResearch, 41(5), 745–774.
Brown, L. D., A. C. Call, M. B. Clement, and N. Y. Sharp (2015): “Insidethe “black box” of sell-side financial analysts,” Journal of Accounting Research, 53(1),1–47.
Brown, L. D., and A. Hugon (2009): “Team earnings forecasting,” Review of Ac-counting Studies, 14(4), 587–607.
Chan, L. K. C., J. Lakonishok, and B. Swaminathan (2007): “Industry classifica-tions and return comovement,” Financial Analysts Journal, 63(6), 56–70.
Chen, H., P. De, Y. J. Hu, and B.-H. Hwang (2014): “Wisdom of crowds: Thevalue of stock opinions transmitted through social media,” Review of Financial Studies,27(5), 1367–1403.
Cohen, L., and D. Lou (2012): “Complicated firms,” Journal of Financial Economics,104(2), 383–400.
Da, Z., J. Engelberg, and P. Gao (2011): “In search of attention,” The Journal ofFinance, 66(5), 1461–1499.
Damodaran, A. (2012): Investment valuation: Tools and techniques for determiningthe value of any asset, vol. 666. John Wiley & Sons.

The Search for Peer Firms 29
Daniel, K., M. Grinblatt, S. Titman, and R. Wermers (1997): “Measuring mu-tual fund performance with characteristic-based benchmarks,” The Journal of Finance,52(3), 1035–1058.
DeAngelo, L. E. (1990): “Equity valuation and corporate control,” Accounting Review,65(1), 93–112.
Dikolli, S. S., C. Hofmann, and T. Pfeiffer (2013): “Relative performance evalua-tion and peer-performance summarization errors,” Review of Accounting Studies, 18(1),34–65.
Drake, M. S., D. T. Roulstone, and J. R. Thornock (2015): “The determinantsand consequences of information acquisition via EDGAR,” Contemporary AccountingResearch, 32(3), 1128–1161.
Fama, E. F., and K. R. French (1997): “Industry costs of equity,”Journal of FinancialEconomics, 43(2), 153–193.
Goldstein, D. G., R. P. McAfee, and S. Suri (2014): “The wisdom of smaller,smarter crowds,” in Proceedings of the fifteenth ACM conference on Economics andcomputation, pp. 471–488. ACM.
Golz.Jr, W. (1986): “Valuation and LBOs,” Buyouts and Acquisitions, 4, 41–44.
Gong, G., L. Y. Li, and J. Y. Shin (2011): “Relative Performance Evaluation andRelated Peer Groups in Executive Compensation Contracts,” The Accounting Review,86(3), 1007–1043.
Greenstein, S., and F. Zhu (2014): “Do experts or collective intelligence write withmore bias? Evidence from encyclopædia britannica and wikipedia,” Harvard BusinessSchool Working Paper.
Groysberg, B., and P. Healy (2013): Wall Street Research: Past, Present, andFuture. Stanford University Press.
Hoberg, G., and G. Phillips (2010): “Product market synergies and competition inmergers and acquisitions: A Text-based analysis,” Review of Financial Studies, 23(10),3773–3811.
Hoberg, G., and G. M. Phillips (2014): “Text-based network industries and endoge-nous product differentiation,” NBER Working Paper No. 15991.
Holmstrom, B. (1979): “Moral hazard and observability,” Bell Journal of Economics,pp. 74–91.
Israelsen, R. D. (2016, Forthcoming): “Does common analyst coverage explain excesscomovement?,” Journal of Financial and Quantitative Analysis.
Jame, R., R. Johnston, S. Markov, and M. C. Wolfe (2016): “The value ofcrowdsourced earnings forecasts,” Journal of Accounting Research, 54(4), 1077–1110.

The Search for Peer Firms 30
Jegadeesh, N., J. Kim, S. D. Krische, and C. Lee (2004): “Analyzing the analysts:When do recommendations add value?,” The Journal of Finance, 59(3), 1083–1124.
Jenter, D., and F. Kanaan (2015): “CEO turnover and relative performance evalua-tion,” The Journal of Finance, 70(5), 2155–2184.
Jiang, G., C. M. Lee, and Y. Zhang (2005): “Information uncertainty and expectedreturns,” Review of Accounting Studies, 10(2-3), 185–221.
Kaplan, S. N., and R. S. Ruback (1995): “The valuation of cash flow forecasts: Anempirical analysis,” The Journal of Finance, 50(4), 1059–1093.
Kaustia, M., and V. Rantala (2015): “Social learning and corporate peer effects,”Journal of Financial Economics, 117(3), 653–669.
Kim, M., and J. R. Ritter (1999): “Valuing IPOs,” Journal of Financial Economics,53(3), 409–437.
Kremer, I., Y. Mansour, and M. Perry (2014): “Implementing the “wisdom of thecrowd”,” Journal of Political Economy, 122(5), 988–1012.
Kurvers, R. H., S. M. Herzog, R. Hertwig, J. Krause, P. A. Carney, A. Bog-art, G. Argenziano, I. Zalaudek, and M. Wolf (2016): “Boosting medical di-agnostics by pooling independent judgments,” Proceedings of the National Academy ofSciences, p. 201601827.
Lawrence, A., E. Sun, J. Ryans, and N. Laptev (2016, Forthcoming): “Yahoofinance search and earnings announcements,” Journal of Accounting and Economics.
Lee, C. M., P. Ma, and C. C. Wang (2015): “Search-based peer firms: Aggregatinginvestor perceptions through internet co-searches,” Journal of Financial Economics,116(2), 410–431.
Leung, A., A. Agarwal, P. Konana, and A. Kumar (2013): “Online search andreturn comovement,” Available at SSRN 2246374.
Lewellen, S. (2015): “Executive compensation and industry peer groups,” LondonBusiness School Working Paper.
Lewellen, S., and A. Metrick (2010): “Corporate governance and equity prices: Areresults robust to industry adjustments,” Working paper, Yale School of Management.
Liang, L., E. J. Riedl, and R. Venkataraman (2008): “The determinants ofanalyst-firm pairings,” Journal of Accounting and Public Policy, 27(4), 277–294.
Liu, J., D. Nissim, and J. Thomas (2002): “Equity valuation using multiples,” Journalof Accounting Research, 40(1), 135–172.

The Search for Peer Firms 31
Lorenz, J., H. Rauhut, F. Schweitzer, and D. Helbing (2011): “How social influ-ence can undermine the wisdom of crowd effect,” Proceedings of the National Academyof Sciences, 108(22), 9020–9025.
Ma, P., J.-E. Shin, and C. C. Wang (2016): “Relative performance benchmarks: Doboards get it right?,” Harvard Business School Working Paper.
Mollick, E., and R. Nanda (2015): “Wisdom or madness? Comparing crowds withexpert evaluation in funding the arts,” Management Science, 62(6), 1533–1553.
Muchnik, L., S. Aral, and S. J. Taylor (2013): “Social influence bias: A randomizedexperiment,” Science, 341(6146), 647–651.
Muslu, V., M. Rebello, and Y. Xu (2014): “Sell-side analyst research and stockcomovement,” Journal of Accounting Research, 52(4), 911–954.
Peng, L., and W. Xiong (2006): “Investor attention, overconfidence and categorylearning,” Journal of Financial Economics, 80(3), 563–602.
Ramnath, S. (2002): “Investor and analyst reactions to earnings announcements ofrelated firms: An empirical analysis,” Journal of Accounting Research, 40(5), 1351–1376.
Rauh, J. D., and A. Sufi (2012): “Explaining corporate capital structure: Productmarkets, leases, and asset similarity,” Review of Finance, 16(1), 115–155.
Simmons, J. P., L. D. Nelson, J. Galak, and S. Frederick (2011): “Intuitivebiases in choice versus estimation: implications for the wisdom of crowds,” Journal ofConsumer Research, 38(1), 1–15.
Van Nieuwerburgh, S., and L. Veldkamp (2010): “Information acquisition andunder-diversification,” The Review of Economic Studies, 77(2), 779–805.
Woodcock, J. (1993): “Buying or Selling a Business? Don’t Be Ripped Off!,” BusinessQuarterly, 57, 41–41.

The Search for Peer Firms 32
AppendixConstruction of Alternative Identification Schemes
A Product Market Peer Schemes
A.1 Global Industry Classification Scheme (GICS)
As described in Lee, Ma, and Wang (2015), the GICS scheme is provided through acollaborative between Standard &Poor’s and Morgan Stanley Capital International. Itis based on the judgment of a team of financial analysts who group firms on the basis oftheir principal business activity, determined either by observable sources of revenues andearnings or by market perceptions. We obtain each firm’s global industry classificationcode from Compustat. We define a base firm’s GICS peers as those firms (excluding thebase firm) sharing the same six-digit GICS as the base firm.
A.2 Capital IQ
We download a June 2014 snapshot of product market competitors from Capital IQ.Capital IQ collects the set of companies that a given firm i considers to be its competitors(coded as “Named by Company”), as self-disclosed in the company’s SEC filings, the setof companies that considers firm i a competitor (coded as “Named by Competitor”),as disclosed by their SEC filings, and finally the set of firms considered to be firm i’scompetitors as disclosed in third party firms’ SEC filings (coded as “Named by ThirdParty”). We define a firm’s “CIQ” peers to be those competitors who are “Named byCompany” or “Named by Competitor,” similar to Rauh and Sufi (2012) and Lewellen(2015).
A.3 Google Finance
We assemble “GOOGLE” peers by downloading the “Related Firms” listed on eachfirm’s Google Finance page as of June 2014. Our understanding is that Google generatesthe list through a proprietary algorithm, with FactSet Research’s (previously RevereData) own proprietary product-market based industry classification as one of the inputs.26
A.1.4 Text Network Industry Classification (TNIC)
This classification scheme, developed by Hoberg and Phillips (2010) and Hoberg andPhillips (2014), infer product market peers and group firms into different“industry”group-ings by analyzing and quantifying textual similarities in firms’ self-reported business de-scriptions in their 10-K filings. Data on TNIC peers are obtained from the Hoberg and
26This understanding is based on prior conversations with staff at Revere Data.
The Search for Peer Firms 33
Phillips Data Library online.27 Because TNIC is based on 10-K data, we assume thatTNIC peers from fiscal year t are usable for out-of-sample tests from July of t+1 to Juneof t+ 2.
B Wisdom-of-Crowd Schemes
B.1 Analyst Co-Coverage Peers (ACPs)
To construct analyst co-coverage of firms, we obtain the detailed IBES forecast filecovering the universe of analyst EPS forecasts for the calendar period 2003-2013 andremove anonymous analysts (id code=000000) similar to Brown and Hugon (2009).28 Toqualify as an analyst covering firm i, the analyst must have made at least one forecast forthe firm in the calendar year. We define as analyst co-coverage fraction between firms iand j in year t:
Analyst co-coverage fractionijt =# of analysts who co-cover i and j
# of analysts who cover i(8)
Intuitively, this fraction answers the question: what fraction of analysts who cover i alsocover j. We define a given base firm’s ACPs in calendar year t as those firms with theten highest analyst co-coverage fraction in calendar year t− 1.
B.2 Search-based Peers (SBPs)
Our data comes from the traffic log on the Securities and Exchange Commission’s(SEC) Electronic Data-Gathering, Analysis, and Retrieval (EDGAR) website, and is anupdated version of the data used in Lee, Ma, and Wang (2015).29 The main advantageof the update is its greater time coverage; whereas the prior version of the data spanscalendar years 2008 to 2011, this updated vintage contains data on visits to the EDGARwebsite from calendar years 2003 to 2011.30 The format of the updated data is largelyidentical to the prior vintage: each observation in the raw data contains information onthe visitor’s IP address, timestamp, CIK, and accession numbers which uniquely matchesto a particular company’s specific SEC filing. An important difference in this update isthat the data extraction process the SEC used differs from the one employed for the priorvintage of the data; the process was changed in order to accommodate the longer timeseries. As a result, the new and the prior vintages of data are not identical in the over-lapping period from 2008 to 2011. To ensure the integrity of the updated data, we verify
27We downloaded the May, 2013 version from http://alex2.umd.edu/industrydata/
industryclass.htm28Note that an analyst is defined as the unique combination of the broker and analyst ID from IBES
such that an analyst who moves from one broker to another would be treated as a different analyst inour sample.
29More details about the data can also be found in Drake, Roulstone, and Thornock (2015) who usesthe EDGAR search data to study investors’ search patterns.
30The new data sample extends to March 2012, but we do not use the partial data in 2012 in thispaper.

The Search for Peer Firms 34
that the daily-user level search characteristics—for example, filing types accessed, uniqueCIKs (firms) accessed, total clicks made, and average time spent by a daily user—betweenthese two datasets are not systematically and economically different in the overlappingperiod. These results are available from the author upon request. One of the empiricalchallenges in using the data is filtering out search traffic generated by automated scripts(“robots”), written to download massive numbers of filings. To filter out these uninfor-mative searches, we classify any daily user downloading more than the 95th percentilein the distribution of unique CIK’s within the corresponding calendar year as a robot.31
Using this filtered search traffic data, we infer investors’ perceptions of relevant economicbenchmarks by aggregating information from their fundamental information acquisitionbehavior. Under the assumption that the population of EDGAR users is collectivelysearching for firm fundamentals to aid their investment decisions, and that an importantpart of this process involves the comparison of these fundamentals to economically re-lated benchmarks, we expect EDGAR users search sequences to be informative of theirperceptions of the most relevant set of benchmark firms. Following this observation, werestrict our analysis to searches for 10-Ks and 10-Qs — including their amendments orsmall business variants — to focus on investors’ patterns of acquiring fundamental in-formation that most likely captures benchmarking behavior. Using this filtered data, weextract the set of most relevant economic benchmarks to any particular firm i by definingAnnual search fraction, f tij, between the base firm i and a peer firm j in calendar year t:
f tij =Σ365d=1(Unique daily-user searches for i and j)d
Σ365d=1(Unique daily-user searches for i and any firm j 6= i)d
. (9)
In words, f tij is the fraction of unique daily-users searching for firm i who also searchedfor firm j’s information, summed across all the days in a given calendar year. This isa more generalized version of the co-search algorithm employed in Lee, Ma, and Wang(2015), which defined co-searches based on chronologically sequential clicks in a givenday.32 Our Annual search fraction measure sums to one for each firm in a given year, andis easy to interpret. For example, f 2008
GOOGLE,Y HOO=0.0602 means that 6.02% of daily-userssearching for Google’s fundamental information and at least one other firm in calendaryear 2008, also searched for Yahoo’s information. By construction, we do not use anyinformation from users who only search for a singular firm’s filings before leaving theEDGAR website. Based on this measure, we define a given base firm’s top 10 SBPs ina given calendar year t as those peer firms with the ten highest values of Annual searchfraction in the preceding calendar year t−1, similar to how we define a firm’s ACPs. Theanalyses of this paper focus on the set of base firms that belong to the S&P1500 index
31This is a generalization of the method used by Lee, Ma, and Wang (2015), which used an absolutecutoff that classifies all daily IPs downloading more than 50 unique CIKs as a robot, a cutoff thatcorresponded to the 95th percentile of user search activity in the 2008 to 2011 sample. Given the longertime series in our updated search data, we employ an annual percentile rather than an absolute cutoff.
32In Lee, Ma, and Wang (2015), if a user clicks on Google and then Yahoo, Yahoo is considered a peerof Google, but not vice versa. The co-search algorithm used in this study relaxes these chronologicalordering restrictions, and consider firms i and j to be benchmarks for each other, so long as they areco-searched together by the same user within the same calendar day EDGAR session. In other words,we are building a network of firms with “weighted undirected edges” defined through co-searches.

The Search for Peer Firms 35
as of January 1 of each calendar year; however, no such restrictions are placed on the setof benchmark firms.33
B.3 Yahoo! Finance Peers (YHOO)
Yahoo! Finance makes available to users the set of firms which also viewed the basefirm: for example, when searching for Google’s information Yahoo Finance reports“Peopleviewing GOOG also viewed PCLN AMZN BIDU AAPL MA NFLX.” We download asnapshot of YHOO peers in June 2014 for a total of 922 unique base firms.34 Note thatunlike SBPs and ACPs, Yahoo Peers are defined exclusively by Yahoo’s own proprietaryco-search algorithms.
33Previously in LMW, peer firms were restricted to be within the same S&P1500 universe as basefirms.
34Note that Yahoo displays the co-searched tickers on a randomized basis per page refresh, consistentwith the issue highlighted in Kremer, Mansour, and Perry (2014) that full transparency is inefficientdue to reduced incentives to provide novel information. To fully capture the Yahoo co-searched tickers,our algorithm refreshes the page until Yahoo displays the results. In contrast, EDGAR co-searches andsearch-based peers are not observable by investors, who receive no “recommendations.”

The
Search
forP
eerF
irms
36
Table 1.Summary Statistics of Product Market and Wisdom of Crowd Solutions to Investment Peer Identification
This table reports characteristics of the S&P1500 base firms available for each identification scheme as of December 2012. Rows 1 ∼ 3 provide countsof the number of base firms falling under the S&P500 index, the converse S&P1000 index, and finally the entire S&P1500 index. Row 4 reports theaverage number of available benchmark firms for each specific scheme and row 5 provides the average fraction of peers from each identification schemewhich share the same GICS6 grouping as the base firm. For example, 69% of a base firm’s Google search peers are also in the same GICS6 grouping.Finally, row 6 describes the relevant time period for which we conduct tests under each identification scheme.The first four set of schemes aims to capture the notion of peers in the same product market space. The first scheme represents peers based onthe GICS6 grouping. The second scheme represents the set of self-reported product market competitors disclosed in SEC filings and collected byCapitalIQ (CIQ). Specifically, the CIQ peer set represents the union of the set of firms j that firm i report as its competitors and also the set offirms j that report i as a competitor. The third scheme represents the list of firms that Google Finance (GOOGLE) reports as a base firm’s “RelatedFirms” as of June 2014. The fourth scheme is the “Text Based Network Industry Classification” (TNIC) of Hoberg and Phillips (2010, 2014), and isderived from the set of peer firms with the most similar self-reported business descriptions in their 10-K filings to the base firm’s.The next set of schemes capture peers derived from the wisdom of investment crowds. The fifth scheme represents analyst co-coverage peers (ACP),similar to that of Israelsen (2016, Forthcoming), Kaustia and Rantala (2015), and Muslu, Rebello, and Xu (2014), defined by applying the Analystco-coverage fraction of Eq 8 to the entire IBES sample and retaining the ten peer firms with the highest co-coverage fractions. The sixth schemerepresents the search-based peers (SBP) of Lee, Ma, and Wang (2015), defined by applying the Annual search fraction of Eq 9 to the SEC EDGARsearch traffic data. The last scheme represents the list of common co-searched firms as reported by Yahoo Finance (YHOO) as of June 2014.
Product Market Peers Wisdom of Investment Crowds Peers
GICS6 CIQ GOOGLE TNIC ACP SBP YHOON SP500 Base Firms 498 398 413 484 428 487 414N SP1000 Base Firms 998 677 675 981 862 995 508N SP1500 Base Firms 1496 1075 1088 1465 1290 1482 922Avg. N Peers 36.7 5.13 7.69 79.18 10 10 5.04Correspondence with GICS6 – 0.59 0.69 0.48 0.69 0.61 0.28Sample Test Years 2003-2013 2012-2013 2012-2013 2003-2013 2003-2013 2003-2013 2012-2013

The Search for Peer Firms 37
Table 2.Co-Movement Tests of Product Market and Wisdom of Crowds Approaches to
Investment Peer Identification
This table presents a comparison between GICS6 and alternative benchmark identification schemes thatrely on either product market and wisdom of investment crowds approaches. Table values in the odd-numbered columns represent the baseline average R2 from cross-sectional regressions of the form
V ari,t = αt + βtV arpi,t+ εi,t
where the portfolio p consists of peer firms identified by each of the six candidate peer identificationschemes. Specifically, V arpi,t
is the average of each variable computed across all the peer firms identifiedby a particular scheme. These regressions take the form of either monthly cross-sectional returnsregressions (row 1) or quarterly cross-sectional regressions using the most recently observable quarterlyfinancial statement data from Compustat and market capitalization data from CRSP on March, June,September, and December of each year (remaining rows).The table values in the even-numbered columns report the difference between the R2 produced by thevarious alternative schemes named in the column header and GICS6 peers. Positive (negative) valuesrepresent distances when the candidate scheme achieved higher (lower) R2 than the GICS6 peers. Wereport in this fashion because the underlying set of common firms to GICS6 and each scheme is differentfor each alternative scheme.Each row in the table considers a different performance metric (V arpi,t
). Specifically, Returns refers tomonthly cum-dividend stock returns. pb refers to the price-to-book ratio and is defined as market capscaled by total common equity [ceqq]. evs refers to enterprise value to sale ratio and is defined as thesum of market cap and long-term debt [dlttq] scaled by net sales [saleq]. pe refers to the price-to-earningsratio and is defined as market cap scaled by net income before extraordinary items[ibq]. roe refers toreturn on equity and is defined as net income before extraordinary items [ibq] scaled by total commonequity [ceqq]. at refers to the inverse of asset turnover and is defined as total assets[atq] scaled by netsales [saleq]. pm refers to profit margin and is defined as net operating income after depreciation [oiadp]scaled by net sales [saleq]. lev refers to leverage and is defined as long-term debt [dlttq] scaled by totalstockholders’ equity [seqq]. Finally, salesgrowth refers to one-year-ahead realized sales growth and isdefined as the difference between the net sale one year ahead in the future and the current year’s netsales all together scaled by the current year’s net sales [saleq].
The various alternative benchmark schemes considered are Capital IQ (CIQ) peer firms (columns 1),Google Finance peer firms (column 3), Text Network Industry Classification (TNIC) peer firms (column5), co-coverage-fraction-weighted portfolio of analyst co-coverage (ACPs) peer firms (column 7), EDGARco-search-fraction-weighted portfolio of search-based peers (column 9), and finally Yahoo Finance co-searched peer firms (column 11).The results are reported for the sample of base firms that belonged to the S&P1500, at the beginning ofa given calendar year. Significance levels are indicated by ∗, ∗∗, ∗∗∗ for 10%, 5%, and 1%, respectively.

The
Search
forP
eerF
irms
38
Table 2 [Continued]
Product Market Peers Wisdom of Investment Crowds Peers
CIQ GOOG TNIC ACP SBP YHOO
(1) (2) (3) (4) (5) (6) (7) (8) (9) (10) (11) (12)
Returns 0.030*** -0.041*** 0.084*** 0.002 0.077*** -0.028*** 0.131*** 0.027*** 0.141*** 0.040*** 0.055*** -0.036***[0.004] [0.008] [0.007] [0.005] [0.005] [0.002] [0.006] [0.002] [0.006] [0.003] [0.012] [0.011]
No. Months 24 24 24 24 114 114 120 120 120 120 24 24
Valuation Multiples
pb 0.011** -0.064*** 0.034*** -0.034*** 0.039*** -0.007** 0.083*** 0.032*** 0.111*** 0.064*** 0.138*** 0.059***[0.003] [0.005] [0.003] [0.005] [0.002] [0.003] [0.003] [0.002] [0.004] [0.004] [0.011] [0.015]
evs 0.178*** -0.108*** 0.313*** 0.038*** 0.328*** 0.023*** 0.375*** 0.077*** 0.465*** 0.168*** 0.122*** -0.160***[0.007] [0.004] [0.004] [0.008] [0.006] [0.004] [0.004] [0.002] [0.005] [0.004] [0.029] [0.027]
pe 0.013*** -0.006 0.020** -0.003 0.027*** -0.005* 0.042*** 0.011*** 0.045*** 0.014*** 0.018** -0.005[0.003] [0.007] [0.006] [0.007] [0.003] [0.003] [0.004] [0.002] [0.004] [0.003] [0.007] [0.010]
Financial Statement Ratios
roe 0.010*** -0.011** 0.025*** 0.002 0.025*** -0.007** 0.047*** 0.015*** 0.072*** 0.041*** 0.051*** 0.027***[0.002] [0.003] [0.004] [0.005] [0.002] [0.003] [0.004] [0.002] [0.004] [0.003] [0.008] [0.007]
at 0.305*** -0.043 0.583*** 0.084*** 0.484*** 0.078*** 0.543*** 0.127*** 0.598*** 0.192*** 0.355*** -0.154***[0.018] [0.025] [0.007] [0.007] [0.005] [0.005] [0.005] [0.005] [0.005] [0.004] [0.031] [0.030]
pm 0.106*** -0.034*** 0.257*** 0.084*** 0.246*** 0.038*** 0.306*** 0.103*** 0.385*** 0.186*** 0.026*** -0.149***[0.006] [0.006] [0.011] [0.004] [0.006] [0.005] [0.006] [0.004] [0.008] [0.005] [0.005] [0.009]
lev 0.011*** -0.011* 0.033*** 0.007 0.068*** -0.002 0.101*** 0.039*** 0.110*** 0.048*** 0.052*** 0.029***[0.001] [0.005] [0.003] [0.004] [0.006] [0.004] [0.006] [0.005] [0.006] [0.004] [0.007] [0.005]
salesgrowth 0.016*** -0.078*** 0.138*** -0.034** 0.212*** -0.042*** 0.317*** 0.068*** 0.312*** 0.070*** 0.161*** -0.027***[0.002] [0.015] [0.011] [0.012] [0.017] [0.005] [0.020] [0.005] [0.018] [0.005] [0.018] [0.008]
No. Quarters 8 8 8 8 38 38 40 40 40 40 8 8

The Search for Peer Firms 39
Table 3.Summary of Relative Performance
This table provides a summary of the main results in Table 2. For each peer group identification scheme,we report the median percentage improvement in R2 relative to GICS6. These R2s are based on thecross-sectional regressions reported in Table 2, including the regression related to stock returns, valuationmultiples, and financial statement ratios. For each peer identification scheme, we also report the medianof its ranked performance improvement relative to GICS6 across all the performance metrics. Columns(1)-(2) report the results of the S&P1500 base firms; columns (3)-(4) report results for the S&P500 basefirms; and columns (5)-(6) report results for the S&P1000 base firms.
S&P1500 S&P500 S&P1000MedianRank(1)
Median %Improvement
(2)
MedianRank(3)
Median %Improvement
(4)
MedianRank(5)
Median %Improvement
(6)
Product Market PeersCIQ 6 -37.8% 6 -20.9% 5 -40.0%GOOG 3.5 8.7% 4 23.0% 4 -13.0%TNIC 4 -2.9% 4 11.7% 4 12.2%
Wisdom of Investment Crowds PeersACP 2 35.5% 2 72.7% 2 38.3%SBP 1 56.6% 1 100.0% 1 64.6%YHOO 5 -14.4% 4.5 7.7% 5.5 -22.2%
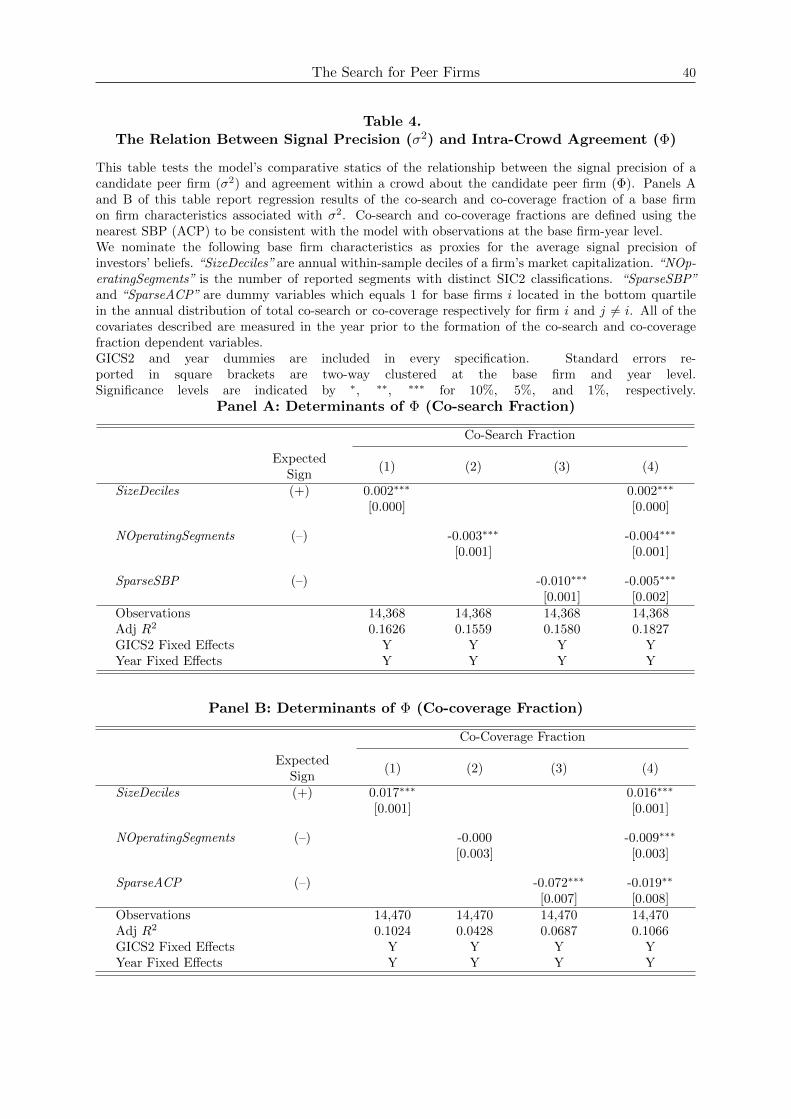
The Search for Peer Firms 40
Table 4.The Relation Between Signal Precision (σ2) and Intra-Crowd Agreement (Φ)
This table tests the model’s comparative statics of the relationship between the signal precision of acandidate peer firm (σ2) and agreement within a crowd about the candidate peer firm (Φ). Panels Aand B of this table report regression results of the co-search and co-coverage fraction of a base firmon firm characteristics associated with σ2. Co-search and co-coverage fractions are defined using thenearest SBP (ACP) to be consistent with the model with observations at the base firm-year level.We nominate the following base firm characteristics as proxies for the average signal precision ofinvestors’ beliefs. “SizeDeciles” are annual within-sample deciles of a firm’s market capitalization. “NOp-eratingSegments” is the number of reported segments with distinct SIC2 classifications. “SparseSBP”and “SparseACP” are dummy variables which equals 1 for base firms i located in the bottom quartilein the annual distribution of total co-search or co-coverage respectively for firm i and j 6= i. All of thecovariates described are measured in the year prior to the formation of the co-search and co-coveragefraction dependent variables.GICS2 and year dummies are included in every specification. Standard errors re-ported in square brackets are two-way clustered at the base firm and year level.Significance levels are indicated by ∗, ∗∗, ∗∗∗ for 10%, 5%, and 1%, respectively.
Panel A: Determinants of Φ (Co-search Fraction)
Co-Search Fraction
ExpectedSign
(1) (2) (3) (4)
SizeDeciles (+) 0.002∗∗∗ 0.002∗∗∗
[0.000] [0.000]
NOperatingSegments (–) -0.003∗∗∗ -0.004∗∗∗
[0.001] [0.001]
SparseSBP (–) -0.010∗∗∗ -0.005∗∗∗
[0.001] [0.002]Observations 14,368 14,368 14,368 14,368Adj R2 0.1626 0.1559 0.1580 0.1827GICS2 Fixed Effects Y Y Y YYear Fixed Effects Y Y Y Y
Panel B: Determinants of Φ (Co-coverage Fraction)
Co-Coverage Fraction
ExpectedSign
(1) (2) (3) (4)
SizeDeciles (+) 0.017∗∗∗ 0.016∗∗∗
[0.001] [0.001]
NOperatingSegments (–) -0.000 -0.009∗∗∗
[0.003] [0.003]
SparseACP (–) -0.072∗∗∗ -0.019∗∗
[0.007] [0.008]Observations 14,470 14,470 14,470 14,470Adj R2 0.1024 0.0428 0.0687 0.1066GICS2 Fixed Effects Y Y Y YYear Fixed Effects Y Y Y Y
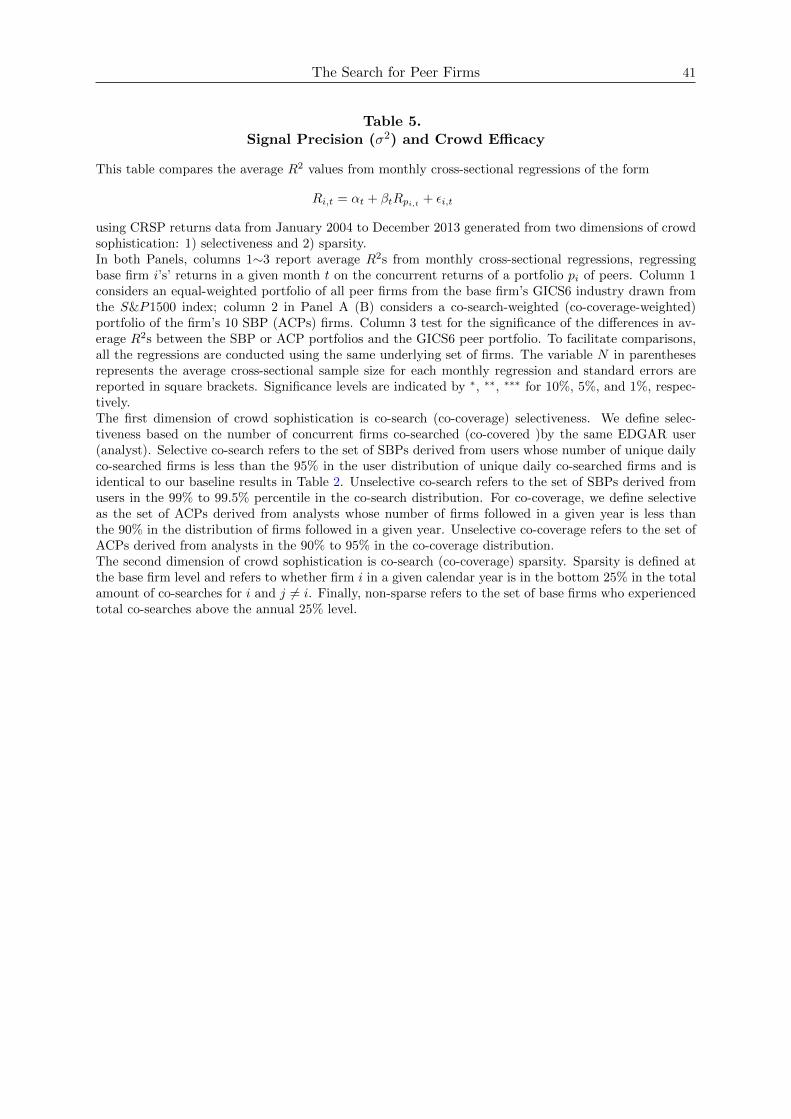
The Search for Peer Firms 41
Table 5.Signal Precision (σ2) and Crowd Efficacy
This table compares the average R2 values from monthly cross-sectional regressions of the form
Ri,t = αt + βtRpi,t+ εi,t
using CRSP returns data from January 2004 to December 2013 generated from two dimensions of crowdsophistication: 1) selectiveness and 2) sparsity.In both Panels, columns 1∼3 report average R2s from monthly cross-sectional regressions, regressingbase firm i’s’ returns in a given month t on the concurrent returns of a portfolio pi of peers. Column 1considers an equal-weighted portfolio of all peer firms from the base firm’s GICS6 industry drawn fromthe S&P1500 index; column 2 in Panel A (B) considers a co-search-weighted (co-coverage-weighted)portfolio of the firm’s 10 SBP (ACPs) firms. Column 3 test for the significance of the differences in av-erage R2s between the SBP or ACP portfolios and the GICS6 peer portfolio. To facilitate comparisons,all the regressions are conducted using the same underlying set of firms. The variable N in parenthesesrepresents the average cross-sectional sample size for each monthly regression and standard errors arereported in square brackets. Significance levels are indicated by ∗, ∗∗, ∗∗∗ for 10%, 5%, and 1%, respec-tively.The first dimension of crowd sophistication is co-search (co-coverage) selectiveness. We define selec-tiveness based on the number of concurrent firms co-searched (co-covered )by the same EDGAR user(analyst). Selective co-search refers to the set of SBPs derived from users whose number of unique dailyco-searched firms is less than the 95% in the user distribution of unique daily co-searched firms and isidentical to our baseline results in Table 2. Unselective co-search refers to the set of SBPs derived fromusers in the 99% to 99.5% percentile in the co-search distribution. For co-coverage, we define selectiveas the set of ACPs derived from analysts whose number of firms followed in a given year is less thanthe 90% in the distribution of firms followed in a given year. Unselective co-coverage refers to the set ofACPs derived from analysts in the 90% to 95% in the co-coverage distribution.The second dimension of crowd sophistication is co-search (co-coverage) sparsity. Sparsity is defined atthe base firm level and refers to whether firm i in a given calendar year is in the bottom 25% in the totalamount of co-searches for i and j 6= i. Finally, non-sparse refers to the set of base firms who experiencedtotal co-searches above the annual 25% level.

The Search for Peer Firms 42
Table 5 [Continued]
Panel A: EDGAR Crowd Sophistication
GICS6 SBP (2)-(1)(1) (2) (3)
Co-search Selectiveness
Selective0.102∗∗∗ 0.141∗∗∗ 0.040∗∗∗
(N= 1,461) [0.005] [0.006] [0.003]
Unselective0.102∗∗∗ 0.052∗∗∗ -0.050∗∗∗
(N= 1,461) [0.005] [0.004] [0.003]
Co-search Sparsity
Non-Sparse0.111∗∗∗ 0.165∗∗∗ 0.055∗∗∗
(N= 1,095) [0.005] [0.006] [0.003]
Sparse0.080∗∗∗ 0.085∗∗∗ 0.005
(N= 366) [0.006] [0.006] [0.003]
Number of Months 120 120 120
Panel B: Analyst Crowd Sophistication
GICS6 ACP (2)-(1)(1) (2) (3)
Co-coverage Selectiveness
Selective0.104∗∗∗ 0.129∗∗∗ 0.025∗∗∗
(N= 1,292) [0.005] [0.005] [0.002]
Unselective0.129∗∗∗ 0.110∗∗∗ -0.018∗∗∗
(N= 892) [0.006] [0.006] [0.002]
Co-coverage Sparsity
Non-Sparse0.126∗∗∗ 0.180∗∗∗ 0.054∗∗∗
(N= 979) [0.006] [0.007] [0.004]
Sparse0.056∗∗∗ 0.055∗∗∗ -0.001
(N= 326) [0.004] [0.004] [0.003]
Number of Months 120 120 120

The Search for Peer Firms 43
Table 6.The Relation Between Signal Precision (σ2) and Inter-Crowd Agreement (Φ)
This table tests the model’s comparative statics of the relationship between the signal precision of acandidate peer firm (σ2) and agreement across crowds (EDGAR users and analysts) about the candidatepeer firm (Φ). The outcome variable is the observed % agreement in a base firm’s set of top 10 SBPSand ACPs with observations at the firm-year level. The explanatory variables are firm characteristicsassociated with σ2.We nominate the following base firm characteristics as proxies for the average signal precision ofinvestors’ beliefs about the firm’s candidate peer firms. “SizeDeciles” are annual within-sample deciles ofa firm’s market capitalization. “NOperatingSegments” is the number of reported segments with distinctSIC2 classifications. “SparseSBP” and “SparseACP” are dummy variables which equals 1 for base firmsi located in the bottom quartile in the annual distribution of total co-search or co-coverage respectivelyfor firm i and j 6= i. All of the covariates described are measured in the year prior to the formation ofthe co-search and co-coverage fraction dependent variables.
Agreement Between SBPs and ACPs
ExpectedSign
(1) (2) (3) (4)
SizeDeciles (+) 0.028∗∗∗ 0.012∗∗∗
[0.002] [0.002]
NOperatingSegments (–) -0.006∗ -0.017∗∗∗
[0.004] [0.003]
SparseSBP (–) -0.102∗∗∗ -0.078∗∗∗
[0.010] [0.009]
SparseACP (–) -0.181∗∗∗ -0.152∗∗∗
[0.008] [0.009]Observations 14,187 14,187 14,187 14,187Adj R2 0.1632 0.0478 0.2410 0.2567GICS2 Fixed Effects Y Y Y YYear Fixed Effects Y Y Y Y

The Search for Peer Firms 44
Table 7.Performance of Crowd-of-Crowds Peers
This table compares the average R2 values from monthly cross-sectional regressions of the form
Ri,t = αt + βtRpi,t+ εi,t
using CRSP returns data from January 2004 to December 2013. Columns 1∼4 report average R2s frommonthly cross-sectional regressions, regressing base firm i’s returns in a given month t on the concurrentreturns of the relevant peer portfolio pi. Column 1 considers an equal-weighted portfolio of GICS6 peersin the relevant base firm universe; Column 2 considers an equal-weighted portfolio of top 10 SBP firms,ranked by the prior calendar year’s Annual Search Fraction fij , defined as the fraction of daily-userssearching for both firm i and j’s’ information on the same day conditional on searching for firm i andany other firm 6= i, aggregated over the course of a calendar year; Column 3 considers an equal-weightedportfolio of top 10 ACP firms, ranked by the prior calendar year’s Annual Co-coverage Fraction fij ,defined as the fraction of analysts who issue a forecast for firm i who also issue a forecast for firm j ina given calendar year; Column 4 considers an equal-weighted portfolio of peer firms that belong to boththe top 10 SBP and ACP portfolios.The results are reported for the sample of base firms that belonged to the S&P1500, S&P500, or S&P1000index at the beginning of each calendar year. To facilitate comparisons, all the regressions are conductedusing the same underlying set of base firms. As a sampling requirement, all base firms reported here haveat least one overlapping peer firm between ACPs and SBPs. The variable N in parentheses representsthe average cross-sectional sample size for each monthly regression and standard errors are reported insquare brackets. Significance levels are indicated by ∗, ∗∗, ∗∗∗ for 10%, 5%, and 1%, respectively.
GICS6 SBP ACP SBP∪ACP (4)-(2) (4)-(3)(1) (2) (3) (4) (5) (6)
SP1500 Base Firms 0.107∗∗∗ 0.141∗∗∗ 0.132∗∗∗ 0.150∗∗∗ 0.009∗∗∗ 0.018∗∗∗
(N= 1,195) [0.006] [0.006] [0.006] [0.006] [0.001] [0.001]
SP500 Base Firms 0.142∗∗∗ 0.214∗∗∗ 0.197∗∗∗ 0.221∗∗∗ 0.006∗∗∗ 0.024∗∗∗
(N= 410) [0.008] [0.008] [0.008] [0.008] [0.002] [0.002]
SP1000 Base Firms 0.083∗∗∗ 0.120∗∗∗ 0.115∗∗∗ 0.130∗∗∗ 0.011∗∗∗ 0.015∗∗∗
(N= 777) [0.005] [0.006] [0.006] [0.006] [0.001] [0.001]
Number of Months 120 120 120 120 120 120