Embed Size (px)
Citation preview
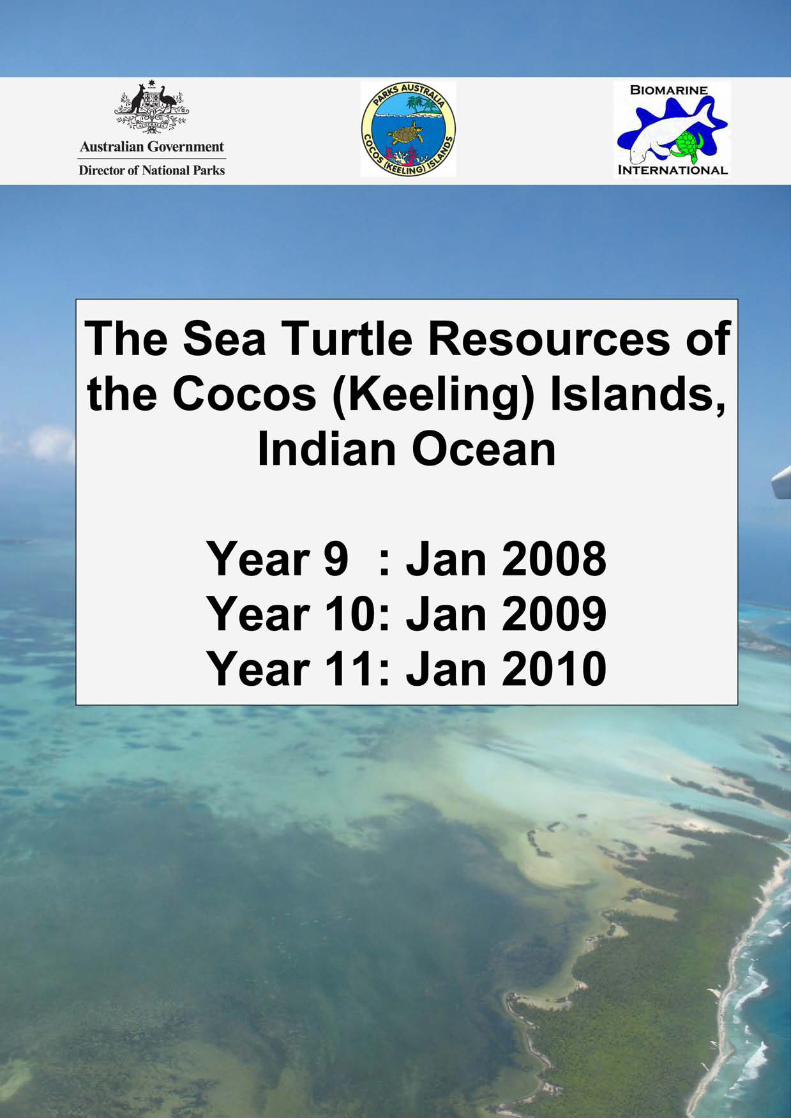
The Sea Turtle Resources of the Cocos (Keeling) Islands, Indian Ocean
Year 9 – Jan 2008
Year 10 – Jan 2009 Year 11 – Jan 2010
Scientific Consultant Scott D. Whiting Biomarine International PO Box 376u Charles Darwin University Darwin, NT, 0815 Tel./Fax 08 89327607 Mobile 041 3375782 Email [email protected] Website www.biomarine.com Parks Australia Staff - Cocos (Keeling) Islands Ismail Macrae Mohammand Chongkin Trish Flores John Hueston Brendan Tiernan Hajji Lofty Raptikan Aly Colless PO Box 1043 Cocos (Keeling) Islands, Indian Ocean WA, 6799 Tel. 08 91626678 Fax 08 91626680 Conditions of Use This report is unpublished and therefore permission from the author or PAN must be requested before use. Material in this report should not be reproduced or used without permission. Acknowledgments This research was jointly funded by Parks Australia, Cocos (Keeling) Islands. I would like to thank the Parks Australia North staff for their support both in the field and in the office. Andrea Whiting provided assistance in the field and with report writing. This project was conducted under a contract with Parks Australia North. Research was conducted under approval from the Animal Ethics Committee at the Charles Darwin University. Several reports on previous research have been submitted to and accepted by the Charles Darwin University Animal Ethics Committee. All photos are by Scott Whiting unless otherwise credited. Cover: Aerial view of South Island, Cocos (Keeling) Island
CONTENTS
INTRODUCTION...................................................................................................................................................... 1 METHODS .............................................................................................................................................................. 2
Foraging Turtles............................................................................................................................................... 2 Capture.......................................................................................................................................................................... 2 Tagging ......................................................................................................................................................................... 4 Measurements ............................................................................................................................................................... 5 Internal Examination - Laparoscopy ............................................................................................................................. 5 External Examination.................................................................................................................................................... 8 Growth rates.................................................................................................................................................................. 8 Population Estimates..................................................................................................................................................... 8 Community Education .................................................................................................................................................. 8
Nesting Turtles................................................................................................................................................. 8 RESULTS................................................................................................................................................................ 9
Foraging Turtles............................................................................................................................................... 9 Capture Data ................................................................................................................................................................. 9 Percentage of Recaptures ............................................................................................................................................ 11 Size Composition ........................................................................................................................................................ 12 Internal Examination – Laparoscopy........................................................................................................................... 15 Growth Rates .............................................................................................................................................................. 17 Population Estimates................................................................................................................................................... 18 New Recruits............................................................................................................................................................... 19 Fidelity and Movements.............................................................................................................................................. 20 Health and Condition .................................................................................................................................................. 21
Nesting Turtles............................................................................................................................................... 23 Education ....................................................................................................................................................... 25
DISCUSSION......................................................................................................................................................... 27 Foraging Turtles............................................................................................................................................. 27 Nesting Turtles............................................................................................................................................... 27 Conservation Issues ....................................................................................................................................... 27
REFERENCES AND FURTHER READING................................................................................................................. 30

The Sea Turtle Resources of the Cocos (Keeling) Islands – Years 9-11 Project Report
- 1 -
INTRODUCTION Hawksbill turtles (Eretmochelys imbricata) and green turtles (Chelonia mydas) occur in the Cocos Keeling Islands lagoon with population sizes estimated in the high hundreds for hawksbill turtles (Whiting, 2006b) and several thousand for green turtles. Both species are listed as vulnerable in Australia (EPBC Act 1999) and internationally the hawksbill turtle is listed as critically endangered and the green turtle is listed as endangered (IUCN, 2010). The Cocos (Keeling) Islands provide a unique opportunity to study these species under relatively natural conditions and also in a remote location, being nearly 1000 km to the nearest land mass. A mark-recapture study was initiated in 1999 and has now been running for 11 consecutive years, making it the longest running in-water study of sea turtles in Australia outside of Queensland. This study has provided reasonably confident population estimates for hawksbill turtles but low recapture rates of green turtles so far mean that population estimates are difficult to obtain. The study has identified core foraging grounds for both species, identified existing and potential threats, provided valuable information to inform coastal development and identified migration paths of turtles between North Keeling Island and the southern lagoon (see Whiting, 2004, 2006a; Whiting et al., 2008). This report comprises results from 2008, 2009 and 2010 and includes context from all years. In the past three years all work was concentrated on foraging turtles in the southern lagoon. Only one trip was made to North Keeling Island to assess the density of nesting green turtles. In 2009 and 2010, a laparoscope was used to assess the sex of immature foraging turtles. A major change in the lagoon occurred in 2009 and 2010 with the commencement of construction of the Rumah Baru jetty and dredged channel. Potential impact could occur from disturbance of turtles travel to and from feeding areas and degradation of seagrass in the local area. The detailed aims of the study between 2008 and 2010 were to:
Continue with the mark-recapture study on the southern atoll with the long-term goal of estimating population size
Catch a sample of turtles to monitor species composition and size structure Obtain growth rates from previously tagged turtles Continue studies of the nesting turtles on both atolls Collect genetic material from foraging and nesting turtles Use a surgical laparoscope to assess the breeding condition and sex of a sample of
hawksbill and green turtles Conduct community education

The Sea Turtle Resources of the Cocos (Keeling) Islands – Years 9-11 Project Report
- 2 -
METHODS Methodology followed those from previous years (Whiting, 2004) but are summarised here for conciseness. Foraging Turtles
Capture
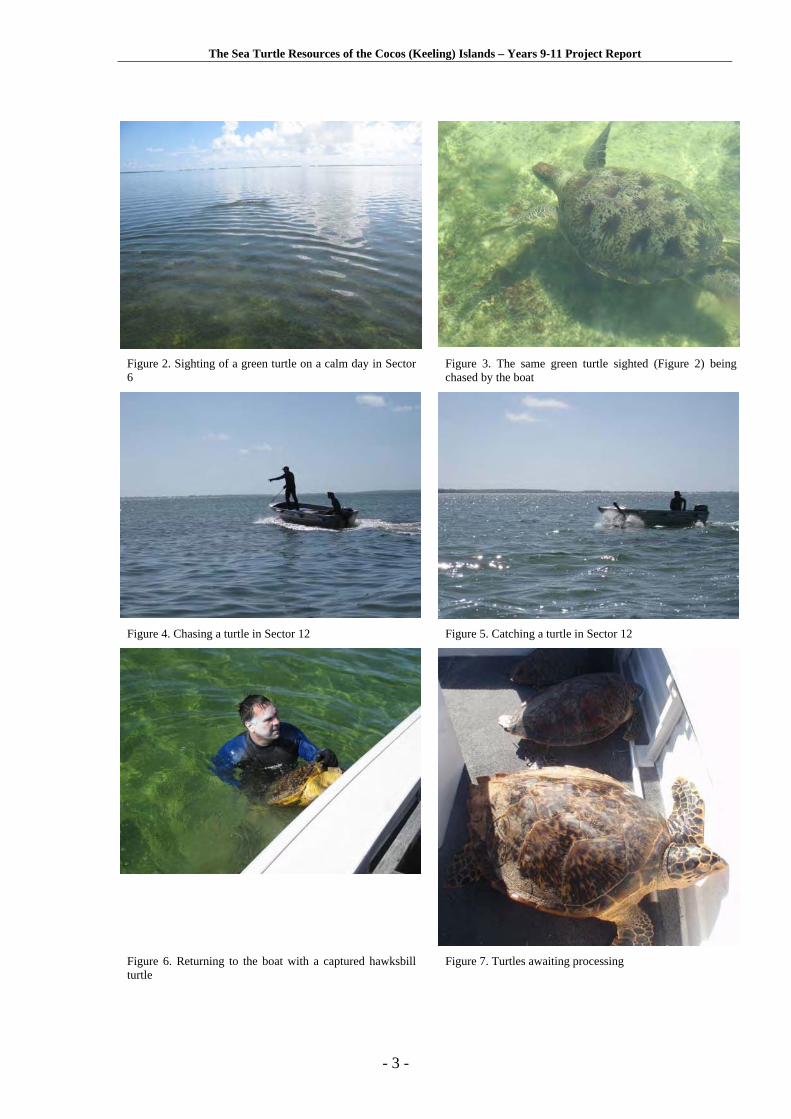
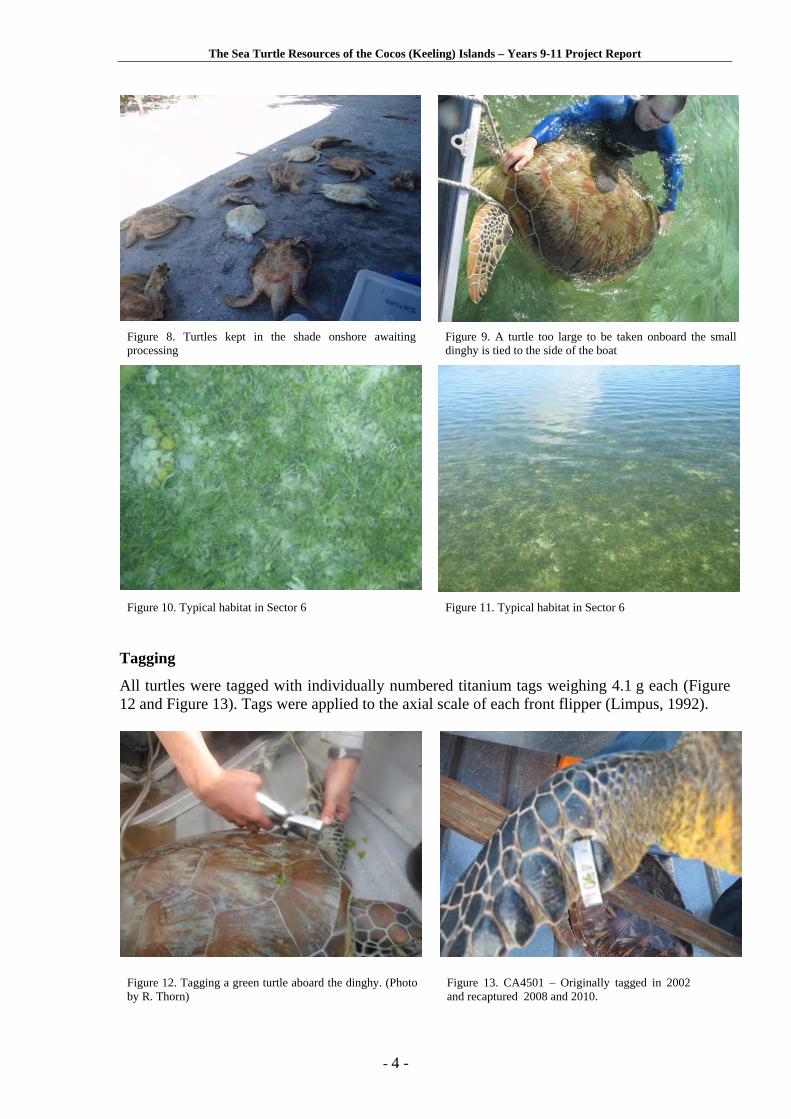
Turtles were captured using the turtle rodeo method (Limpus, 1978) using a 3.8 m dinghy. Most catching was concentrated in two catch areas; Area 1 (Sectors 5, 6 and 7) and Area 2 (Sector 12 and 13) (Figure 1 - Figure 12). Most turtles were brought aboard the dingy (Figure 12) or taken ashore for measuring and weighing (Figure 8, 14-15). Large green turtles (over 70 cm curved carapace length) were too heavy to take aboard the small dinghy and were tied to the gunwale of the vessel so they could be tagged and measured in the water (Figure 9).
Figure 1. SPOT Image of the southern Atoll of the Cocos (Keeling) Islands. The catch Sectors are marked in yellow. This image is used with permission from Department of Transport and Regional Services (DoTRS).
The Sea Turtle Resources of the Cocos (Keeling) Islands – Years 9-11 Project Report
- 3 -
Figure 2. Sighting of a green turtle on a calm day in Sector 6
Figure 3. The same green turtle sighted (Figure 2) being chased by the boat
Figure 4. Chasing a turtle in Sector 12 Figure 5. Catching a turtle in Sector 12
Figure 6. Returning to the boat with a captured hawksbill turtle
Figure 7. Turtles awaiting processing
The Sea Turtle Resources of the Cocos (Keeling) Islands – Years 9-11 Project Report
- 4 -
Figure 8. Turtles kept in the shade onshore awaiting processing
Figure 9. A turtle too large to be taken onboard the small dinghy is tied to the side of the boat
Figure 10. Typical habitat in Sector 6 Figure 11. Typical habitat in Sector 6
Tagging
All turtles were tagged with individually numbered titanium tags weighing 4.1 g each (Figure 12 and Figure 13). Tags were applied to the axial scale of each front flipper (Limpus, 1992).
Figure 12. Tagging a green turtle aboard the dinghy. (Photo by R. Thorn)
Figure 13. CA4501 – Originally tagged in 2002 and recaptured 2008 and 2010.
The Sea Turtle Resources of the Cocos (Keeling) Islands – Years 9-11 Project Report
- 5 -
Measurements
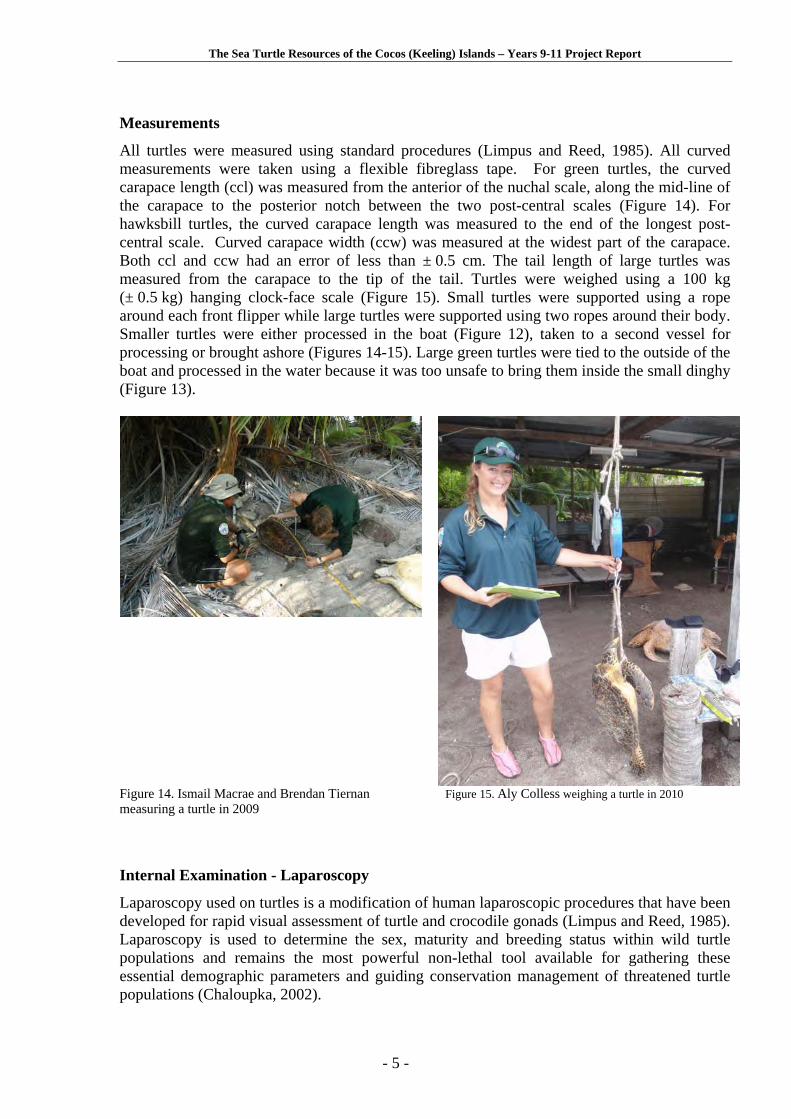
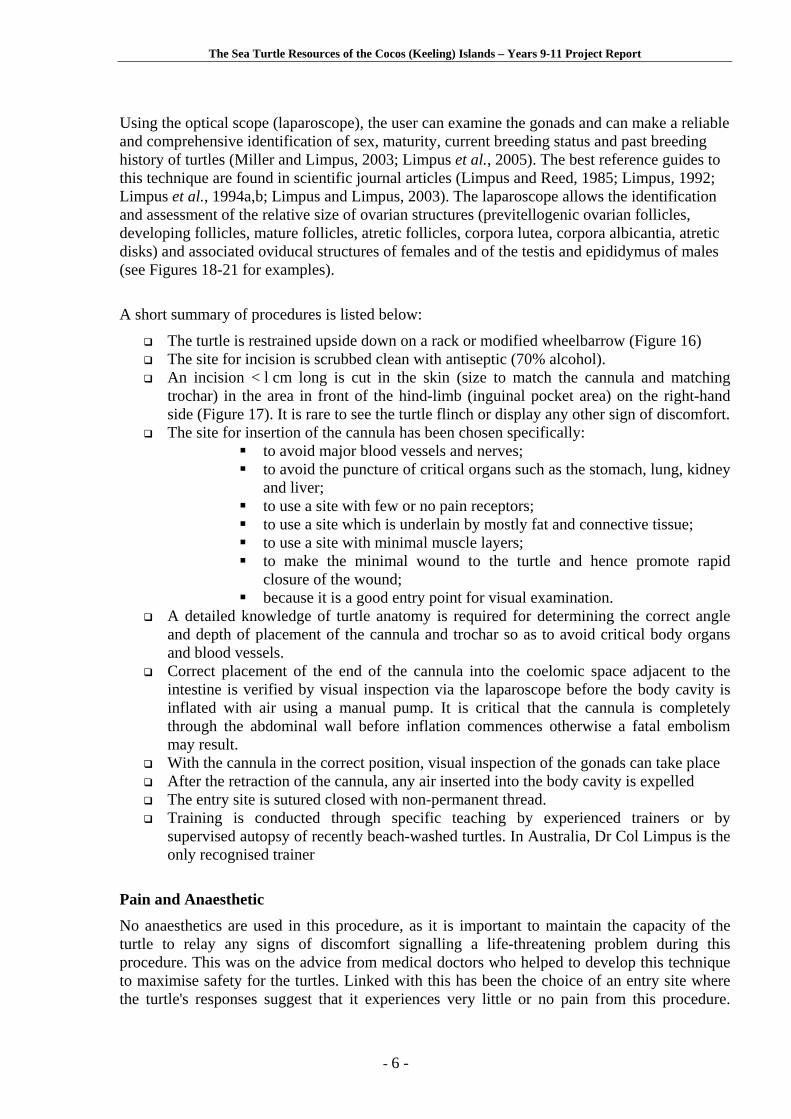
All turtles were measured using standard procedures (Limpus and Reed, 1985). All curved measurements were taken using a flexible fibreglass tape. For green turtles, the curved carapace length (ccl) was measured from the anterior of the nuchal scale, along the mid-line of the carapace to the posterior notch between the two post-central scales (Figure 14). For hawksbill turtles, the curved carapace length was measured to the end of the longest post-central scale. Curved carapace width (ccw) was measured at the widest part of the carapace. Both ccl and ccw had an error of less than ± 0.5 cm. The tail length of large turtles was measured from the carapace to the tip of the tail. Turtles were weighed using a 100 kg (± 0.5 kg) hanging clock-face scale (Figure 15). Small turtles were supported using a rope around each front flipper while large turtles were supported using two ropes around their body. Smaller turtles were either processed in the boat (Figure 12), taken to a second vessel for processing or brought ashore (Figures 14-15). Large green turtles were tied to the outside of the boat and processed in the water because it was too unsafe to bring them inside the small dinghy (Figure 13).
Figure 14. Ismail Macrae and Brendan Tiernan measuring a turtle in 2009
Figure 15. Aly Colless weighing a turtle in 2010
Internal Examination - Laparoscopy
Laparoscopy used on turtles is a modification of human laparoscopic procedures that have been developed for rapid visual assessment of turtle and crocodile gonads (Limpus and Reed, 1985). Laparoscopy is used to determine the sex, maturity and breeding status within wild turtle populations and remains the most powerful non-lethal tool available for gathering these essential demographic parameters and guiding conservation management of threatened turtle populations (Chaloupka, 2002).
The Sea Turtle Resources of the Cocos (Keeling) Islands – Years 9-11 Project Report
- 6 -
Using the optical scope (laparoscope), the user can examine the gonads and can make a reliable and comprehensive identification of sex, maturity, current breeding status and past breeding history of turtles (Miller and Limpus, 2003; Limpus et al., 2005). The best reference guides to this technique are found in scientific journal articles (Limpus and Reed, 1985; Limpus, 1992; Limpus et al., 1994a,b; Limpus and Limpus, 2003). The laparoscope allows the identification and assessment of the relative size of ovarian structures (previtellogenic ovarian follicles, developing follicles, mature follicles, atretic follicles, corpora lutea, corpora albicantia, atretic disks) and associated oviducal structures of females and of the testis and epididymus of males (see Figures 18-21 for examples).
A short summary of procedures is listed below:
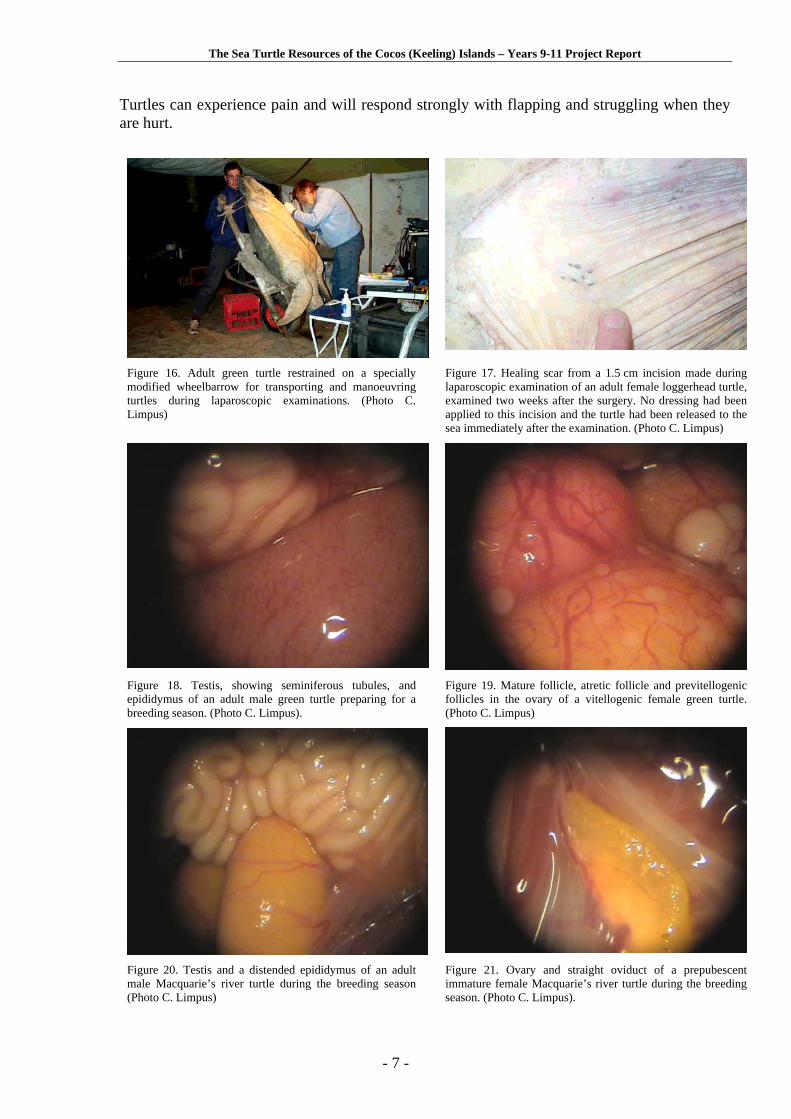
The turtle is restrained upside down on a rack or modified wheelbarrow (Figure 16) The site for incision is scrubbed clean with antiseptic (70% alcohol). An incision < l cm long is cut in the skin (size to match the cannula and matching
trochar) in the area in front of the hind-limb (inguinal pocket area) on the right-hand side (Figure 17). It is rare to see the turtle flinch or display any other sign of discomfort.
The site for insertion of the cannula has been chosen specifically: to avoid major blood vessels and nerves; to avoid the puncture of critical organs such as the stomach, lung, kidney
and liver; to use a site with few or no pain receptors; to use a site which is underlain by mostly fat and connective tissue; to use a site with minimal muscle layers; to make the minimal wound to the turtle and hence promote rapid
closure of the wound; because it is a good entry point for visual examination.
A detailed knowledge of turtle anatomy is required for determining the correct angle and depth of placement of the cannula and trochar so as to avoid critical body organs and blood vessels.
Correct placement of the end of the cannula into the coelomic space adjacent to the intestine is verified by visual inspection via the laparoscope before the body cavity is inflated with air using a manual pump. It is critical that the cannula is completely through the abdominal wall before inflation commences otherwise a fatal embolism may result.
With the cannula in the correct position, visual inspection of the gonads can take place After the retraction of the cannula, any air inserted into the body cavity is expelled The entry site is sutured closed with non-permanent thread. Training is conducted through specific teaching by experienced trainers or by
supervised autopsy of recently beach-washed turtles. In Australia, Dr Col Limpus is the only recognised trainer
Pain and Anaesthetic
No anaesthetics are used in this procedure, as it is important to maintain the capacity of the turtle to relay any signs of discomfort signalling a life-threatening problem during this procedure. This was on the advice from medical doctors who helped to develop this technique to maximise safety for the turtles. Linked with this has been the choice of an entry site where the turtle's responses suggest that it experiences very little or no pain from this procedure.
The Sea Turtle Resources of the Cocos (Keeling) Islands – Years 9-11 Project Report
- 7 -
Turtles can experience pain and will respond strongly with flapping and struggling when they are hurt.
Figure 16. Adult green turtle restrained on a specially modified wheelbarrow for transporting and manoeuvring turtles during laparoscopic examinations. (Photo C. Limpus)
Figure 17. Healing scar from a 1.5 cm incision made during laparoscopic examination of an adult female loggerhead turtle, examined two weeks after the surgery. No dressing had been applied to this incision and the turtle had been released to the sea immediately after the examination. (Photo C. Limpus)
Figure 18. Testis, showing seminiferous tubules, and epididymus of an adult male green turtle preparing for a breeding season. (Photo C. Limpus).
Figure 19. Mature follicle, atretic follicle and previtellogenic follicles in the ovary of a vitellogenic female green turtle. (Photo C. Limpus)
Figure 20. Testis and a distended epididymus of an adult male Macquarie’s river turtle during the breeding season (Photo C. Limpus)
Figure 21. Ovary and straight oviduct of a prepubescent immature female Macquarie’s river turtle during the breeding season. (Photo C. Limpus).
The Sea Turtle Resources of the Cocos (Keeling) Islands – Years 9-11 Project Report
- 8 -
External Examination
External examinations of each turtle were conducted to record damage, condition and commensals. Turtles were recorded in poor condition if they had low body weight, sunken plastron, sunken eyes or were lethargic. Turtles were examined for fibropapilloma growths that effect turtles in other study sites around the world. “New Recruits” into the population were recorded as those with distinct external characters which indicated a long period in the open ocean. These included lack of fouling from invertebrate organisms and marine algae, white plastron and a distinct colour difference between the skin on the ventral and dorsal parts of the shoulder. Growth rates
The growth rates were measured in curved carapace length (ccl) per year. Turtles with damage to the carapace that could affect the measurements were not measured. Only growth rates with time intervals of over 10 months were used for analysis. Population Estimates
Population estimates were calculated using mark-recapture data. These results must be considered preliminary because of the limited number of recaptures. Several methods can be used to estimate population sizes with mark-recapture data, however this preliminary analysis was conducted using Jolly-Seber analysis (Caughley, 1977) and was calculated using Krebs/Win Software (Krebs and Brzustowski, 1998).
Community Education
Community education continued at West and Home Islands during 2008, 2009 and 2010. This included school and community presentations and hands-on views of sea turtles at West Island and Home Island.
Nesting Turtles
A patrol of the southern beaches of South Island was conducted to estimate nesting activity in 2009. However, because of the lack of available vessel and strong winds, no surveys could be conducted on North Keeling in 2008 or 2010.
The Sea Turtle Resources of the Cocos (Keeling) Islands – Years 9-11 Project Report
- 9 -
RESULTS Foraging Turtles
Capture Data
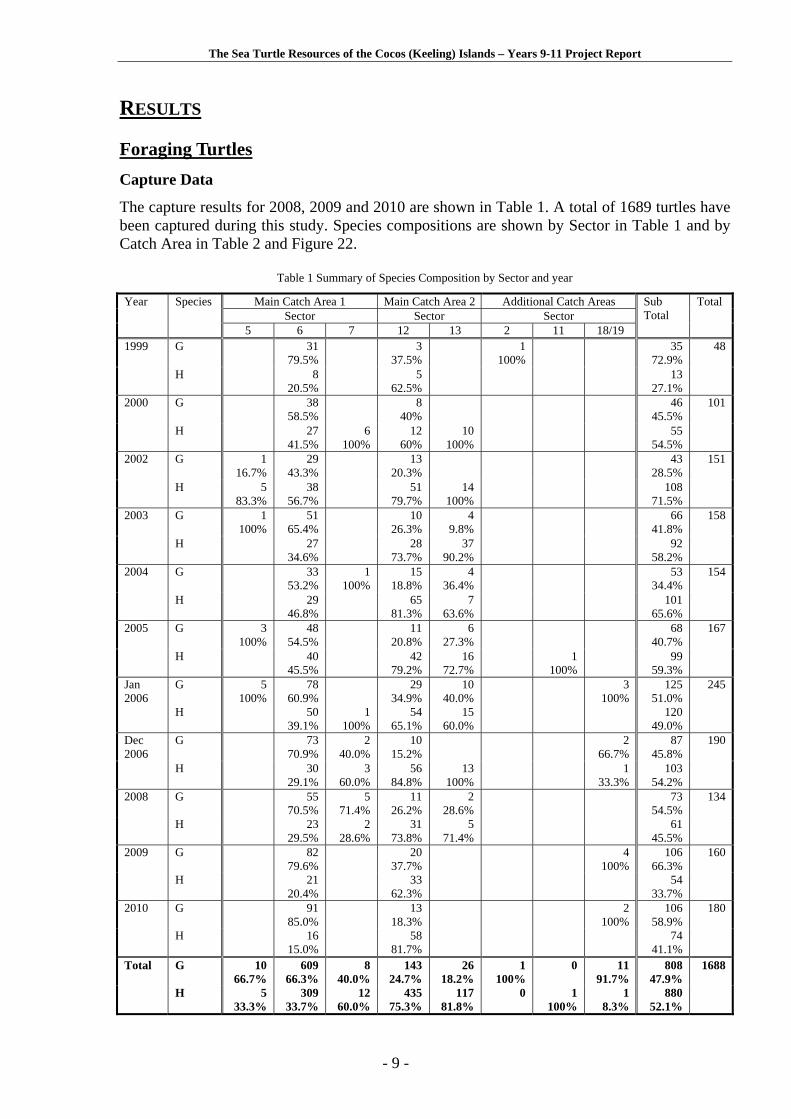
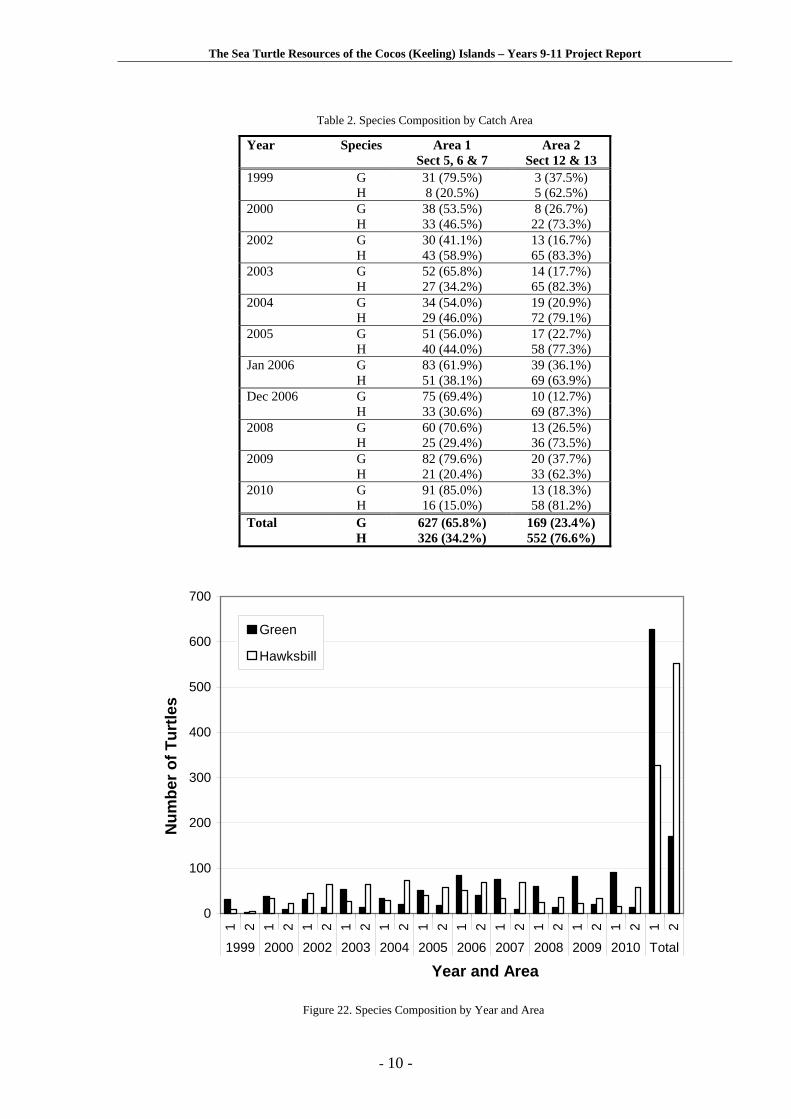
The capture results for 2008, 2009 and 2010 are shown in Table 1. A total of 1689 turtles have been captured during this study. Species compositions are shown by Sector in Table 1 and by Catch Area in Table 2 and Figure 22.
Table 1 Summary of Species Composition by Sector and year
Main Catch Area 1 Main Catch Area 2 Additional Catch Areas Sector Sector Sector
Year Species
5 6 7 12 13 2 11 18/19
Sub Total
Total
1999 G 31 79.5%
3 37.5%
1 100%
35 72.9%
H 8 20.5%
5 62.5%
13 27.1%
48
2000 G 38 58.5%
8 40%
46 45.5%
H 27 41.5%
6 100%
12 60%
10 100%
55 54.5%
101
2002 G 1 16.7%
29 43.3%
13 20.3%
43 28.5%
H 5 83.3%
38 56.7%
51 79.7%
14 100%
108 71.5%
151
2003 G 1 100%
51 65.4%
10 26.3%
4 9.8%
66 41.8%
H 27 34.6%
28 73.7%
37 90.2%
92 58.2%
158
2004 G 33 53.2%
1 100%
15 18.8%
4 36.4%
53 34.4%
H 29 46.8%
65 81.3%
7 63.6%
101 65.6%
154
2005 G
3 100%
48 54.5%
11 20.8%
6 27.3%
68 40.7%
H
40 45.5%
42 79.2%
16 72.7%
1 100%
99 59.3%
167
Jan 2006
G H
5 100%
78 60.9%
50 39.1%
1 100%
29 34.9%
54 65.1%
10 40.0%
15 60.0%
3 100%
125 51.0%
120 49.0%
245
G 73 70.9%
2 40.0%
10 15.2%
2 66.7%
87 45.8%
190 Dec 2006
H 30 29.1%
3 60.0%
56 84.8%
13 100%
1 33.3%
103 54.2%
2008 G 55 70.5%
5 71.4%
11 26.2%
2 28.6%
73 54.5%
134
H 23 29.5%
2 28.6%
31 73.8%
5 71.4%
61 45.5%
2009 G 82 79.6%
20 37.7%
4 100%
106 66.3%
160
H 21 20.4%
33 62.3%
54 33.7%
2010 G 91 85.0%
13 18.3%
2 100%
106 58.9%
180
H 16 15.0%
58 81.7%
74 41.1%
Total G 10 66.7%
609 66.3%
8 40.0%
143 24.7%
26 18.2%
1 100%
0 11 91.7%
808 47.9%
1688
H 5 33.3%
309 33.7%
12 60.0%
435 75.3%
117 81.8%
0 1 100%
1 8.3%
880 52.1%
The Sea Turtle Resources of the Cocos (Keeling) Islands – Years 9-11 Project Report
- 10 -
Table 2. Species Composition by Catch Area
Year Species Area 1 Sect 5, 6 & 7
Area 2 Sect 12 & 13
1999 G 31 (79.5%) 3 (37.5%) H 8 (20.5%) 5 (62.5%) 2000 G 38 (53.5%) 8 (26.7%) H 33 (46.5%) 22 (73.3%) 2002 G 30 (41.1%) 13 (16.7%) H 43 (58.9%) 65 (83.3%) 2003 G 52 (65.8%) 14 (17.7%) H 27 (34.2%) 65 (82.3%) 2004 G 34 (54.0%) 19 (20.9%) H 29 (46.0%) 72 (79.1%) 2005 G 51 (56.0%) 17 (22.7%) H 40 (44.0%) 58 (77.3%) Jan 2006 G
H 83 (61.9%) 51 (38.1%)
39 (36.1%) 69 (63.9%)
Dec 2006 G 75 (69.4%) 10 (12.7%) H 33 (30.6%) 69 (87.3%) 2008 G
H 60 (70.6%) 25 (29.4%)
13 (26.5%) 36 (73.5%)
2009 G H
82 (79.6%) 21 (20.4%)
20 (37.7%) 33 (62.3%)
2010 G H
91 (85.0%) 16 (15.0%)
13 (18.3%) 58 (81.2%)
Total G 627 (65.8%) 169 (23.4%) H 326 (34.2%) 552 (76.6%)
0
100
200
300
400
500
600
700
1 2 1 2 1 2 1 2 1 2 1 2 1 2 1 2 1 2 1 2 1 2 1 2
1999 2000 2002 2003 2004 2005 2006 2007 2008 2009 2010 Total
Year and Area
Nu
mb
er o
f T
urt
les
Green
Hawksbill
Figure 22. Species Composition by Year and Area
The Sea Turtle Resources of the Cocos (Keeling) Islands – Years 9-11 Project Report
- 11 -
Percentage of Recaptures
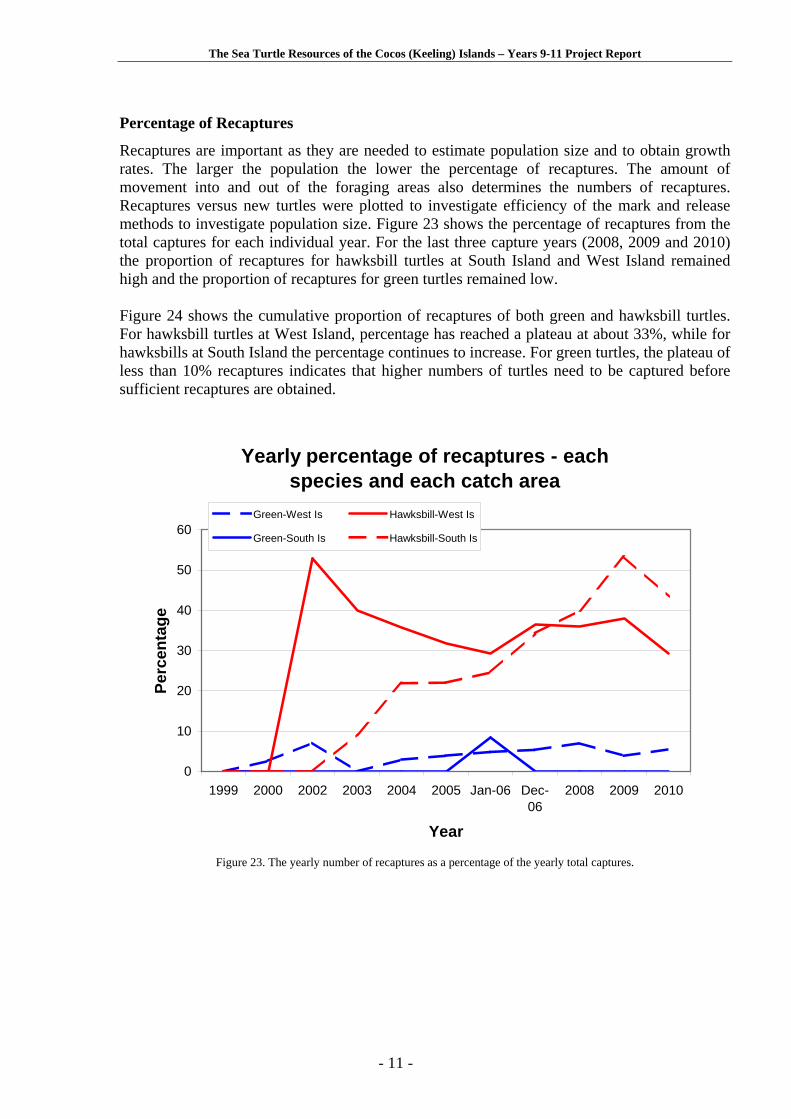
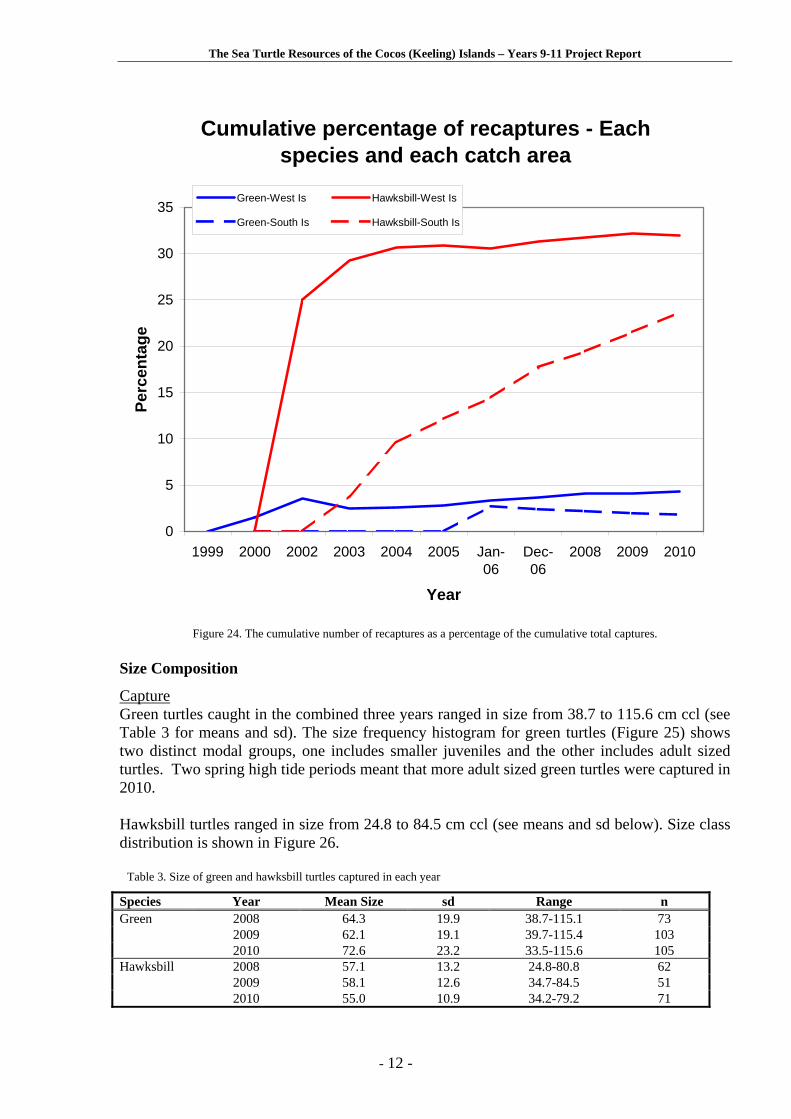
Recaptures are important as they are needed to estimate population size and to obtain growth rates. The larger the population the lower the percentage of recaptures. The amount of movement into and out of the foraging areas also determines the numbers of recaptures. Recaptures versus new turtles were plotted to investigate efficiency of the mark and release methods to investigate population size. Figure 23 shows the percentage of recaptures from the total captures for each individual year. For the last three capture years (2008, 2009 and 2010) the proportion of recaptures for hawksbill turtles at South Island and West Island remained high and the proportion of recaptures for green turtles remained low. Figure 24 shows the cumulative proportion of recaptures of both green and hawksbill turtles. For hawksbill turtles at West Island, percentage has reached a plateau at about 33%, while for hawksbills at South Island the percentage continues to increase. For green turtles, the plateau of less than 10% recaptures indicates that higher numbers of turtles need to be captured before sufficient recaptures are obtained.
Yearly percentage of recaptures - each species and each catch area
0
10
20
30
40
50
60
1999 2000 2002 2003 2004 2005 Jan-06 Dec-06
2008 2009 2010
Year
Per
cen
tag
e
Green-West Is Hawksbill-West Is
Green-South Is Hawksbill-South Is
Figure 23. The yearly number of recaptures as a percentage of the yearly total captures.
The Sea Turtle Resources of the Cocos (Keeling) Islands – Years 9-11 Project Report
- 12 -
Cumulative percentage of recaptures - Each species and each catch area
0
5
10
15
20
25
30
35
1999 2000 2002 2003 2004 2005 Jan-06
Dec-06
2008 2009 2010
Year
Per
cen
tag
e
Green-West Is Hawksbill-West Is
Green-South Is Hawksbill-South Is
Figure 24. The cumulative number of recaptures as a percentage of the cumulative total captures. Size Composition
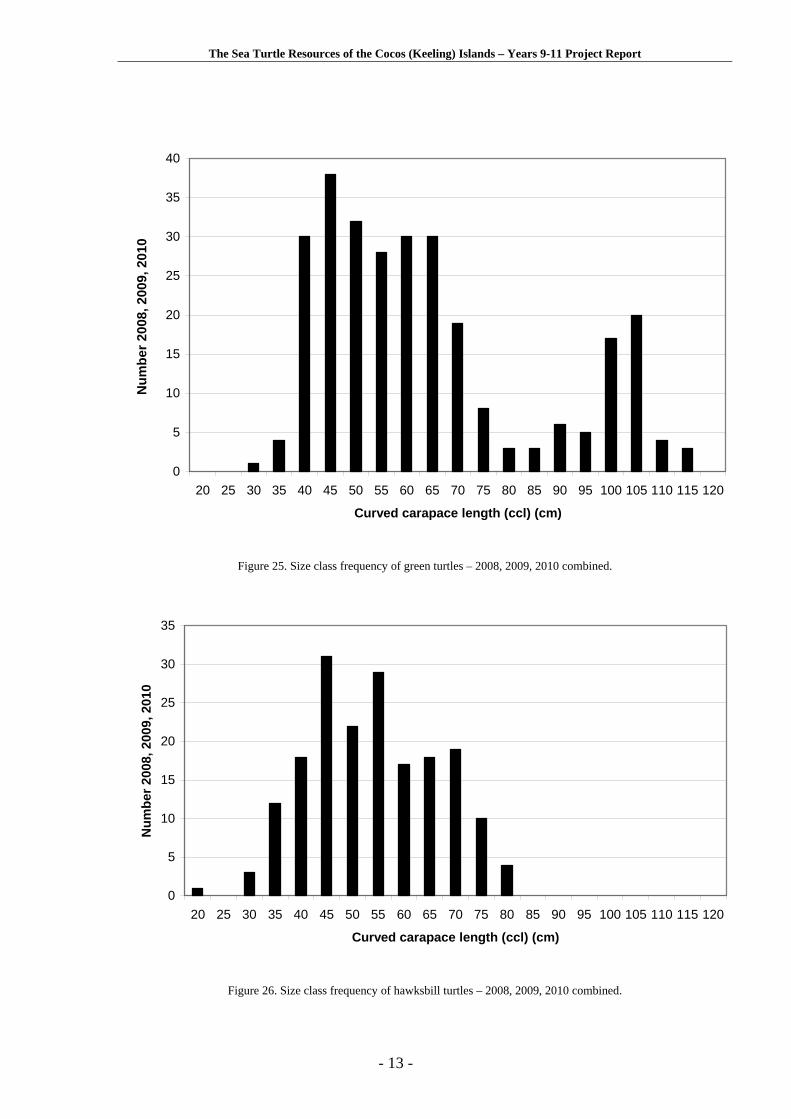
Capture Green turtles caught in the combined three years ranged in size from 38.7 to 115.6 cm ccl (see Table 3 for means and sd). The size frequency histogram for green turtles (Figure 25) shows two distinct modal groups, one includes smaller juveniles and the other includes adult sized turtles. Two spring high tide periods meant that more adult sized green turtles were captured in 2010. Hawksbill turtles ranged in size from 24.8 to 84.5 cm ccl (see means and sd below). Size class distribution is shown in Figure 26.
Table 3. Size of green and hawksbill turtles captured in each year
Species Year Mean Size sd Range n 2008 64.3 19.9 38.7-115.1 73 2009 62.1 19.1 39.7-115.4 103
Green
2010 72.6 23.2 33.5-115.6 105 2008 57.1 13.2 24.8-80.8 62 2009 58.1 12.6 34.7-84.5 51
Hawksbill
2010 55.0 10.9 34.2-79.2 71
The Sea Turtle Resources of the Cocos (Keeling) Islands – Years 9-11 Project Report
- 13 -
0
5
10
15
20
25
30
35
40
20 25 30 35 40 45 50 55 60 65 70 75 80 85 90 95 100 105 110 115 120
Curved carapace length (ccl) (cm)
Nu
mb
er 2
008,
200
9, 2
010
Figure 25. Size class frequency of green turtles – 2008, 2009, 2010 combined.
0
5
10
15
20
25
30
35
20 25 30 35 40 45 50 55 60 65 70 75 80 85 90 95 100 105 110 115 120
Curved carapace length (ccl) (cm)
Nu
mb
er 2
008,
200
9, 2
010
Figure 26. Size class frequency of hawksbill turtles – 2008, 2009, 2010 combined.
The Sea Turtle Resources of the Cocos (Keeling) Islands – Years 9-11 Project Report
- 14 -
0
20
40
60
80
100
0 1 2
Sector
Mea
n a
nd
Sd
Hawksbill
Green
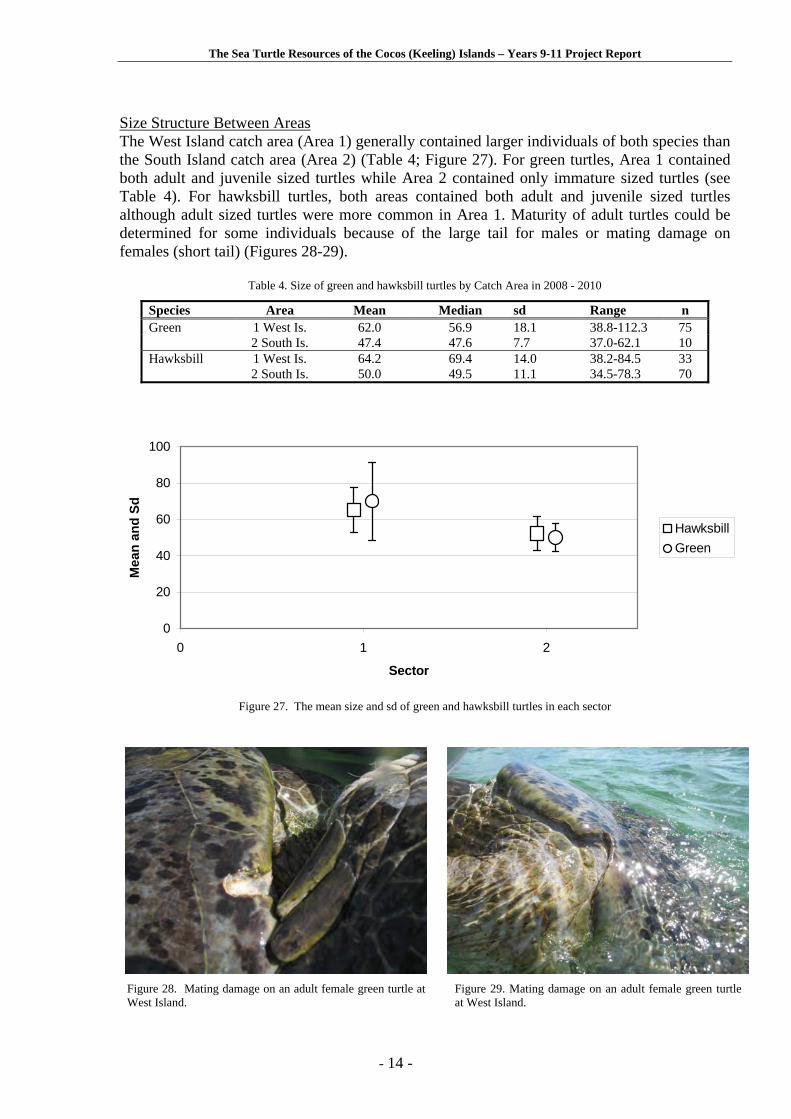
Size Structure Between Areas The West Island catch area (Area 1) generally contained larger individuals of both species than the South Island catch area (Area 2) (Table 4; Figure 27). For green turtles, Area 1 contained both adult and juvenile sized turtles while Area 2 contained only immature sized turtles (see Table 4). For hawksbill turtles, both areas contained both adult and juvenile sized turtles although adult sized turtles were more common in Area 1. Maturity of adult turtles could be determined for some individuals because of the large tail for males or mating damage on females (short tail) (Figures 28-29).
Table 4. Size of green and hawksbill turtles by Catch Area in 2008 - 2010
Species Area Mean Median sd Range n 1 West Is. 62.0 56.9 18.1 38.8-112.3 75 Green 2 South Is. 47.4 47.6 7.7 37.0-62.1 10 1 West Is. 64.2 69.4 14.0 38.2-84.5 33 Hawksbill 2 South Is. 50.0 49.5 11.1 34.5-78.3 70
Figure 27. The mean size and sd of green and hawksbill turtles in each sector
Figure 28. Mating damage on an adult female green turtle at West Island.
Figure 29. Mating damage on an adult female green turtle at West Island.
The Sea Turtle Resources of the Cocos (Keeling) Islands – Years 9-11 Project Report
- 15 -
Internal Examination – Laparoscopy
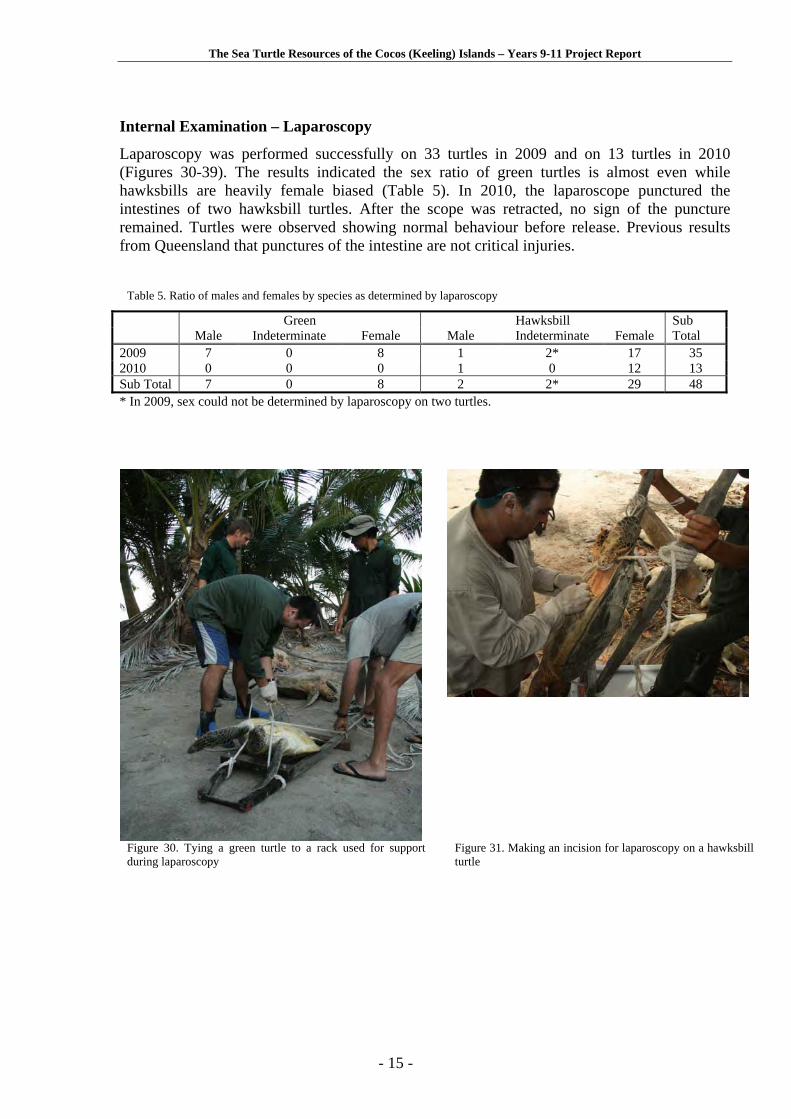
Laparoscopy was performed successfully on 33 turtles in 2009 and on 13 turtles in 2010 (Figures 30-39). The results indicated the sex ratio of green turtles is almost even while hawksbills are heavily female biased (Table 5). In 2010, the laparoscope punctured the intestines of two hawksbill turtles. After the scope was retracted, no sign of the puncture remained. Turtles were observed showing normal behaviour before release. Previous results from Queensland that punctures of the intestine are not critical injuries.
Table 5. Ratio of males and females by species as determined by laparoscopy
Green Hawksbill Male Indeterminate Female Male Indeterminate Female
Sub Total
2009 7 0 8 1 2* 17 35 2010 0 0 0 1 0 12 13 Sub Total 7 0 8 2 2* 29 48 * In 2009, sex could not be determined by laparoscopy on two turtles.
Figure 30. Tying a green turtle to a rack used for support during laparoscopy
Figure 31. Making an incision for laparoscopy on a hawksbill turtle
The Sea Turtle Resources of the Cocos (Keeling) Islands – Years 9-11 Project Report
- 16 -
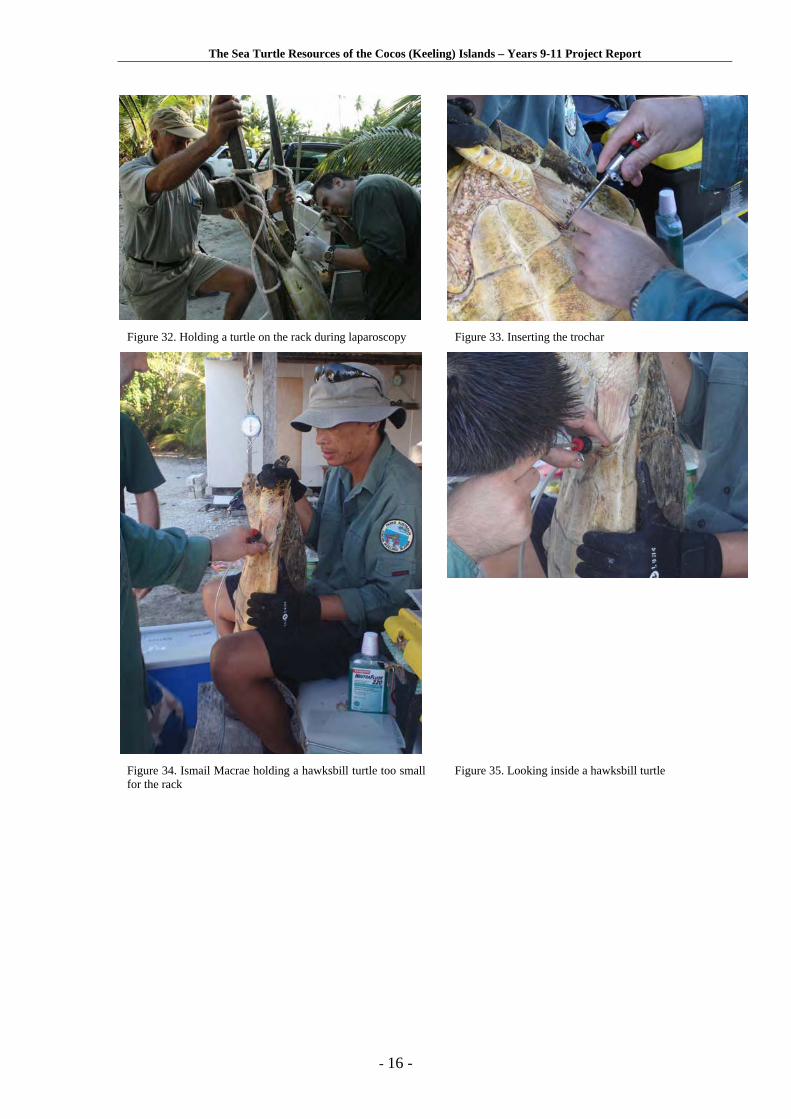
Figure 32. Holding a turtle on the rack during laparoscopy Figure 33. Inserting the trochar
Figure 34. Ismail Macrae holding a hawksbill turtle too small for the rack
Figure 35. Looking inside a hawksbill turtle
The Sea Turtle Resources of the Cocos (Keeling) Islands – Years 9-11 Project Report
- 17 -
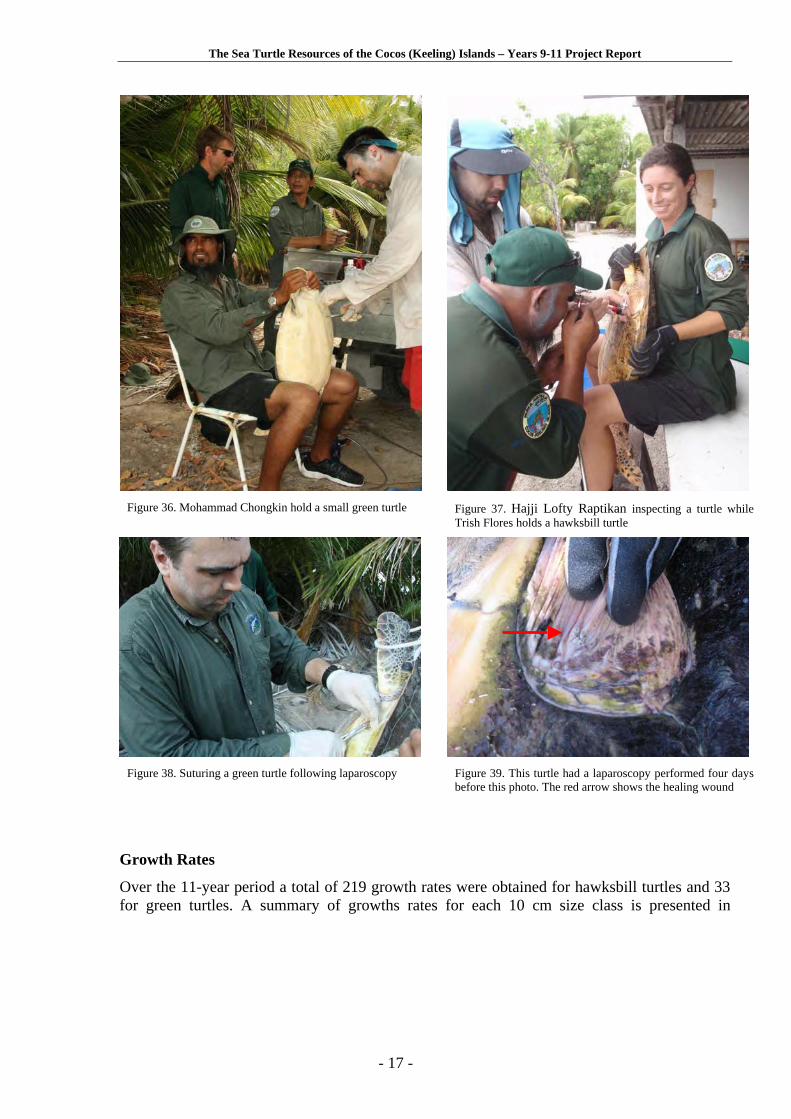
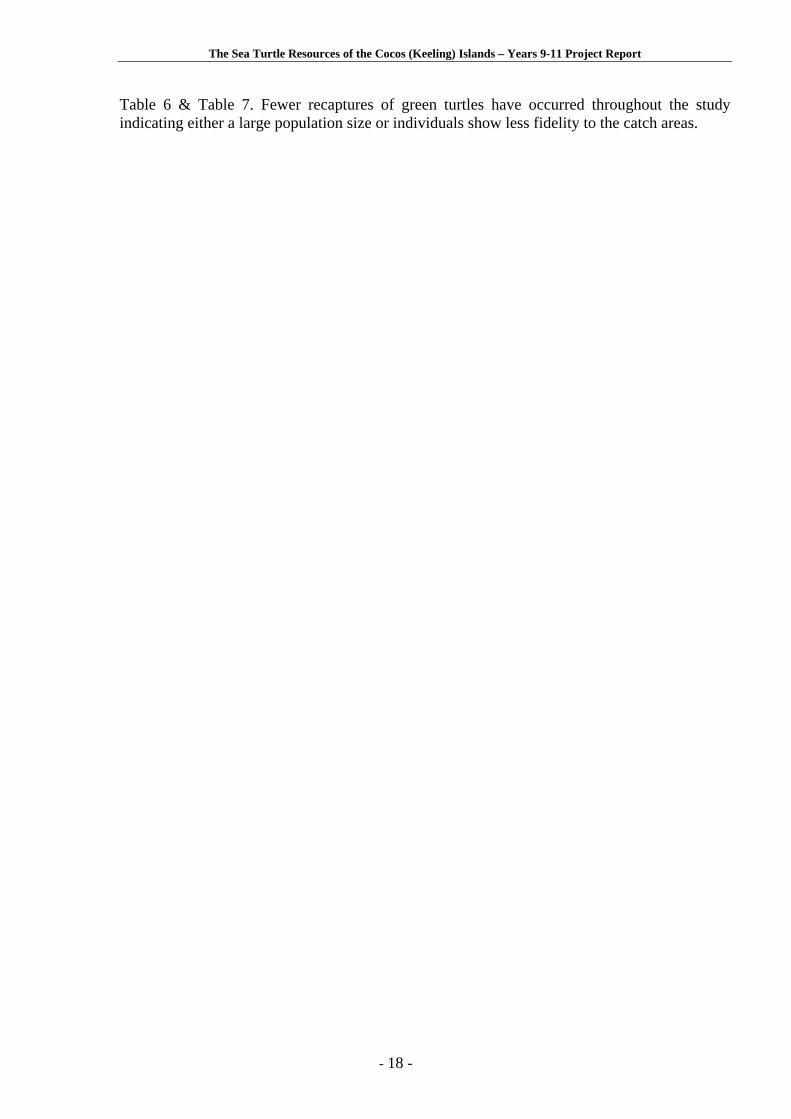
Figure 36. Mohammad Chongkin hold a small green turtle Figure 37. Hajji Lofty Raptikan inspecting a turtle while
Trish Flores holds a hawksbill turtle
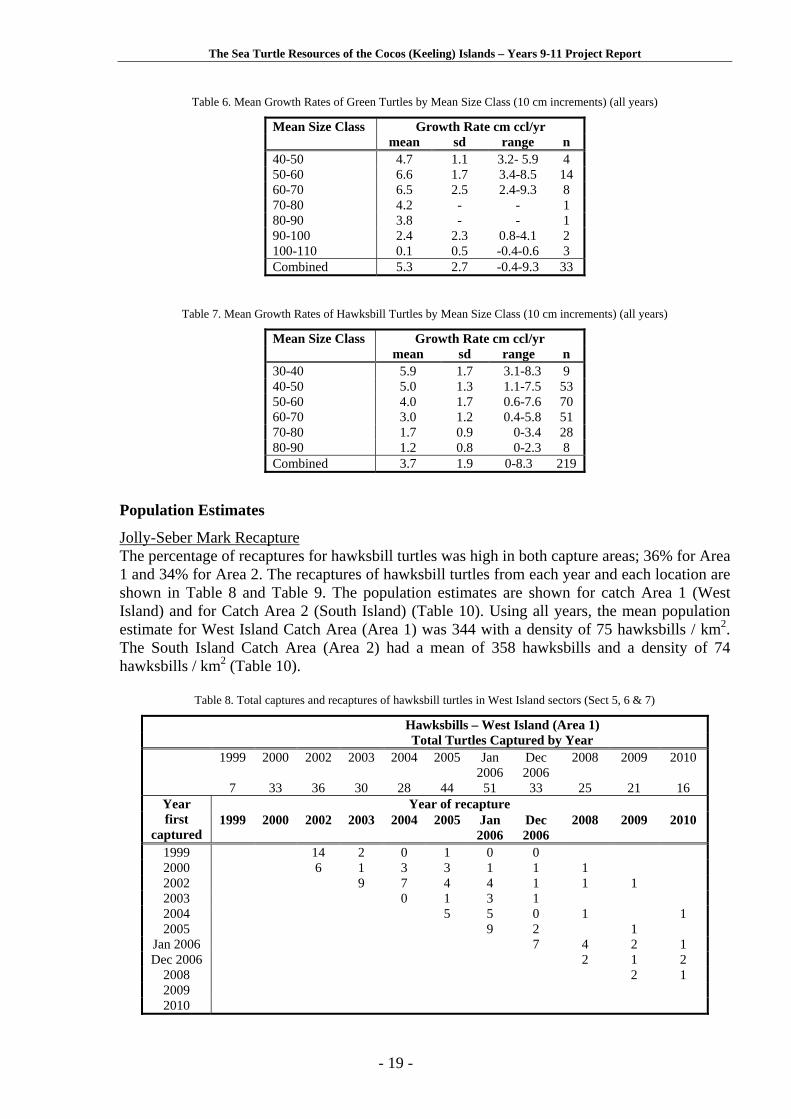
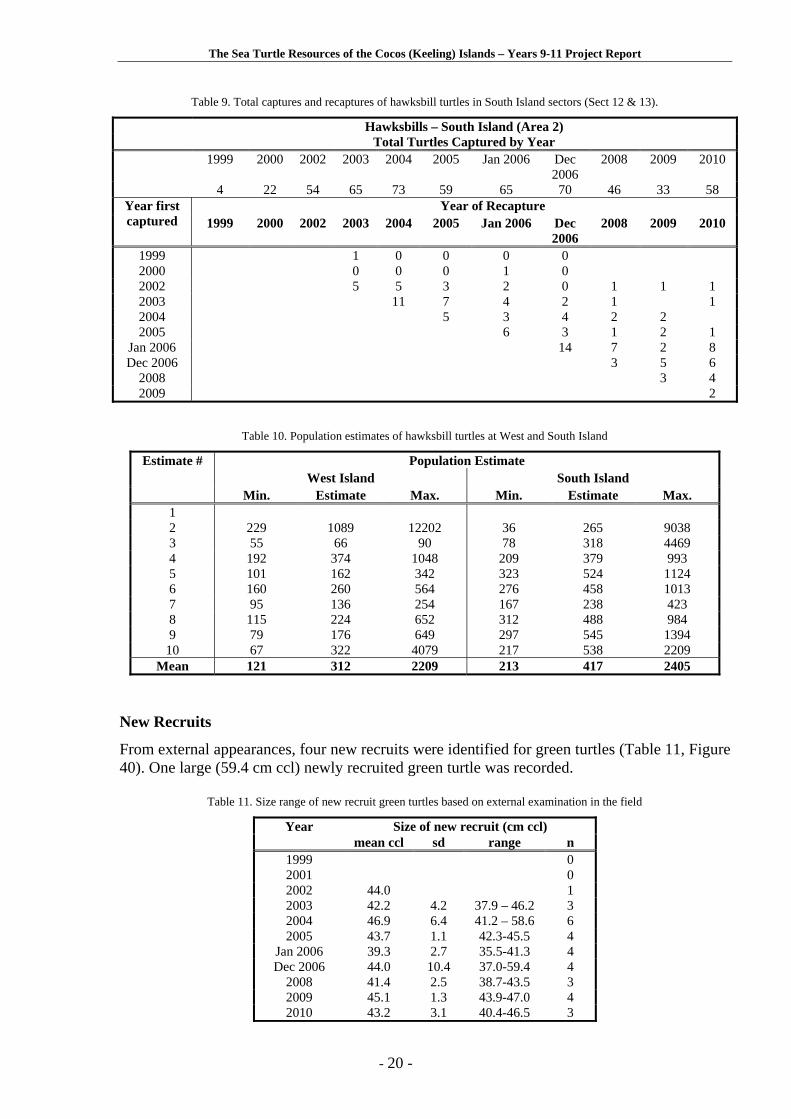
Figure 38. Suturing a green turtle following laparoscopy Figure 39. This turtle had a laparoscopy performed four days
before this photo. The red arrow shows the healing wound
Growth Rates
Over the 11-year period a total of 219 growth rates were obtained for hawksbill turtles and 33 for green turtles. A summary of growths rates for each 10 cm size class is presented in
The Sea Turtle Resources of the Cocos (Keeling) Islands – Years 9-11 Project Report
- 18 -
Table 6 & Table 7. Fewer recaptures of green turtles have occurred throughout the study indicating either a large population size or individuals show less fidelity to the catch areas.
The Sea Turtle Resources of the Cocos (Keeling) Islands – Years 9-11 Project Report
- 19 -
Table 6. Mean Growth Rates of Green Turtles by Mean Size Class (10 cm increments) (all years)
Mean Size Class Growth Rate cm ccl/yr mean sd range n 40-50 4.7 1.1 3.2- 5.9 4 50-60 6.6 1.7 3.4-8.5 14 60-70 6.5 2.5 2.4-9.3 8 70-80 4.2 - - 1 80-90 3.8 - - 1 90-100 2.4 2.3 0.8-4.1 2 100-110 0.1 0.5 -0.4-0.6 3 Combined 5.3 2.7 -0.4-9.3 33
Table 7. Mean Growth Rates of Hawksbill Turtles by Mean Size Class (10 cm increments) (all years)
Mean Size Class Growth Rate cm ccl/yr mean sd range n 30-40 5.9 1.7 3.1-8.3 9 40-50 5.0 1.3 1.1-7.5 53 50-60 4.0 1.7 0.6-7.6 70 60-70 3.0 1.2 0.4-5.8 51 70-80 1.7 0.9 0-3.4 28 80-90 1.2 0.8 0-2.3 8 Combined 3.7 1.9 0-8.3 219
Population Estimates
Jolly-Seber Mark Recapture The percentage of recaptures for hawksbill turtles was high in both capture areas; 36% for Area 1 and 34% for Area 2. The recaptures of hawksbill turtles from each year and each location are shown in Table 8 and Table 9. The population estimates are shown for catch Area 1 (West Island) and for Catch Area 2 (South Island) (Table 10). Using all years, the mean population estimate for West Island Catch Area (Area 1) was 344 with a density of 75 hawksbills / km2. The South Island Catch Area (Area 2) had a mean of 358 hawksbills and a density of 74 hawksbills / km2 (Table 10).
Table 8. Total captures and recaptures of hawksbill turtles in West Island sectors (Sect 5, 6 & 7)
Hawksbills – West Island (Area 1) Total Turtles Captured by Year 1999 2000 2002 2003 2004 2005 Jan
2006 Dec 2006
2008 2009 2010
7 33 36 30 28 44 51 33 25 21 16 Year of recapture Year
first captured
1999 2000 2002 2003 2004 2005 Jan 2006
Dec 2006
2008 2009 2010
1999 14 2 0 1 0 0 2000 6 1 3 3 1 1 1 2002 9 7 4 4 1 1 1 2003 0 1 3 1 2004 5 5 0 1 1 2005 9 2 1
Jan 2006 7 4 2 1 Dec 2006 2 1 2
2008 2 1 2009 2010
The Sea Turtle Resources of the Cocos (Keeling) Islands – Years 9-11 Project Report
- 20 -
Table 9. Total captures and recaptures of hawksbill turtles in South Island sectors (Sect 12 & 13).
Hawksbills – South Island (Area 2) Total Turtles Captured by Year 1999 2000 2002 2003 2004 2005 Jan 2006 Dec
2006 2008 2009 2010
4 22 54 65 73 59 65 70 46 33 58 Year of Recapture Year first
captured 1999 2000 2002 2003 2004 2005 Jan 2006 Dec 2006
2008 2009 2010
1999 1 0 0 0 0 2000 0 0 0 1 0 2002 5 5 3 2 0 1 1 1 2003 11 7 4 2 1 1 2004 5 3 4 2 2 2005 6 3 1 2 1
Jan 2006 14 7 2 8 Dec 2006 3 5 6
2008 3 4 2009 2
Table 10. Population estimates of hawksbill turtles at West and South Island
Population Estimate West Island South Island
Estimate #
Min. Estimate Max. Min. Estimate Max. 1 2 229 1089 12202 36 265 9038 3 55 66 90 78 318 4469 4 192 374 1048 209 379 993 5 101 162 342 323 524 1124 6 160 260 564 276 458 1013 7 95 136 254 167 238 423 8 115 224 652 312 488 984 9 79 176 649 297 545 1394
10 67 322 4079 217 538 2209 Mean 121 312 2209 213 417 2405
New Recruits
From external appearances, four new recruits were identified for green turtles (Table 11, Figure 40). One large (59.4 cm ccl) newly recruited green turtle was recorded.
Table 11. Size range of new recruit green turtles based on external examination in the field
Size of new recruit (cm ccl) Year mean ccl sd range n
1999 0 2001 0 2002 44.0 1 2003 42.2 4.2 37.9 – 46.2 3 2004 46.9 6.4 41.2 – 58.6 6 2005 43.7 1.1 42.3-45.5 4
Jan 2006 39.3 2.7 35.5-41.3 4 Dec 2006 44.0 10.4 37.0-59.4 4
2008 41.4 2.5 38.7-43.5 3 2009 45.1 1.3 43.9-47.0 4 2010 43.2 3.1 40.4-46.5 3
The Sea Turtle Resources of the Cocos (Keeling) Islands – Years 9-11 Project Report
- 21 -
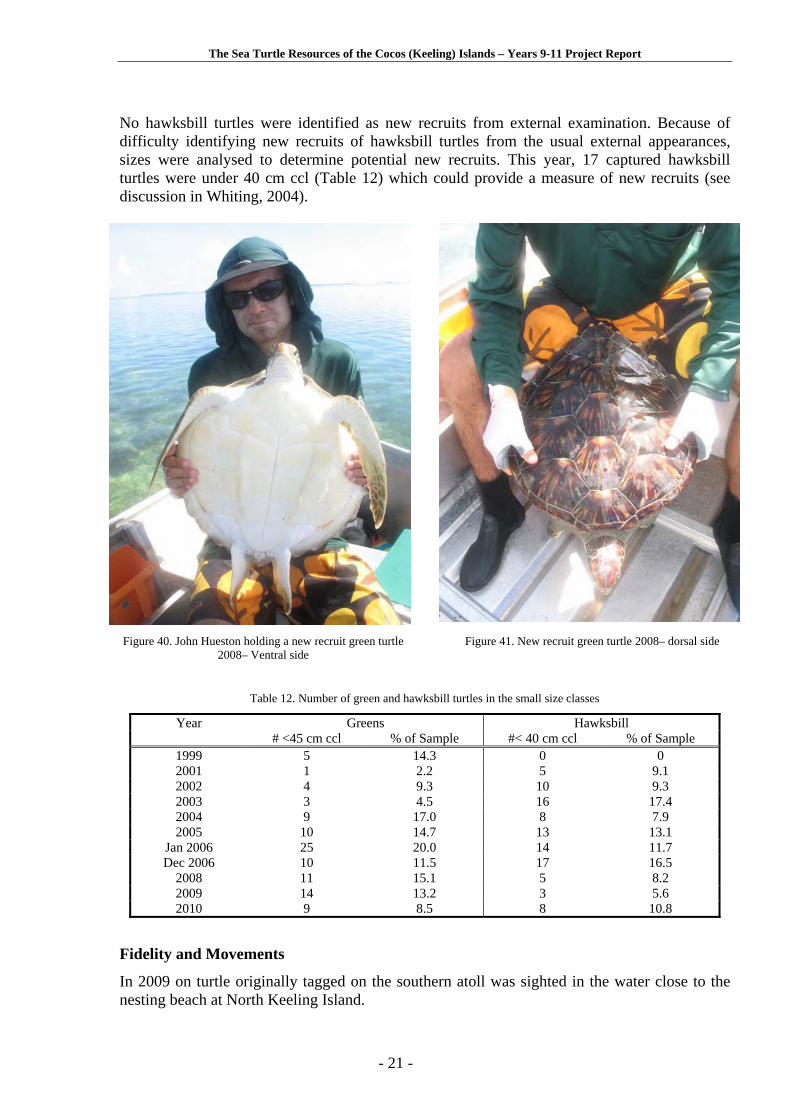
No hawksbill turtles were identified as new recruits from external examination. Because of difficulty identifying new recruits of hawksbill turtles from the usual external appearances, sizes were analysed to determine potential new recruits. This year, 17 captured hawksbill turtles were under 40 cm ccl (Table 12) which could provide a measure of new recruits (see discussion in Whiting, 2004).
Figure 40. John Hueston holding a new recruit green turtle 2008– Ventral side
Figure 41. New recruit green turtle 2008– dorsal side
Table 12. Number of green and hawksbill turtles in the small size classes
Year Greens Hawksbill # <45 cm ccl % of Sample #< 40 cm ccl % of Sample
1999 5 14.3 0 0 2001 1 2.2 5 9.1 2002 4 9.3 10 9.3 2003 3 4.5 16 17.4 2004 9 17.0 8 7.9 2005 10 14.7 13 13.1
Jan 2006 25 20.0 14 11.7 Dec 2006 10 11.5 17 16.5
2008 11 15.1 5 8.2 2009 14 13.2 3 5.6 2010 9 8.5 8 10.8
Fidelity and Movements
In 2009 on turtle originally tagged on the southern atoll was sighted in the water close to the nesting beach at North Keeling Island.
The Sea Turtle Resources of the Cocos (Keeling) Islands – Years 9-11 Project Report
- 22 -
Health and Condition
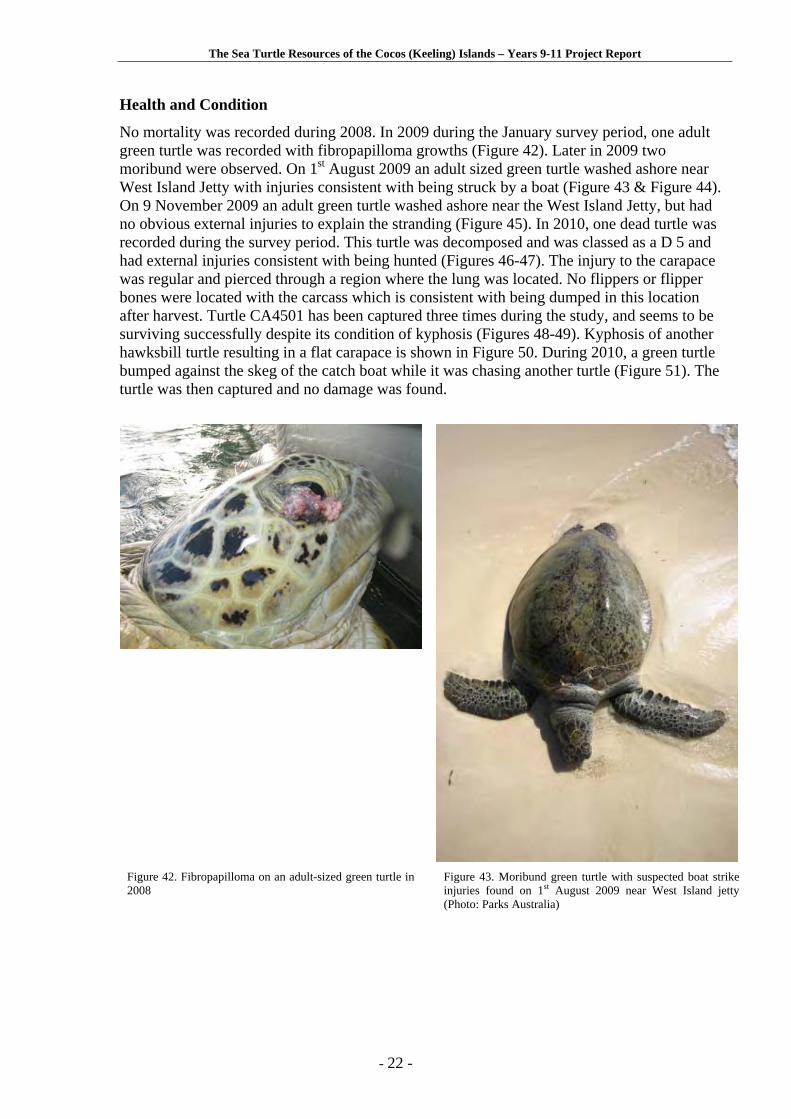
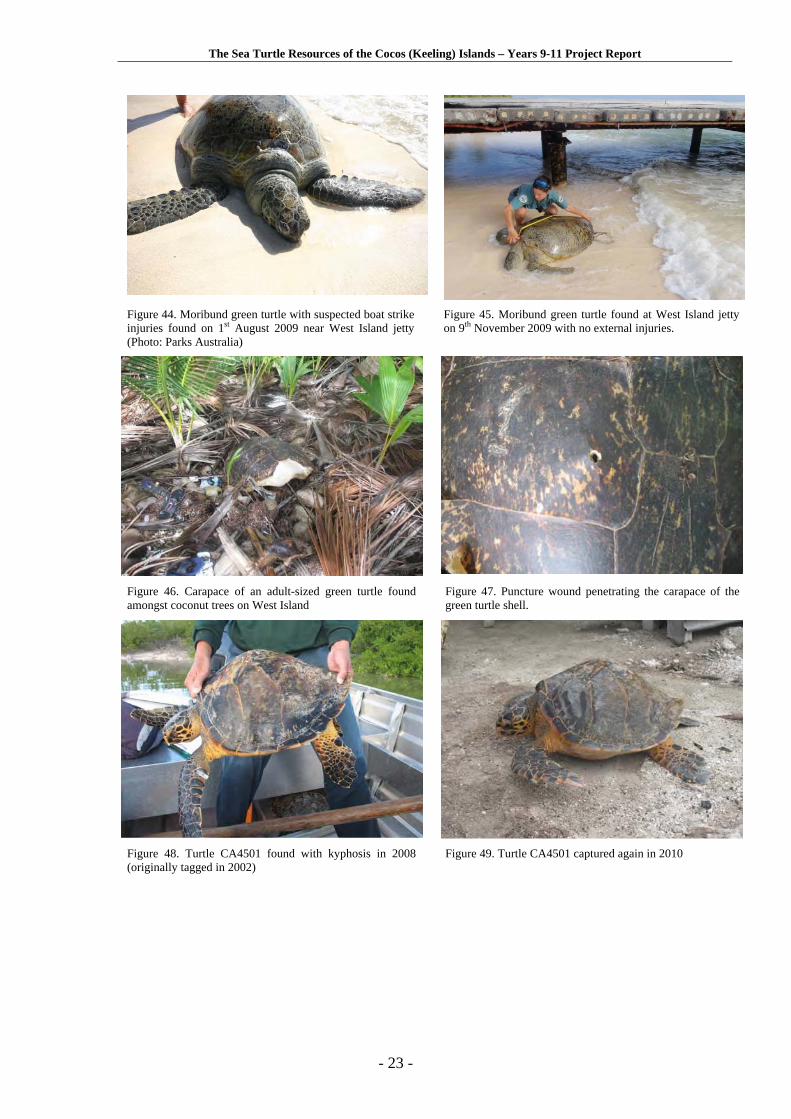
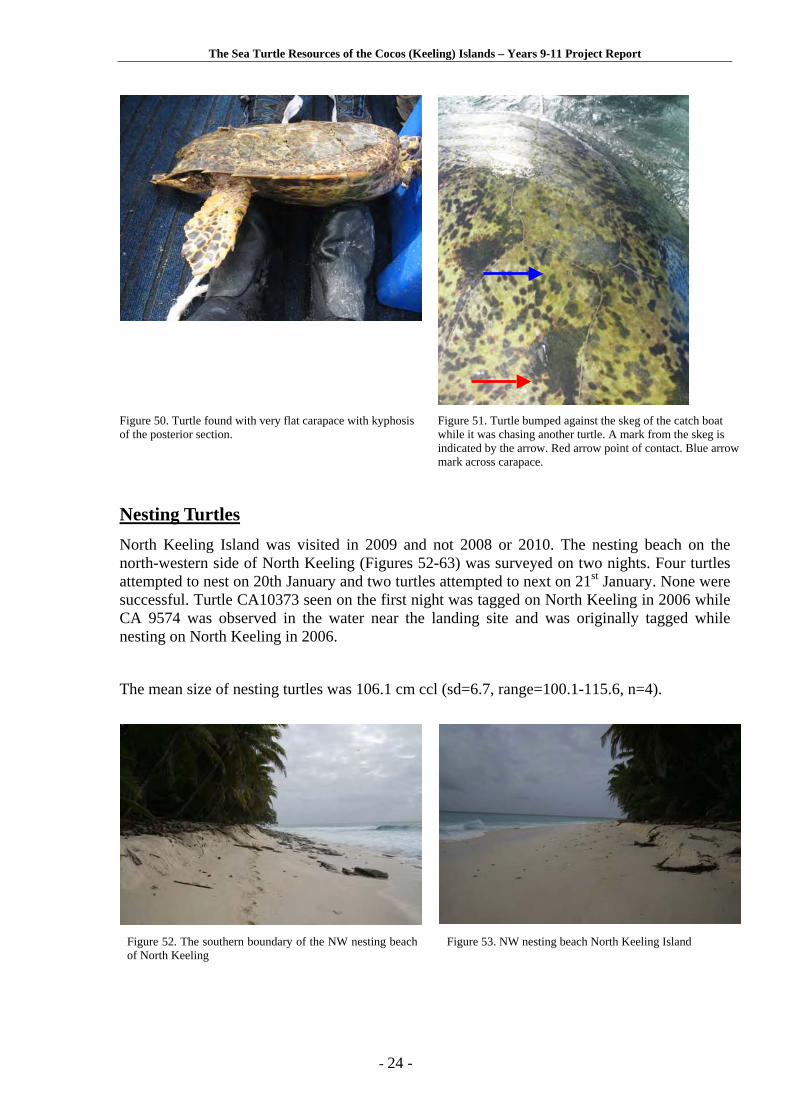
No mortality was recorded during 2008. In 2009 during the January survey period, one adult green turtle was recorded with fibropapilloma growths (Figure 42). Later in 2009 two moribund were observed. On 1st August 2009 an adult sized green turtle washed ashore near West Island Jetty with injuries consistent with being struck by a boat (Figure 43 & Figure 44). On 9 November 2009 an adult green turtle washed ashore near the West Island Jetty, but had no obvious external injuries to explain the stranding (Figure 45). In 2010, one dead turtle was recorded during the survey period. This turtle was decomposed and was classed as a D 5 and had external injuries consistent with being hunted (Figures 46-47). The injury to the carapace was regular and pierced through a region where the lung was located. No flippers or flipper bones were located with the carcass which is consistent with being dumped in this location after harvest. Turtle CA4501 has been captured three times during the study, and seems to be surviving successfully despite its condition of kyphosis (Figures 48-49). Kyphosis of another hawksbill turtle resulting in a flat carapace is shown in Figure 50. During 2010, a green turtle bumped against the skeg of the catch boat while it was chasing another turtle (Figure 51). The turtle was then captured and no damage was found.
Figure 42. Fibropapilloma on an adult-sized green turtle in 2008
Figure 43. Moribund green turtle with suspected boat strike injuries found on 1st August 2009 near West Island jetty (Photo: Parks Australia)
The Sea Turtle Resources of the Cocos (Keeling) Islands – Years 9-11 Project Report
- 23 -
Figure 44. Moribund green turtle with suspected boat strike injuries found on 1st August 2009 near West Island jetty (Photo: Parks Australia)
Figure 45. Moribund green turtle found at West Island jetty on 9th November 2009 with no external injuries.
Figure 46. Carapace of an adult-sized green turtle found amongst coconut trees on West Island
Figure 47. Puncture wound penetrating the carapace of the green turtle shell.
Figure 48. Turtle CA4501 found with kyphosis in 2008 (originally tagged in 2002)
Figure 49. Turtle CA4501 captured again in 2010
The Sea Turtle Resources of the Cocos (Keeling) Islands – Years 9-11 Project Report
- 24 -
Figure 50. Turtle found with very flat carapace with kyphosis of the posterior section.
Figure 51. Turtle bumped against the skeg of the catch boat while it was chasing another turtle. A mark from the skeg is indicated by the arrow. Red arrow point of contact. Blue arrow mark across carapace.
Nesting Turtles
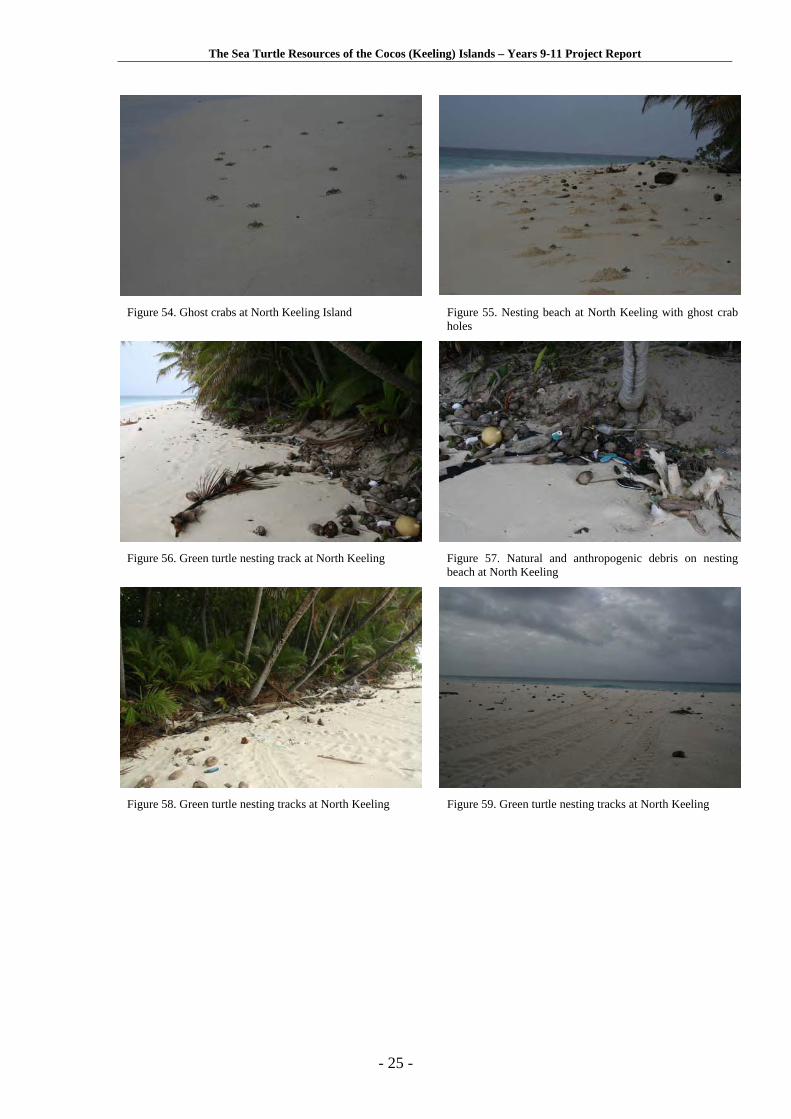
North Keeling Island was visited in 2009 and not 2008 or 2010. The nesting beach on the north-western side of North Keeling (Figures 52-63) was surveyed on two nights. Four turtles attempted to nest on 20th January and two turtles attempted to next on 21st January. None were successful. Turtle CA10373 seen on the first night was tagged on North Keeling in 2006 while CA 9574 was observed in the water near the landing site and was originally tagged while nesting on North Keeling in 2006.
The mean size of nesting turtles was 106.1 cm ccl (sd=6.7, range=100.1-115.6, n=4).
Figure 52. The southern boundary of the NW nesting beach of North Keeling
Figure 53. NW nesting beach North Keeling Island
The Sea Turtle Resources of the Cocos (Keeling) Islands – Years 9-11 Project Report
- 25 -
Figure 54. Ghost crabs at North Keeling Island Figure 55. Nesting beach at North Keeling with ghost crab
holes
Figure 56. Green turtle nesting track at North Keeling Figure 57. Natural and anthropogenic debris on nesting
beach at North Keeling
Figure 58. Green turtle nesting tracks at North Keeling Figure 59. Green turtle nesting tracks at North Keeling
The Sea Turtle Resources of the Cocos (Keeling) Islands – Years 9-11 Project Report
- 26 -
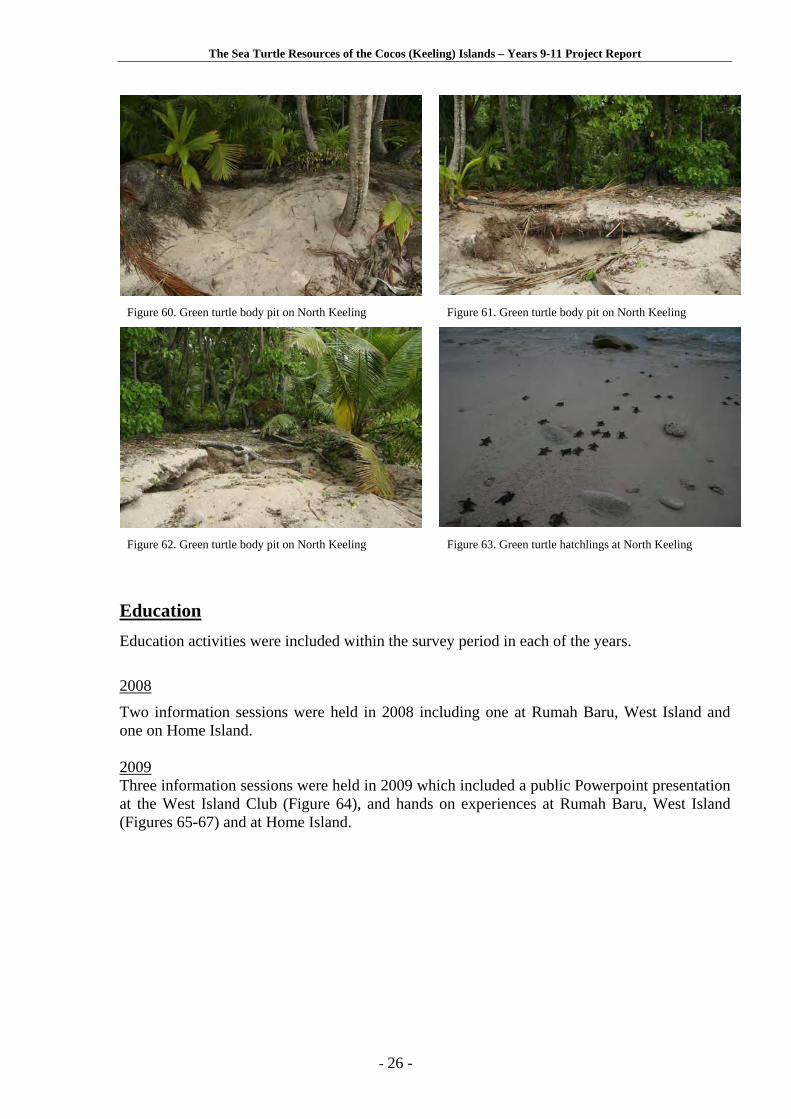
Figure 60. Green turtle body pit on North Keeling Figure 61. Green turtle body pit on North Keeling
Figure 62. Green turtle body pit on North Keeling Figure 63. Green turtle hatchlings at North Keeling
Education
Education activities were included within the survey period in each of the years.
2008
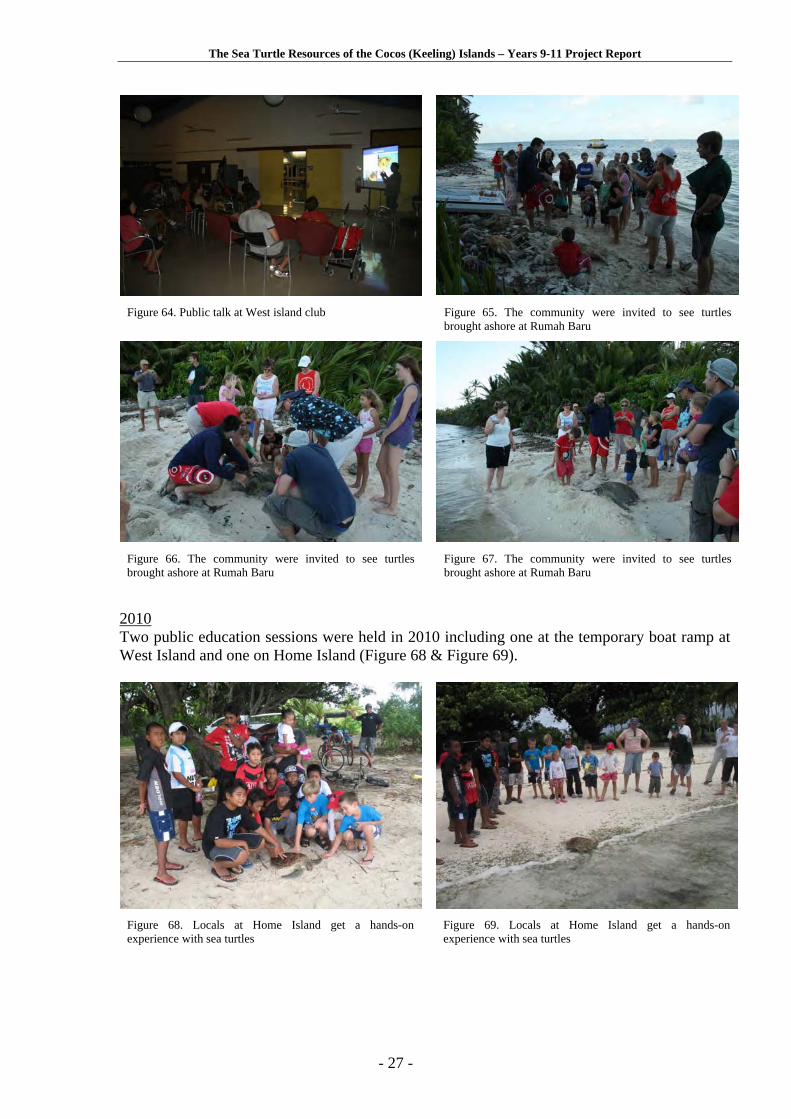
Two information sessions were held in 2008 including one at Rumah Baru, West Island and one on Home Island. 2009 Three information sessions were held in 2009 which included a public Powerpoint presentation at the West Island Club (Figure 64), and hands on experiences at Rumah Baru, West Island (Figures 65-67) and at Home Island.
The Sea Turtle Resources of the Cocos (Keeling) Islands – Years 9-11 Project Report
- 27 -
Figure 64. Public talk at West island club Figure 65. The community were invited to see turtles brought ashore at Rumah Baru
Figure 66. The community were invited to see turtles brought ashore at Rumah Baru
Figure 67. The community were invited to see turtles brought ashore at Rumah Baru
2010 Two public education sessions were held in 2010 including one at the temporary boat ramp at West Island and one on Home Island (Figure 68 & Figure 69).
Figure 68. Locals at Home Island get a hands-on experience with sea turtles
Figure 69. Locals at Home Island get a hands-on experience with sea turtles
The Sea Turtle Resources of the Cocos (Keeling) Islands – Years 9-11 Project Report
- 28 -
DISCUSSION Foraging Turtles
The resident foraging turtles at Cocos (Keeling) Islands represent both nationally and internationally significant populations. Growth rates of both green and hawksbill turtles are in the upper ranges for both species indicating that the quality and quantity of foraging resources are adequate to support the high numbers of turtles on the atoll. The sex ratio of green turtles is 1 male : 1.14 females which is a higher proportion of males than in other studies. The sex ratio of hawksbill turtles was skewed towards female turtles with 1 male : 8.5 females. The sample size of turtles examined by laparoscopy will need to be increased to examine whether these differences are real. Nesting Turtles
A high priority for nesting turtles will include the collection of more skin samples for genetic analysis. At this stage the Cocos (Keeling) Island nesting green turtles appear to be a unique genetic stock.
Conservation Issues
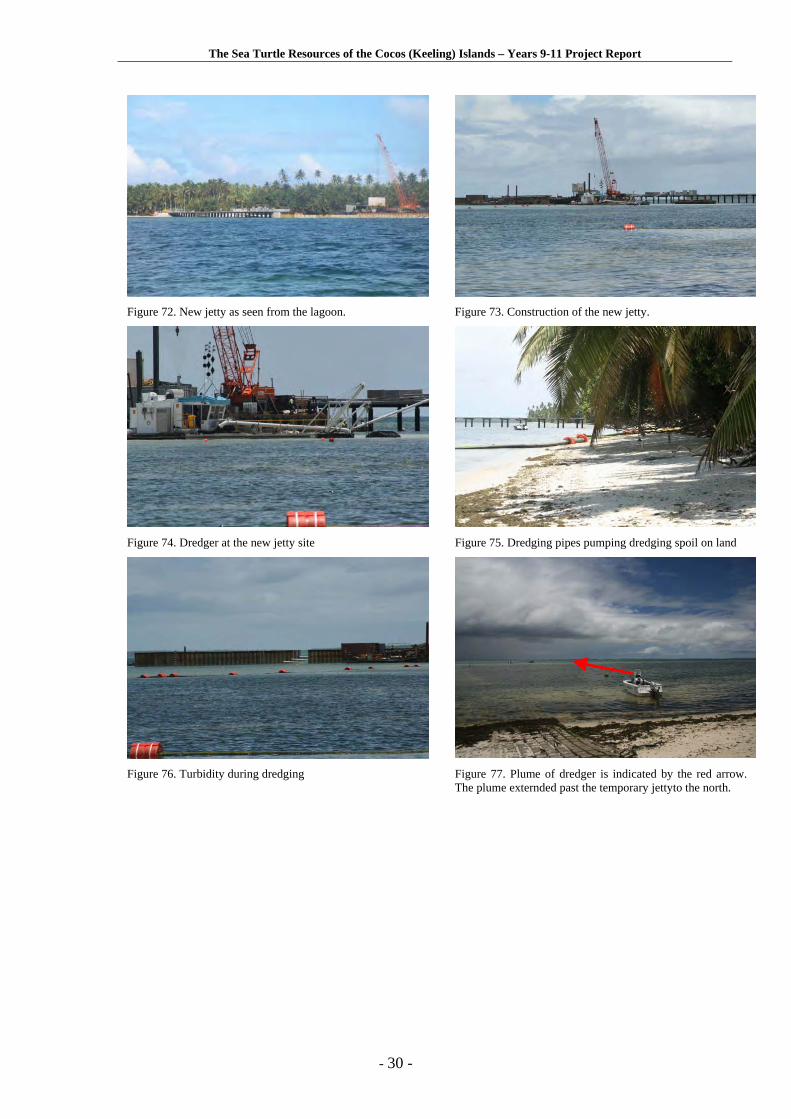
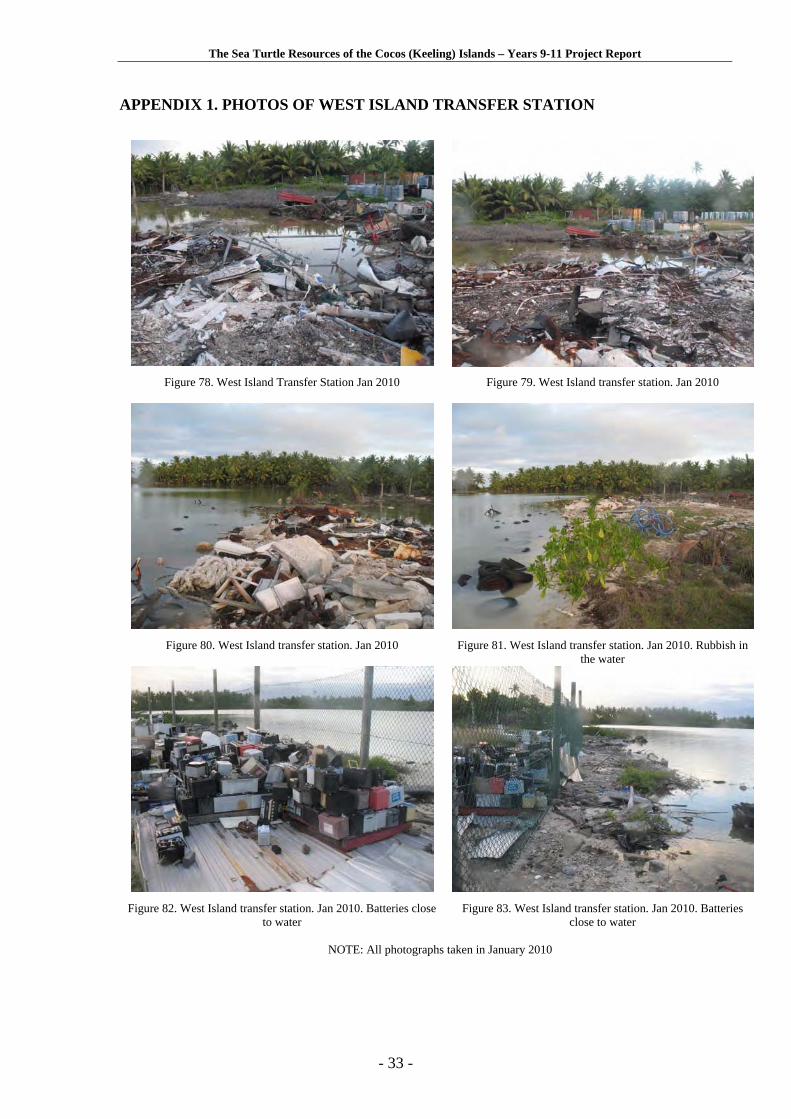
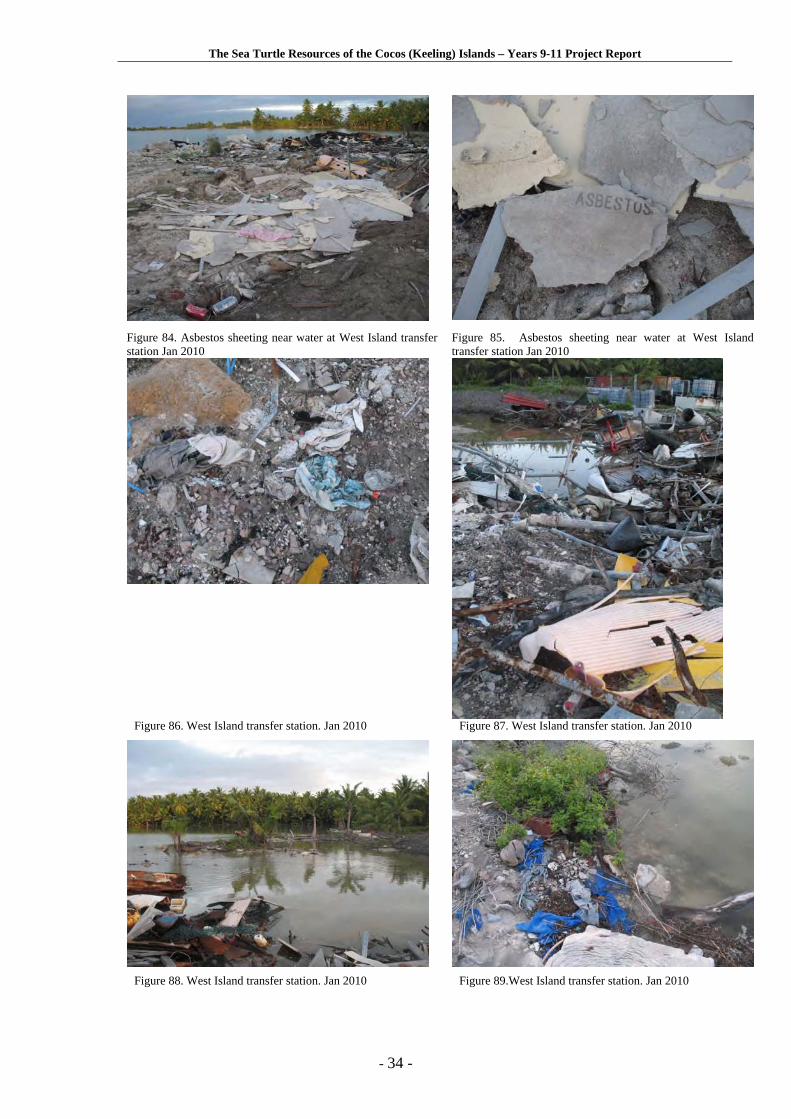
The construction of the new West Island Jetty at Rumah Baru began in 2009 (Figures 70-77). The full implications of this jetty have not been assessed in relation to sea turtles as approval was gained before the EPBC Act 1999. This jetty is has the potential to impact on sea turtles by decreasing the area of seagrass and algal communities, disturbing normal turtle behaviour, eroding shorelines and being a point source for pollution. The levels of impact will be determined by what mitigation strategies will be employed. The West Island Transfer station is still at a sub-optimal standard in respect to retaining rubbish and debris with the confines of the site boundary. Batteries and asbestos products are still stored in locations which interact with the tide (Appendix 1 - Figure 78 - Figure 89). A summary of conservation issues on Cocos (Keeling) Islands is presented in Table 13.
The Sea Turtle Resources of the Cocos (Keeling) Islands – Years 9-11 Project Report
- 29 -
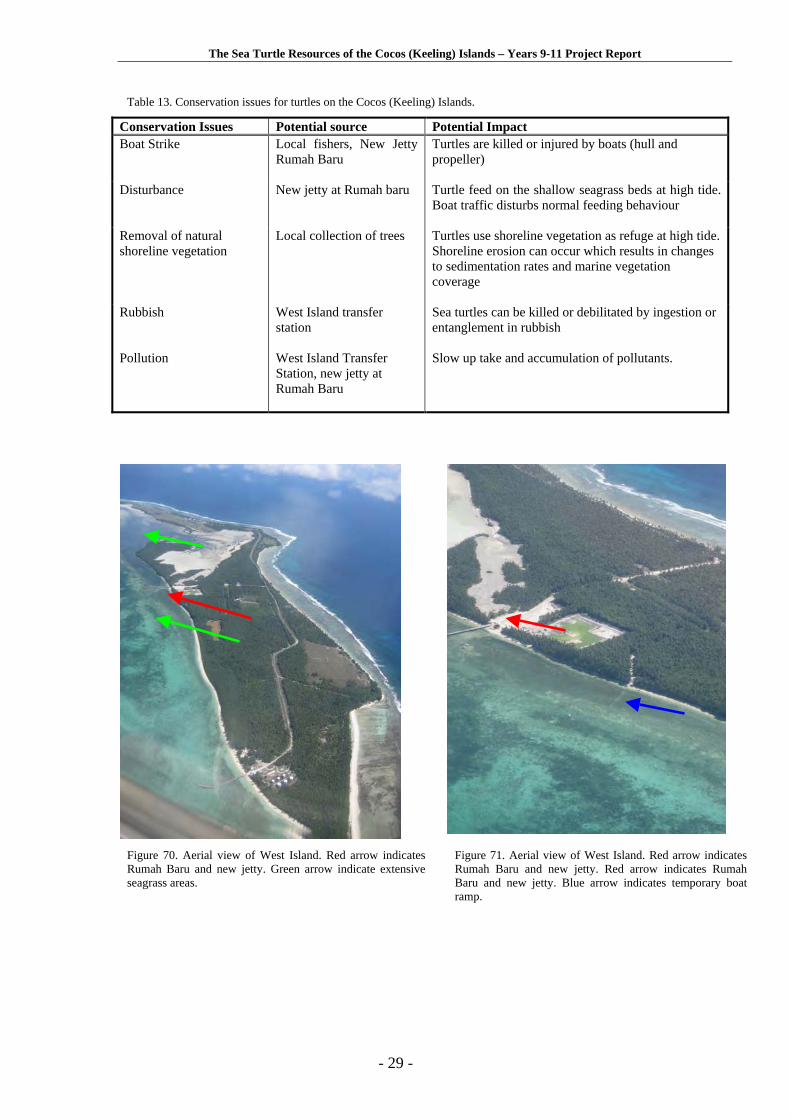
Table 13. Conservation issues for turtles on the Cocos (Keeling) Islands.
Conservation Issues Potential source Potential Impact Boat Strike Local fishers, New Jetty
Rumah Baru Turtles are killed or injured by boats (hull and propeller)
Disturbance New jetty at Rumah baru Turtle feed on the shallow seagrass beds at high tide. Boat traffic disturbs normal feeding behaviour
Removal of natural shoreline vegetation
Local collection of trees Turtles use shoreline vegetation as refuge at high tide. Shoreline erosion can occur which results in changes to sedimentation rates and marine vegetation coverage
Rubbish West Island transfer station
Sea turtles can be killed or debilitated by ingestion or entanglement in rubbish
Pollution West Island Transfer Station, new jetty at Rumah Baru
Slow up take and accumulation of pollutants.
Figure 70. Aerial view of West Island. Red arrow indicates Rumah Baru and new jetty. Green arrow indicate extensive seagrass areas.
Figure 71. Aerial view of West Island. Red arrow indicates Rumah Baru and new jetty. Red arrow indicates Rumah Baru and new jetty. Blue arrow indicates temporary boat ramp.
The Sea Turtle Resources of the Cocos (Keeling) Islands – Years 9-11 Project Report
- 30 -
Figure 72. New jetty as seen from the lagoon. Figure 73. Construction of the new jetty.
Figure 74. Dredger at the new jetty site Figure 75. Dredging pipes pumping dredging spoil on land
Figure 76. Turbidity during dredging Figure 77. Plume of dredger is indicated by the red arrow. The plume externded past the temporary jettyto the north.
The Sea Turtle Resources of the Cocos (Keeling) Islands – Years 9-11 Project Report
- 31 -
REFERENCES AND FURTHER READING Australian Government (2006). Draft Recovery Plan for Marine Turtles in Australia.
Department of Environment and Heritage, Canberra. p7.
Caughley, G. (1977). Analysis of Vertebrate Populations. John Wiley & Sons, New York.
Chaloupka, M. (2002). "Stochastic simulation modelling of southern Great Barrier Reef green turtle population dynamics." Ecological Modelling 148: 79-109.
Commonwealth of Australia (2003). Recovery Plan for Marine Turtles in Australia. Environment Australia, Canberra. P49.
IUCN (2010). IUCN Red List of Threatened Species. Version 2010.1. <http://www.iucnredlist.org>. Downloaded on 11 March 2010.
Krebs, C. and Brzustowski, J. (1998). Krebs/Win 0.94 – Software. University of California.
Limpus, C. J. (1978). The Reef: Uncertain Land of Plenty. In: Exploration North: A Natural history of Queensland. (Ed: Lavery, H.J.) Richmond Hill Press Pty Ltd, South Yarra, Victoria, 187-222.
Limpus, C. J. (1992). Estimation of tag loss in marine turtle research. Wildlife Research. 19(4), 457-469.
Limpus, C. J. and Reed, P. C. (1985). The green turtle, Chelonia mydas, in Queensland: A preliminary description of the population structure in a coral reef feeding ground. In: Biology of Australasian Frogs and Reptiles. (Eds. Grigg, G., Shine, R., Ehmann, H.) Royal Zoological Society of New South Wales, Sydney, 47-52.
Limpus, C. J., Couper, P. J. and Read, M. A. (1994a). The green turtle, Chelonia mydas, in Queensland: population structure in a warm temperate feeding area. Memoirs of the Queensland Museum 35(1): 139-154.
Limpus, C. J., Couper, P. J. and Read, M. A. (1994b). The loggerhead turtle, Caretta caretta, in Queensland: population structure in a warm temperate feeding area. Memoirs of the Queensland Museum 37(1): 195-204.
Limpus, C. J. and D. J. Limpus. (2003). The biology of the loggerhead turtle, Caretta caretta, in southwest Pacific Ocean foraging areas. In: Witherington, B. and A. Bolten. Biology and Conservation of Loggerhead Sea Turtles. Washington, DC Smithsonian Institute Press. pp. 93–113.
Limpus, C. J., Limpus, D. J., Arthur, K. E., and Parmenter, C. J. (2005). Monitoring green turtle population dynamics in Shoalwater Bay: 2000-2004. Townsville, Great Barrier Reef Marine Park Authority. 83: 50.
Miller, J. D. and C. J. Limpus (2003). The ontogeny of marine turtle gonads. The Biology of Sea Turtles. P. L. Lutz, J. A. Musick and J. Wyneken. Boca Raton, CRC Press, Inc. CRC Marine Biology Series, Volume II: 199-224.
Whiting, S. D. (2000). The foraging ecology of juvenile green (Chelonia mydas) and hawksbill (Eretmochelys imbricata) sea turtles in north-western Australia Ph.D. Thesis. Northern Territory University, Darwin.
Whiting, S. D. (2004). The Sea Turtle Resources of the Cocos (Keeling) Islands, Indian Ocean - 5 year Project Report 2004. Biomarine International, Darwin. 69p.
The Sea Turtle Resources of the Cocos (Keeling) Islands – Years 9-11 Project Report
- 32 -
Whiting, S. D. (2006a). Satellite tracking of nesting green turtles on Cocos (Keeling) Islands. Report to Parks Australia North, DEH. Biomarine International, Darwin. 30p.
Whiting, S. D. (2006b). The sea turtle resources of the Cocos (Keeling) Islands, Indian Ocean: Year 8, Dec 2006. Biomarine International, Darwin. 27p.
Whiting, S. D., Murray, W., Macrae, I., Thorn, R., and Koch, A. U. (2008). Non-migratory breeding by isolated green sea turtles (Chelonia mydas) in the Indian Ocean: biological and conservation implications. Naturwissenschaften. 95(4), 355-360.
The Sea Turtle Resources of the Cocos (Keeling) Islands – Years 9-11 Project Report
- 33 -
APPENDIX 1. PHOTOS OF WEST ISLAND TRANSFER STATION
Figure 78. West Island Transfer Station Jan 2010 Figure 79. West Island transfer station. Jan 2010
Figure 80. West Island transfer station. Jan 2010
Figure 81. West Island transfer station. Jan 2010. Rubbish in
the water
Figure 82. West Island transfer station. Jan 2010. Batteries close
to water Figure 83. West Island transfer station. Jan 2010. Batteries
close to water
NOTE: All photographs taken in January 2010
The Sea Turtle Resources of the Cocos (Keeling) Islands – Years 9-11 Project Report
- 34 -
Figure 84. Asbestos sheeting near water at West Island transfer station Jan 2010
Figure 85. Asbestos sheeting near water at West Island transfer station Jan 2010
Figure 86. West Island transfer station. Jan 2010 Figure 87. West Island transfer station. Jan 2010
Figure 88. West Island transfer station. Jan 2010 Figure 89.West Island transfer station. Jan 2010