Embed Size (px)
Citation preview

[email protected] www.sdrplay.com V1.6 –May - 2016
The SDR-play RSP1 is a powerful wideband full-featured SDR which covers all frequencies from 10 kHz up to 2 GHz. All it needs is a PC and an antenna to provide excellent communications receiver functionality. Combined with the power of readily available SDR receiver software (including our own ‘SDRuno’) you can enjoy all modes of operation while monitoring up to 10 MHz of spectrum at a time. An open API allows developers to create new demodulators or applications around the platform.
RF Tuning Range
The RF tuning range of the SDRplay module is detailed below.
Continuous Coverage from 10KHz – 2GHz
Intermediate Frequencies
The SDR play module supports the modes of operation
Zero IF for all IF bandwidths
Low IF for bandwidths ≤ 1.536MHz
IF Bandwidths
The following IF filter bandwidths are supported
200 kHz
300 kHz
600 kHz
1.536 MHz
5.000 MHz
6.000 MHz
7.000 MHz
8.000 MHz
ADC Characteristics
12 bit native ADC
Sample Frequency 2MSPS – 10.66MSPS
10.4 ENOB
60dB SNR
67dB SFDR
Front End Filtering
The front end is protected by a series of passive RF filters. These filters are automatically selected based on the RF frequency programmed. The filter ranges are shown below
12 MHz Low Pass Filter
12 – 30 MHz Band Pass Filter
30 – 60 MHz Band Pass Filter
60 – 120MHz Band Pass Filter
120 – 250 MHz Band Pass Filter
250 – 420 MHz Band Pass Filter
420 – 1000 MHz Band Pass Filter
1000MHz High Pass Filter
Connectivity
Single SMA RF connector
High Speed USB 2.0 socket (type B)

[email protected] www.sdrplay.com V1.6 –May - 2016
145MHz Test Results
0
5
10
15
20
25
30
35
40
-130-125-120-115
SIN
AD
(dB
)
Input level (dBm)
SINAD Vs Input Level @ 145MHz
3.5kHz Frequency Deviation
12.5kHz Frequency Deviation
20
22
24
26
28
30
32
34
36
38
40
2 4 6 8 10 12 14
SIN
AD
(dB
)
Frequency Deviation (kHz)
SINAD Vs Frequency Deviation @ -115dBm, 145MHz
Narrow Band FM Characteristics
The plots below show the narrow band FM characteristics of the SDRplay module. The plots show the SINAD performance for different narrow band FM frequency deviations. In addition the SINAD Vs Input level is also shown. These measurements are taken at range of different test frequencies, in each case a 1kHz audio tone was used to conduct the measurements

[email protected] www.sdrplay.com V1.6 –May - 2016
220MHz Test Results
0
5
10
15
20
25
30
35
40
-130-125-120-115
SIN
AD
(dB
)
Input level (dBm)
SINAD Vs Input Level @ 220MHz
3.5kHz Frequency Deviation
12.5kHz Frequency Deviation
20
22
24
26
28
30
32
34
36
38
40
2 4 6 8 10 12 14
SIN
AD
(dB
)
Frequency Deviation (kHz)
SINAD Vs Frequency Deviation @ -115dBm , 220MHz
Narrow Band FM Characteristics

[email protected] www.sdrplay.com V1.6 –May - 2016
300MHz Test Results
0
5
10
15
20
25
30
35
-130-125-120-115
SIN
AD
(dB
)
Input level (dBm)
SINAD Vs Input Level @ 300MHz
3.5kHz Frequency Deviation
12.5kHz Frequency Deviation
20
22
24
26
28
30
32
34
36
38
40
2 4 6 8 10 12 14
SIN
AD
(dB
)
Frequency Deviation (kHz)
SINAD Vs Frequency Deviation @ -115dBm , 300MHz
Narrow Band FM Characteristics

[email protected] www.sdrplay.com V1.6 –May - 2016
800MHz Test Results
0
5
10
15
20
25
30
35
-130-125-120-115
SIN
AD
(dB
)
Input level (dBm)
SINAD Vs Input Level @ 800MHz
3.5kHz Frequency Deviation
12.5kHz Frequency Deviation
20
22
24
26
28
30
32
34
36
38
40
2 4 6 8 10 12 14
SIN
AD
(dB
)
Frequency Deviation (kHz)
SINAD Vs Frequency Deviation @ -115dBm , 800MHz
Narrow Band FM Characteristics

[email protected] www.sdrplay.com V1.6 –May - 2016
HF Band AM / FM Sensitivity Characteristics
The plots below show the AM and NBFM sensitivity characteristics of the SDRplay module across the HF bands. The plots show the input voltage requirement to achieve 12 dB SINAD. The AM signal has a 1 KHz modulating tone with 30% AM and the FM signal has a 1 KHz audio tone with 3.5 KHz deviation
1.18
1.2
1.22
1.24
1.26
1.28
1.3
1.32
1.34
0 10 20 30 40 50 60
RM
S In
pu
t V
olt
age
(u
V)
Frequency (MHz)
AM Sensitivity Vs FrequencyVrms for 12 dB SINAD, 1KHz Audio, 30% AM
AM Sensitivity (uV for 12 dB SINAD)
0.25
0.27
0.29
0.31
0.33
0.35
0.37
0.39
0.41
0.43
0.45
0 10 20 30 40 50 60
RM
S In
pu
t V
olt
age
(u
V)
Frequency (MHz)
NBFM Sensitivity Vs FrequencyVrms for 12 dB SINAD, 1KHz Audio, 3.5kHz Deviation
FM Sensitivity (uV for 12dB SINAD)

[email protected] www.sdrplay.com V1.6 –May - 2016
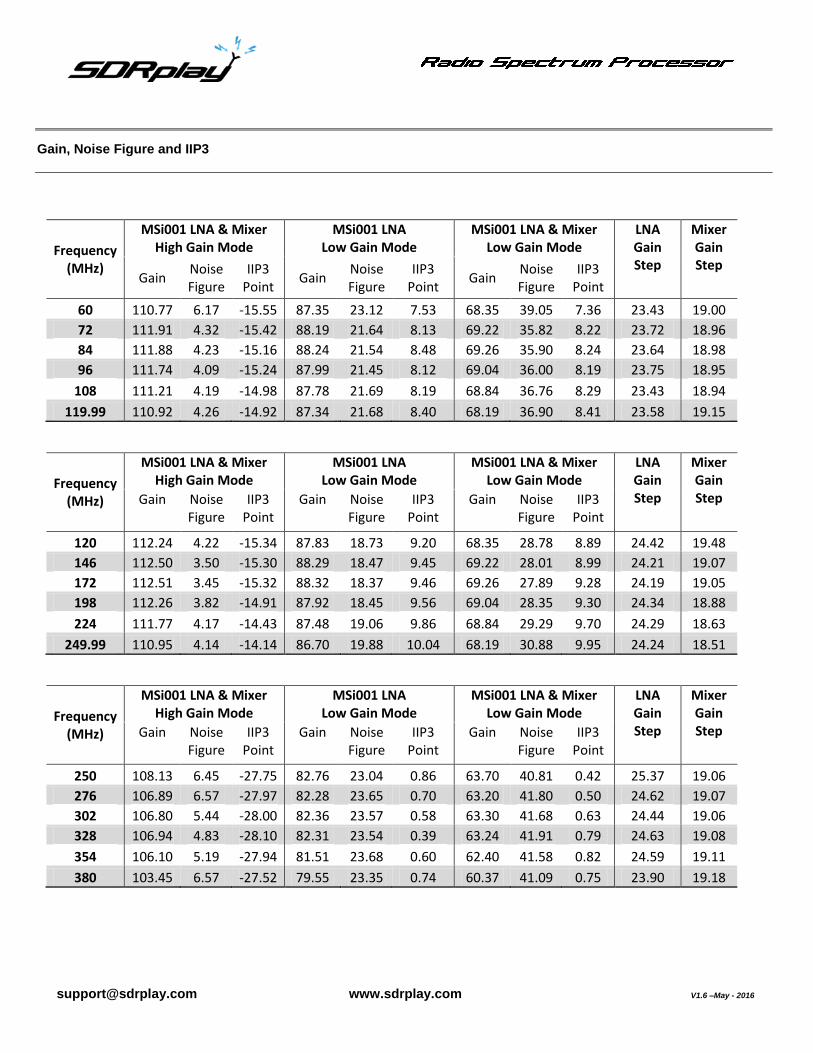
Gain, Noise Figure and IIP3
The tables below show the gain, noise figure and IIP3 data for the SDRplay module. The data is given for each of the main front end gain states. The noise figure and gain data can be used to help calculate whether there is sufficient SNR in the receiver when the tuner LNA is enabled within the AGC routine. Further information on programming the AGC can be found in the AGC reference note. The data has been split down to show the performance for each of the front end filter configurations.
Frequency (MHz)
MSi001 LNA & Mixer High Gain Mode
MSi001 LNA Low Gain Mode
MSi001 LNA & Mixer Low Gain Mode
LNA Gain Step
Mixer Gain Step Gain Noise
Figure IIP3
Point Gain Noise
Figure IIP3
Point Gain Noise
Figure IIP3
Point
1 99.85 13.25 -8.38 76.80 32.54 17.91 57.48 57.46 18.43 23.05 19.32
2 99.87 12.85 -7.72 76.86 32.27 18.11 57.42 57.26 18.68 23.02 19.44
4 99.86 12.71 -6.41 76.77 31.92 18.54 57.38 56.82 19.00 23.09 19.39
8 99.89 12.55 -5.25 76.57 31.56 18.75 57.21 55.20 19.44 23.32 19.36
11.99 99.79 12.51 -6.50 76.47 32.80 17.86 57.06 58.07 18.80 23.32 19.41
Frequency (MHz)
MSi001 LNA & Mixer High Gain Mode
MSi001 LNA Low Gain Mode
MSi001 LNA & Mixer Low Gain Mode
LNA Gain Step
Mixer Gain Step Gain Noise
Figure IIP3
Point Gain Noise
Figure IIP3
Point Gain Noise
Figure IIP3
Point
12 100.12 12.40 -8.02 76.41 30.47 17.92 56.91 55.06 18.75 23.71 19.50
17 99.92 10.92 -7.56 76.48 30.09 18.40 57.06 53.24 18.81 23.45 19.42
21 99.78 10.64 -7.06 76.30 29.86 18.39 56.86 52.67 18.67 23.48 19.44
25 99.66 10.60 -7.22 76.16 29.72 18.40 56.68 52.79 18.92 23.50 19.48
29.99 99.54 12.28 -7.64 75.94 30.18 19.00 56.15 54.30 19.60 23.60 19.79
Frequency (MHz)
MSi001 LNA & Mixer High Gain Mode
MSi001 LNA Low Gain Mode
MSi001 LNA & Mixer Low Gain Mode
LNA Gain Step
Mixer Gain Step Gain Noise
Figure IIP3
Point Gain Noise
Figure IIP3
Point Gain Noise
Figure IIP3
Point
30 99.07 11.33 -7.47 75.22 29.20 19.26 55.64 52.05 19.61 23.84 19.59
36 99.13 12.41 -7.60 75.20 29.16 18.97 55.59 52.06 19.31 23.93 19.61
42 98.95 11.30 -7.63 75.00 29.11 19.06 55.38 52.21 19.15 23.95 19.62
48 98.74 11.40 -7.63 74.77 29.07 19.17 55.06 51.87 19.48 23.97 19.70
54 98.45 12.19 -7.20 74.54 29.17 19.83 54.83 52.04 20.02 23.91 19.70
59.99 98.20 12.45 -6.09 74.68 29.19 21.29 54.80 51.95 21.24 23.52 19.88
[email protected] www.sdrplay.com V1.6 –May - 2016
Gain, Noise Figure and IIP3
Frequency (MHz)
MSi001 LNA & Mixer High Gain Mode
MSi001 LNA Low Gain Mode
MSi001 LNA & Mixer Low Gain Mode
LNA Gain Step
Mixer Gain Step
Gain Noise Figure
IIP3 Point
Gain Noise Figure
IIP3 Point
Gain Noise Figure
IIP3 Point
60 110.77 6.17 -15.55 87.35 23.12 7.53 68.35 39.05 7.36 23.43 19.00
72 111.91 4.32 -15.42 88.19 21.64 8.13 69.22 35.82 8.22 23.72 18.96
84 111.88 4.23 -15.16 88.24 21.54 8.48 69.26 35.90 8.24 23.64 18.98
96 111.74 4.09 -15.24 87.99 21.45 8.12 69.04 36.00 8.19 23.75 18.95
108 111.21 4.19 -14.98 87.78 21.69 8.19 68.84 36.76 8.29 23.43 18.94
119.99 110.92 4.26 -14.92 87.34 21.68 8.40 68.19 36.90 8.41 23.58 19.15
Frequency (MHz)
MSi001 LNA & Mixer High Gain Mode
MSi001 LNA Low Gain Mode
MSi001 LNA & Mixer Low Gain Mode
LNA Gain Step
Mixer Gain Step Gain Noise
Figure IIP3
Point Gain Noise
Figure IIP3
Point Gain Noise
Figure IIP3
Point
120 112.24 4.22 -15.34 87.83 18.73 9.20 68.35 28.78 8.89 24.42 19.48
146 112.50 3.50 -15.30 88.29 18.47 9.45 69.22 28.01 8.99 24.21 19.07
172 112.51 3.45 -15.32 88.32 18.37 9.46 69.26 27.89 9.28 24.19 19.05
198 112.26 3.82 -14.91 87.92 18.45 9.56 69.04 28.35 9.30 24.34 18.88
224 111.77 4.17 -14.43 87.48 19.06 9.86 68.84 29.29 9.70 24.29 18.63
249.99 110.95 4.14 -14.14 86.70 19.88 10.04 68.19 30.88 9.95 24.24 18.51
Frequency (MHz)
MSi001 LNA & Mixer High Gain Mode
MSi001 LNA Low Gain Mode
MSi001 LNA & Mixer Low Gain Mode
LNA Gain Step
Mixer Gain Step Gain Noise
Figure IIP3
Point Gain Noise
Figure IIP3
Point Gain Noise
Figure IIP3
Point
250 108.13 6.45 -27.75 82.76 23.04 0.86 63.70 40.81 0.42 25.37 19.06
276 106.89 6.57 -27.97 82.28 23.65 0.70 63.20 41.80 0.50 24.62 19.07
302 106.80 5.44 -28.00 82.36 23.57 0.58 63.30 41.68 0.63 24.44 19.06
328 106.94 4.83 -28.10 82.31 23.54 0.39 63.24 41.91 0.79 24.63 19.08
354 106.10 5.19 -27.94 81.51 23.68 0.60 62.40 41.58 0.82 24.59 19.11
380 103.45 6.57 -27.52 79.55 23.35 0.74 60.37 41.09 0.75 23.90 19.18

[email protected] www.sdrplay.com V1.6 –May - 2016
Gain, Noise Figure and IIP3
Frequency (MHz)
MSi001 LNA & Mixer High Gain Mode
MSi001 LNA Low Gain Mode
MSi001 LNA & Mixer Low Gain Mode
LNA Gain Step
Mixer Gain Step Gain Noise
Figure IIP3
Point Gain Noise
Figure IIP3
Point Gain Noise
Figure IIP3
Point
420 104.49 3.57 -17.96 95.21 5.52 -9.24 75.86 14.72 -9.04 9.28 19.35
480 104.50 3.54 -17.93 94.93 5.51 -9.16 75.59 14.80 -8.93 9.56 19.34
540 104.36 3.40 -17.94 94.95 5.36 -9.08 75.63 14.53 -9.17 9.41 19.32
600 104.67 3.35 -17.85 95.25 5.25 -9.16 75.99 14.22 -9.17 9.42 19.26
660 104.75 3.46 -17.98 95.09 5.37 -9.01 75.78 14.35 -8.95 9.67 19.30
720 104.13 3.59 -17.74 94.27 5.79 -8.71 74.91 15.22 -8.76 9.86 19.36
780 103.06 3.99 -17.63 93.15 6.62 -8.51 73.73 16.46 -8.40 9.91 19.42
840 101.82 4.25 -17.38 92.00 7.25 -8.51 72.52 17.30 -8.33 9.82 19.48
900 101.18 4.84 -17.49 91.38 7.35 -8.64 71.85 17.52 -8.63 9.79 19.53
960 101.44 4.75 -17.77 91.56 7.48 -9.00 72.06 17.34 -8.97 9.88 19.50
999.99 101.49 4.41 -17.92 91.71 7.15 -9.13 72.23 17.04 -9.29 9.78 19.48
Frequency (MHz)
MSi001 LNA & Mixer High Gain Mode
MSi001 LNA Low Gain Mode
MSi001 LNA & Mixer Low Gain Mode
LNA Gain Step
Mixer Gain Step Gain Noise
Figure IIP3
Point Gain Noise
Figure IIP3
Point Gain Noise
Figure IIP3
Point
1000 103.76 5.81 -14.25 101.94 7.28 -11.43 82.60 17.93 -11.45 1.82 19.34
1100 105.14 5.19 -14.86 102.87 6.81 -12.07 83.52 15.90 -11.94 2.27 19.35
1200 108.24 3.97 -15.62 105.04 6.08 -13.33 85.66 15.36 -13.00 3.20 19.39
1300 112.21 3.34 -16.93 107.78 4.92 -14.40 88.38 15.01 -14.51 4.43 19.40
1400 113.37 3.43 -16.89 108.62 4.89 -13.91 89.26 14.97 -13.83 4.75 19.36
1500 112.10 3.94 -15.02 107.06 5.65 -12.04 87.65 15.68 -11.84 5.04 19.41
1600 110.29 4.42 -13.75 105.14 6.41 -11.46 85.61 17.10 -11.11 5.16 19.52
1700 109.06 4.23 -13.33 103.94 6.28 -11.00 84.39 17.14 -11.02 5.12 19.55
1800 108.58 4.21 -13.21 103.34 6.13 -10.93 83.81 17.10 -10.84 5.24 19.53
1900 107.62 4.70 -13.19 103.44 6.99 -10.77 83.97 17.05 -10.65 4.18 19.47
2000 104.98 6.38 -13.04 102.16 7.88 -10.75 82.75 18.19 -10.70 2.83 19.41

[email protected] www.sdrplay.com V1.6 –May - 2016
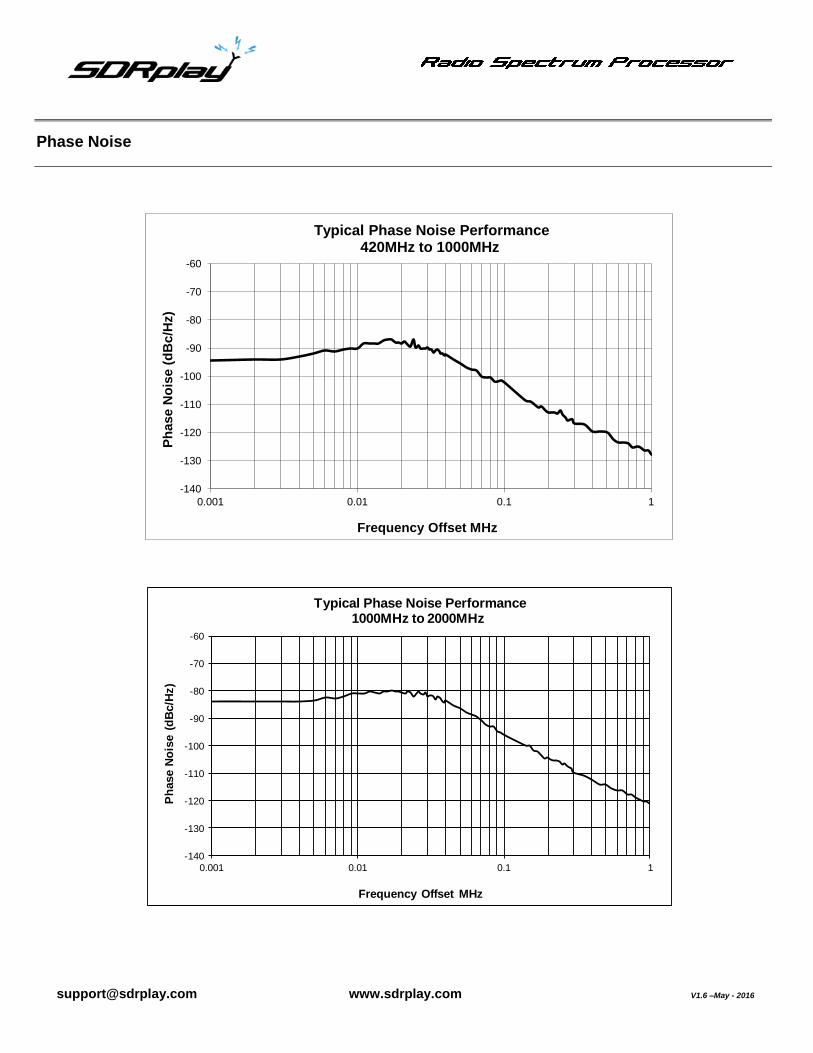
Phase Noise
The tables below show typical phase noise plots for the SDRplay module. An example of the phase noise performance for different frequency coverage areas has been considered.
-140
-130
-120
-110
-100
-90
-80
-70
-60
0.001 0.01 0.1 1
Ph
ase N
ois
e (
dB
c/H
z)
Frequency Offset MHz
Typical Phase Noise Performance100kHz to 60MHz
-140
-130
-120
-110
-100
-90
-80
-70
-60
0.001 0.01 0.1 1
Ph
ase N
ois
e (
dB
c/H
z)
Frequency Offset MHz
Typical Phase Noise Performance60MHz to 120MHz

[email protected] www.sdrplay.com V1.6 –May - 2016
Phase Noise
-140
-130
-120
-110
-100
-90
-80
-70
-60
0.001 0.01 0.1 1
Ph
ase N
ois
e (
dB
c/H
z)
Frequency Offset MHz
Typical Phase Noise Performance120MHz to 250MHz
-140
-130
-120
-110
-100
-90
-80
-70
-60
0.001 0.01 0.1 1
Ph
ase N
ois
e (
dB
c/H
z)
Frequency Offset MHz
Typical Phase Noise Performance 250MHz to 420MHz
[email protected] www.sdrplay.com V1.6 –May - 2016
Phase Noise
-140
-130
-120
-110
-100
-90
-80
-70
-60
0.001 0.01 0.1 1
Ph
ase N
ois
e (
dB
c/H
z)
Frequency Offset MHz
Typical Phase Noise Performance 420MHz to 1000MHz
-140
-130
-120
-110
-100
-90
-80
-70
-60
0.001 0.01 0.1 1
Ph
ase N
ois
e (
dB
c/H
z)
Frequency Offset MHz
Typical Phase Noise Performance1000MHz to 2000MHz
[email protected] www.sdrplay.com V1.6 –May - 2016
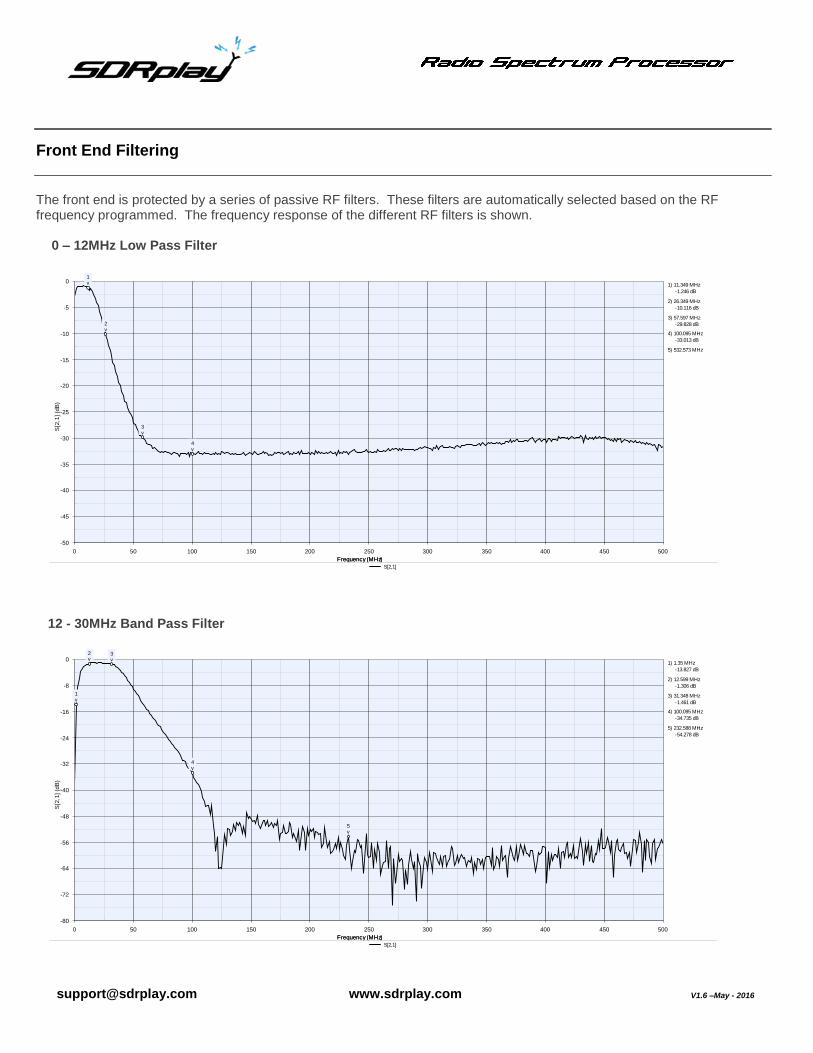
Front End Filtering
The front end is protected by a series of passive RF filters. These filters are automatically selected based on the RF frequency programmed. The frequency response of the different RF filters is shown.
0 – 12MHz Low Pass Filter
12 - 30MHz Band Pass Filter
Frequency (MHz)
S[2
,1] (d
B)
-50
-45
-40
-35
-30
-25
-20
-15
-10
-5
0
Frequency (MHz)
0 50 100 150 200 250 300 350 400 450 500
S[2,1]
1v
2v
4v
3v
5) 532.573 MHz
-33.013 dB
4) 100.095 MHz
-29.828 dB
3) 57.597 MHz
-10.116 dB
2) 26.349 MHz
-1.246 dB
1) 11.349 MHz
Frequency (MHz)
S[2
,1] (d
B)
-80
-72
-64
-56
-48
-40
-32
-24
-16
-8
0
Frequency (MHz)
0 50 100 150 200 250 300 350 400 450 500
S[2,1]
5v
1v
2v
4v
3v
-54.278 dB
5) 232.588 MHz
-34.735 dB
4) 100.095 MHz
-1.461 dB
3) 31.348 MHz
-1.306 dB
2) 12.599 MHz
-13.827 dB
1) 1.35 MHz

[email protected] www.sdrplay.com V1.6 –May - 2016
Front End Filtering
30 – 60MHz Band Pass Filter
60 - 120MHz Band Pass Filter
Frequency (MHz)
S[2
,1] (d
B)
-60
-54
-48
-42
-36
-30
-24
-18
-12
-6
0
Frequency (MHz)
0 50 100 150 200 250 300 350 400 450 500
S[2,1]
5v
1v
2v
4v
3v
-38.516 dB
5) 232.588 MHz
-18.007 dB
4) 100.095 MHz
-2.205 dB
3) 60.097 MHz
-1.774 dB
2) 30.098 MHz
-11.832 dB
1) 7.6 MHz
Frequency (MHz)
S[2
,1] (d
B)
-80
-70
-60
-50
-40
-30
-20
-10
0
10
20
Frequency (MHz)
0 200 400 600 800 1000 1200 1400 1600 1800 2000
S[2,1]
4v
2v
1v
3v
-59.957 dB
4) 903.805 MHz
-24.855 dB
3) 333.833 MHz
6.041 dB
2) 120.094 MHz
4.737 dB
1) 60.097 MHz

[email protected] www.sdrplay.com V1.6 –May - 2016
Front End Filtering
120 - 250MHz Band Pass Filter
250 - 420MHz Band Pass Filter
Frequency (MHz)
S[2
,1] (d
B)
-80
-70
-60
-50
-40
-30
-20
-10
0
10
20
Frequency (MHz)
0 200 400 600 800 1000 1200 1400 1600 1800 2000
S[2,1]
5v
4v
2v
1v
3v
-46.128 dB
5) 965.052 MHz
-20.039 dB
4) 381.331 MHz
4.01 dB
3) 250.087 MHz
4.609 dB
2) 120.094 MHz
-20.104 dB
1) 60.097 MHz
Frequency (MHz)
S[2
,1] (d
B)
-80
-68
-56
-44
-32
-20
-8
4
16
28
40
Frequency (MHz)
0 200 400 600 800 1000 1200 1400 1600 1800 2000
S[2,1]
4v
2v
1v
3v
-5.085 dB
4) 903.805 MHz
17.557 dB
3) 380.081 MHz
16.334 dB
2) 250.087 MHz
-15.801 dB
1) 132.593 MHz

[email protected] www.sdrplay.com V1.6 –May - 2016
Front End Filtering
420 - 1000MHz Band Pass Filter
1000 - 2000MHz Band Pass Filter
Frequency (MHz)
S[2
,1] (d
B)
-80
-70
-60
-50
-40
-30
-20
-10
0
10
20
Frequency (MHz)
0 200 400 600 800 1000 1200 1400 1600 1800 2000
S[2,1]
4v
2v
1v
3v
5.24 dB
4) 1000.05 MHz
5.431 dB
3) 400.08 MHz
-35.048 dB
2) 120.094 MHz
-36.064 dB
1) 60.097 MHz
Frequency (MHz)
S[2
,1] (d
B)
-80
-70
-60
-50
-40
-30
-20
-10
0
10
20
Frequency (MHz)
0 200 400 600 800 1000 1200 1400 1600 1800 2000
S[2,1]
5v
4v
2v
1v
3v 8.952 dB
5) 2000 MHz
8.378 dB
4) 1000.05 MHz
-10.361 dB
3) 250.087 MHz
-16.857 dB
2) 120.094 MHz
-11.715 dB
1) 60.097 MHz


![Connecting SDRPlay to a Kenwood TS-830S SDRplay.pdf · Title: Microsoft PowerPoint - Connecting SDRPlay to a Kenwood TS-830S [Compatibility Mode] Author: Alan Created Date: 8/12/2017](https://img.pdfslide.us/doc/110x75/611b8880124ac2172e59a77f/connecting-sdrplay-to-a-kenwood-ts-sdrplaypdf-title-microsoft-powerpoint-.jpg)