Embed Size (px)
Citation preview

ECOSYSTEM WORKFORCE
WORKING PAPERS
The Scope and Future Prospects – Oregon’s Ecosystem
Management Industry EWP Working Paper Number 1, Fall 2001
James Beltram and Rick Evans, Organization for Economic Initiatives, Inc.
Michael Hibbard and James Luzzi, Ecosystem Workforce Program, University of Oregon
The Ecosystem Workforce Program
Institute for a Sustainable Environment, University of Oregon
The research and writing of this report were funded with Oregon State Lottery funds through a contract with the Oregon Economic & Community Development Department.
www.econ.state.or.us

-
The Ecosystem Workforce Program Working Papers series offers in-depth reports on applied research, analysis and findings about a variety of areas associated with the effort to build quality jobs in ecosystem management. The target audience includes policy and administrative leaders, academics, leaders in community forestry, community-based organization leaders, and local community officials.
EWP Working Paper Number One reports the findings of a joint study by the Organization for Economic Initiatives, Inc. (OEI) and the Ecosystem Workforce Program (EWP) at the University of Oregon (UO). OEI is an Oregon 501(c) 3 non-profit corporation that administers several economic development and business assistance programs throughout the State, including those related to the development of the ecosystem management industry. EWP is located at the UO Institute for a Sustainable Environment. EWP provides technical assistance, research, and facilitation for watershed councils, public land management agencies, local economic development staff, contractors and workers in promoting stable business and workforce capacity for the emerging ecosystem management industry. EWP receives funding support from the Ford Foundation, USDA Forest Service Rural Community Assistance and Old Growth Diversification funds administered by the State of Oregon Economic and Community Development Department.
Jim Beltram is a contract specialist working for the Government Contract Assistance Program where he provides counseling services and technical assistance to primarily small businesses throughout the state. He has over forty years of experience in working with federal agencies in natural resources and land management programs. Rick Evans is the Executive Director of the Organization for Economic Initiatives, which administers programs related to government contracting, sustainability and business assistance activities. Prior to this, Rick was the State Director of the Government Contract Assistance Program. Mike Hibbard is professor and head of the Department of Planning, Public Policy & Management at UO, where he teaches community development and regional planning. His consulting and scholarly work focus on natural resource based communities in the U.S. and other developed nations. Jim Luzzi is a graduate student in Community & Regional Planning at UO. Prior to returning to school he worked in the woods for more than twenty years, as a contractor.
ECOSYSTEM WORKFORCE PROGRAM BUILDING A SUSTAINABLE, HIGH-SKILL/HIGH-WAGE ECOSYSTEM MANAGEMENT INDUSTRY
Institute for a Sustainable Environment • 5247 University of Oregon, Eugene, OR 97403-5247 541-346-0676 • Fax 541-346-2040


Scope and Future Prospects for Oregon’s Ecosystem Management Industry - Executive Summary 1
Executive Summary
The Scope and Future Prospects for Oregon’s Ecosystem Management Industry
Introduction
This study grew out of ongoing questions by policy makers, state agencies, environmental groups, and economic development advocates: Is the vision of the Jobs in the Woods/Hire the Fisher program viable as a long-term approach? Was it simply a transitional stopgap to help facilitate the implementation of the Northwest Forest Plan, or is there the potential for an industry in ecosystem management that can contribute to the health of Oregon’s economy and environment?
Those questions were brought to a head when the Oregon Economic and Community
Development Department (OECDD) convened a task force to examine and make recommendations about the future of the ecosystem management industry. After lengthy discussion it became clear that there is not an agreed-upon definition of the scope of the industry. Without a clear definition little can be said about the industry’s present scale or future prospects.
In response to that conclusion OECDD commissioned this study, which addresses two basic questions:
1. What is the current scope of the ecosystem management industry in Oregon?
2. What is its likely scope in the intermediate (ten years) future?
To answer these questions we
• created a working definition of the ecosystem management industry
• conducted a preliminary analysis of the current state of the industry
• estimated its future scope using a Delphi process
• proposed recommendations for the future development of the industry

2 Scope and Future Prospects for Oregon’s Ecosystem Management Industry - Executive Summary
Industry Definition
The following definition was developed through extensive interviews and focus group discussions with people involved in or knowledgeable about the industry. For a complete list of the participants see Appendix I.
The ecosystem management industry: (1) enhances the components and functions of natural ecosystems; (2) protects, maintains, and/or restores the integrity and diversity of biological structure; (3) manages natural ecosystems for social, economic, and environmental purposes; and (4) performs studies to enable informed decisions on protection, restoration, and management
of ecosystems.
To understand the specifics of how the industry does what it does, we established the following work classifications. Some of these are objectives, such as Watershed/Habitat Enhancement and Fuels Management. Others are broad categories encompassing specific management tasks, such as Landscape and Aquatic Surveys.
• Reforestation • Stand Improvement • Landscape Survey • Aquatic Survey • Watershed / Habitat Enhancement (heavy equipment) • Watershed / Habitat Enhancement (by hand) • Timber Harvesting • Fuels Management • Wildfire Suppression • Recreation Management
In order to understand what these work classifications consist of, they were further refined into various tasks that workers and practitioners in the industry perform. These can be found in Appendix III.

Scope and Future Prospects for Oregon’s Ecosystem Management Industry - Executive Summary 3
Summary of Findings
It is impossible to create a complete picture of the ecosystem management industry at this time. The evolving nature of the industry, coupled with inadequate data systems, allows us to create only a first approximation. Within this limitation, we can tentatively say that some of the major characteristics of the industry are:
• it provides more than 16,000 jobs for Oregonians – more than 4,000 in the private sector and the balance in public agencies;
• they are working in more than 600 private firms and public agencies at all levels of
government;
• the total payroll is more than one half billion dollars per year;
• average weekly wages range between $340 and $1600, depending on the specific job (the average for all Oregon jobs is about $540);
• in SIC 0851 Forestry Services, which generated $64 to $70 million in annual wages during
1998 and 1999, 48% of the firms have four or fewer employees;
• the Forest Service and BLM together awarded contracts in ecosystem management work
totaling approximately $86 million in 1998 and 1999;
• approximately 133,000 acres of privately owned timberland was reforested and thinned in 1999 -- and if the work had entirely been contracted out, total amount of contact award would have been in the range of $12 million;
• private and public partners spent at least $106 million on restoration work in the period 1995 to 2000;
• over the ten-year period 1990 to 1999, wages in the forestry services sector have not kept up with inflation
This provides preliminary but strong evidence that the ecosystem management industry is a significant part of Oregon's economy.
4 Scope and Future Prospects for Oregon’s Ecosystem Management Industry - Executive Summary
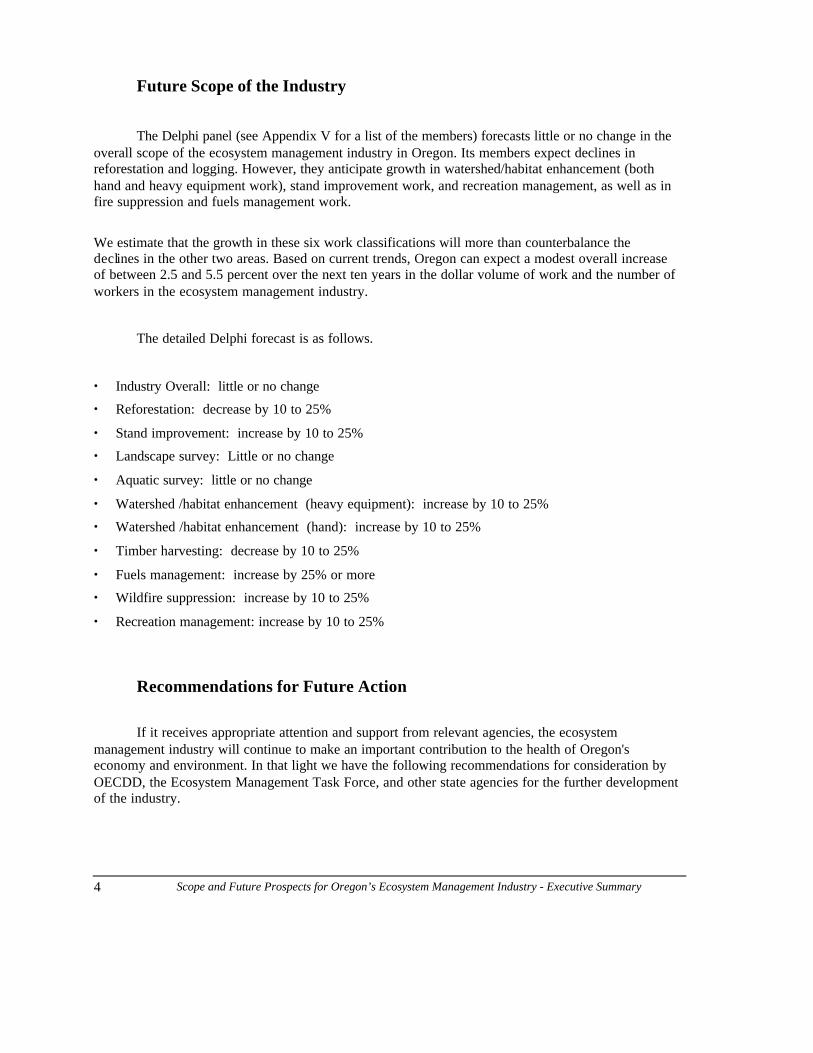
Future Scope of the Industry
The Delphi panel (see Appendix V for a list of the members) forecasts little or no change in the overall scope of the ecosystem management industry in Oregon. Its members expect declines in reforestation and logging. However, they anticipate growth in watershed/habitat enhancement (both hand and heavy equipment work), stand improvement work, and recreation management, as well as in fire suppression and fuels management work.
We estimate that the growth in these six work classifications will more than counterbalance the declines in the other two areas. Based on current trends, Oregon can expect a modest overall increase of between 2.5 and 5.5 percent over the next ten years in the dollar volume of work and the number of workers in the ecosystem management industry.
The detailed Delphi forecast is as follows.
• Industry Overall: little or no change
• Reforestation: decrease by 10 to 25%
• Stand improvement: increase by 10 to 25%
• Landscape survey: Little or no change
• Aquatic survey: little or no change
• Watershed /habitat enhancement (heavy equipment): increase by 10 to 25%
• Watershed /habitat enhancement (hand): increase by 10 to 25%
• Timber harvesting: decrease by 10 to 25%
• Fuels management: increase by 25% or more
• Wildfire suppression: increase by 10 to 25%
• Recreation management: increase by 10 to 25%
Recommendations for Future Action
If it receives appropriate attention and support from relevant agencies, the ecosystem management industry will continue to make an important contribution to the health of Oregon's economy and environment. In that light we have the following recommendations for consideration by OECDD, the Ecosystem Management Task Force, and other state agencies for the further development of the industry.

Scope and Future Prospects for Oregon’s Ecosystem Management Industry - Executive Summary 5
• Given its importance to Oregon’s overall economy and environment, workforce and contractor training are vital to ensuring that local communities have an active part in the opportunities associated with healthy ecosystem management.
• In the same light, the state should support the creation and maintenance of an industry clearinghouse to link workers, contractors, and land managers.
• State agencies should design and implement specific ecosystem restoration and management incentive programs - a grants and tax incentives program to encourage (both small and large) land owner commitment to ecosystem management.
• State contracting efforts should focus on design of projects that can be awarded to and support small firms in local communities. Barriers to bidding by small firms should be minimized - e.g. bonding thresholds/requirements and BOLI regulations.
• State and federal agencies should collaborate on a comprehensive inventory of all ecosystem management work needed on all lands – public and private – in Oregon.
• Data systems should be created and maintained that allow for basic socio-economic monitoring of the industry - e.g. payrolls, wages, firm size and location.
• A public campaign is needed to educate citizens on the importance and contributions of the ecosystem management industry.

6 Scope and Future Prospects for Oregon’s Ecosystem Management Industry - Executive Summary

Table of Contents
I. INTRODUCTION....................................................................................................................................................... 1
II. DEFINING THE ECOSYSTEM MANAGEMENT INDUSTRY................................................................................. 2
ECOSYSTEM MANAGEMENT......................................................................................................................... 2 OREGON’S SUSTAINABILITY AGENDA......................................................................................................... 2 INDUSTRY DEFINITION................................................................................................................................ 3
III. CURRENT SCOPE O F THE ECOSYSTEM MANAGEMENT INDUSTRY............................................................. 4
CHARACTERIZING INDUSTRIES .................................................................................................................... 4 EMPLOYERS, EMPLOYEES , AND INCOMES................................................................................................... 8 SIZE OF ESTABLISHMENTS IN SELECTED INDUSTRIAL SECTORS................................................................ 17 DOLLAR VALUE OF WORK PERFORMED - FEDERAL LANDS ..................................................................... 18 STATE LANDS & PRIVATE LANDS ............................................................................................................. 21 SUMMARY................................................................................................................................................. 23
IV. INDUSTRY FORECAST....................................................................................................................................... 24
V. ADDING IT ALL UP............................................................................................................................................... 26
VI. RECOMMENDATIONS FOR FUTURE ACTION................................................................................................. 26
REFERENCES.......... .......................................................................................................... ............................................................28
APPENDIX 1 INTERVIEWS..................................................................................................................................... 29
APPENDIX II FOCUS GROUP PARTICIPANTS ...................................................................................................... 30
APPENDIX III ECOSYS TEM MANAGEMENT WORK CLASSIFICATIONS & TASKS.......................................... 31
APPENDIX IV STANDARD INDUSTRIAL CLASSIFICATIONS (SIC) INCLUDED IN THE ECOSYSTEM MANAGEMENT INDUSTRY.......................................................................................................... 34
APPENDIX V DELPHI PANELISTS ........................................................................................................................... 43

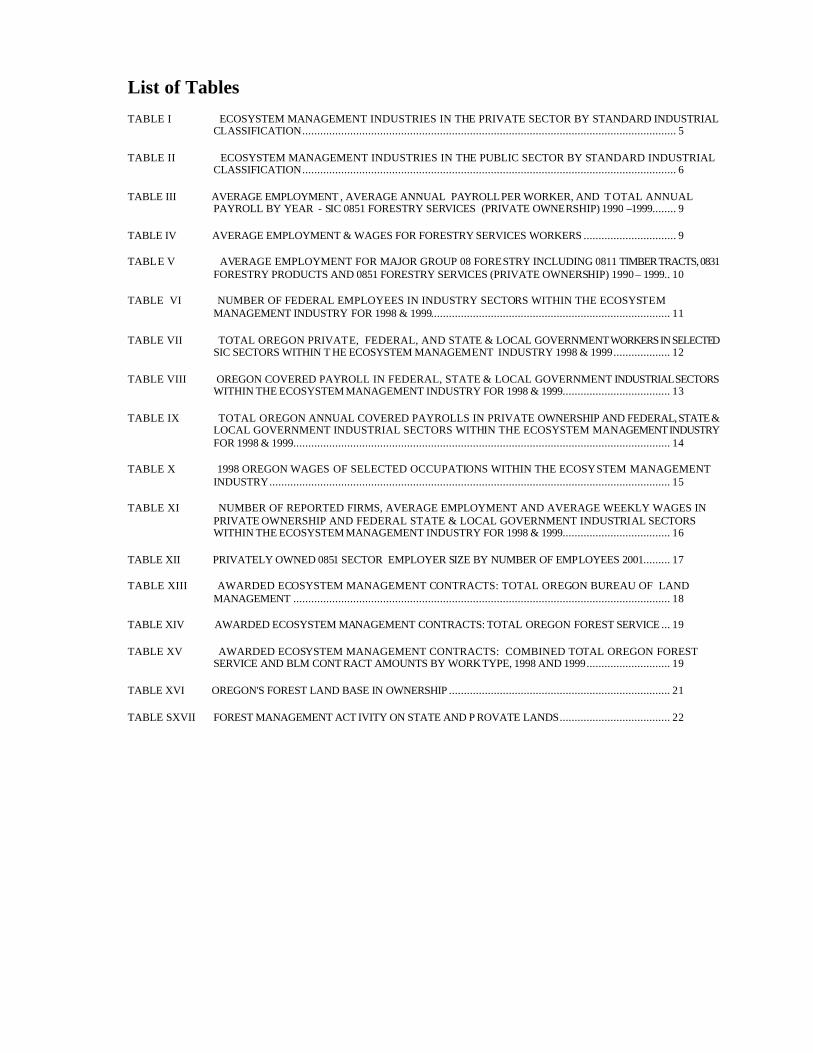
List of Tables
TABLE I ECOSYSTEM MANAGEMENT INDUSTRIES IN THE PRIVATE SECTOR BY STANDARD INDUSTRIAL CLASSIFICATION............................................................................................................................. 5
TABLE II ECOSYSTEM MANAGEMENT INDUSTRIES IN THE PUBLIC SECTOR BY STANDARD INDUSTRIAL CLASSIFICATION............................................................................................................................. 6
TABLE III AVERAGE EMPLOYMENT , AVERAGE ANNUAL PAYROLL PER WORKER, AND TOTAL ANNUAL PAYROLL BY YEAR - SIC 0851 FORESTRY SERVICES (PRIVATE OWNERSHIP) 1990 –1999........ 9
TABLE IV AVERAGE EMPLOYMENT & WAGES FOR FORESTRY SERVICES WORKERS ............................... 9
TABLE V AVERAGE EMPLOYMENT FOR MAJOR GROUP 08 FORESTRY INCLUDING 0811 TIMBER TRACTS, 0831 FORESTRY PRODUCTS AND 0851 FORESTRY SERVICES (PRIVATE OWNERSHIP) 1990 – 1999.. 10
TABLE VI NUMBER OF FEDERAL EMPLOYEES IN INDUSTRY SECTORS WITHIN THE ECOSYSTEM MANAGEMENT INDUSTRY FOR 1998 & 1999................................................................................ 11
TABLE VII TOTAL OREGON PRIVATE, FEDERAL, AND STATE & LOCAL GOVERNMENT WORKERS IN SELECTED SIC SECTORS WITHIN T HE ECOSYSTEM MANAGEMENT INDUSTRY 1998 & 1999................... 12
TABLE VIII OREGON COVERED PAYROLL IN FEDERAL, STATE & LOCAL GOVERNMENT INDUSTRIAL SECTORS WITHIN THE ECOSYSTEM MANAGEMENT INDUSTRY FOR 1998 & 1999.................................... 13
TABLE IX TOTAL OREGON ANNUAL COVERED PAYROLLS IN PRIVATE OWNERSHIP AND FEDERAL, STATE & LOCAL GOVERNMENT INDUSTRIAL SECTORS WITHIN THE ECOSYSTEM MANAGEMENT INDUSTRY FOR 1998 & 1999.............................................................................................................................. 14
TABLE X 1998 OREGON WAGES OF SELECTED OCCUPATIONS WITHIN THE ECOSYSTEM MANAGEMENT INDUSTRY...................................................................................................................................... 15
TABLE XI NUMBER OF REPORTED FIRMS, AVERAGE EMPLOYMENT AND AVERAGE WEEKLY WAGES IN PRIVATE OWNERSHIP AND FEDERAL STATE & LOCAL GOVERNMENT INDUSTRIAL SECTORS WITHIN THE ECOSYSTEM MANAGEMENT INDUSTRY FOR 1998 & 1999.................................... 16
TABLE XII PRIVATELY OWNED 0851 SECTOR EMPLOYER SIZE BY NUMBER OF EMPLOYEES 2001......... 17
TABLE XIII AWARDED ECOSYSTEM MANAGEMENT CONTRACTS: TOTAL OREGON BUREAU OF LAND MANAGEMENT .............................................................................................................................. 18
TABLE XIV AWARDED ECOSYSTEM MANAGEMENT CONTRACTS: TOTAL OREGON FOREST SERVICE ... 19
TABLE XV AWARDED ECOSYSTEM MANAGEMENT CONTRACTS: COMBINED TOTAL OREGON FOREST SERVICE AND BLM CONT RACT AMOUNTS BY WORK TYPE, 1998 AND 1999............................ 19
TABLE XVI OREGON'S FOREST LAND BASE IN OWNERSHIP .......................................................................... 21
TABLE SXVII FOREST MANAGEMENT ACT IVITY ON STATE AND P ROVATE LANDS..................................... 22

Scope and Future Prospects for Oregon’s Ecosystem Management Industry 1
The Scope and Future Prospects for
Oregon’s Ecosystem Management Industry
I. Introduction
This study grew out of ongoing questions by policy makers, state agencies, environmental groups, and economic development advocates: Is the vision of the Jobs in the Woods/Hire the Fisher program viable as a long-term approach? Was it simply a transitional stopgap to help facilitate the implementation of the Northwest Forest Plan, or is there the potential for an industry in ecosystem management that can contribute to the health of Oregon’s economy and environment?
Those questions were brought to a head when the Oregon Economic and Community
Development Department (OECDD) convened a task force to examine and make recommendations about the future of the ecosystem management industry. After lengthy discussion it became clear that there is not an agreed-upon definition of the scope of the industry. Without a clear definition little can be said about the industry’s present scale or future prospects. In response to that conclusion OECDD commissioned this study, which addresses two basic questions:
1. What is the current scope of the ecosystem management industry in Oregon?
2. What is its likely scope in the intermediate (ten years) future?
To answer the questions we began by developing a working definition of the ecosystem management industry. The next section of this report is a discussion of the definition. Then, based on the industry definition, we present a preliminary analysis of the current state of the industry in Oregon. We then estimate the future scope of the industry and translate the estimate into work amounts and employment opportunities. Finally, we discuss identified industry issues and needs and conclude with recommendations for future action.

2 Scope and Future Prospects for Oregon’s Ecosystem Management Industry
II. Defining the Ecosystem Management Industry
Ecosystem management
Ecosystem management has become the dominant way to guide policy decisions and natural resource practices on federal lands (Franklin, 1997; BLM [Bureau of Land Management], 1994; National Forest System Land and Resource Management Planning Rules, 65 Federal Register, no. 218, November 9, 2000).
Ecosystem management is an evolving concept. However, as it has become more prominent as a guide to policy, the demand for a more precise meaning has generated controversy among scientists, resource managers, and policy makers. Most of the controversy concerns the practical means of choosing the scale of management units, uncertainty regarding the conceptual accounts of biodiversity, and the technical means to maintain ecosystem health (Zeide, 1999; Lackey, 1999; Fitzsimmons, 1999).
Although it may be an evolving concept, ecosystem management has always been linked to the principle of sustainability (Thomas 1997). In its most general sense sustainability refers to the relations between human economic needs and the present and future ability of the environment to supply those needs (Oregon Plan for Salmon and Watersheds, 1999 Annual Report; Dombeck, Thomas, & Wood, 1997; World Commission on Environment and Development, 1987). As a guiding principle, sustainability reaches across areas of social life to link resource science, management policies, and implementation strategies to social and economic goals. The BLM’s statement on its commitment to ecosystem management expresses these linkages:
Ecosystem management is the integration of ecological, economic, and social principles to manage biological and physical systems in a manner that safeguards the long-term ecological sustainability, natural diversity, and productivity of the landscape. The primary goal of ecosystem management is to conserve, restore, and maintain the ecological integrity, productivity, and biological diversity of public lands (BLM, 1994, pp. 1-2)
The underlying principle of the BLM’s definition is that “ecosystem management recognizes that natural systems and processes must be sustained in order to meet the social and economic needs of future generations” (BLM, 1994, p. 1).
Oregon’s Sustainability Agenda
Oregon has embraced the concept of sustainability in far-reaching ways. Most pertinent to this study, Governor Kitzhaber’s Executive Order No. 00-07 in May of 2000 directed state agencies to develop strategies to promote sustainability in government operations. Additionally, the executive order created a sustainability work group comprised of legislative members and state, business and community leaders charged with helping the state to improve sustainability efforts and recommend options for future state and community actions.
In the words of the executive order: “Sustainability means using, developing and protecting resources at a rate and in a manner that enables people to meet their current needs and also provides

Scope and Future Prospects for Oregon’s Ecosystem Management Industry 3
that future generations can meet their own needs. Sustainability requires simultaneously meeting environmental, economic and community needs” (EO-00-07, p. 2).
Taking up that focus, the theme of the Ecosystem Workforce Program’s (EWP’s) annual forum for 2001, held in Pendleton April 26 and 27, was “Advancing Oregon’s Sustainability Agenda: The role of the ecosystem management industry in achieving sustainability - ecological, social and economic.” At the forum, Jennifer H. Allen, OECDD’s Sustainable Business Liaison, characterized sustainability as a “new framework for thinking about the relationship between ecosystems, communities, and economic values.” She added that the ecosystem management industry “captures the full range of opportunities - and challenges - involved in making sustainability real.”
The ecosystem management industry is well situated to work toward and help achieve executive order 00-07’s goals of increased efficiency in use of natural resources and reductions in adverse impacts upon natural habits and further, to realize its environmental objective of healthy urban and rural watersheds.
Industry Definition
To create a working definition of the ecosystem management industry – the specific activities involved and the organizations and people who carry them out – we designed a process to elicit the views of a wide range of people engaged in or familiar with this work.
We began with a draft definition, and conducted interviews with twenty-two practitioners. These practitioners were chosen for their differing perspectives on ecosystem management – including economic development, biological sustainability, public and private resource management, and private forestry service contracting. (See Appendix I for a list of the interviewees.) Their additions and amendments to the draft definition were discussed and refined by two focus group meetings. The first focus group consisted of members of the Ecosystem Workforce Task Force, a group convened by the Oregon Community and Economic Development Department to explore opportunities for linking sustainable natural resource goals and sustainable community objectives. The second focus group consisted of selected participants at the EWP annual forum in Pendleton. (See Appendix II for a list of focus group participants.)
The result is the following definition.
The ecosystem management industry:
(1) enhances the components and functions of natural ecosystems;
(2) protects, maintains, and/or restores the integrity and diversity of biological structure;
(3) manages natural ecosystems for social, economic, and environmental purposes; and
(4) performs studies to enable informed decisions on protection, restoration, and management of ecosystems.

4 Scope and Future Prospects for Oregon’s Ecosystem Management Industry
To understand the specifics of how the industry does what it does, we established the following work classifications through the interview and focus group processes. Some of these are objectives, such as Watershed/Habitat Enhancement and Fuels Management. Others are broad categories encompassing specific management tasks, such as Landscape and Aquatic Surveys.
• Reforestation
• Stand Improvement
• Landscape Survey
• Aquatic Survey
• Watershed/Habitat Enhancement (heavy equipment)
• Watershed/Habitat Enhancement (by hand)
• Timber Harvesting
• Fuels Management
• Wildfire Suppression
• Recreation Management
Finally, within each work classification are specific tasks. We also used the interviews and focus group process to identify those tasks. A total of ninety-five tasks were identified under the ten work classifications. (See Appendix III.)
These tasks form the basis of our industry analysis. The total dollar volume of work performed on federal lands is characterized by these classifications. Data documenting work on state lands and privately owned lands are generally not detailed enough for these work types to be useful. Therefore, ecosystem management work on state and privately owned lands is classified as restoration work or silvicultural work related to one or more of the classifications when a finer grained description is unavailable.
Additionally the scope of the industry definition makes traditional means of characterizing employers and employees difficult. The ecosystem management industry is an emerging industry that exhibits characteristics that are not captured by standard ways of categorizing data. This means that traditional sources such as Standard Industrial Classifications for industries and employers, and Standard Occupational Classifications for employees, while useful for the data they provide, are not adequate for a full analysis of the entire range of activities in which the ecosystem management industry engages.
III. Current Scope of the Ecosystem Management Industry
Characterizing Industries
Industries are historically defined as the sellers of a particular product, one side of the market in which buyers and sellers arrange their transactions (Caves, 1992). Employment by an industry is traditionally defined by standard industrial classification divisions. Tables I and II show the sectors

Scope and Future Prospects for Oregon’s Ecosystem Management Industry 5
involved in some degree in the ecosystem management industry, by major industry group sector and subsector. Table I shows privately owned firms. The private ecosystem management industry, according to our definition, appears to encompass 6 major group sectors and 13 subsectors. Table II shows the public or governmental sectors in the ecosystem management industry. It comprises 2 major group sectors and 3 sub-sectors.
Table I Ecosystem Management Industries in the Private Sector by Standard Industrial Classification
Standard Industrial
Classification
Description
08 Forestry 0811 Timber tracts 0831 Forestry products 0851 Forestry services
09 Fishing, hunting, trapping 0971 Hunting, trapping, game propagation **** Other fishing, hunting & trapping **** Other agriculture, forestry & fishing
16 Heavy construction contractors 1629 Heavy construction
17 Special trade contractors 1781 Water well drilling 1794 Excavation work
24 Lumber & wood products 2411 Logging
87 Engineering & management services 8713 Surveying services 8731 Commercial physical research 8733 Noncommercial research
organizations
(source: Oregon Employment Dept, (OED))

6 Scope and Future Prospects for Oregon’s Ecosystem Management Industry
Table II Ecosystem Management Industries in the Public Sector by Standard Industrial Classification
Standard Industrial
Classification
Description
Federal Government
08 Forestry 0811 Timber tracts
95 Administration of Environmental
Quality & Housing Programs
9511 Air, water and solid waste management
9512 Land, mineral and wildlife conservation
State Government
08 Forestry 0811 Timber tracts 0831 Forestry products
95 Administration of Environmental
Quality & Housing Programs
9511 Air, water and solid waste management
9512 Land, mineral and wildlife conservation
Local Government
09 Fishing, hunting &
trapping
**** Other agriculture, forestry and fishing
95 Administration of Environmental
Quality & Housing Programs
9511 Air, water and solid waste management
9512 Land, mineral and wildlife conservation
(source: Oregon Employment Dept)

Scope and Future Prospects for Oregon’s Ecosystem Management Industry 7
The problem with these classifications is readily apparent. As an emerging industry, ecosystem management faces the problems of boundary definitions. Economic theory tells us that all participants in a specific market should be sensitive to the prices prevailing in the market. Problems of industry boundaries arise when the demand side shifts their preference for products (Caves, 1992).
The implementation of the Northwest Forest Plan and its consequent reduction in federal timber harvest levels, the advent of ecosystem management as a policy guide and practical approach, the increased concern for salmon habitat and other watershed issues, the advent of sustainability as a policy goal – all these require traditional forestry management service providers to adapt their products to new market demands. Under the previous multiple-use and resource extraction focus of federal forest planning, forestry management was considered to be part of the timber industry. The timber industry was based on an industrial model of efficiency. The companies and workforces that performed technical forest planning, timber harvesting, and silvicultural services were clearly separated. Now, however, as our definition reveals, ecosystem management reaches across traditional industry and occupational boundaries. Ecosystem management as it is practiced, still encompasses the activities of traditional forestry management businesses, but it is also comprises those considered to be primarily a part of other industries and occupations. Consequently, this report is able to give a detailed account of those traditional forestry management businesses that may still constitute the core of the ecosystem management industry, but as it moves towards the boundaries, the reliability of the data and our analysis becomes more and more problematic.
The major industrial group 08 Forestry is the traditional industry sector for forestry management. The tasks in that industrial sector correspond roughly to some of the tasks within the work types Reforestation, Stand Improvement, Fuels Management and Wildlife Suppression. Also certain tasks associated with other work types, such as those within Landscape Survey and Watershed / Habitat Enhancement by hand and by heavy equipment correspond to the activities in the O8 sector. Tables I and II show the SIC codes for industry categories having activities that most likely fall within our industry definition and are consequently available as data resources.
The entire list of SIC descriptions associated with the ecosystem management industry is found in Appendix IV. A brief discussion of these is necessary in order to connect what these classifications describe with the activities outlined in the industry description.
The SIC Major Group 08 Forestry comprises the industry groups 0811 Timber Tracts, 0831 Forestry Products other than lumber, and the 0851 Forestry Services. As noted, these are the traditional sectors in which the extent of forestry management activities was described. Some of the tasks in the 0851 sector include timber cruising, fire prevention and preparation of forest management plans.
The Major Group SIC 95 is reserved for governmental agencies. The 9511 group includes those who are engaged in the regulation, planning and conservation of air and water resources. The 9512 group, Land, Mineral, Wildlife, and Forest Conservation are those engaged in planning for land use from a conservation perspective and who are responsible for the protection of publicly owned forest lands. Fish & wildlife agencies, and soil and water conservation districts are examples of those in this group.
These industry sectors are the traditional activities associated with forestry management. They are also the industry sectors within our definition of ecosystem management that have the most readily accessible data. Consequently, we will be using the data from the entire 08 sector for privately owned

8 Scope and Future Prospects for Oregon’s Ecosystem Management Industry
businesses, and the 08, 9511 and 9512 for the governmental industries to detail a preliminary examination.1
It is difficult to categorize other industries active in the ecosystem management definition. In many cases there is no way of knowing how much of their business activity can accurately be associated with ecosystem work. Logging, the 2411 code, is a specific work classification (Timber Harvesting) in our definition, but much logging is not directed at ecosystem management per se. The industry group 1629 Heavy Construction, Not Elsewhere Classified engages in tasks that are part of the Habitat Enhancement by heavy equipment category. Industry Group 8713 Surveying Services is another example of an industry that is very active in ecosystem management. Similarly, physical and biological research scientists perform those studies necessary to make informed decisions about ecosystems.
This short list of SIC descriptions simply shows that while ecosystem management retains its traditional character of forestry services activities, the industry includes other portions of other industrial sectors. This boundary problem makes a precise characterization of the entire industry impossible. Thus, what follows is only a first approximation.
Employers, Employees, and Incomes
We can examine the private sector by detailing the employment statistics for the 0851 sector Forestry Services because all of the activities listed in its description fall within the ecosystem management definition. The Oregon Employment Department data shown in Table III are for those employees covered by unemployment insurance in private business. It does not account for self-employed workers, or owners of incorporated businesses.
Although this study focuses on the years 1998 and 1999, the 0851 sector employment figures for the ten-year period 1990 - 1999 provide a very useful overview. They give us an idea of a rate of change that might not be apparent within a shorter timeframe. The payroll figures are not adjusted for inflation. Nevertheless, they give us a sense of the importance of Forestry Services to the Oregon economy. But what is most interesting is the trend in average employment. It shows a decrease of 2.25 percent from 1990 to 1991, and then steep declines of 12.53 percent 1991 to 1992 and 7.55 percent from 1992 to 1993. Since then there has been an upward trend; by 1999 the number of jobs in Forestry Services exceeded the 1990 level.
1 The 1987 Standard Industrial Classifications (SIC) codes are being superceded by a new North American-wide statistical program, the North American Industrial Classification System (NAICS). While the SIC classified each business establishment (defined as a single physical location at which economic activity occurs) according to its primary activity, the NAICS groups together economic units that use like processes to produce goods or services. This "production-oriented" system means that statistical agencies in the United States will produce data that can be used for measuring productivity, unit labor costs, and the capital intensity of production; constructing input-output relationships; and estimating employment-output relationships. While the SIC uses four-digits, NAICS is a six-digit system that provides for comparability among North American countries at the five-digit level. The SIC 0851 Forestry Services corresponds to the NAICS 11531 Support Activities for Forestry. The conversion to NAICS is progressing slowly. Data pertinent to this study were classified by the SIC. Ecosystem management is not a category in the NAICS.

Scope and Future Prospects for Oregon’s Ecosystem Management Industry 9
Table III Average Employment, Average Annual Payroll per Worker, and Total Annual Payroll by Year - SIC 0851 Forestry Services (Private Ownership), Oregon State-wide 1990 –1999
Year
Average Employment
Avg. Annual Payroll per Worker
Total Payroll
1990 3069 $17,865 $54,826,677 1991 3000 $17,508 $52,524,142 1992 2624 $18,687 $49,034,553 1993 2426 $19,222 $46,633,263 1994 2683 $22,239 $59,668,218 1995 2773 $22,527 $62,466,369 1996 2970 $22,630 $67,212,078 1997 3027 $21,688 $65,649,989 1998 3024 $21,458 $64,888,148 1999 3212 $22,053 $70,834,338
(source: Oregon Employment Dept)
A more detailed look at 1998 and 1999 wages for the 0851 Forestry Services worker is shown below in Table IV. The Oregon Employment Department calculates average weekly wages by dividing the average annual payroll per worker by fifty-two weeks. Table IV shows the number of reporting units, and average employment and average weekly wages for the 0851 sector for 1998 and 1999.
Table IV Average Employment & Wages for Forestry Services Workers, 1998 & 1999
0851 Forestry
Services
No. of reporting
units
Average
employment
Average
weekly wages
1998 290 3024 $412.65
1999 290 3212 $424.10
(source: Oregon Employment Dept)

10 Scope and Future Prospects for Oregon’s Ecosystem Management Industry
As we saw previously, average annual wages for this sector are climbing slowly back to their 1995 and ’96 levels, although losing ground to inflation. (1999 average annual wages were $22,053 compared to 1996 wages of $22,630). The average annual payroll of 1990, $17,865 from the previous tables translates into $344 average weekly payroll. When adjusted for inflation for the Portland urban area, with a CPI-U index of 0.802, this $344 equals $428 in 1998 dollars. The 1998 actual average weekly wages did not keep up with inflation.
The SIC sector 0851 gives a limited look at the private ecosystem management industry. Table V combines all of the 08 sub-sectors, 0811 Timber Tracts, 0831 Forest Products, and 0851 Forestry Services. Table V shows the ten-year average employment and percent of change.
Table V Average Employment for Major Group 08 Forestry Including 0811 Timber Tracts, 0831 Forestry Products, and 0851 Forestry Services (Private Ownership) 1990 – 1999
Year Average
Employment
% Change
1990 4,349 1% 1991 4,371
-6.5% 1992 4,076 -2.4% 1993 3,975 4.8% 1994 4,168 5.6% 1995 4,402 1% 1996 4,476 1% 1997 4,524 1% 1998 4,560 3.1% 1999 4,703
(source: EWP 2001 analysis of OED data)
The pattern in Table V, for the entire 08 sector, is similar to that found in Table IV for the more limited 0851 sub-sector: a large decline between 1991 and 1992, a lesser decline between 1992 and 1993, and then an increase that starts in 1993 and continues until 1999. The 08 private sector is the most characteristic of the emerging ecosystem management industry for which we have a complete set of employment data to examine.
The other SIC sectors that we outlined, as being representative of the emerging industry are the governmental sectors. The federal government owns and manages 56% of the forestland in Oregon

Scope and Future Prospects for Oregon’s Ecosystem Management Industry 11
(Oregon Dept of Forestry). State owned forest land in Oregon is only about 3% of the total forest ownership, but the Oregon Department of Forestry has regulatory and other responsibilities off of state-owned land. In consequence they employ nearly as many workers in the governmental ecosystem SIC sectors as do the private firms shown in the 08 sector. Table VI shows the total employment in the governmental SIC sectors that fall in whole or in part within our definition of the ecosystem management industry.
Table VI Number of Federal Employees in Industry Sectors Within the Ecosystem Management Industry for 1998 & 1999*
Federal Government 1998
1999
SIC 0811 Timber Tracts 5,106 4,883
SIC Code 9511 Air, Water & Solid Waste Management 83 86
SIC Code 9512 Land, Mineral & Wildlife Conservation 3,159 3,188
Subtotal 8,348 8,157
State Government
SIC 01-09 Agriculture Forestry & Fishing 325 318
SIC 9511 Air, Water & Solid Waste Management 890 928
SIC 9512 Land, Mineral & Wildlife Conservation 1,752 1842
Subtotal 2,967 3088
Local Government
SIC 9511 Air, Water & Solid Waste Management 62 67
SIC 9512 Land, Mineral & Wildlife Conservation 237 256
Subtotal 299 323
Totals 11,614 11,568
(source: Oregon Employment Dept) * This includes only those federal employees included in the Unemployment Compensation for Federal Employees
Program (UCEF).

12 Scope and Future Prospects for Oregon’s Ecosystem Management Industry
It is interesting to note that the total employment for all levels of government is almost three times that in private firms in the core 08 SIC code.
Table VII shows the total number of ecosystem management workers in Oregon from the SIC sectors that make up the core of the traditional forestry management industry.
Table VII Total Oregon Private, Federal, and State & Local Government Workers in Selected SIC sectors within the Ecosystem Management Industry 1998 & 1999
1998 1999 Private Ownership 4,560 4,703
Federal Employees 8,348 8,157
State & Local Employees 3,266 3,411
Totals 16,174 16,271
(source: EWP 2001 analysis of OED data)
As the earlier discussion of boundary definitions suggested, these numbers are far from complete. They undercount the jobs in ecosystem management. An unknown number of workers in heavy construction, special trade contracting, engineering, architectural, and surveying services are also working in the ecosystem management industry. However, existing data systems do not allow us to estimate how much of these firms’ business is directly related to ecosystem management. To take an example, a construction firm may perform a contract to reconstruct a forest road for habitat enhancement, or sub-contract portions of such a job from an environmental engineering firm. Though it is clearly an ecosystem management activity, it is impossible to separate it out from other construction work. Similarly, surveyors or map technicians are likely to be involved in projects or portions of projects directly related to forestland certification, forest road decommissioning, or recreational site design – but existing data systems do not allow those jobs to be separated out from their other work.
The next step in our analysis is to estimate incomes for workers in those SIC sectors that are within the ecosystem management industry. We can detail the payroll and wages for the federal, state and local government industry sectors that fall within the ecosystem management definition, as we did for the number of employees. Table VIII shows the pertinent government SIC sectors for 1998 and 1999.

Scope and Future Prospects for Oregon’s Ecosystem Management Industry 13
Table VIII Oregon Covered Payroll in Federal, State & Local Government Industrial Sectors Within the Ecosystem Management Industry for 1998 & 1999
Federal Government State Government Local Government
1998 1999 1998 1999 1998 1999
SIC 01-09Agriculture, Farming Fishing (0811 Timber Tracts)
$199,843,273 $187,727,025
SIC 0811 Timber Tracts $6,641,392 $6,928,540
SIC 0831 Forest Products $1,891,673 $2,154,426
SIC 9511 Air, Water & Solid Waste Management
$6,710,880 $7,257,403 $34,536,945 $38,517,472 $1,726,278 $1,881,395
SIC 9512 Land, Mineral & Wildlife Conservation
$146,903,977 $142,176,526 $54,995,814 $60,753,148 $6,121,478 $7,044,379
Totals per Year $353,458,130 $337,160,954 $98,065,824 $108,353,586 $7,847,756 $8,925,774
(source: EWP 2001 analysis of OED data)
We noted earlier (see Table III) the payrolls for the 0851 sector for 1998 and 1999. Table VIII combines the total annual payroll as reported to the Oregon Employment Department for the governmental SIC sectors that have been identified as being comprised of activities within the ecosystem management industry definition.
Table IX is large and complex. It shows the total amount and percentage of each industry sector and each level of government that they contributed to the total payroll in 1998 and 1999. The annual covered payroll that we can be sure is a part of the ecosystem industry is the SIC codes explained throughout this report. The private ownership sector includes forestry services workers, timber tract workers, and forest products workers (products being other than lumber). In 1998 these sectors had a total covered payroll of $96.5 million; in 1999, the amount rose to $106 million. Yearly, this is about 18% of the total covered payroll for the industry. The governmental sectors accounted for about $460 million of covered payroll in 1998 and approximately $454 million in 1999. Combined, all of these sectors produced $555 million in reported wages in 1998, and over $560 million in 1999.

14 Scope and Future Prospects for Oregon’s Ecosystem Management Industry
Table IX Total Oregon Annual Covered Payrolls in Private Ownership and Federal, State & Local Government Industrial Sectors in the Ecosystem Management Industry for 1998 & 1999
1998 1999 2 Year Total % of 2 Year
Total by Sector
Ownership % of 2 Year Total by All Sectors
Private Ownership
SIC 0851 Forestry Services $64,888,148 $70,834,338 $135,722,486 12.16%
Sic 0811 Timber Tracts $29,563,262 $32,928,063 $62,491,325 5.60% 18.14%
Sic 0831 Forest Products $2,056,390 $2,210,691 $4,267,081 0.38%
Federal Government
SIC 0811 Timber Tracts $199,843,273 $187,727,025 $387,570,298 34.72%
SIC 9511 Air, Water & Solid Waste Management
$6,710,880 $7,257,403 $13,968,283 1.25% 61.87%
SIC 9512 Land, Mineral & Wildlife Conservation
$146,903,977 $142,176,526 $289,080,503 25.9%
State Government
SIC 0811 Timber Tracts $6,641,392 $6,928,540 $13,569,932 1.22%
SIC 0831 Forest Products $1,891,673 $2,154,426 $4,046,099 0.36% 18.49%
SIC 9511 Air, Water & Solid Waste Management
$34,536,945 $38,517,472 $73,054,417 6.54%
SIC 9512 Land, Mineral & Wildlife Conservation
$54,995,814 $60,753,148 $115,748,962 10.37%
Local Government
SIC 9511 Air, Water & Solid Waste Management
$1,726,278 $1,881,395 $3,607,673 0.32%
SIC 9512 Land, Mineral & Wildlife Conservation
$6,121,478 $7,044,379 $13,165,857 1.18% 1.50%
Totals $555,879,510 $560,496,372 $1,116,292,916 100.00%
(source: EWP 2001 analysis of OED data)

Scope and Future Prospects for Oregon’s Ecosystem Management Industry 15
Averaging wages across occupations is not useful for the ecosystem management industry, since it has many different occupations within it. In the Reforestation classification for example, a worker employed to plant trees is not earning as much annually as is someone employed to prepare environmental impact statements under the Landscape Survey classification. The Standard Occupational Classification (SOC) system categorizes occupations within industries. The Oregon Employment Department publishes occupational wage estimates based on the Bureau of Labor Statistics’ “Occupational Employment Statistics” (OES) program. This program consists of an annual survey measuring occupational employment and wage rates for payroll workers by SIC coded industry. The 1998 numbers are a compilation of 1996, 1997, and 1998 surveys. Each year one-third of the total target number industries are surveyed with all industries covered each year. The 1998 estimates are based on 6,000 establishments surveyed per year for three years. This database does not include the self-employed, owners or partners of unincorporated firms, and unpaid family workers. Data are grouped by OES code and occupational title. OES codes are numbers assigned to occupational descriptions.
A major characteristic of OES surveys is that they do not sample privately owned establishments in some of the Division A SIC structure including SIC 08 Forestry. They do however sample federal, state, and local government SIC 08 industries. Consequently, a large amount of information pertaining to the major industrial sectors traditionally associated with private ownership forestry management is unavailable in this program. Table X illustrates the range of wages in selected occupations within the ecosystem management industry.
Table X 1998 Oregon Wages for Selected Occupations within the Ecosystem Management Industry
OES code
Occupational Title
Total Employment
Hourly Median Wage
Hourly Mean
(Average) Wage
Average Annual Wage
% of RSE for
Hourly Mean
% of RSE for
Employment Estimate
79002 Forest and Conservation Workers
1,430 14.24 14.68 $30,530 1.2 2.4
24302 Foresters and Conservation Scientists
1,200 21.50 22.31 $46,410 1.1 4.6
87817 Fence Erectors 500 10.42 11.57 $24,070 8.5 14.7 22311 Surveyors and Mapping
Scientists 550 20.40 20.70 $43,060 4.2 13.5
24308 Biological Scientists 1,980 21.19 22.27 $46,320 1.9 9.7 22308 Landscape Architects 190 20.73 21.63 $45,000 7.1 18.5 87803 Hazardous Materials
Removal Workers 260 15.01 16.36 $34,040 4.9 22.1
97956 Operating Engineers 1,620 18.28 18.53 $38,550 1.9 10.6
(source: Bureau of Labor Statistics) RSE = Relative standard error. This is a measure of the reliability of the survey statistic. The smaller the RSE, the more precise the estimate.

16 Scope and Future Prospects for Oregon’s Ecosystem Management Industry
The range of average annual wages for these selected occupations in 1998 was between approximately $24,000 and $46,000. By comparison, the average for all Oregon workers was $28,308.
Table XI Number of Firms Reported, Average Employment and Average Weekly Wages in Private Ownership and Federal State & Local Government Industrial Sectors in the Ecosystem Management Industry for 1998 & 1999
1998 1999
Number of reporting
units Average
Employment
Average Weekly Wages
Number of reporting
units Average
Employment
Average Weekly Wages
Private Ownership
SIC 0851 Forestry Services 290 3,024 $413 290 3,212 $424
SIC 0811 Timber Tracts 114 1397 $407 114 1369 $463
SIC 0831 Forest Products 13 139 $285 14 122 $348
Federal Government
SIC 0811 Timber Tracts 79 5106 $752 78 4883 $739
SIC 9511 Air, Water & Solid Waste Management
1 83 $1,555 1 86 $1,622
SIC 9512 Land, Mineral & Wildlife Conservation
50 3159 $894 49 3188 $858
State Government
SIC 0811 Timber Tracts 4 205 $623 4 198 $674
SIC 0831 Forest Products 1 120 $303 1 121 $342
SIC 9511 Air, Water & Solid Waste Management
33 890 $746 33 928 $798
SIC 9512 Land, Mineral & Wildlife Conservation
58 1752 $604 57 1842 $634
Local Government
SIC 9511 Air, Water & Solid Waste Management
16 62 $535 17 67 $540
SIC 9512 Land, Mineral & Wildlife Conservation
36 237 $497 37 256 $529
Totals 695 16,174 695 16,272
(source: Oregon Employment Dept)

Scope and Future Prospects for Oregon’s Ecosystem Management Industry 17
Thus, when we look at those industrial sectors that we can be reasonably sure are almost entirely contained with the ecosystem management industry; the nature of the variety of the occupations limits any generality concerning wages. It may therefore be useful to see the actual wages within particular SIC sectors and compare them across other sectors in the industry. Table XI compares the average weekly wages of types of ecosystem management work across private and government ownership in terms of industrial sectors whose occupations are within the industry. It is apparent that wages greatly vary between ownership, industrial sector, and accordingly, occupations within those sectors. The lowest industrial sector weekly wages, state government 0831 Forestry Products, is only 21% of that of the highest weekly wage, federal government 9511 Air, Water and Solid Waste Management.
Size of Establishments in Selected Industrial Sectors
The 1999 employment data (Table XI) lists 290 privately owned firms in the 0851 Forestry Services sector. Information concerning size is available for 237 of them. These are the firms who mostly work in the Reforestation, Stand Improvement, Wildfire Suppression, and Habitat Enhancement categories. Table XII shows their size by number of employees.
Table XII Privately Owned 0851 Sector Employer Size by Number of Employees 2001
No. of Employees No. of
Employers % of Total
1-4 114 48.1% 5-9 15 6.3%
10-19 23 9.7% 20-49 52 21.9% 50-99 21 8.9%
100-249 12 5.1% (source: Oregon Employment Dept)
Nearly half the firms in the 0851 group have fewer than five employees. The governmental sector 9511, Air, Water, & Solid Waste Management is also relatively small. The Oregon Employment Department lists fifty-seven government agencies in this group, with sizes by employee available for forty-eight. Fifty-four percent of them have fewer than nineteen employees. The 9512 group, Land, Mineral & Wildlife Conservation lists 202 agencies, with sizes available for 150. Seventy-two percent of these, 108, have less than 19 employees. Many of them are Soil & Water Conservation Districts and rural offices of the state Fish & Wildlife Service. Sixty-six have less than five employees. Of the thirty-two contracts awarded from the Willamette Province Workforce Project from 1996 to 2000 and analyzed by EWP, fourteen awardees reported no employees, and fourteen others reported less than four employees.

18 Scope and Future Prospects for Oregon’s Ecosystem Management Industry
Dollar Value of Work Performed - Federal Lands
The following three tables show the amount of ecosystem management work awarded by the U. S. Forest Service (FS) and the Bureau of Land Management (BLM) in Oregon for the years 1998 and 1999, detailed according to the ecosystem management tasks in the industry definition.
Table XIII Awarded Ecosystem Management Contracts: Total Oregon Bureau of Land Management; Amounts by Work Type & Year
1998 1999 Totals % of total
Aquatic Surveys $51,000 $697,066 $748,066 1.85%
Fuels Management (2) $1,896,396 $1,896,396 4.70%
Habitat Enhancement by hand $8,000 $175,582 $183,582 0.45%
Habitat Enhancement by heavy equipment (1) $10,787,294 $4,353,728 $15,141,022 37.49%
Timber Harvesting (2) $84,148 $84,148 0.21%
Landscape Surveys $541,964 $1,889,301 $2,431,265 6.02%
Recreation Management $726,790 $2,333,590 $3,060,380 7.58%
Reforestation $1,135,098 $1,090,638 $2,225,736 5.51%
Stand Improvement $4,330,671 $5,742,734 $10,073,405 24.94%
Wildfire Suppression $3,868,815 $18,100 $3,886,915 9.62%
Multidisciplinary contracts (3) $131,329 $131,329 0.33%
Training Ecosystem Workers (4) $528,931 $528,931 1.31%
Totals $21,449,633 $18,941,543 $40,391,176
(source: EWP 2001 analysis of BLM contract ledgers)
(1) This category was combined with contracts having road maintenance, and obliteration as their primary objective
(2) Incomplete data
(3) Multidisciplinary contracts comprise many work types and sub-tasks. Their primary objective is watershed restoration
(4) Training workers refers to training dislocated workers through the Jobs In The Woods (JITW) program
(These notes apply to Tables XIV and XV as well as table XIII.)

Scope and Future Prospects for Oregon’s Ecosystem Management Industry 19
Table XIV Awarded Ecosystem Management Contracts: Total Oregon Forest Service; Amounts by Work Type & Year
1998 1999 Totals % total
Aquatic Surveys $438,276 $233,948 $672,224 1.46% Fuels Management $738,916 $220,667 $959,583 2.09% Habitat Enhancement by hand $737,794 $624,087 $1,361,881 2.96% Habitat Enhancement by heavy equipment (1) $5,584,800 $5,133,347 $10,718,147 23.30% Timber Harvesting (2) $4,412 $84,708 $89,120 0.19% Landscape Surveys $1,033,097 $718,491 $1,751,588 3.81% Recreation Management $621,347 $2,191,780 $2,813,127 6.12% Reforestation $11,493,628 $6,997,935 $18,491,563 40.21% Stand Improvement $5,227,149 $3,908,297 $9,135,446 19.86% Wildfire Suppression
Totals $25,879,419 $20,113,261 $45,992,680
(source: EWP 2001 analysis of FS contract ledgers)
Table XV Awarded Ecosystem Management Contracts: Combined Total Oregon Forest Service and BLM Contract Amounts by Work Type, 1998 and 1999
Forest
Service BLM Totals % total
Aquatic Surveys $672,224 $748,066 $1,420,290 1.64% Fuels Management (2) $959,583 $1,896,396 $2,855,979 3.31% Habitat Enhancement by hand $1,361,881 $183,582 $1,545,463 1.79% Habitat Enhancement by heavy equipment (1) $10,718,147 $15,141,022 $25,859,169 29.94% Timber Harvesting (2) $89,120 $84,148 $173,268 0.20% Landscape Surveys $1,751,588 $2,431,265 $4,182,854 4.84% Recreation Management $2,813,127 $3,060,380 $5,873,507 6.80% Reforestation $18,491,563 $2,225,736 $20,717,300 23.98% Stand Improvement $9,135,446 $10,073,405 $19,208,851 22.24% Wildfire Suppression $3,886,915 $3,886,915 4.50% Multidisciplinary contracts (3) $131,329 $131,329 0.15% Training Ecosystem Workers (4) $528,931 $528,931 0.61%
Totals $86,383,856
(source: EWP 2001 analysis of FS and BLM contract ledgers)

20 Scope and Future Prospects for Oregon’s Ecosystem Management Industry
These data are limited in various ways. Of the eleven National Forests in Oregon, complete data is only available for eight. The BLM data are also limited. Due to the nature of BLM procurement processes, contracts are awarded from both the state and district levels and the district level is incomplete. Also, both FS and BLM procurement centers differed as to their understanding of what “ecosystem management” implies. This difference only underscores the problems with defining industry or management boundaries. For example, the amount of awarded work for Timber Harvesting does not account for the commercial thinning projects awarded. Timber Harvesting in our definition is an ecosystem management task, but the data are confined to logging as a means to other management objectives such as trail log-out or riparian restoration. The Multidisciplinary work type is also limited. This is a new type of procurement objective that seeks to combine various ecosystem management tasks into one contract. The multidisciplinary concept perhaps is a model of what ecosystem management actually could be, but the multidisciplinary contract amounts from the Forest Service were incomplete. To avoid giving a false impression of the actual amounts of this type of contract, the Forest Service multidisciplinary contracts were collapsed into the Habitat Enhancement by Heavy equipment category. Wildfire Suppression is also incomplete. No Forest Service data were available regarding this category and BLM data are only reliable for 1998.
Table XV combines the two agencies’ awarded contracts for 1998 and 1999. Between 600 and 650 different contractors performed the approximately $86 million worth of work. Some contractors performed multiple contracts. The Oregon Bureau of Labor & Industries (BOLI) listed between 200 and 230 contractors as Farm/Forest Labor Contractors during the data period, 1998 and 1999. Contractors must be licensed by BOLI when they bid on or perform any contract that contains licensable activities. These activities mostly comprise the tasks that fall under the definitional categories of Reforestation and Stand Improvement, the traditional forestry management services. Many of the activities in the federal contract data set do not fall under BOLI’s licensable activities.
The Reforestation and Stand Improvement categories help give a general indication of the amount of wages that were paid during the two-year period for this contract work. These two work types comprise labor intensive tasks. Generally, wages alone account for 45-65% of an awarded labor intensive contract amount. This means wages paid, and not overhead associated with labor costs. Labor intensive contracts are at the high end of this labor/gross profit ratio, with the more equipment-oriented tasks at the low end. As a rough estimate, we can assume a high end of 55% of contract amount going toward wages for labor intensive tasks, and 25% of contract amount going to wages in equipment intensive tasks. The $86 million in awarded contract amounts for 1998 and 1999 would then translate into an approximate range of $21 to $45 million going toward wages from contracted work from federal lands alone.
Total payrolls for the privately owned and governmental SIC industries associated with the core of the ecosystem management industry were approximately $1.1 billion for the two-year period (Table IX). The privately owned 0851 Forestry Services sector comprised approximately 12% of this total, or $135 million. Almost all of the activities in the 0851 sector are licensable under BOLI regulations. That means that approximately $980 million were preformed by non-forest/farm labor licensed contractors. Concerning the $86 million of Forest Service and BLM awarded work, only about 60% of the approximately 230 contractors licensed by BOLI for the contract period, performed any of that work.
This shows the diversity of industries and occupations in the emerging ecosystem management industry. Despite the fact that we have to begin with the traditional forestry management sectors so we

Scope and Future Prospects for Oregon’s Ecosystem Management Industry 21
can talk about ecosystem management, most of the work is not being done by these traditional forestry management businesses.
State Lands & Private Lands
Table XVI shows the ownership of Oregon’s forest lands. Federal ownership accounts for more than half of the forest land in Oregon. Privately owned forest lands are just under forty percent of the total, with the remainder in state and local governmental ownership.
Table XVI Oregon's Forest Land Base by Ownership
Ownership Acres % of total Federal 15,610,000 56.8%
State 899,000 3.3%
County & Municipal 123,000 0.4%
Private
Native American Lands 480,000 1.7%
Nonindustrial Private 4,438,000 16.1%
Industrial 5,954,000 21.6%
Total 27,502,000
(source: Oregon Department of Forestry)
The most intensive forestry management occurs on private, industrial, forest land. These lands generate much of the total payrolls associated with traditional forest management practices. Information concerning the extent of management activities on these lands in terms of employment or amount of work accomplished is not consolidated in any one place. The Oregon Department of Forestry (ODF) tabulates the amount of some traditional management activities on state, local government and privately owned lands, but reporting is voluntary. ODF tracks harvest levels, but the data are in terms of board feet. Timber Harvesting is an ecosystem management work classification. This study did not include the employment numbers and payroll amounts from the 2411 sector logging because that industry is well known as an independent industry sector. We are chiefly concerned with trying to define an emerging industry, and while we rely on the established SIC sectors of Forestry Services and Land, Mineral & Wildlife Conservation, this is simply a base from which to begin.
We have limited data on traditional forestry management tasks on state and privately owned land, acres planted, acres pre-commercially thinned, and acres fertilized. The fertilization acres are a mixture of hand fertilization, which is labor intensive, and aerial fertilization, which is machine intensive. The rest of our data can be summarized as follows:
• 1997-1999 and 1999-2001 funding figures for the Oregon Watershed Enhancement Board’s (OWEB) investments in Watershed Councils.

22 Scope and Future Prospects for Oregon’s Ecosystem Management Industry
• Approximate Public and Private investments made through OWEB for the years 1995 through 1999 for habitat enhancement and restoration work concerning the Governor's Plan for Salmon and Watersheds.
• Wyden Amendment funding allocated by the Forest Service & Bureau of Land Management as well as matching contributions from partners for restoration projects.
These sources allow us a very hazy glimpse at some of the management actions occurring on private ground. However, Oregon is home to almost six million acres of industrial forest land, and many concerned rural landowners who are taking part in restoration work.
Table XVII summarizes some management actions on private non-industrial forest lands, industrial forest land, Native American lands, and state and local municipal lands.
Table XVII Forest Management Activities on State & Private Lands
Management Activities & Ownership 1998 1999
Acres Reforested Private Industrial & Non-industrial 98,097 94,391 State & Local Government 3,077 2,909 Native American 6,695 5,658 Subtotal 107,869 102,958
Acres Fertilized Private Industrial & Non-industrial 96,596 95,484 State & Local Government 3,999 0 Native American 0 0 Subtotal 100,595 95,484
Acres Pre-commercially Thinned Private Industrial & Non-industrial 31,056 25,190 State & Local Government 4,066 3,410 Native American 446 1,247 Subtotal 35,568 29,847
Totals 244,032 228,289
(source: Oregon Department of Forestry)

Scope and Future Prospects for Oregon’s Ecosystem Management Industry 23
Reforesting harvested units, pre-commercially thinning young stands, and applying fertilizer are traditional practices that fall within the 0851 SIC sector, and also within the ecosystem work categories of Reforestation, and Stand Improvement. Reforestation and pre-commercial thinning are typical labor intensive tasks. Without knowing how much of the fertilization was by hand or aerial, we can't readily typify that activity as either labor intensive or equipment intensive. We can summarize this work in two ways – either convert the labor intensive tasks into dollars per acre and figure a payroll amount, or categorize them as amounts of work that offer opportunities to the industry. Since the other collections of data are in dollars and not payrolls or employment figures, it makes sense to summarize them all as dollars available for work opportunities. We can however, examine the reforestation and pre-commercial thinning acres in terms of payrolls just to get an idea of what they represent in those terms. In 1998 there were approximately 140,000 acres treated by either thinning or planting. We can assign a range of values to imaginary bid or negotiated prices to do that work and arrive at a payroll figure. We can use price estimates for planting to get a conservative figure since planting costs are generally less expensive than thinning. Generally, tree planting on the west side of the Cascades markets was valued for at least $100 per acre, and on the east side at least $60 per acre. The high and low range might be $40 to $80/ac and $70 to $110/ac. We can combine these ranges to get a low of $60/ac and a high of $90/ac for both treatments. That would equal a range of $8.4 million to $12.6 million to do the work. Wages for labor-intensive tasks generally range between 45% and 55 % of the contract price. At 50%, we would have a range of $4.2 to $6.3 million for labor from these two treatments.
The remaining data for private land are spread out beyond the two year focus of this study.
• OWEB reports $92 million spent during 1995-2000, mostly on riparian restoration, road and culvert repair; $3.2 million spent during 1997-1999, and $4.1 million during 1999-2000 for Watershed Council projects and support.
• Forest Service & Collaborators: $2.4 million spent in 1999 on restoration projects
• BLM & Collaborators: $3 million spent in 2000 on restoration projects
• Forest Service & Collaborators: $1.6 million spent in 2000 for restoration projects
These projects represent approximately $106 million going to administer and accomplish ecosystem management projects. There is however, an enormous amount of work happening on the private industrial forest land that we have not been able to capture at all. What we can see is only a small part of the entire industry.
Summary
As noted, the ecosystem management industry in Oregon is difficult to classify because we can see so little of it. But what we can see of it currently looks like this:
• 16,270 employees in the public and private SIC 08 sector, and the governmental 9511 and 9512 sectors
• $560 million dollars annual payroll in the SIC sectors identified
• Average weekly wages ranging between $340 and $1600

24 Scope and Future Prospects for Oregon’s Ecosystem Management Industry
• In SIC 0851Forestry Services, which generated $64 to $70 million in annual wages during 1998 and 1999, 48% of the firms have four or fewer employees
• The Forest Service and BLM together awarded approximately $40 million in ecosystem work during 1999, and approximately $46 million in 1998
• Approximately 133,000 acres of private ownership timberland was reforested and thinned in 1999, and if the work had entirely been contracted out, total amount of contact award would have been in the range of $12 million
• Private and public partners spent at least $106 million on restoration work in the period 1995 to 2000
• Over the ten-year period 1990 to 1999, wages in the 0851 Forestry Services sector have not kept up with inflation
IV. Industry Forecast
To estimate the future scope of the industry we facilitated a Delphi process via e-mail. Delphi is a group process which utilizes written responses to aggregate the judgements of a number of individuals (Delbecq, Van de Ven, & Gustafson, 1975). Panelists were selected from the interviews and focus group participants. This process consisted of two rounds of questions and one round of comments. Responses from the first round were summarized and panelists were asked in the second round for revisions based on their colleague’s input. Responses from the second round were summarized into a draft forecast and panelists were again asked for their comments. The final forecast is based on this iterative process. Eight panelists responded to the first round and seven responded to the second. Five panelists sent final comments. (See Appendix V for the panel members.)
Panelists were asked to respond to two questions. The first question asked them to rate the overall future of the industry as well as each work classification. "Based on your particular knowledge, our industry definition and work classifications, what will be the scope of the ecosystem management industry in Oregon in ten years (in 2011) both overall and in each work type in our definition?”
Panelists were asked to use the following ranges:
1 = much smaller (minus 25% or more from the present)
2 = a little smaller (minus 25% to minus 10% of the present)
3= about the same (plus or minus 10% of the present)
4 = a bit larger (plus 10% to plus 25% of the present)
5 = much larger (plus 25% or more of the present)

Scope and Future Prospects for Oregon’s Ecosystem Management Industry 25
The Delphi forecast – the median of panelists’ responses – is as follows.
• Industry Overall: (3.5) the same, plus or minus 10 % of its present amount
• Reforestation: (2) decrease 10% to 25%
• Stand Improvement: (4) increase between 10% and 15%
• Landscape Survey: (3) the same, plus or minus 10%
• Aquatic Survey: (3.5) the same, plus or minus 10%
• Watershed /Habitat Enhancement (heavy equipment): (4) increase plus 10% to 25%
• Watershed /Habitat Enhancement (hand): (4) increase plus 10% to 25%
• Timber Harvesting: (2) decrease minus 10% to 25%
• Fuels Management: (5) increase plus 25% or more
• Wildfire Suppression: (4) increase plus 10% to 25%
• Recreation Management: (4) increase plus 10% to 25%
Our second question was opened-ended. "What possible issues do you foresee that might change these outcomes - producing either more or less work for the ecosystem management industry?"
Although all of the issues identified seem to be contingent upon each other, we can categorize them into three broad headings: Society's Commitment, National Policy, and Funding.
Society’s Commitment. The public / political perception of the value of restoration determines its commitment to these efforts. Lack of tangible, short-term economic results on a wide scale may tend to reinforce a perception that restoration efforts are at the present, simply a financial liability and thereby lessen commitment to these efforts. In this sense, the burden of demonstrating the economic benefits from ecosystem management in a way that people can understand is on the industry. More specifically, unless the industry produces more tangible products, the amount of public support may diminish.
National Policy. Public perceptions and opinion help to direct national policy. Again, the emphasis is on the relationship between economic life and priorities. Given the great amount of federal land in Oregon, changes or waivers in environmental laws to compensate for economic distress or prosperity, or the creation of new environmental mandates are probably the most important factor influencing the industry.
Funding. National Policy determines availability and allocation of federal funds, and establishes a basis for matching funds. The commitment to designating long term funds to specific ecosystem management is decisive to the industry’s growth. Small landowner commitment to ecosystem management may be influenced by the availability of grant funding from a variety of sources. Similarly, the industry may increase or decrease depending on the ability of state and private /public partnership groups to draw out matching funds from government budgets.

26 Scope and Future Prospects for Oregon’s Ecosystem Management Industry
V. Adding It All Up
This study provides preliminary, but strong evidence, that the ecosystem management industry is a significant part of Oregon's economy. It provides more than 16,000 jobs for Oregonians. They are working in more than 600 private firms as well as in public agencies at all levels of government. The total payroll is more than half a billion dollars per year.
The Delphi panel gives a forecast of little or no change in the overall scope of the ecosystem management industry in Oregon. Its members expect declines in reforestation and logging. However, they anticipate growth in watershed/habitat enhancement (both hand and heavy equipment work), stand improvement work, and recreation management, as well as in fire suppression and fuels management work.
We estimate that the growth in these six work classifications will more than counterbalance the declines in the other two areas. Based on current trends, Oregon can expect a modest overall increase of between 2.5 and 5.5 percent over the next ten years in the dollar volume of work and the number of workers in the ecosystem management industry.
VI. Recommendations for Future Action
If it receives appropriate attention and support from relevant agencies, the ecosystem management industry will continue to make an important contribution to the health of Oregon's economy and environment. In that light we have the following recommendations for consideration by OECDD, the Ecosystem Management Task Force, and other state agencies for the further development of the industry.
• Given its importance to Oregon’s overall economy and environment, workforce and contractor training are vital to ensuring that local communities have an active part in the opportunities associated with healthy ecosystem management.
• In the same light, the state should support the creation and maintenance of an industry clearinghouse to link workers, contractors, and land managers.
• State agencies should design and implement specific ecosystem restoration and management incentive programs - a grants and tax incentives program to encourage (both small and large) land owner commitment to ecosystem management.
• State contracting efforts should focus on design of projects that can be awarded to, and support small firms and local communities. Barriers to bidding by small firms should be minimized - e.g. bonding thresholds/requirements and BOLI regulations.

Scope and Future Prospects for Oregon’s Ecosystem Management Industry 27
• A comprehensive inventory should be conducted of all ecosystem management work needed on all lands in Oregon – public and private.
• Data systems should be created and maintained that allow for basic socio-economic monitoring of the industry - e.g. payrolls, wages, firm size and location.
• A public campaign is needed to educate citizens on the importance and contributions of the ecosystem management industry.

28 Scope and Future Prospects for Oregon’s Ecosystem Management Industry
References
BLM (Bureau of Land Management). (1994). Ecosystem Management in the BLM: From Concept to Commitment. U.S. Government Printing Office. U.S. Department of Interior, Publication BLM/SC/GI-94/005+1736.
Caves, R. (1992, Seventh Edition). American Industry: Structure, Conduct, Performance. Englewood Cliffs, New Jersey. Prentice Hall.
Delbecq, A. L., Van de Ven, A. H., & Gustafson, D. H. (1975). Group Techniques for Program Planning - a guide to nominal group and delphi processes. Dallas, Texas. Scott, Foresman and Company.
Dombeck, M. P., Thomas, J. W., Wood, C. A. (1997). Changing Roles and Responsibilities for Federal Land Management Agencies. In Williams, Wood & Dombeck. (Eds.). Watershed Restoration: Principles and Practices. (pp. 135-44). Bethesda: American Fisheries Society.
Fitzsimmons, A. K. (1999). Defending Illusions - Federal Protection of Ecosystems. New York, Oxford. Rowman & Littlefield Publishers Inc.
Franklin, J. F. (1997). Ecosystem Management: An Overview. In Boyce, M. S. & Haney, A. (Eds.). Ecosystem Management - Applications for Sustainable Forest and Wildlife Resources (pp. 21-54). New Haven & London. Yale University Press.
Lackey, R. T. (1999). Radically Contested Assertions in Ecosystem Management. In Corona, P. & Zeide, B. (Eds.). Contested Issues of Ecosystem Management. (pp. 21-35). New York, London, Oxford Food Products Press: An Imprint of The Hayworth Press, Inc.
Oregon Plan for Salmon and Watersheds. 1999 Annual Report.
Thomas, J. W. (1997). Foreword. In Boyce, M. S. & Haney, A. (Eds.). Ecosystem Management - Applications for Sustainable Forest and Wildlife Resources (pp. IX -XI). New Haven & London. Yale University Press.
World Commission on Environment and Development. (1987). Our Common Future. New York: Oxford University Press.
Zeide, B. (1999). Conceptual Issues in Ecosystem Management. In Corona, P. & Zeide, B. (Eds.). Contested Issues of Ecosystem Management. (pp. 1-20). New York, London, Oxford. Food Products Press: An Imprint of The Hayworth Press, Inc.

Scope and Future Prospects for Oregon’s Ecosystem Management Industry 29
Appendix I Interviews
To establish the ecosystem management industry definition, work classifications, and tasks, OEI conducted interviews with:
Monty Bell - Contracting Officer, Forest Service
Bob Heaton - Contracting Officer, Bureau of Land Management
Bill Bentley - Contracting Officer, Bureau of Land Management
Clyde Hooper - Contracting Officer, Siskiyou National Forest
Rick Craiger - Oregon Watershed Enhancement Board
Todd Bucholz - Fisheries Biologist, Forest Service
Mark Labhart - District Forester, Tillamook State Forest, Oregon Dept. of Forestry
Tom Schafer - North Coast Watershed Council
Gayle Sitter - Wildlife Biologist, Bureau of Land Management
Louise Solliday - Governor's Staff
Walt Shearard - Chief Forester, Menasha Company North Bend OR
Mile Wheelock - Forestry Contractor, Merlin OR
Kevin and Debbi Houshour - Forestry Contractors, Myrtle Point OR
Rick Barclay - Forestry Contractor, Applegate OR
David Kornish - Forestry & General Contractor, Bend OR
Jerry Skordahl - Forestry Contractor, Oakridge OR
Lynn Jungwirth - Watershed Research & Training Center, Hayfork CA
Rolf Anderson - retired District Ranger, Forest Service, currently with McKenzie River Trust
Jeff Oveson - Grande Ronde Model Watershed
Carol Johnson - Siuslaw National Forest
Marcus Kaufmann - Sustainable Northwest

30 Scope and Future Prospects for Oregon’s Ecosystem Management Industry
Appendix II Focus Group Participants
The industry definition and work classifications were refined through two focus group meetings. Participating were:
April 19, Salem OR
Jennifer Allen - Oregon Economic and Community Development Dept.
Tom Brumn - Oregon Economic and Community Development Dept.
Darrin Fleener - Oregon Economic and Community Development Dept.
Valerie Folkema - Economic Development Council of Tillamook County
Cecelia Headley - Forestry Contractor
Allison Hensey - Oregon Watershed Enhancement Board
Jess McKinley - Oregon Economic and Community Development Dept.
Charles Spencer - Ecosystem Workforce Program
Beverly Thacker - Oregon Economic and Community Development Dept.
April 26, Pendleton OR
Cass Mosley - University of Florida
Jeff Oveson - Grande Ronde Model Watershed Council
Jeffery Campbell - Program Officer, Ford Foundation
Mollie Owen-Stevenson - Rogue Valley Ecosystem Workforce Training Partnership
Marcus Kaufmann - Sustainable Northwest

Scope and Future Prospects for Oregon’s Ecosystem Management Industry 31
Appendix III Ecosystem Management Work Classifications & Tasks
Work Classifications
• Reforestation • Stand Improvement • Landscape Survey • Aquatic Survey • Watershed / Habitat Enhancement (heavy equipment) • Watershed / Habitat Enhancement (by hand) • Timber Harvesting • Fuels Management • Wildfire Suppression • Recreation Management
Tasks Within Classifications
• Reforestation site preparation tree planting seedling protection survival exams stand exams cone picking scion cutting / grafting vegetation control • Stand Improvement thinning (pre-commercial / commercial) leave tree marking under-burning controlled burning bio-diversity thinning mechanical treatments (slash buster) spraying (hand / aerial)

32 Scope and Future Prospects for Oregon’s Ecosystem Management Industry
• Landscape Survey survey and manage studies (e.g. EA / EIS) NEPA preparation watershed assessments vegetation monitoring wildlife / threatened species plant surveys down woody debris habitat condition wood lot management plans forest land certification fish passage assessments road conditions cultural surveys biological assessments grant writing (for private land owners)
• Aquatic Surveys stream surveys water quality analysis / water quality monitoring estuary analysis fish species identification / counting micro-invertebrate studies
• Watershed / Habitat Enhancement - heavy equipment stream bed / bank bank stabilization (bio-engineered) dikes / tide gates, channel changes wetlands creation / pond construction fish passage structures irrigation systems improvements culvert installation / replacement / removal road decommissioning mechanical fuels treatment (slash buster) habitat thinning / vegetation removal helicopter log placement

Scope and Future Prospects for Oregon’s Ecosystem Management Industry 33
• Watershed / Habitat Enhancement - by hand wildlife tree creation (snags) riparian planting / riparian fencing noxious weed eradication controlled burning mine rehabilitation off-stream watering (spring boxes – solar pumps) manual release (coastal component) mammal / bird nest creation education / outreach workshops
• Timber Harvesting timber cruising unit layout /survey / mapping tree marking logging systems engineering cutting and removal slash treatment erosion control / seeding log scaling
• Fuels Management controlled burning broadcast under burn “natural condition burning” (Native American burning techniques that enhance) slash pile burning brushing / slash piling fire line construction fuels loading surveys public fire wood sources
• Wild Fire Suppression · Recreation Management
fire science / fire behavior site survey / design initial attack campground maintenance mop up trail maintenance fire rehabilitation plans trail construction
erosion control aerial fertilization / seeding

34 Scope and Future Prospects for Oregon’s Ecosystem Management Industry
Appendix IV Standard Industrial Classifications (SIC) included in the Ecosystem Management Industry
(Source: U.S. Dept of Labor)
Private Ownership Sectors
SIC Major Group 08 Forestry
Major Group Structure: This major group includes establishments primarily engaged in the operation of timber tracts, tree farms, forest nurseries, and related activities such as reforestation services and the gathering of gums, barks, balsam needles, maple sap, Spanish moss, and other forest products.
• Industry Group 081: Timber Tracts 0811 Timber Tracts
• Industry Group 083: Forest Nurseries And Gathering Of Forest 0831 Forest Nurseries And Gathering Of Forest Products
• Industry Group 085: Forestry Services 0851 Forestry Services Industry Group 081: Timber Tracts 0811 Timber Tracts: Establishments primarily engaged in the operation of timber tracts or tree farms for the purpose of selling standing timber. Establishments holding timber tracts as real property (not for sale of timber) are classified in Real Estate, Industry 6519; and logging establishments are classified in Manufacturing, Industry 2411. Christmas tree growing Timber tracts Tree farms Industry Group 083: Forest Nurseries And Gathering Of Forest 0831 Forest Nurseries and Gathering of Forest Products: Establishments primarily engaged in growing trees for purposes of reforestation or in gathering forest products. The concentration or distillation of these products, when carried on in the forest, is included in this industry. Balsam needles, gathering of Distillation of gums if carried on at the gum farm Distillation of turpentine and rosin if carried on at the gum farm Forest nurseries

Scope and Future Prospects for Oregon’s Ecosystem Management Industry 35
Gathering of forest products: (e.g., gums, barks, seeds) Ginseng, gathering of Huckleberry greens, gathering of Lac production Maple sap, gathering of Moss, gathering of Pine gum, extraction of Rubber plantations Spanish moss, gathering of Sphagnum moss, gathering of Teaberries, gathering of Tree seed gathering, extracting, and selling Industry Group 085: Forestry Services 0851 Forestry Services: Establishments primarily engaged in performing, on a contract or fee basis, services related to timber production, wood technology, forestry economics and marketing, and other forestry services, not elsewhere classified, such as cruising timber, firefighting, and reforestation.
Cruising timber Estimating timber Fire prevention, forest Firefighting, forest Forest management plans, preparation of Forestry services Pest control, forest Reforestation Timber valuation
SIC Major Group 09 Fishing, Hunting, And Trapping Major Group Structure: This major group includes establishments primarily engaged in commercial fishing (including crabbing, lobstering, clamming, oystering, and the gathering of sponges and seaweed), and the operation of fish hatcheries and fish and game preserves, in commercial hunting and trapping, and in game propagation.
• Industry Group 092: Commercial Fishing 0921 Fish Hatcheries And Preserves
• Industry Group 097: Hunting And Trapping, And Game Propagation 0971 Hunting And Trapping, And Game Propagation

36 Scope and Future Prospects for Oregon’s Ecosystem Management Industry
Industry Group 092: Commercial Fishing
0921 Fish Hatcheries and Preserves Establishments primarily engaged in operating fish hatcheries or preserves. Establishments primarily engaged in the production of fish or frogs under controlled feeding, sanitation, and harvesting procedures are classified in Industry Group 027.
Fish hatcheries Fishing preserves
Industry Group 097: Hunting And Trapping, And Game Propagation 0971 Hunting and Trapping, and Game Propagation Establishments primarily engaged in commercial hunting and trapping, or in the operation of game preserves. Animal trapping, commercial Game management Game preserves Game propagation Game retreat, operation of Hunting carried on as a business enterprise Hunting preserves, operation of Trapping carried on as a business enterprise Wildlife management SIC Major Group 16 Heavy Construction Other Than Building Construction Contractors Major Group Structure: This major group includes general contractors primarily engaged in heavy construction other than building, such as highways and streets, bridges, sewers, railroads, irrigation projects, flood control projects and marine construction, and special trade contractors primarily engaged in activities of a type that are clearly specialized to such heavy construction and are not normally performed on buildings or building-related projects. Specialized activities that are covered here include grading for highways and airport runways; guardrail construction; installation of highway signs; trenching; underwater rock removal; and asphalt and concrete construction of roads, highways, streets and public sidewalks. Establishments primarily engaged in specialized activities that may be performed on buildings or on other heavy construction projects are classified in Major Group 17. These include contractors primarily engaged in painting (including bridge painting and traffic lane painting), electrical work (including work on bridges, power lines, and power plants), and carpentry work.
• 162: Heavy Construction, Except Highway And Street 1629 Heavy Construction, Not Elsewhere Classified

Scope and Future Prospects for Oregon’s Ecosystem Management Industry 37
1629 Heavy Construction, Not Elsewhere Classified: General and special trade contractors primarily engaged in the construction of heavy projects, not elsewhere classified. Blasting, except building demolition-contractors Breakwater construction-general contractors Bridle path construction-general contractors Brush clearing or cutting-contractors Caisson drilling-contractors Canal construction-general contractors Channel construction-general contractors Channel cutoff construction-general contractors Clearing of land-general contractors Cofferdam construction-general contractors Cutting right-of-way-general contractors Dam construction-general contractors Dike construction-general contractors Dock construction-general contractors Drainage project construction-general contractors Dredging-general contractors Earth moving, not connected with building construction-general Flood control project construction-general contractors Harbor construction-general contractors Irrigation projects construction-general contractors Jetty construction-general contractors Land clearing-contractors Land drainage-contractors Land leveling (irrigation)-contractors Land reclamation-contractors Levee construction-general contractors Lock and waterway construction-general contractors Marine construction-general contractors Pier construction-general contractors Pile driving-contractors Pond construction-general contractors Reclamation projects construction-general contractors Reservoir construction-general contractors Revetment construction-general contractors Rock removal, underwater-contractors Ski tow erection-general contractors Submarine rock removal-general contractors Timber removal, underwater-contractors Trail building-general contractors Trailer camp construction-general contractors Trenching-contractors Waste disposal plant construction-general contractors Water power project construction-general contractors

38 Scope and Future Prospects for Oregon’s Ecosystem Management Industry
Water treatment plant construction-general contractors Waterway construction-general contractors Wharf construction-general contractors Major Group 17: Construction Special Trade Contractors Major Group Structure: This major group includes special trade contractors who undertake activities of a type that are specialized either to building construction, including work on mobile homes, or to both building and nonbuilding projects. These activities include painting (including bridge painting and traffic lane painting), electrical work (including work on bridges, power lines, and power plants), carpentry work, plumbing, heating, air-conditioning, roofing, and sheet metal work. Special trade contractors primarily engaged in activities that are clearly of a type specialized to heavy construction, such as grading for highways and airport runways; guardrail construction; installation of highway signs; underwater rock removal; and asphalt and concrete construction of roads, highways, streets, and public sidewalks are classified in Major Group 16. Special trade contractors may work on subcontract from the general contractor, performing only part of the work covered by the general contract, or they may work directly for the owner. Special trade contractors for the most part perform their work at the site of construction, although they also may have shops where they perform work incidental to the job site.
• Industry Group 178: Water Well Drilling 1781 Water Well Drilling
• Industry Group 179: Miscellaneous Special Trade Contractors 1794 Excavation Work Industry Group 178: Water Well Drilling 1781 Water Well Drilling: Special trade contractors primarily engaged in water well drilling. Establishments primarily engaged in drilling oil or gas field water intake wells on a contract or fee basis are classified in Mining, Industry 1381. Drilling water wells-contractors Geothermal drilling-contractors Servicing water wells-contractors Well drilling, water: except oil or gas field water intake-contractors Industry Group 179: Miscellaneous Special Trade Contractors 1794 Excavation Work: Special trade contractors primarily engaged in excavation work and digging foundations, including digging and loading. Contractors in this industry may also perform incidental concrete work.

Scope and Future Prospects for Oregon’s Ecosystem Management Industry 39
Contractors primarily engaged in concrete work are classified in Industry 1771; and those primarily engaged in trenching or in earth moving and land clearing not related to building construction are classified in Major Group 16. Excavation work-contractors Foundation digging (excavation)-contractors Grading: except for highways, streets, and airport runways-contractors SIC Major Group 24 Lumber And Wood Products, Except Furniture Major Group Structure: This major group includes establishments engaged in cutting timber and pulpwood; merchant sawmills, lath mills, shingle mills, cooperage stock mills, planing mills, and plywood mills and veneer mills engaged in producing lumber and wood basic materials; and establishments engaged in manufacturing finished articles made entirely or mainly of wood or related materials. Certain types of establishments producing wood products are classified elsewhere. For example, furniture and office and store fixtures are classified in Major Group 25; musical instruments, toys and playground equipment, and caskets are classified in Major Group 39. Woodworking in connection with construction, in the nature of reconditioning and repair, or performed to individual order, is classified in non-manufacturing industries. Establishments engaged in integrated operations of logging combined with sawmills, pulp mills, or other converting activity, with the logging not separately reported, are classified according to the primary product shipped.
• Industry Group 241: Logging 2411 Logging Industry Group 241: Logging 2411 Logging: Establishments primarily engaged in cutting timber and in producing rough, round, hewn, or riven primary forest or wood raw materials, or in producing wood chips in the field. Independent contractors engaged in estimating or trucking timber, but who perform no cutting operations, are classified in non-manufacturing industries. Establishments primarily engaged in the collection of bark, sap, gum, and other forest products are classified in Forestry, Major Group 08. Bolts, wood: e.g., handle, heading, shingle, stave Burls, wood Driving timber Fuel wood harvesting Last blocks, wood: hewn or riven Logging contractors Logs Mine timbers, hewn Peeler logs Pickets and paling: round or split

40 Scope and Future Prospects for Oregon’s Ecosystem Management Industry
Piling, wood: untreated Pole cutting contractors Poles, wood: untreated Posts, wood: hewn, round, or split Pulpwood camps Pulpwood contractors engaged in cutting Rails fence: round or split Saw logs Skidding logs Stumping for turpentine or powder manufacturing Stumps Timber (product of logging camps) Veneer logs Wood chips, produced in the field Major Group 87: Engineering, Accounting, Research, Management, And Related Services Major Group Structure: This major group includes establishments primarily engaged in providing engineering, architectural, and surveying services; accounting, auditing, and bookkeeping services; research, development, and testing services; and management and public relations services.
• Industry Group 871: Engineering, Architectural, And Surveying 8711 Engineering Services 8712 Architectural Services 8713 Surveying Services
• Industry Group 873: Research, Development, And Testing Services 8731 Commercial Physical And Biological Research 8732 Commercial Economic, Sociological, And Educational Research 8733 Noncommercial Research Organizations Industry Group 871: Engineering, Architectural, And Surveying 8713 Surveying Services: Establishments primarily engaged in providing professional land, water, and aerial surveying services. Engineering services: photogrammetric Photogrammetric engineering Surveying: land, water, and aerial Industry Group 873: Research, Development, And Testing Services

Scope and Future Prospects for Oregon’s Ecosystem Management Industry 41
8731 Commercial Physical and Biological Research: Establishments primarily engaged in commercial physical and biological research and development on a contract or fee basis. Noncommercial research establishments funded by endowments, grants, or contributions are classified in Industry 8733. Separate establishments of aircraft, guided missile, or spacecraft manufacturers primarily engaged in research and development on these products are classified in Manufacturing, Major Group 37. Agricultural research, Biological research commercial Chemical laboratories, commercial research except testing Engineering laboratories, commercial research: except testing Food research commercial Industrial laboratories commercial research: except testing Physical research commercial Research and development physical and biological: commercial 8733 Noncommercial Research Organizations: Establishments primarily engaged in performing noncommercial research into and dissemination of, information for public health, education, or general welfare. Establishments included here operate primarily on funds from endowments, contributions, and grants. The research is frequently contracted out and funded by these establishments. Establishments primarily engaged in commercial physical and biological research are classified in Industry 8731, and those engaged in commercial economic, sociological, and educational research are classified in Industry 8732. Biological research noncommercial Economic research: Educational research noncommercial Medical research noncommercial Physical research, Research noncommercial Scientific research noncommercial Sociological research noncommercial Governmental Industrial Sectors SIC Major Group 95 Administration Of Environmental Quality And Housing Programs Major Group Structure: This major group includes government establishments primarily engaged in the administration of environmental quality and housing programs.
• Industry Group 951: Administration Of Environmental Quality 9511 Air And Water Resource And Solid Waste Management 9512 Land, Mineral, Wildlife, And Forest Conservation

42 Scope and Future Prospects for Oregon’s Ecosystem Management Industry
Industry Group 951: Administration Of Environmental Quality 9511 Air and Water Resource and Solid Waste Management: Government establishments primarily engaged in regulation, planning, protection and conservation of air and water resources; solid waste management; water and air pollution control and prevention; flood control; drainage development, and consumption of water resources; coordination of these activities at intergovernmental levels; research necessary for air pollution abatement and control and conservation of water resources. Water systems are classified in Transportation and Public Utilities, Industry 4941. Sewage and refuse systems and other sanitary services are classified in Transportation and Public Utilities, Industry Group 495. Irrigation systems are classified in Transportation and Public Utilities, Industry 4971. Environmental protection agencies-government Environmental quality and control agencies-government Pollution control agencies-government Sanitary engineering agencies-government Waste management program administration-government Water control and quality agencies-government 9512 Land, Mineral, Wildlife, and Forest Conservation: Government establishments primarily engaged in regulation, supervision and control of land use, including recreational areas; conservation and preservation of natural resources; control of wind and water erosion; and the administration and protection of publicly and privately owned forest lands, including pest control. Planning, management, regulation, and conservation of game, fish, and wildlife populations, including wildlife management areas and field stations; and other matters relating to the protection of fish, game, and wildlife are also classified here. Parks are classified in Services, Industry 7999. Operators of forest property are classified in Forestry, Industry 0811. Operators of game or fish preserves are classified in Major Group 09. Private membership establishments- primarily engaged in promoting conservation of wildlife and protection of animals are classified in Services, Division I. Conservation and stabilization agencies-government Fish and wildlife conservation-government Game and inland fish agencies-government Land management agencies-government Recreational program administration-government Soil conservation services-government Wildlife conservation agencies-government Wind and water erosion control agencies-government

Scope and Future Prospects for Oregon’s Ecosystem Management Industry 43
Appendix V Delphi Panelists
Industry forecasts were developed through a Delphi group process. Panelists were:
Clyde Hooper - Contracting Officer, Siskiyou National Forest
Rick Craiger - Oregon Watershed Enhancement Board
Todd Bucholz - Fisheries Biologist, Forest Service
Gayle Sitter - Wildlife Biologist, Bureau of Land Management
Mile Wheelock - Forestry Contractor, Merlin OR
Debbi Houshour - Forestry Contractor, Myrtle Point OR
Rolf Anderson - retired District Ranger, Forest Service, currently with McKenzie River Trust
Jeff Oveson - Grande Ronde Model Watershed Council