Embed Size (px)
Citation preview
1
The Science of Justice: Seattle Police Department National Justice Database City Report
January 2021
www.policingequity.org

2
…
This page intentionally left blank.
i
…
Kim Shayo Buchanan, J.D., J.S.D Center for Policing Equity
Karen Jarsky, Ph.D. Center for Policing Equity
David Martin Center for Policing Equity
Matthew Graham Center for Policing Equity
Tracy Kawabata Center for Policing Equity
Curtis Skinner, Ph.D. Center for Policing Equity
Sarah Dang Center for Policing Equity
Janie Schutz Center for Policing Equity
Lucy Odigie-Turley, Ph.D. Center for Policing Equity
Nina Crane Center for Policing Equity
Kerry Mulligan, Ph.D. Center for Policing Equity
John Tindel Center for Policing Equity
Hilary Rau, J.D. Center for Policing Equity
Krista Dunn Center for Policing Equity
Phillip Atiba Goff, Ph.D. Center for Policing Equity, Yale University, Principal Investigator, National Justice Database
AUTHORS
i
ii
CENTER FOR POLICING EQUITYThe Center for Policing Equity (CPE) is a research and action think tank, providing leadership in equity through excellence in research. CPE specializes in partnering with law enforcement and communities to diagnose disparities in policing, shed light on police behavior, and answer ques-tions police and communities have asked for years about how to build a healthy relationship.
Michael Burbank Center for Policing Equity
Scarlet Neath Center for Policing Equity
Christopher Mebius Center for Policing Equity
Kimmie Henage Center for Policing Equity
Camille Beckles Center for Policing Equity
Samantha Barlow Center for Policing Equity
Kushagra Patel Center for Policing Equity
Amanda Geller, Ph.D. New York University, Principal Investigator, National Justice Database
Jack Glaser, Ph.D. University of California, Berkeley, Principal Investigator, National Justice Database
Amelia Haviland, Ph.D. Carnegie Mellon University, Principal Investigator, National Justice Database
Tracey Lloyd, Ph.D. Center for Policing Equity
Funding for this study was provided by the National Science Foundation, Google.org, the Players Coalition, Joyce Foundation, Silicon Valley Community Foundation, and Lyda Hill Philanthropies.
ACKNOWLEDGMENTS
ii
1
Authors i
Acknowledgments ii
Executive Summary 2 Recommendations 6
SPD Context and History of Participation in CPE’s National Justice Database 7
National Justice Database Analytic Framework 9
SPD Terry Stops, 2015–2019 11
Are there racial disparities in who is stopped by SPD officers and in the outcomes of these stops? 12
Which types of stops evidence the greatest racial disparities? 16
SPD Use-of-Force Incidents, 2014–2019 19Are there racial disparities in who is subject to use of force and in the types of force used by SPD officers? 21
Which types of use-of-force incidents evidence the greatest racial disparities? 22
Conclusion 24
Bibliography 25
Appendix A. Data Gap Analysis 34
Appendix B. Supplemental Stop Analyses 48
Appendix C. Supplemental Use-of-Force Analyses 49
Appendix D. Mapping SPD Force Types to CPE Force Type Classifications 50
TABLE OF CONTENTS
1
2
Through the National Justice Database (NJD), CPE col-lects policing data to measure fairness and improve po-licing equity, applies a rigorous analytic framework to examine equity in police contact, shares findings with partner agencies, and encourages our partners to share the findings with their communities. We recognize that leadership in police reform cannot alone address all chal-lenges in producing fair and equitable policing, as these challenges result not only from department policy and behavior but also from the broader history of racial in-justice in our country. Nonetheless, we believe change is possible. This report reflects CPE’s commitment to part-nering with agencies like SPD to create systems that use data to illuminate opportunities to change how policing delivers public safety. Our hope is that, informed by the NJD analyses and recommendations, partners can chart a path toward better practices that are consistent with their values and those of the communities they serve.
The project’s overall goals were to (1) examine whether some racial groups in Seattle experience more frequent or burdensome police contact than other groups; (2) iden-tify factors that contribute to any existing racial disparities and the extent to which these factors can be influenced by SPD; and (3) provide recommendations for actions SPD can take to address any identified disparities.
While findings of racial disparities are always reason for concern, they are not necessarily attributable to deci-sions or practices by law enforcement. In other words, observed racial disparities do not necessarily indicate that officers have prejudiced beliefs or that they have even engaged in discriminatory behavior. Crime, pover-ty, institutional neglect, and a host of other factors may drive law enforcement’s disparate contacts with and oth-
er behaviors toward various racial groups. These factors do not mean disparities are not a concern, just that those seeking to address the concern must focus on all of the factors that produce them—including, but not limited to, the policies and behaviors of law enforcement. The NJD framework described in this report examines how factors outside of a department’s control (e.g., poverty and crime rates in a neighborhood) can contribute to observed dis-parities, which helps us infer what portion of a disparity is likely related to officer behavior and/or departmental policies and practices.
Overall, CPE’s analyses revealed reasons for optimism and identified opportunities for improving SPD practices in the service of fair and equitable policing. The key find-ings from the report are highlighted below.
Key Findings• Following a 2012 consent decree with the U.S. De-
partment of Justice, SPD has adopted a number of equity-promoting changes to the department’s poli-cies and practices, including the following:
о 6.220-POL (Voluntary Contacts, Terry Stops & Detentions) requires documentation of all field contacts, Terry stops, and other detentions. Documentation of Terry stops (that is, stops involving reasonable suspicion that a crime has been, is being, or is about to be commit-ted) must be shared with a supervising officer daily, at the end of each shift, for review and approval.
о 8.400-POL (Use of Force Reporting and In-vestigation) requires documentation of all
EXECUTIVE SUMMARYThe Center for Policing Equity (CPE) partnered with the Seattle Police Department (SPD) to analyze the department’s policing practices during the 2014 to 2019 timeframe.
3
applications of any force beyond de minimis force. 1
о 8.100-POL (Deescalation) requires officers to use de-escalation tactics whenever it is safe and feasible.
о POL-5.140 (Bias-Free Policing) explicitly com-mits the department to the equitable provision of policing services. This policy acknowledges that bias can occur at both the individual and the institutional level, and commits the depart-ment to eradicating both discriminatory behav-ior by individual officers and “the long-term impacts of historical inequality and institutional bias…even in the absence of intentional bias” (Section 9).
• SPD has also created a number of community advi-sory groups to respond to community priorities and concerns:
о Since the 1990s, SPD has convened Demo-graphic Advisory Councils of representatives from African American, East African, Filipino, Korean, Latinx, LGBTQ, Muslim/Sikh/Arab, Na-tive American, South East Asian, and citywide communities to identify and respond to com-munity concerns.
о SPD has adopted Micro-Community Policing Plans to address the distinctive needs and priorities of each neighborhood. These plans take a three-pronged approach to combine community engagement, crime data, and po-lice services to generate direct feedback on perceptions of crime and public safety.
The stop data that we received from SPD were con-fined to Terry stops (based on reasonable suspicion of
1 “De minimis force” is defined in 8.050-POL as the use of hands, equipment, control holds, or joint manipulation techniques in ways that do not cause pain or injury and are not reasonably likely to inflict pain or injury.
2 It is important to note there are limitations in the precision of per capita estimates as a sole metric of disparity. For SPD, as for any other police department, it cannot be assumed that persons with whom the department’s officers interact are necessarily residents of the jurisdiction serviced by SPD or of the neighborhood in which an encounter takes place.
involvement in criminal activity), as SPD stops for traffic enforcement and other purposes were recorded on pa-per forms that were not systematically analyzable. All quantitative findings about SPD stops presented in this report describe Terry stop data only.
• Our analyses of Terry stops between 2015 and 2019 found racial disparities in stop rates in every SPD sector across the city.
• Per capita, Native American persons were stopped nearly 9 times as frequently as White persons, and Black persons were stopped over 5 times as frequently as White persons.2
о Native Americans, who make up only 0.5% of the Seattle population, accounted for more than 3% of persons stopped by SPD.
о Black persons, who make up 7% of the Seattle population, accounted for about one third of persons stopped by SPD.
• Once stopped, 29% of Black men and 28% of Na-tive American men were searched for weapons, compared to 21% of White men. Similar racial dis-parities were observed among women stopped by SPD.
о If searched, White men were more likely to be found with a weapon than any other group. Thirty-five percent of White men who were searched for a weapon had one, compared to 19% of Black men and 21% of Native American men who were searched. Similar racial dispar-ities were observed among women searched by SPD.
о White persons were less likely than Native American or Black persons to be arrested at
4
a stop. Once stopped, 28% of Native Ameri-cans and 26% of Black persons were arrested, compared to 23% of stopped White persons.
• Black persons also experienced higher rates of SPD use of force. Native Americans and Pacific Islanders were also overrepresented compared to their share of the population.
о Black persons were subjected to force at a per capita rate more than 7 times the per cap-ita rate for White persons. Each year, Black persons, who make up 7% of the population, made up between 35% and 42% of all people upon whom force was used.
о The overrepresentation of Black, Native Amer-ican, and Pacific Islander individuals was espe-cially pronounced among children and youth.
• Data recording for stops and use of force was not as complete as it could be. Racial data were missing in 9.3% of recorded stops and 18% of re-corded use-of-force incidents. Thus, nearly a fifth of
recorded use-of-force incidents had to be excluded from our analyses. Other fields that were frequently left blank included sector, reason for stop, age, and force type used.
о For both Terry stops and use-of-force inci-dents, location data were not recorded in analyzable form. This precluded regression analyses that might assess the contribution of crime rates, neighborhood income, and racial demographics to observed disparities in SPD policing data.
We commend SPD for their proactive participation in the NJD as a tool for enhancing equity in policing practices and outcomes. We encourage the department to share these results with the people of Seattle to enhance trans-parency and accountability and to support communi-ty partnership in achieving equity and public safety. As this is the first quantitative report CPE has produced for SPD, the analyses in this report should be viewed as a resource for steering reforms and as an initial benchmark against which future progress can be measured.
5
6
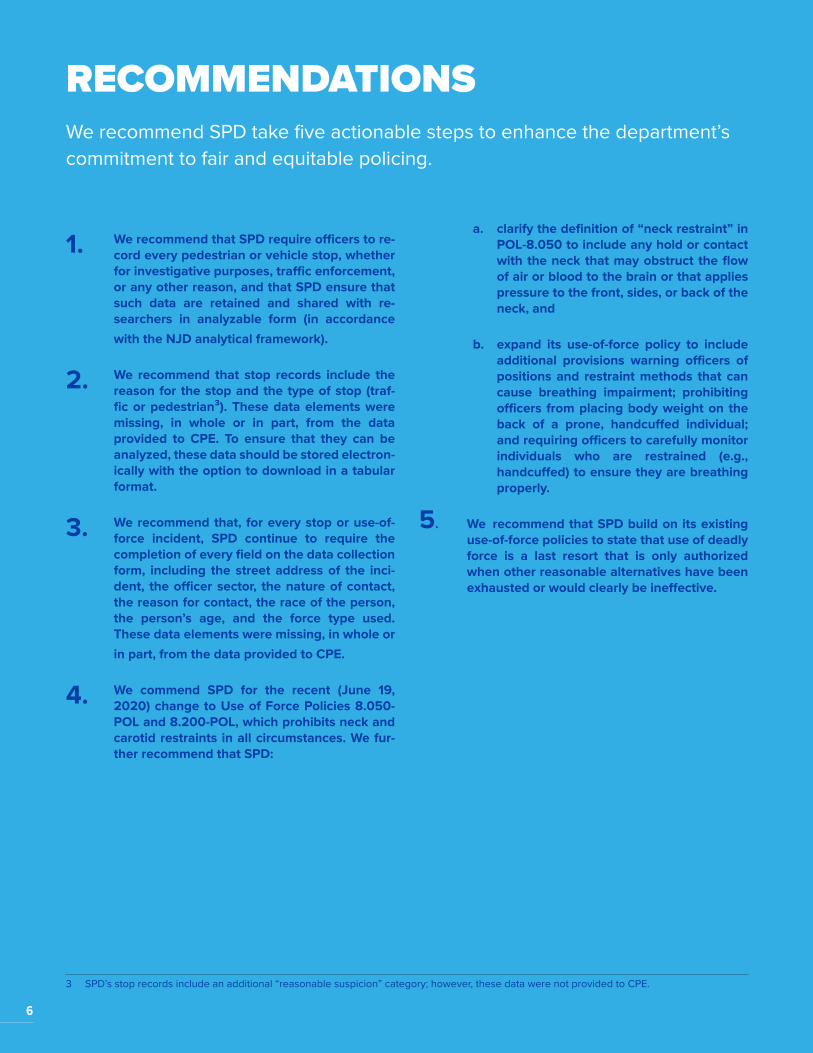
RECOMMENDATIONSWe recommend SPD take five actionable steps to enhance the department’s commitment to fair and equitable policing.
6
1. We recommend that SPD require officers to re-cord every pedestrian or vehicle stop, whether for investigative purposes, traffic enforcement, or any other reason, and that SPD ensure that such data are retained and shared with re-searchers in analyzable form (in accordance with the NJD analytical framework).
2. We recommend that stop records include the reason for the stop and the type of stop (traf-fic or pedestrian3). These data elements were missing, in whole or in part, from the data provided to CPE. To ensure that they can be analyzed, these data should be stored electron-ically with the option to download in a tabular format.
3. We recommend that, for every stop or use-of-force incident, SPD continue to require the completion of every field on the data collection form, including the street address of the inci-dent, the officer sector, the nature of contact, the reason for contact, the race of the person, the person’s age, and the force type used. These data elements were missing, in whole or in part, from the data provided to CPE.
4. We commend SPD for the recent (June 19, 2020) change to Use of Force Policies 8.050-POL and 8.200-POL, which prohibits neck and carotid restraints in all circumstances. We fur-ther recommend that SPD:
3 SPD’s stop records include an additional “reasonable suspicion” category; however, these data were not provided to CPE.
a. clarify the definition of “neck restraint” in POL-8.050 to include any hold or contact with the neck that may obstruct the flow of air or blood to the brain or that applies pressure to the front, sides, or back of the neck, and
b. expand its use-of-force policy to include additional provisions warning officers of positions and restraint methods that can cause breathing impairment; prohibiting officers from placing body weight on the back of a prone, handcuffed individual; and requiring officers to carefully monitor individuals who are restrained (e.g., handcuffed) to ensure they are breathing properly.
5. We recommend that SPD build on its existing use-of-force policies to state that use of deadly force is a last resort that is only authorized when other reasonable alternatives have been exhausted or would clearly be ineffective.
7
SPD’s collaboration with CPE began in 2015. The work was initiated by then-Chief Kathleen O’Toole to produce a report about use of force at demonstrations and to conduct a policy review. (The policy review was shared with Chief O’Toole in April 2017.) SPD’s work with the NJD began in late 2016. Chief O’Toole led the department from June 2014 to December 2017. Chief Carmen Best served as interim chief of police beginning January 1, 2018, and was appointed as SPD’s permanent chief in August 2018. SPD serves a community of approximately 688,245 residents of the city of Seattle,4 as well as the pool of commuters, visitors, and other non-residents who enter the city. The racial composition of Seattle residents is summarized below.5
• 65% White (449,138 residents)• 14% Asian (98,871 residents)• 7.0% Black (47,961 residents)• 6.5% Latinx (44,505 residents)• 5.8% Multiple Races (40,167 residents)• Every other racial group comprises less than
1% of the city population: Native American 0.5% (3,101 residents); Native Hawaiian/Other Pacific
4 Estimates of the Seattle population are drawn from the U.S. Census Bureau’s American Community Survey 5-year estimates for 2017.5 In this report, “racial group” refers to groups described in SPD records by racial categories (e.g., Black, Asian, etc.). When our analyses compare
SPD policing statistics to U.S. Census Bureau data, these identities are mapped onto the following census categories: Hispanic (referred to as Latinx in this report), non-Latinx Asian, non-Latinx Black, non-Latinx Native American, non-Latinx White, and non-Latinx Other Race. To make analysis tractable, in many of the analyses in this report we use a broader category for Other Race, combining the relatively small number of ob-servations in certain racial categories. The census counts “Hispanic” identity as an ethnicity that encompasses persons of all racial backgrounds. The description of Asian, Black, Native American, Latinx, White, and Other Race as “racial” designations does not represent a claim that any such person belongs to a monolithic “race,” or indeed that the category of “race” has objective meaning independent of its social context. Fur-thermore, it should be noted that SPD racial categories describe the officer’s perception of the individual’s race. That perception may or may not match the individual’s own racial identity.
6 As of September 30, 2020, SPD employs 1,310 sworn officers. 7 Seattle Police Department. (n.d.). Department fact sheet. Retrieved April 2, 2020, from https://www.seattle.gov/police/about-us/about-the-de-
partment/department-fact-sheet8 Personal communication with SPD personnel (May 29, 2020).9 In the context of policing, a consent decree is a court-ordered agreement between a municipality and the United States Department of Justice
(DOJ). It is issued in response to a DOJ investigation of what DOJ considers to be a pattern or practice of violation of constitutional rules govern-ing criminal procedural rights, equal protection (that is, nondiscrimination), or both. Typically, a consent decree will set out measures designed to correct and prevent such violations, for example by setting conditions for stops, searches, and use of force by the municipality’s police depart-ment.
Islander 0.4% (2,606 residents); and some “Oth-er” Race 0.3% (1,896 residents)
SPD employs about 1,447 sworn officers,6 224 female and 1,223 male, and another 580 civilian employees.7 As of May 1, 2020, the racial demographics of SPD sworn officers were as follows:8
• 70% White (1,013 officers)• 7.5% Black (109 officers)• 6.8% Asian (99 officers)• 6.0% Latinx (87 officers)• 4.6% Multiracial (67 officers)• 1.5% American Indian/Alaska Native (21 officers)• 1.0% Native Hawaiian/Pacific Islander (14 officers)• 2.6% Not Specified (37 officers)
The City of Seattle entered into a consent decree with the U.S. Department of Justice in 2012.9 Since then, SPD has adopted a number of equity-promot-ing policies and practices, including Demographic Advisory Committees and Micro-Community Policing Plans (described in the Executive Summary, above). SPD has partnered with experts, including participa-
SPD CONTEXT AND HISTORY OF PARTICIPATION IN CPE’S NATIONAL JUSTICE DATABASE
8
tion in the NJD, to continually revise and update the department’s practices to promote fair and equitable policing for all communities. SPD is also subject to civilian oversight, through the Community Police Commission, an Office of Police Accountability, and a fully independent Office of the Inspector General. As required under the consent decree, an independent monitor has issued 10 systematic assessments and seven semiannual reports.
SPD indicated to CPE that transparency is a guiding principle of the department. To achieve this goal, SPD partners with experts in the field, such as CPE. In their discussions with us, SPD leadership reported that the department understands that officers are human and may occasionally make mistakes, but it wants to have systems and training in place to re-duce such occurrences and to understand the impact they have on the community.
9
What does CPE mean by racial disparities? The analyses presented in this report consider two types of racial disparities: disparities in rates of contact and disparities in the outcomes of this con-tact. Racial disparities in contact exist when the proportion of a racial group that experiences police contact is greater than that group’s representation in the community the police department serves. Racial disparities in outcomes exist when the likelihood of a police encounter resulting in a given outcome (e.g., a vehicle stop resulting in an arrest) differs across racial groups.
It is important to note that the analyses of racial out-comes in this report are not intended to imply a statis-tically robust relationship between race and outcomes. The purpose of the analyses is to display outcomes by race and, if there are differences, point to ways agen-cies can investigate those differences further (e.g., through improved data collection protocols).
What does it mean if these analyses find evidence of racial disparities?Disparities in rates of police contact and the out-comes of this contact mean that racial groups in Seattle have different experiences of SPD policing. This is important to measure, as these differences can represent pain points for communities. Dispari-ties do not necessarily indicate that police officers have engaged in biased or discriminatory behavior.
The NJD framework described below examines how factors outside of a department’s control (e.g., pov-erty and crime rates in a neighborhood) contribute to observed disparities, which can be used to infer what portion of a disparity is likely related to officer behavior and/or departmental policies and practices.
What factors might contribute to observed racial disparities?The NJD analytic framework aims to distinguish among five broad types of explanations for racial disparities in policing.
These explanations of disparities in policing are:1. Individual characteristics or behaviors: Attri-
butes or behaviors of individual community mem-bers may lead to a greater risk of interaction with law enforcement. Such behaviors and attitudes may include mental health challenges, homeless-ness, or participation in criminal activity.
2. Community characteristics: Neighborhood conditions, such as poverty or high crime rates, may result in higher rates of interaction with law enforcement.
3. Officer characteristics or behaviors: Some of-ficers may view members of certain communi-ties with a higher level of suspicion, resulting in a disproportionate rate of stops or more punitive disposition after a stop for these individuals.
NATIONAL JUSTICE DATABASE ANALYTIC FRAMEWORKThe analyses presented in this report are intended to identify any racial disparities in SPD Terry stops and use-of-force incidents, to identify potential drivers of these disparities, and to test various explanations of what may be contributing to any identified disparities. The analyses are informed by CPE’s understanding of racial disparities and common sources of disparities in policing, as described below.
10
4. Departmental culture, law, or policy: Insti-tutional policies, practices, or norms may in-crease law enforcement contact with some members of the population more than others. For example, officers may be deployed to patrol some communities. Moreover, police departments may be constrained by feder-al, state, or local laws that may contribute to disparate interactions with individuals and communities.
5. Relationships between communities and police: Mistrust of law enforcement can reduce communi-ty members’ willingness to cooperate with police. Similarly, a sense that communities do not trust or respect police may cause officers to feel un-safe or defensive in encounters with members of those communities.
CPE recognizes that the whole story likely incorporates elements of each of these explanations. The analyses
presented in this report combine police administrative data provided by SPD and census data on the resident population of Seattle to examine overarching trends in policing outcomes by race and police characteristics (Ex-planation 3). It is important to note that we were unable to examine community characteristics (Explanation 2) at this time due to missing data. Please see the Data Gap Anal-ysis included as Appendix A of this report for a summary of the data that CPE requested and received from SPD, and a description of how the availability of requisite data fields impacted the analyses conducted for this report. We commend SPD for their participation in the NJD and their responsiveness to CPE requests for data sharing and information. Our hope is that SPD and the community they serve can leverage the information revealed through these analyses to address the disparities that police de-partments and communities both want to reduce.
11
For the purposes of this report, a stop is defined as a single event in which a person was stopped by SPD. Each stopped individual counts as one stop, regardless of the number of officers or other persons involved in the stop, which aligns with SPD’s approach and standard for data collection. The stop data that we re-ceived from SPD were confined to Terry stops—that is, stops based on “reasonable suspicion” that the person stopped was involved in criminal activity. SPD defines reasonable suspicion as “specific, objective, articulable facts, which, taken together with rational inferences, would create a well-founded suspicion that there is a substantial possibility that a subject has engaged, is engaging or is about to engage in criminal conduct.”10 Although we are advised by SPD that officers also conduct traffic enforcement11 and other types of stops, Terry stops were the only ones for which data were systematically recorded in an analyzable format.
10 Seattle Police Department. (2020). Seattle Police Department Manual, Title 6, Arrest, search and seizure. Retrieved November 10, 2020, from https://www.seattle.gov/police-manual/title-6---arrests-search-and-seizure/6220---voluntary-contacts-terry-stops-and-detention
11 It is important to note that, early in the 2000s, SPD enacted policy requiring the documentation of all official police contact. Within this system, some traffic stops may be recorded as Terry stops (and are included in the data analyzed in this report), while vehicle stops are documented as either infractions, warnings, or traffic contact forms.
12 SPD does collect additional stop narratives, including a record of stop type; however, these additional data were not provided to CPE.13 Since the drafting of this report, SPD has updated data collection policies and now requires that all Terry stops include location data.14 Graphs displaying the count of stops made each quarter and the gender and racial breakdown of these stops are included in Appendix B.
The Terry stop data received from SPD do not differen-tiate between vehicle stops and stops of pedestrians.12 We are advised by SPD that the majority of recorded stops were of persons on foot, and a minority involved motor vehicles. The locations of SPD stops were also not systematically recorded in an analyzable format.13 Data on the sector in which the stop occurred were missing for 26% of observations. In addition, about 35% of observations were missing the reason for the stop. Race data were missing for 3,383 observations (about 9.3% of the total). Stops that were missing rel-evant data had to be dropped from our analyses (but were counted in our totals for all stops).
SPD officers recorded a total of 36,511 Terry stops from March 15, 2015, through August 15, 2019, a period of 4 years and 5 months.14 The analyses presented in this report examine whether there are
Race Year Count PctAsian 2015 266 0.042553Asian 2016 197 0.027884Asian 2017 226 0.032439Asian 2018 237 0.028762Asian 2019 184 0.039957Black 2015 2177 0.348264Black 2016 2412 0.341401Black 2017 2250 0.322951Black 2018 2694 0.326942Black 2019 1433 0.311183Latinx 2015 308 0.049272Latinx 2016 363 0.05138Latinx 2017 356 0.051098Latinx 2018 460 0.055825Latinx 2019 197 0.04278Native American 2015 218 0.034874Native American 2016 267 0.037792Native American 2017 250 0.035883Native American 2018 260 0.031553Native American 2019 139 0.030185White 2015 3239 0.518157White 2016 3805 0.53857 Sum of Pct Column Labels Sum of Pct Column LabelsWhite 2017 3855 0.553323 Row Labels Other Race White Native American Latinx Black Asian Grand Total Row Labels Asian Black Latinx Native American White Other Race Grand TotalWhite 2018 4550 0.552184 2015 1% 52% 3% 5% 35% 4% 1 2019 4% 31% 4% 3% 57% 1% 1White 2019 2623 0.569598 2016 0% 54% 4% 5% 34% 3% 1 2018 3% 33% 6% 3% 55% 0% 1Other Race 2015 43 0.006879 2017 0% 55% 4% 5% 32% 3% 1 2017 3% 32% 5% 4% 55% 0% 1Other Race 2016 21 0.002972 2018 0% 55% 3% 6% 33% 3% 1 2016 3% 34% 5% 4% 54% 0% 1Other Race 2017 30 0.004306 2019 1% 57% 3% 4% 31% 4% 1 2015 4% 35% 5% 3% 52% 1% 1Other Race 2018 39 0.004733 Grand Total 0.025187825 2.731833049 0.170287783 0.250355023 1.65074185 0.171594471 5 Grand Total 0.171594471 1.65074185 0.250355023 0.170287783 2.731833049 0.025187825 5Other Race 2019 29 0.006298
1% 0% 0% 0% 1%
52% 54% 55% 55% 57%
3% 4% 4% 3% 3%5%5% 5% 6% 4%
35% 34% 32% 33% 31%
4% 3% 3% 3% 4%
0%
25%
50%
75%
100%
2015 2016 2017 2018 2019
% o
f Ter
ry S
tops
Asian
Black
Latinx
Native American
White
Other Race
4%
3%
3%
3%
4%
31%
33%
32%
34%
35%
4%
6%
5%
5%
5%
3%
3%
4%
4%
3%
57%
55%
55%
54%
52%
1%
0%
0%
0%
1%
0% 25% 50% 75% 100%
2019
2018
2017
2016
2015
% of Terry Stops
Asian Black Latinx Native American White Other Race
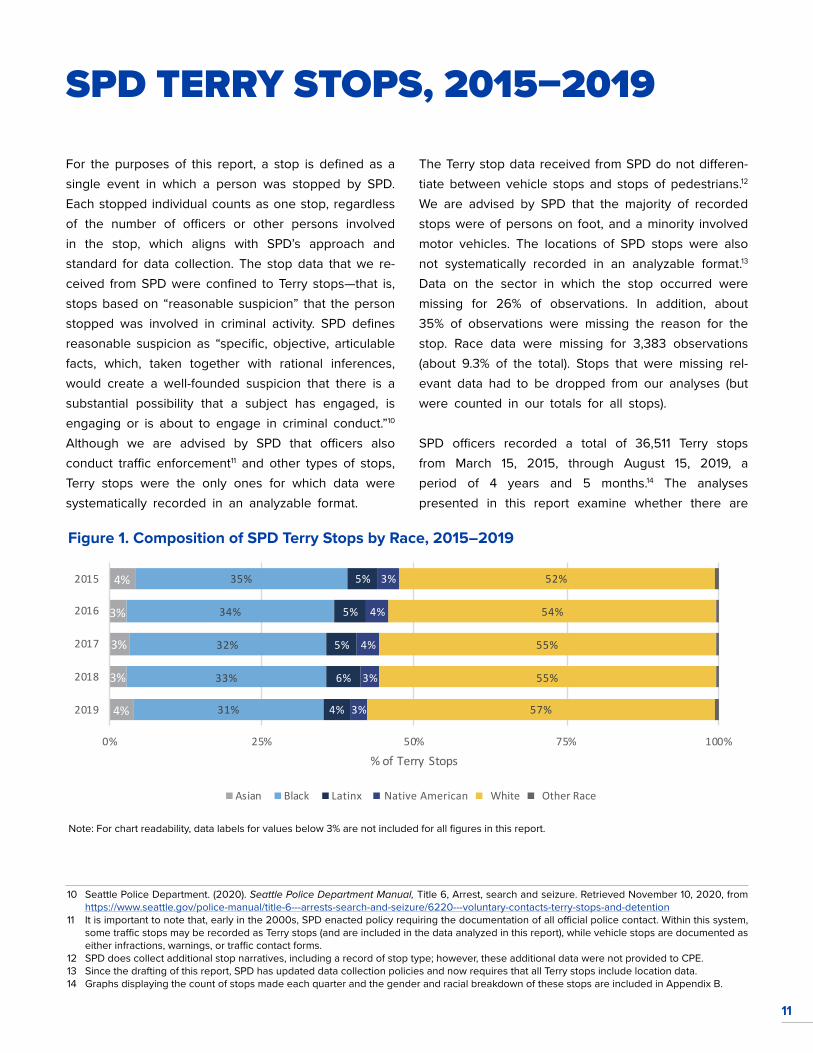
Figure 1. Composition of SPD Terry Stops by Race, 2015–2019
Note: For chart readability, data labels for values below 3% are not included for all figures in this report.
SPD TERRY STOPS, 2015–2019
12
disparities in the frequency and outcomes of stops across racial groups, and whether there is variation in such disparities across different types of stops and SPD sectors.
In each year of the observation period, Black and Native American persons were overrepresented in SPD Terry stops relative to their share of the Seattle population. Although Black persons make up only 7% of the Seattle population, they comprised more than 30% of persons stopped by SPD each year (Figure 1). Native American persons, who make up 0.5% of the Seattle population, comprised more than 3% of SPD Terry stops each year. Persons identified as White, Asian, and Latinx were underrepresented, rel-ative to their share of the population, among persons stopped by SPD.
The Black/White racial disparity in SPD Terry stops declined slightly across the observation period, with the proportion of Black persons declining from 35% to 31% of Terry stops, and the proportion of White persons increasing from 52% to 57% of all Terry
15 This includes individuals identified by the officer as “Native Hawaiian or Pacific Islander” (fewer than 10 stops) or as “Other Race.” These catego-ries were combined because they independently accounted for less than 2% of all vehicle stops.
stops. The Native American/White disparity also de-clined slightly, with the proportion of Native American persons declining from a peak of 4% in 2016 to a nadir of 3% in 2019. In each year of the observation period, the proportion of persons classified by the officer as a race other than Asian, Black, Latinx, Na-tive American, or White was less than 1%.15
Are there racial disparities in who is stopped by SPD officers and in the outcomes of these stops?The analyses presented in this section examine wheth-er there are disparities in the frequency and outcomes of stops across racial groups using analyses of stop rates, stop outcomes, and search and yield rates.
SPD TERRY STOPS RATES
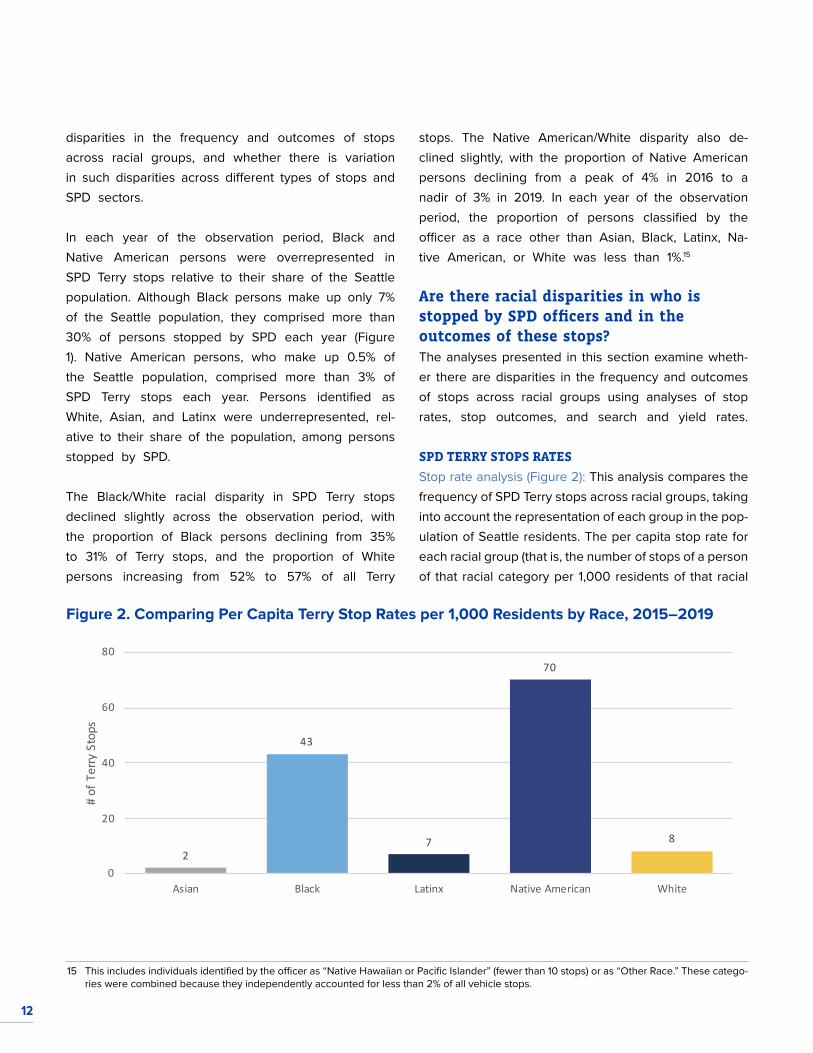
Stop rate analysis (Figure 2): This analysis compares the frequency of SPD Terry stops across racial groups, taking into account the representation of each group in the pop-ulation of Seattle residents. The per capita stop rate for each racial group (that is, the number of stops of a person of that racial category per 1,000 residents of that racial
2
43
7
70
8
0
20
40
60
80
Asian Black Latinx Native American White
# of
Ter
ry S
tops
Figure 2. Comparing Per Capita Terry Stop Rates per 1,000 Residents by Race, 2015–2019
13
category) is calculated by dividing the number of Terrywstops of individuals of a given racial group by the num-ber of city residents in that group.16
Interpreting findings: The stop rate analysis illustrates the relative frequency of Terry stops experienced by Seattle community members in each racial group. High-er per capita stop rates for a given group indicate that group is experiencing a greater burden of Terry stops compared to other groups.
We note that there are limitations in the precision of per capita estimates as a sole metric of disparity. For SPD, as for any other police department, it cannot be as-sumed that persons with whom officers interact are nec-essarily residents of the jurisdiction serviced by the de-partment or of the neighborhood in which an encounter takes place. Nevertheless, jurisdiction-wide data appear to provide the best available estimates of the charac-teristics of persons interacting with the police. (Neigh-borhood demographic data can also be used, but the lack of precise geolocation data in the SPD Terry stop data shared with CPE precludes location-based analy-
16 We do not produce per capita analyses for individuals included in the “Other Race” category, as we cannot accurately estimate the benchmark population for this aggregate category.
ses.) We select municipal demographic data as the most straightforward and complete proxy of the community served by SPD, but recognize that this does not take into account, for example, whether miles walked differ between racial groups. It is not possible to precisely es-timate what the racial distribution of police encounters might be if these encounters accurately reflected the relative population sizes of the different racial groups walking and driving in SPD’s jurisdiction.
As shown earlier, in Figure 1, persons identified as Black or Native American experienced a higher share of SPD Terry stops compared to their share of the population. The relative burden of Terry stops can also be under-stood by comparing the number of SPD stops for each racial group to the number of Seattle residents from that group. Latinx persons were stopped at a per capita rate similar to that of White persons, and Asian persons were stopped at a rate lower than that of White per-sons. Again, however, Black and Native American indi-viduals experienced the heaviest burden of SPD Terry stops. In Seattle, Native American persons experienced per capita stops at a rate 8.8 times as high as the rate
26%
23%
28%
24%
26%
28%
0%
1%
0%
0%
1%
33%
39%
34%
37%
34%
36%
40%
36%
35%
38%
38%
34%
2%
2%
2%
1%
2%
1%
0% 25% 50% 75% 100%
Other Race
White
Native American
Latinx
Black
Asian
% of Terry Stops
Arrested Cited, Not Arrested Field Contact Offense Report Referred for Prosecution
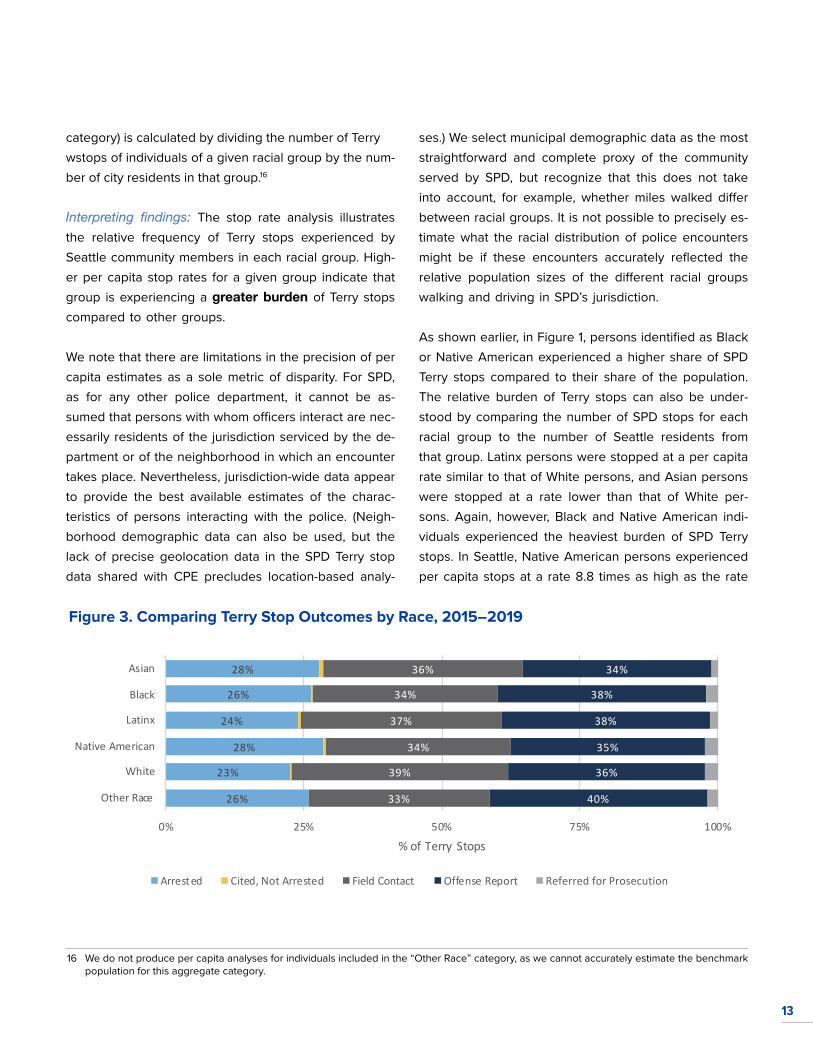
Figure 3. Comparing Terry Stop Outcomes by Race, 2015–2019
14
for White persons; Black persons experienced stops at 5.4 times the rate of White persons.
During the 4 years and 5 months of the observation period, SPD conducted 1,134 stops of Native American persons, and there are 3,101 Native American residents in Seattle. Along the same lines, SPD conducted 10,966 Terry stops of Black persons, and Seattle has 47,961 Black residents. By contrast, over the same period, SPD conducted 18,072 Terry stops of White persons, and there are 449,138 White residents in Seattle.
TERRY STOP OUTCOMES
Stop outcomes analysis (Figure 3): This analysis ex-amines the percentage of Terry stops that end in each stop outcome (e.g., arrested, cited, or released without citation or arrest) for each racial group. The goal of this analysis is to gauge the degree to which different groups are subject to similar levels of scru-tiny and treatment.
Interpreting findings: The stop outcomes analysis is in-terpreted alongside the stop rate analysis. If the stop rate analysis finds a particular racial group is stopped less frequently, and the stop outcomes analysis finds these stops are more likely to result in the individual being released, this may suggest the group is experi-encing greater leniency in discretionary enforcement
decisions. When the stop rate analysis finds a particular racial group is stopped more frequently, and the stop outcomes analysis finds that these stops are more likely to result in the individual being released, this may sug-gest individuals in this group are experiencing a great-er burden of stops relative to other groups and may be subject to greater scrutiny than other groups.
Most people (75%) who experienced SPD Terry stops during the observation period were released without citation or arrest, while 24% resulted in arrest. As might be expected in a dataset restricted to Terry stops, ci-tations were rare: Fewer than 0.4% of all Terry stops recorded by SPD resulted in any citation.
When a stopped person was released without being arrested or receiving a citation, three outcomes were possible. In a plurality of such encounters, the officer either recorded a field contact (37% of all Terry stops) or completed an offense report (36% of all Terry stops). In 2.1% of all Terry stops, the officer referred the stopped person for prosecution without making an immediate arrest.
Of all racial groups stopped by SPD, White persons appeared to be treated more leniently than any oth-er group. They were stopped less frequently per cap-
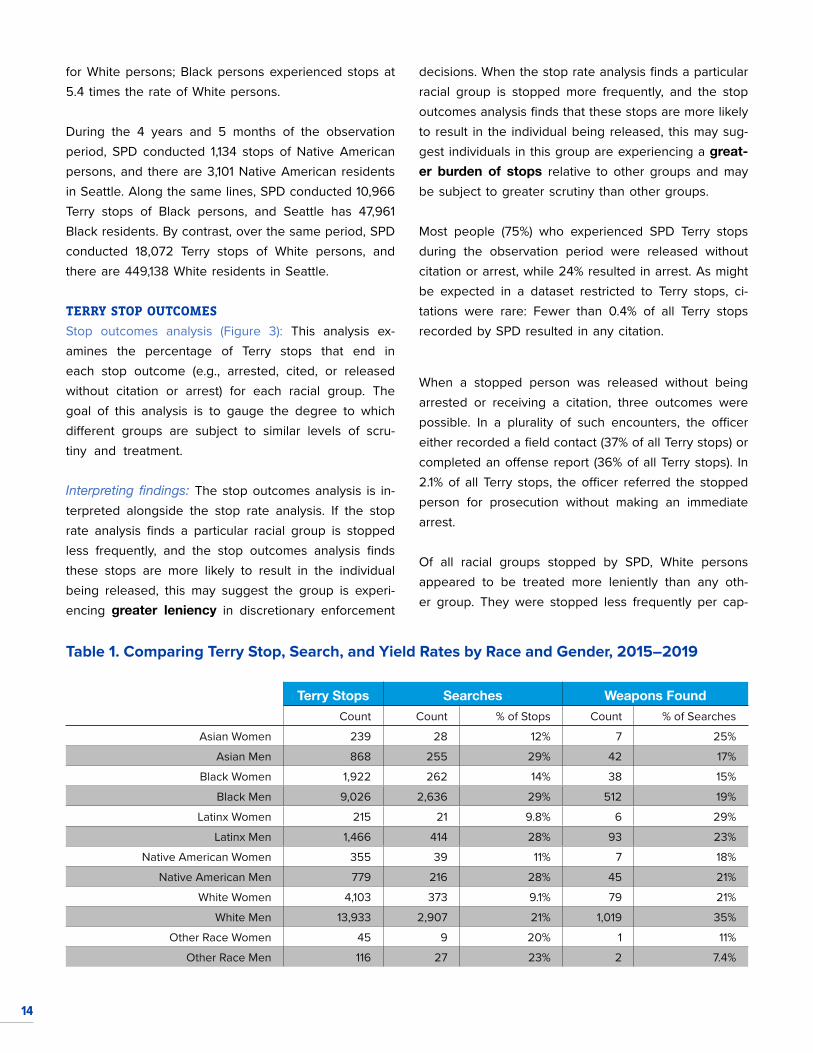
Table 1. Comparing Terry Stop, Search, and Yield Rates by Race and Gender, 2015–2019
Terry Stops Searches Weapons FoundCount Count % of Stops Count % of Searches
Asian Women 239 28 12% 7 25%
Asian Men 868 255 29% 42 17%
Black Women 1,922 262 14% 38 15%
Black Men 9,026 2,636 29% 512 19%
Latinx Women 215 21 9.8% 6 29%
Latinx Men 1,466 414 28% 93 23%
Native American Women 355 39 11% 7 18%
Native American Men 779 216 28% 45 21%
White Women 4,103 373 9.1% 79 21%
White Men 13,933 2,907 21% 1,019 35%
Other Race Women 45 9 20% 1 11%
Other Race Men 116 27 23% 2 7.4%
15
ita than Black or Native American persons (see Figure 2); once stopped, they were least likely to be arrested (23%) and most likely to be released without citation or arrest (77%; Figure 3).
Native American persons, who experienced a particu-larly heavy burden of Terry stops (see Figure 2), were also more likely to experience arrest once they were stopped. They were arrested more frequently than per-sons from most other racial groups (28%). Asian indi-viduals were arrested at the same rate once stopped, though they were stopped less frequently per capita than any other group.
Black persons also experienced a heavy burden of Terry stops as well as a high arrest rate. They were stopped at much higher rates than White persons and, once stopped, were arrested at an above-average rate (26%).Latinx persons experienced similar treatment to White persons: They were stopped at a slightly lower per cap-ita frequency than White persons, and were only slightly more likely to be arrested at a stop (24%).
SEARCH AND YIELD RATES
Search and yield rate analysis (Table 1): This analysis compares the percentage of persons stopped at Terry stops who are searched to the share of these searches that result in the discovery of weapons for each racial
and gender group. Like the Terry stop outcomes analy-sis above, this analysis is intended to evaluate the de-gree to which different groups may be subject to similar levels of scrutiny and treatment.
Interpreting findings: The search and yield rate analysis examines whether the likelihood of a Terry stop result-ing in a weapons search differs by racial and gender group, and whether these differences in search rates may be explained by the likelihood of possessing a weapon. When the analysis reveals that a given group is searched more frequently and that the searches are less likely to result in the discovery of a weapon, this may suggest either that SPD officers’ reasonable sus-picion of illegal activity or weapons possession is less likely to be accurate for the group or that some officers have a lower threshold in making the decision to search members of that group.
SPD policy 6.220-POL-2 (6) permits searches at Terry stops “only if [the officer has] an articulable and reasonable safety concern that the person is armed and presently dangerous.” It permits search-es for “weapons or other items which pose a dan-ger to those nearby,” but not for other purposes. An overwhelming majority of SPD Terry stops (79%) and searches (90%) involved men. Of persons searched by
97%
94%
94%
96%
96%
92%
4%
4%
3%
0% 2%
1%
1%
1%
1%
0% 25% 50% 75% 100%
Other Race
White
Native American
Latinx
Black
Asian
% of Terry Stops
Investigatory Warrant Public Intoxication/Mental I llness Loitering/Vagrancy Other
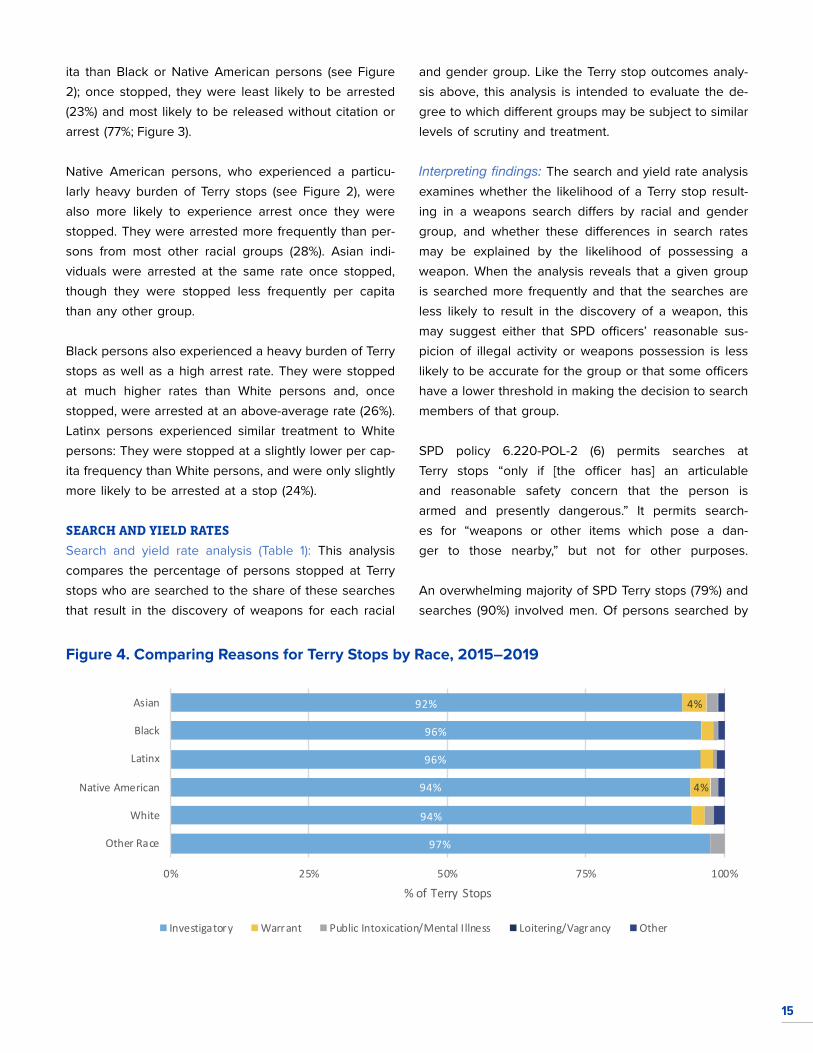
Figure 4. Comparing Reasons for Terry Stops by Race, 2015–2019
16
SPD and found with weapons, 93% were men. Women comprised only about one fifth of all stops, and they were fewer than 10% of all persons who were searched or found with weapons. Because the largest numbers of stops, searches, and weapons found involved men, this discussion focuses primarily on racial disparities in the rates at which men were stopped, searched, or found with weapons.
Among men, the widest racial disparities in search and yield rates were between White men and all other groups of men stopped by SPD (Table1). White men, who were the least likely to be stopped and the least likely to be arrested at a stop (see Figures 2 and 3), were also much less likely than men of any other group to be searched by SPD. At the same time, White men who were searched were much more likely than their non-White counterparts to be found with a weapon.
Only 21% of White men who were stopped experienced a search, a rate much lower than that of any non-White group that was stopped in large numbers: At SPD stops, 28% of Native American men, 28% of Latinx men, 29% of Black men, and 29% of Asian men were searched.
The yield rate for searches of White men was much higher than for any other group of persons searched by SPD: More than one third of searches conducted upon White men (35%) uncovered a weapon, compared to 23% for searches of Latinx men, 21% of searches of Native American men, 19% of searches of Black men, and 17% of searches of Asian men.
That is, White men were searched less frequently than men from any non-White group, even though more than a third of searches of White men turned up weapons. By contrast, more than 70% of all searches of non-White men were fruitless. The elevated rates at which Black and Native American men were stopped and searched, then, are not explained by any elevated likelihood that they would possess weapons.
For both women and men, those who experienced the most burdensome per capita stop rates and the great-
est likelihood of arrest—Native American and Black persons—were also among those most likely to be searched. At the same time, searches of Native Amer-ican and Black persons were among the least likely to uncover weapons. Searches of Asian men, though infre-quent relative to their share of the population, were the least likely to uncover weapons: Once stopped, 29% of Asian men were searched, and only 17% of searches of Asian men uncovered any weapon.
The results of our search and yield rate analysis are con-sistent with the possibility that SPD officers’ suspicion of weapons possession is less likely to be accurate for Black, Native American, or Asian persons, or that some officers use a lower threshold in making the decision to search Black, Native American, or Asian persons.
Racial disparities were broadly similar among women. Of the five largest racial groups—White, Black, Asian, Latinx, and Native American—Black women were the most likely to be searched and the least likely to be found with weapons. White, Latinx, and Asian women were less likely to be searched than Black women were, and searches of these women were more likely than searches of Black (or Native American) women to reveal weapons.
Which types of stops evidence the greatest racial disparities?
STOP REASON
Stop reason analysis (Figure 4): This analysis examines how the composition of reasons given for Terry stops varies across racial groups. The goal of this analysis is to reveal whether specific types of Terry stops may be driving racial disparities. As noted above, 35% of stop records did not contain a reason for the stop. These observations could not be used in this analysis.
Interpreting findings: A stop reason analysis that reveals a larger proportion of a specific stop reason among a racial group relative to other groups indicates that stops of that type may be driving any observed disparities in the stop rates for that racial group.
17
SPD policy 6.220-POL-2(1) “prohibits Terry stops when an officer lacks reasonable suspicion that a suspect has been, is, or is about to engage in the commission of a crime.” Because all the stops analyzed in this report are recorded as Terry stops, this rule applied to all such stops.
For every racial group, more than 90% of SPD stops were logged as being for investigatory purposes. This percentage ranged from 92% for Asians, to 94% for White and Native American persons, to 96% for Black and Latinx persons, and 97% for persons in the Other Race category.
For most racial groups (other than the catchall “Other” category), the second most common reason that a per-son might be stopped by an SPD officer was that the
person had an outstanding warrant. About 4% of Asian and Native American persons who were stopped—and about 2% of White, Black, and Latinx persons who were stopped—were stopped for this reason.The third most common reason recorded for an SPD Terry stop was that the person appeared intoxicated or appeared to be experiencing an episode of men-tal illness. About 2% of White and Asian persons who were stopped, about 1% of Native American persons who were stopped, and fewer than 1% of Black and Latinx persons who were stopped were stopped for this reason.
SPD SECTOR
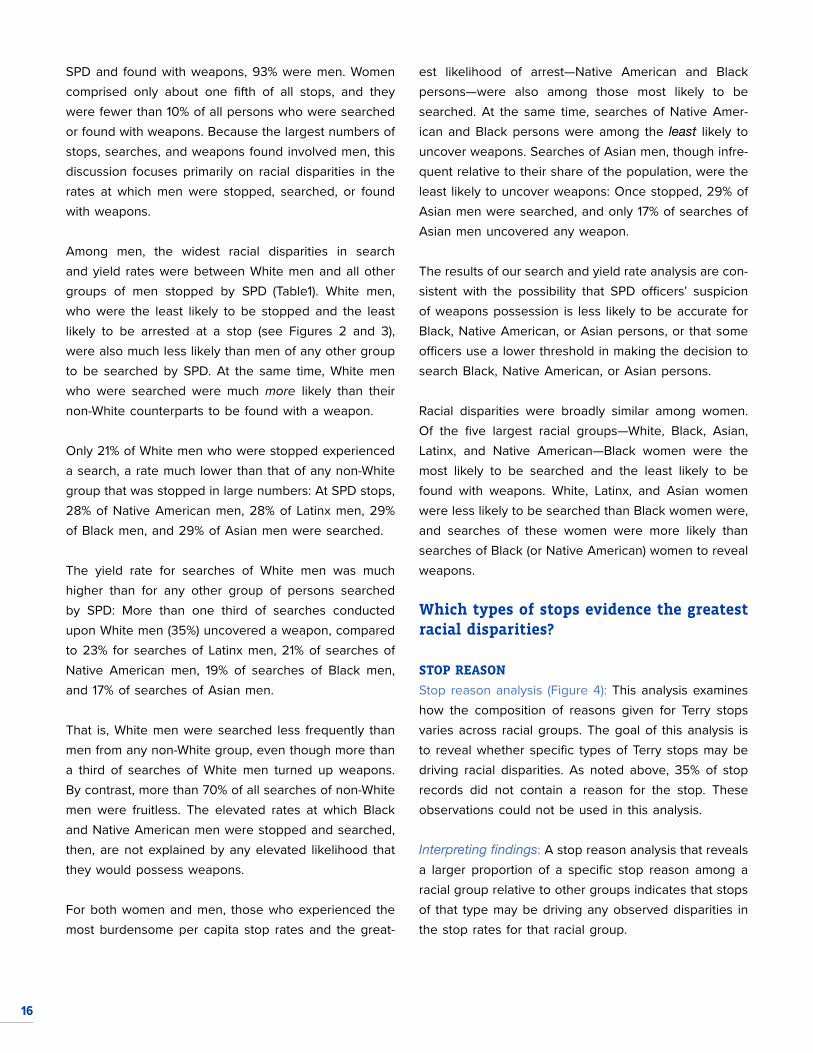
Work unit (sector) analysis (Figure 5): This analysis shows the distribution of Terry stops during the 5-year period by racial group and police department work
9%
5%
7%
28%22%
39%57%
23%27%28%
64%31%
55%31%30%
16%44%
27%32%
34%
5%
6%5%
5%12%
8%
5%6%
5% 6%
61%68%
53%33%
65%62%62%
18%50%
28%59%60%
75%39%
63%54%
57%
0%1%0%1%1%0%1%1%0%0%1%1%0%1%1%0%1%
0% 25% 50% 75% 100%
WQCGJ
OUSFRDLBKNME
% of Terry Stops
Seco
tr
Asian Black Latinx Native American White Other Race
Figure 5. Comparing the Racial Composition of Terry Stops by SPD Sector, 2015–2019
Note: For chart readability, data labels for values below 5% are not included in this figure.
18
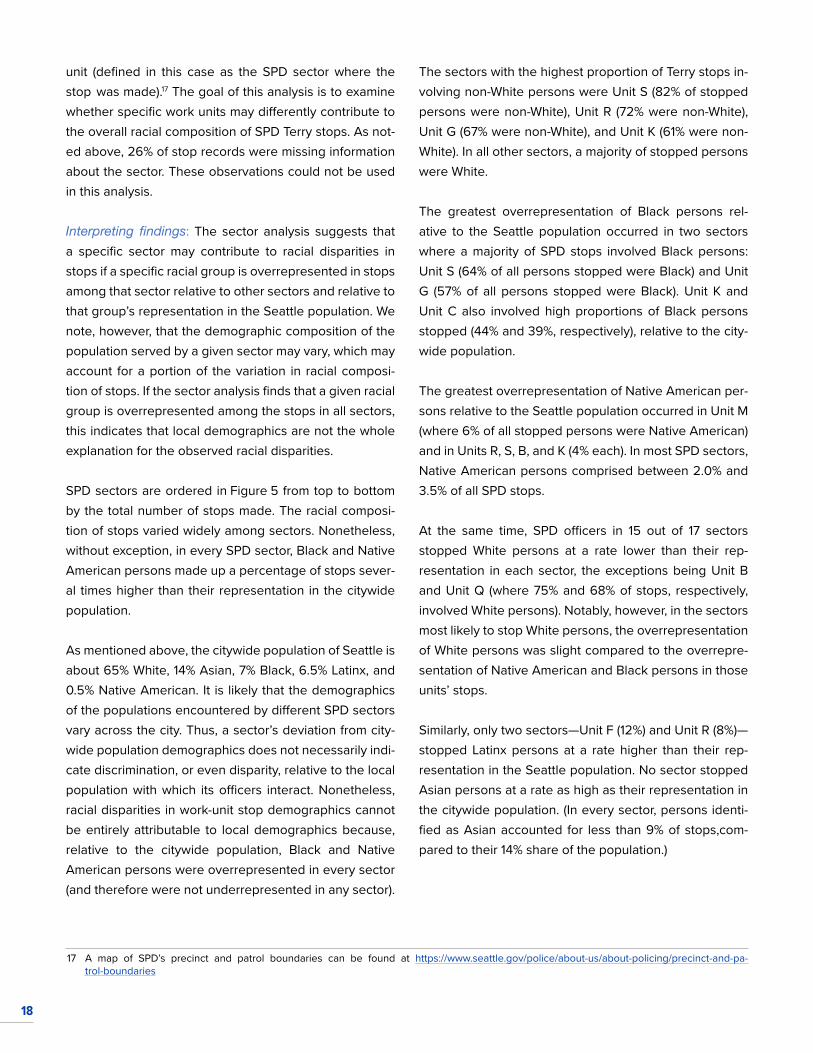
unit (defined in this case as the SPD sector where the stop was made).17 The goal of this analysis is to examine whether specific work units may differently contribute to the overall racial composition of SPD Terry stops. As not-ed above, 26% of stop records were missing information about the sector. These observations could not be used in this analysis.
Interpreting findings: The sector analysis suggests that a specific sector may contribute to racial disparities in stops if a specific racial group is overrepresented in stops among that sector relative to other sectors and relative to that group’s representation in the Seattle population. We note, however, that the demographic composition of the population served by a given sector may vary, which may account for a portion of the variation in racial composi-tion of stops. If the sector analysis finds that a given racial group is overrepresented among the stops in all sectors, this indicates that local demographics are not the whole explanation for the observed racial disparities.
SPD sectors are ordered in Figure 5 from top to bottom by the total number of stops made. The racial composi-tion of stops varied widely among sectors. Nonetheless, without exception, in every SPD sector, Black and Native American persons made up a percentage of stops sever-al times higher than their representation in the citywide population.
As mentioned above, the citywide population of Seattle is about 65% White, 14% Asian, 7% Black, 6.5% Latinx, and 0.5% Native American. It is likely that the demographics of the populations encountered by different SPD sectors vary across the city. Thus, a sector’s deviation from city-wide population demographics does not necessarily indi-cate discrimination, or even disparity, relative to the local population with which its officers interact. Nonetheless, racial disparities in work-unit stop demographics cannot be entirely attributable to local demographics because, relative to the citywide population, Black and Native American persons were overrepresented in every sector (and therefore were not underrepresented in any sector).
17 A map of SPD’s precinct and patrol boundaries can be found at https://www.seattle.gov/police/about-us/about-policing/precinct-and-pa-trol-boundaries
The sectors with the highest proportion of Terry stops in-volving non-White persons were Unit S (82% of stopped persons were non-White), Unit R (72% were non-White), Unit G (67% were non-White), and Unit K (61% were non-White). In all other sectors, a majority of stopped persons were White.
The greatest overrepresentation of Black persons rel-ative to the Seattle population occurred in two sectors where a majority of SPD stops involved Black persons: Unit S (64% of all persons stopped were Black) and Unit G (57% of all persons stopped were Black). Unit K and Unit C also involved high proportions of Black persons stopped (44% and 39%, respectively), relative to the city-wide population.
The greatest overrepresentation of Native American per-sons relative to the Seattle population occurred in Unit M (where 6% of all stopped persons were Native American) and in Units R, S, B, and K (4% each). In most SPD sectors, Native American persons comprised between 2.0% and 3.5% of all SPD stops.
At the same time, SPD officers in 15 out of 17 sectors stopped White persons at a rate lower than their rep-resentation in each sector, the exceptions being Unit B and Unit Q (where 75% and 68% of stops, respectively, involved White persons). Notably, however, in the sectors most likely to stop White persons, the overrepresentation of White persons was slight compared to the overrepre-sentation of Native American and Black persons in those units’ stops.
Similarly, only two sectors—Unit F (12%) and Unit R (8%)—stopped Latinx persons at a rate higher than their rep-resentation in the Seattle population. No sector stopped Asian persons at a rate as high as their representation in the citywide population. (In every sector, persons identi-fied as Asian accounted for less than 9% of stops,com-pared to their 14% share of the population.)
19
For the purpose of this report, a use-of-force incident is defined as a use of force against an individual commu-nity member, regardless of the type(s) of force used or the number of officers involved. A single incident, then, could include multiple force types, multiple applications of force, or multiple officers. SPD policy 8.400-POL-2 requires completion of a use-of-force report for every incident in which an SPD officer uses force unless the force used is de minimis. De minimis force is defined as “Physical interaction meant to separate, guide, and/or control without the use of control techniques that are intended to or are reasonably likely to cause any pain or injury.”
SPD officers recorded a total of 4,827 use-of-force inci-dents during the approximately 5½ years from January 27, 2014, through August 3, 2019.18 We have excluded from these analyses 24 SPD use-of-force records where the only force type recorded was “Verbal Commands,” as CPE analyses do not count verbal commands as force. For the same reason, we also excluded 1,969
18 A graph displaying the number of use-of-force incidents each quarter is included in Appendix C.
incidents in which the only force type used was “Hand-cuffing” with no injury reported. In addition, data on the type of force used were missing from 359 reports of use of force, and these observations are excluded from the analyses.
The analyses presented in this section examine whether there are disparities in the frequency of use-of-force incidents across racial groups or in the types of force used. Ordinarily, our use-of-force analyses would also include a multilevel regression analysis assessing how various factors contribute to the observed disparities in the likelihood of a use-of-force incident. Because we did not receive analyzable location data for use-of-force incidents recorded by SPD, however, we were unable to conduct this analysis.
Our analyses of racial disparity in use-of-force incidents recorded by SPD were complicated by the high propor-tion of incidents in which the race of the person was not recorded. Of 4,827 use-of-force incidents recorded
SPD USE-OF-FORCE INCIDENTS, 2014–2019
4%
6%
5%
4%
6%
35%
38%
41%
42%
42%
39%
6%
5%
5%
4%
7%
7%
52%
49%
46%
48%
43%
49%
3%
3%
0% 25% 50% 75% 100%
2019
2018
2017
2016
2015
2014
% of Use-of-Force Incidents
Asian Black Latinx White Other Race
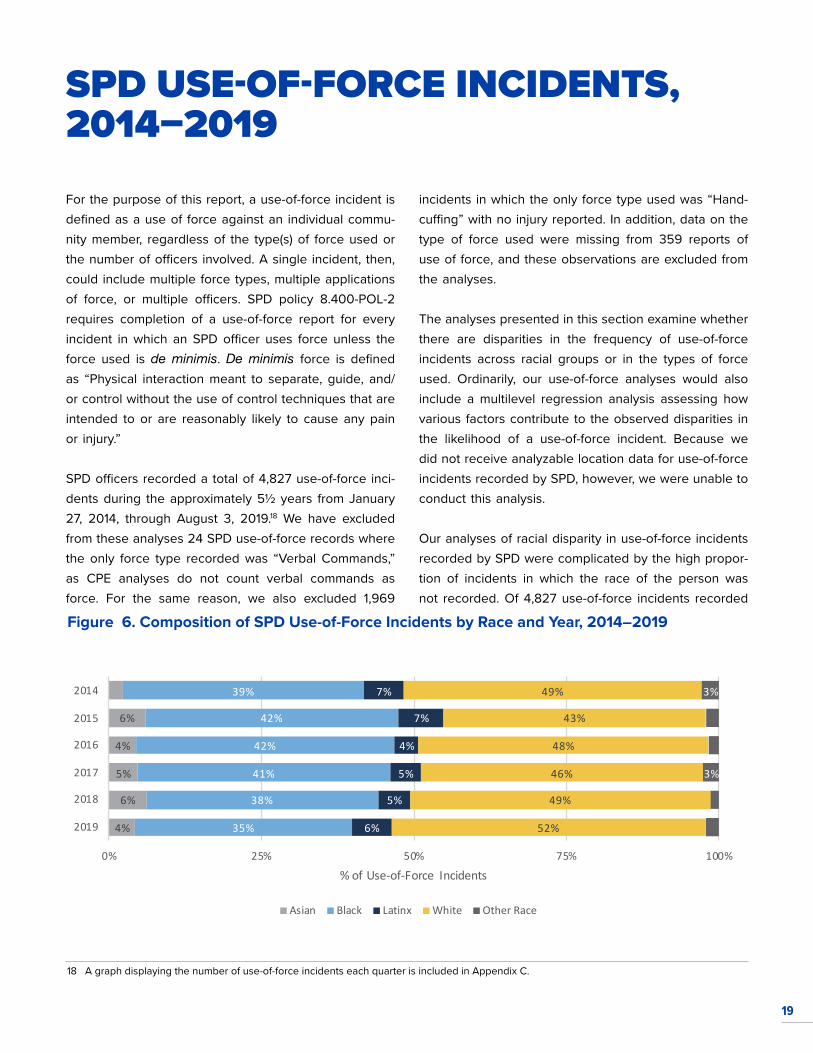
Figure 6. Composition of SPD Use-of-Force Incidents by Race and Year, 2014–2019
20
by SPD, some 859 incidents were missing racial data. That is, in 18% of all use-of-force incidents reported by SPD, officers did not record the race of the individual subjected to force. All racial data presented in this sec-tion, then, are restricted to the 3,968 incidents in which racial data were recorded.
The racial composition of individuals subject to SPD use of force over the 5½-year observation period is illustrated below.
As was observed with SPD stops, Black persons were overrepresented, relative to the Seattle population, among persons who had SPD force used upon them (Figure 6). In each year of the observation period, Black persons, who comprise 7% of the citywide population, accounted for between 35% and 42% of all people upon whom force was used.
Incidents in which the person subjected to force was identified as Native American (N = 52) or Pacific Island-er (N = 31) accounted for less than 2% of the total, and are combined in the Other Race category. In light of the disparities observed in SPD stops, however, it is worth noting that the proportion of Native American persons subjected to force (1.3% of all use-of-force incidents for which racial data were recorded) was more than twice their representation in the Seattle population (0.5%). Pa-cific Islanders were the subjects of 0.8% of incidents in which the race of the person was recorded, which is approximately double their representation in the pop-
ulation (0.4% of the Seattle population is identified as Native Hawaiian/Other Pacific Islander).
Consistent with patterns observed in stops, White, Lat-inx, and Asian persons were underrepresented, relative to population, in use-of-force incidents. White persons comprise nearly two thirds of the population of the city of Seattle, for example, but were the subjects of fewer than half of all use-of-force incidents recorded by SPD. In addition to the 859 SPD use-of-force incidents for which race was not recorded, 395 incident records were also missing data on the age of the person who was subjected to force. As such, the findings presented in Figure 7 exclude these incidents.
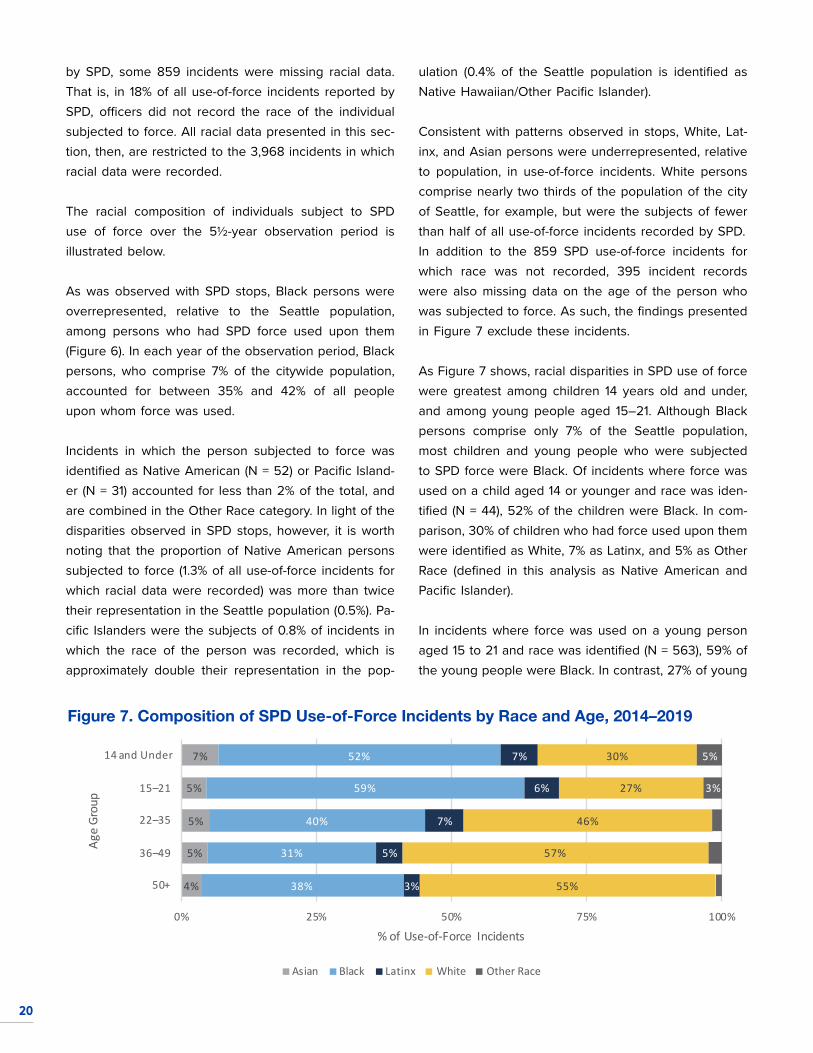
As Figure 7 shows, racial disparities in SPD use of force were greatest among children 14 years old and under, and among young people aged 15–21. Although Black persons comprise only 7% of the Seattle population, most children and young people who were subjected to SPD force were Black. Of incidents where force was used on a child aged 14 or younger and race was iden-tified (N = 44), 52% of the children were Black. In com-parison, 30% of children who had force used upon them were identified as White, 7% as Latinx, and 5% as Other Race (defined in this analysis as Native American and Pacific Islander).
In incidents where force was used on a young person aged 15 to 21 and race was identified (N = 563), 59% of the young people were Black. In contrast, 27% of young
4%
5%
5%
5%
7%
38%
31%
40%
59%
52%
3%
5%
7%
6%
7%
55%
57%
46%
27%
30%
3%
5%
0% 25% 50% 75% 100%
50+
36–49
22–35
15–21
14 and Under
% of Use-of-Force Incidents
Age
Grou
p
Asian Black Latinx White Other Race
Figure 7. Composition of SPD Use-of-Force Incidents by Race and Age, 2014–2019
21
people who had force used on them were identified as White, 6% as Latinx, and 3% as Other Race.
In every age group, Black persons were subjected to force at a rate several times their representation in the Seattle population. Their overrepresentation was small-est in the 36- to 49-year-old age group, where they comprised 31% of persons subjected to SPD force. Are there racial disparities in who is subject to use of force and in the types of force used by SPD officers?The findings presented in this section examine the de-gree to which there are disparities in the frequency of use-of-force incidents and types of force across racial groups. Here we present analyses of incident rates and force types. A multilevel regression analysis examining whether common explanations for disparities—including community characteristics and crime rates—are contrib-uting to the observed disparities could not be conduct-ed because SPD use-of-force records did not contain usable location data.
USE-OF-FORCE INCIDENT RATES
Incident rate analysis (Figure 8): This analysis compares the frequency of use-of-force incidents across racial groups, taking into account the representation of each
group in the population of residents of Seattle. The per capita use-of-force incident rate for each racial group is calculated by dividing the number of incidents for the given racial group by the number of city residents in that group.
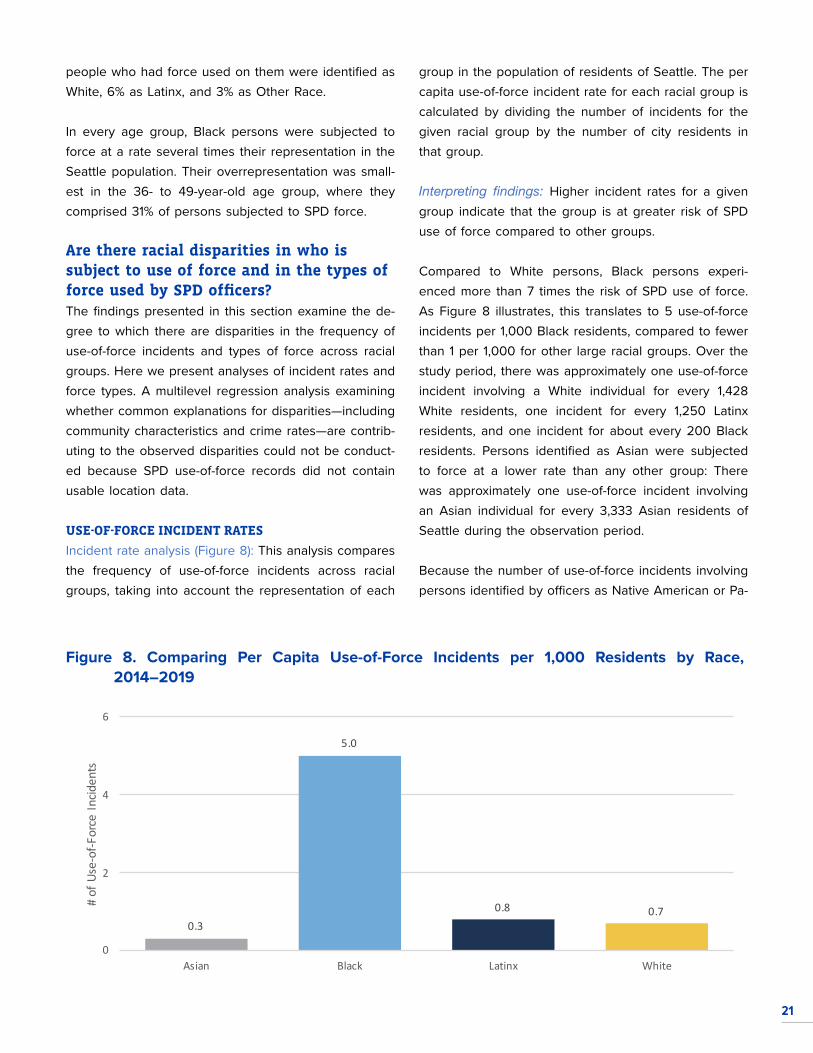
Interpreting findings: Higher incident rates for a given group indicate that the group is at greater risk of SPD use of force compared to other groups.
Compared to White persons, Black persons experi-enced more than 7 times the risk of SPD use of force. As Figure 8 illustrates, this translates to 5 use-of-force incidents per 1,000 Black residents, compared to fewer than 1 per 1,000 for other large racial groups. Over the study period, there was approximately one use-of-force incident involving a White individual for every 1,428 White residents, one incident for every 1,250 Latinx residents, and one incident for about every 200 Black residents. Persons identified as Asian were subjected to force at a lower rate than any other group: There was approximately one use-of-force incident involving an Asian individual for every 3,333 Asian residents of Seattle during the observation period.
Because the number of use-of-force incidents involving persons identified by officers as Native American or Pa-
0.3
5.0
0.8 0.7
0
2
4
6
Asian Black Latinx White
# of
Use
-of-F
orce
Incid
ents
Figure 8. Comparing Per Capita Use-of-Force Incidents per 1,000 Residents by Race, 2014–2019
22
cific Islander was less than 2% of all incidents, per capi-ta rates were not calculated for these groups. (As noted above under Figure 6, however, both groups were over-represented in recorded use-of-force incidents, relative to population.)
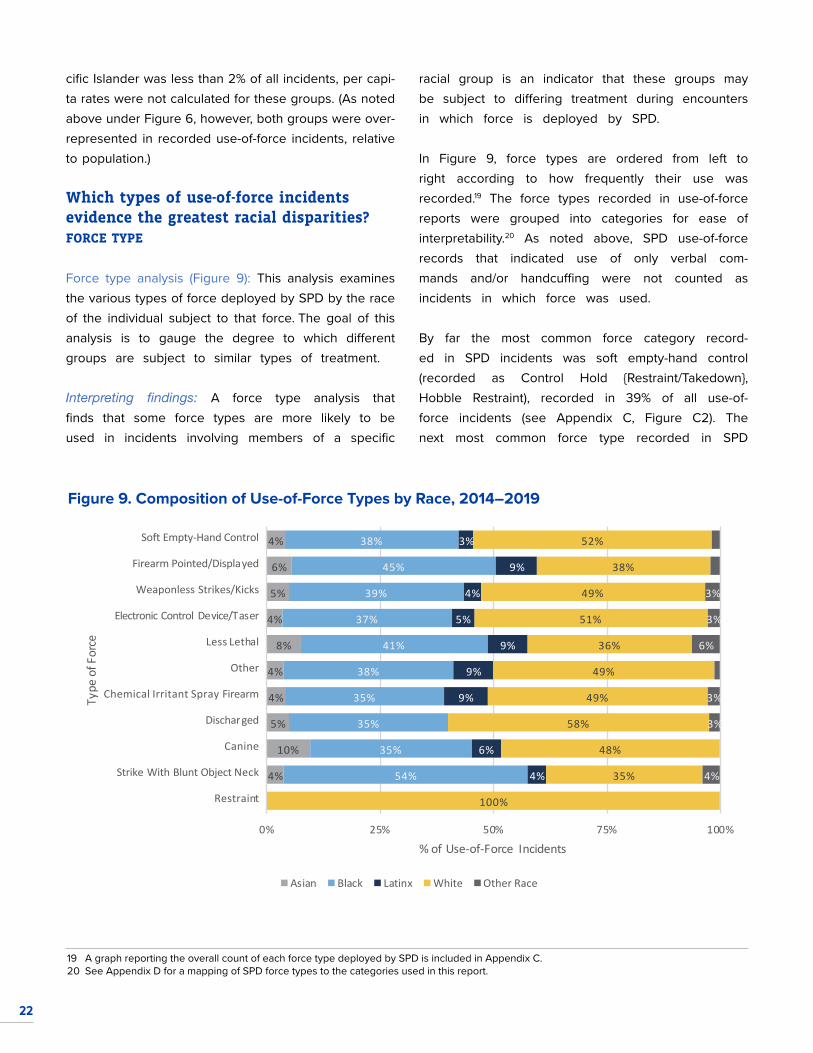
Which types of use-of-force incidents evidence the greatest racial disparities?FORCE TYPE
Force type analysis (Figure 9): This analysis examines the various types of force deployed by SPD by the race of the individual subject to that force. The goal of this analysis is to gauge the degree to which different groups are subject to similar types of treatment.
Interpreting findings: A force type analysis that finds that some force types are more likely to be used in incidents involving members of a specific
19 A graph reporting the overall count of each force type deployed by SPD is included in Appendix C.20 See Appendix D for a mapping of SPD force types to the categories used in this report.
racial group is an indicator that these groups may be subject to differing treatment during encounters in which force is deployed by SPD.
In Figure 9, force types are ordered from left to right according to how frequently their use was recorded.19 The force types recorded in use-of-force reports were grouped into categories for ease of interpretability.20 As noted above, SPD use-of-force records that indicated use of only verbal com-mands and/or handcuffing were not counted as incidents in which force was used.
By far the most common force category record-ed in SPD incidents was soft empty-hand control (recorded as Control Hold {Restraint/Takedown}, Hobble Restraint), recorded in 39% of all use-of-force incidents (see Appendix C, Figure C2). The next most common force type recorded in SPD
4%
10%
5%
4%
4%
8%
4%
5%
6%
4%
54%
35%
35%
35%
38%
41%
37%
39%
45%
38%
4%
6%
9%
9%
9%
5%
4%
9%
3%
100%
35%
48%
58%
49%
49%
36%
51%
49%
38%
52%
4%
3%
3%
6%
3%
3%
0% 25% 50% 75% 100%
Soft Empty-Hand Control
Firearm Pointed/Displayed
Weaponless Strikes/Kicks
Electronic Control Device/Taser
Less Lethal
Other
Chemical Irritant Spray Firearm
Discharged
Canine
Strike With Blunt Object Neck
Restraint
% of Use-of-Force Incidents
Type
of F
orce
Asian Black Latinx White Other Race
Figure 9. Composition of Use-of-Force Types by Race, 2014–2019
23
use-of-force incidents was firearm pointing or dis-play, recorded in 32% of all incidents. Weaponless strikes or kicks (using the officer’s body) were recorded in 12% of recorded incidents; Taser elec-tronic weapons in 2.8%; “Less lethal” force (Sting Ball, Balls [Blast, OC], Beanbag/Stunbag, Blue Nose, NFDD) in 2.6%; chemical irritant spray in 2.1% of all incidents; and “Other” force (including Other Weapon, Bicycle [Push/Powerslide/Takedown], Vehi-cle [PIT/Other]) in 2.0% of all recorded incidents. All other force types were used in less than 1% of all use-of-force incidents recorded by SPD.Racial disparities were fairly consistent across force
types. For every force type, Black persons were overrepresented at a rate several times their 7% share of the city population (except neck restraint, which was recorded in a single incident where the individual was White). Black persons represented between 35% and 45% of persons subjected to every type of force except “Strike With a Blunt Ob-ject,” where 54% of individuals were Black (14 of 26 incidents in which blunt object force was recorded).
24
CONCLUSIONOverall, the results of our analyses of SPD data on Terry stops and use-of-force incidents find reasons for optimism and identify opportunities for improvement.
We commend SPD for their proactive participation in the NJD as a tool for enhancing equity in SPD policing practices and outcomes. We encourage SPD to share these results with the people of Seattle in an effort to enhance transparency and accountability and to support community partnership in producing equity and public safety. As this is the first quantitative report CPE has produced for SPD, the analyses should be viewed as a resource for steering reforms and as an initial bench-
mark against which future progress can be measured.Based on the findings described in this report, we of-fer five specific recommendations, as detailed in the Executive Summary. While this is not an exhaustive list of possible solutions to the disparities and risk factors we have identified, we recommend SPD adopt these actionable steps to enhance their commitment to fair and equitable policing.
25
BIBLIOGRAPHYThis report is informed by a wealth of research in diverse social sciences. Here we list some of the most relevant published works.
Alpert, G. P., & Dunham, R. G. (2004). Understanding police use of force: Officers, suspects, and reciproc-ity. Cambridge University Press.
Amendola, K. L., Weisburd, D., Hamilton, E. E., Jones, G., & Slipka, M. (2011). The impact of shift length in policing on performance, health, quality of life, sleep, fatigue, and extra-duty employment. National Institute of Justice. https://www.ncjrs.gov/pdffiles1/nij/grants/237330.pdf
Ashby, M. P. J., & Tompson, L. (2017). Routine activities and proactive police activity: A macro-scale analysis of police searches in London and New York City. Justice Quarterly, 34(1), 109–135. https://doi.org/10.1080/07418825.2015.1103380
Bandura, A. (1973). Aggression: A social learning analy-sis. Prentice-Hall.
Bartol, C., Bergen, G. T., Volckens, J. S., & Kno-ras, K. M. (1992). Women in small-town po-licing: Job performance and stress. Criminal Justice and Behavior, 19(3), 240–259. https://doi.org/10.1177/0093854892019003003
Beilock, S. L., Jellison, W. A., Rydell, R. J., McConnell, A. R., & Carr, T. H. (2006). On the causal mechanisms of stereotype threat: Can skills that don’t rely heavi-ly on working memory still be threatened? Personal-ity and Social Psychology Bulletin, 32(8), 1059–1071. https://doi.org/10.1177/0146167206288489
Berkowitz, L. (1993). Aggression: Its causes, conse-quences, and control. McGraw-Hill.
Bielby, W. T. (2000). Minimizing workplace gender and racial bias. Contemporary Sociology, 29(1), 120–129.
Blair, I. V. (2002). The malleability of automatic stereo-types and prejudice. Personality and Social Psychol-ogy Review, 6(3), 242–261. https://doi.org/10.1207/S15327957PSPR0603_8
Bodenhausen, G. V. (1990). Stereotypes as judgmental heuristics: Evidence of circadian variations in dis-crimination. Psychological Science, 1(5), 319–322. https://doi.org/10.1111/j.1467-9280.1990.tb00226.x
Bodenhausen, G. V., & Wyer, R. S. (1985). Effects of stereotypes in decision making and informa-tion-processing strategies. Journal of Personality and Social Psychology, 48(2), 267–282. https://doi.org/10.1037/0022-3514.48.2.267
Bosson, J. K., Haymovitz, E. L., & Pinel, E. C. (2004). When saying and doing diverge: The effects of ste-reotype threat on self-reported versus non-verbal anxiety. Journal of Experimental Social Psycholo-gy, 40(2), 247–255. https://doi.org/10.1016/S0022-1031(03)00099-4
Bosson, J. K., & Vandello, J. A. (2011). Precarious man-hood and its links to action and aggression. Current Directions in Psychological Science, 20(2), 82–86. https://doi.org/10.1177/0963721411402669
Bosson, J. K., Vandello, J. A., Burnaford, R. M., Weaver, J. R., & Wasti, S. A. (2009). Precarious manhood and displays of physical aggression. Personality and So-cial Psychology Bulletin 35(5), 623–634. https://doi.org/10.1177/0146167208331161
Braga, A. A., & Weisburd, D. L. (2015). Focused deterrence and the prevention of violent gun injuries: Practice, theoretical principles, and scientific evidence. Annu-al Review of Public Health, 36, 55–68. https://doi.org/10.1146/annurev-publhealth-031914-122444
Broadbent, D. E. (1958). Perception and communication. Pergamon Press. (See Chapter 5, “The Effects of Noise on Behavior,” pp. 81–107.)
Brunso, R. K., & Gau, J. M. (2015). Officer race ver-sus macro-level context: A test of competing hy-potheses about Black citizens’ experiences with and perceptions of Black police officers. Crime and Delinquency, 61(2), 213–242. https://doi.org/10.1177/0011128711398027
26
Bump, P. (2017, July 28). Trump’s speech encouraging police to be “rough,” annotated. Washington Post. https://www.washingtonpost.com/news/politics/wp/2017/07/28/trumps-speech-encouraging-po-lice-to-be-rough-annotated/
The Cato Institute. (2010). National Police Miscon-duct Reporting Project, 2010 annual report.
Chaiyavej, S., & Morash, M. (2009). Reasons for police-women’s assertive and passive reactions to sexual harassment. Police Quarterly, 12(1), 63–85. https://doi.org/10.1177/1098611108327309
Chanin, J. M. (2015). Examining the sustainabili-ty of pattern or practice police misconduct re-form. Police Quarterly, 18(2), 163–192. https://doi.org/10.1177/1098611114561305
Clarke, R. V. (Ed.) (1997). Situational crime prevention: Successful case studies (2nd ed.). Harrow and Hes-ton. https://pdfs.semanticscholar.org/0abd/fe843d-91de5b291d6ab3f8c30070d8fbf711.pdf
Cohen, L. E., & Felson, M. (1979). Social change and crime rate trends: A routine activity approach. Amer-ican Sociological Review, 44(4), 588–608. https://www.jstor.org/stable/2094589
Cohen-Charash, Y., & Spector, P. E. (2001). The role of jus-tice in organizations: A meta-analysis. Organization-al Behavior and Human Decision Processes, 86(2), 278–321. https://doi.org/10.1006/obhd.2001.2958
Colquitt, J. A., Conlon, D. E., Wesson, M. J., Porter, C., & Hg, K. Y. (2001). Justice in the millennium: A me-ta-analytic review of 25 years of organizational jus-tice research. Journal of Applied Psychology, 86(3), 425–445. https://doi.org/10.1037/0021-9010.86.3.425
Connell, R. W., & Messerschmidt, J. W. (2005). He-gemonic masculinity: Rethinking the concept. Gender and Society, 19(6), 829–859. https://doi.org/10.1177/0891243205278639
Cooper, F. R. (2009). “Who’s the man?”: Masculinities studies, Terry stops, and police training. Columbia Journal of Gender and Law, 18(3), 671–742. https://scholars.law.unlv.edu/facpub/1122
Correll, J., Hudson, S. M., Guillermo, S., & Ma, D. S. (2014). The police officer’s dilemma: A decade of research on racial bias in the decision to shoot. Social and Personality Psychology Compass, 5(5), 201–213. https://doi.org/10.1111/spc3.12099
Correll, J., Park, B., Judd, C. M., & Wittenbrink, B. (2002). The police officer’s dilemma: Using ethnicity to disam-biguate potentially threatening individuals. Journal of Personality and Social Psychology, 83(6), 1314–1329. https://doi.org/10.1037/0022-3514.83.6.1314
Correll, J., Park, B., Judd, C. M., Wittenbrink, B., Sadler, M. S., & Keesee, T. (2007). Across the thin blue line: Police officers and racial bias in the decision to shoot. Journal of Personality and Social Psychol-ogy, 92(6), 1006–1023. https://doi.org/10.1037/0022-3514.92.6.1006
Correll, J., Urland, G. R., & Ito, T. A. (2006). Event-relat-ed potentials and the decision to shoot: The role of threat perception and cognitive control. Journal of Experimental Social Psychology, 42(1), 120–128. https://doi.org/10.1016/j.jesp.2005.02.006
Cuddy, A. J. C., Fiske, S. T., & Glick, P. (2007). The BIAS map: Behaviors from intergroup affect and stereotypes. Journal of Personality and Social Psychology, 92(4), 631–648. https://doi.org/10.1037/0022-3514.92.4.631
Cuddy, A. J. C., Fiske, S. T., Kwan, V. S. Y., Glick, P., Demoulin, S., Leyens, J.-P., Bond, M. H., Croizet, J.-C., Ellemers, N., Sleebos, E., Htun, T. T., Kim, H.-J., Maio, G., Perry, J., Petkova, K., Todorov, C., Rodrí-guez-Bailón, R., Morales, E., Moya, M.,…Ziegler, R. (2009). Stereotype content model across cultures: Towards universal similarities and some differences. The British Journal of Social Psychology, 48(1), 1–33. https://doi.org/10.1348/014466608X314935
Danziger, S., Levav, J., & Avnaim-Pesso, L. (2011). Extra-neous factors in judicial decisions. Proceedings of the National Academy of Sciences of the United States of America, 108(17), 6889–6892. https://doi.org/10.1073/pnas.1018033108
Dekker, I., & Barling, J. (1998). Personal and organiza-tional predictors of workplace sexual harassment of women by men. Journal of Occupational Health Psychology, 3(1), 7–18. https://doi.org/10.1037/1076-8998.3.1.7
27
Devine, P. G. (1989). Stereotypes and prejudice: Their automatic and controlled components. Journal of Personality and Social Psychology, 56(1), 5–18. https://doi.org/10.1037//0022-3514.56.1.5
Devine, P. G., & Elliot, A J. (1995). Are racial stereotypes really fading? The Princeton Trilogy revisited. Per-sonality and Social Psychology Bulletin, 21(11), 1139–1150. https://doi.org/10.1177/01461672952111002
Dovidio, J. F. (2001). On the nature of contemporary prejudice: The third wave. Journal of Social Is-sues, 57(4), 829–849. https://doi.org/10.1111/0022-4537.00244
Dovidio, J. F., & Gaertner, S. L. (1998). On the nature of contemporary prejudice: The causes, consequenc-es, and challenges of aversive racism. In J. L. Eber-hardt & S. T. Fiske (Eds.), Confronting racism: The problem and the response (pp. 3–32). Sage.
Dovidio, J. F., & Gaertner, S. L. (2000). Aversive rac-ism and selection decisions: 1989 and 1999. Psy-chological Science, 11(4), 315–319. https://doi.org/10.1111/1467-9280.00262
Dovidio, J. F., & Gaertner, S. L. (2004). Aversive racism. Advances in Experimental Social Psychology, 36, 1–52. https://doi.org/10.1016/S0065-2601(04)36001-6
Dovidio, J. F., Hewstone, M., Glick, P., & Esses, V. M. (2010). Prejudice, stereotyping, and discrimination: Theoretical and empirical overview. In J. F. Dovi-dio, M. Hewstone, P. Glick, & V. M. Esses (Eds.), The SAGE handbook of prejudice, stereotyping and discrimination (pp. 3–29). Sage. http://dx.doi.org/10.4135/9781446200919.n1
Dovidio, J. F., Pearson, A. R., Gaertner, S. L., & Hodson, G. (2008). On the nature of contemporary prejudice: From subtle bias to severe consequences. In V. M. Esses & R. A. Vernon (Eds.), Explaining the break-down of ethnic relations: Why neighbors kill (pp. 41–60). Blackwell.
Duncan, B. L. (1976). Differential social perception and attribution of intergroup violence: Testing the lower limits of stereotyping of Blacks. Journal of Personal-ity and Social Psychology, 34(4), 590–598. https://doi.org/10.1037/0022-3514.34.4.590
Fagan, J. A., Geller, A., Davies, G., & West, V. (2010). Street stops and Broken windows revisited: The de-mography and logic of proactive policing in a safe and changing city. In S. K. Rice & M. D. White (Eds.), Race, ethnicity, and policing: New and essential readings (pp. 309–348). NYU Press.
Fein, S., & Spencer, S. J. (1997). Prejudice as self-image maintenance: Affirming the self through derogating others. Journal of Personality and Social Psychology, 73(1), 31–44. https://doi.org/10.1037/0022-3514.73.1.31
Felson, M. (1987). Routine activities and crime prevention in the developing metropolis. Criminology, 25(4), 911–932. https://doi.org/10.1111/j.1745-9125.1987.tb00825.x
Fiske, A. P., Kitayama, S., Markus, H. R., & Nisbett, R. E. (1998). The cultural matrix of social psychology. In D. T. Gilbert, S. T. Fiske, & G. Lindze (Eds.), The handbook of social psychology (4th ed., Vol. 2, pp. 915–981). McGraw-Hill.
Fiske, S. T. (2012). Warmth and competence: Stereo-type content issues for clinicians and researchers. Canadian Psychology, 53(1), 14–20. https://doi.org/10.1037/a0026054
Fiske, S. T. (2013). Varieties of (de) humanization: Divid-ed by competition and status. In S. J. Gervais (Ed.), Objectification and (de)humanization: 60th Nebras-ka symposium on motivation (pp. 53–71). https://doi.org/10.1007/978-1-4614-6959-9
Fiske, S. T., Cuddy, A. J. C., Glick, P., & Xu, J. (2002). A model of (often mixed) stereotype content: Competence and warmth respectively follow from perceived status and competition. Journal of Per-sonality and Social Psychology, 82(6), 878–902. https://doi.org/10.1037//0022-3514.82.6.878
Fiske, S. T., & Dupree, C. (2014). Gaining trust as well as respect in communicating to motivated audienc-es about science topics. Proceedings of the Na-tional Academy of Sciences of the United States of America, 111(Suppl. 4), 13593–13597. https://doi.org/10.1073/pnas.1317505111
Ford, T. E., Gambino, F., Lee, H., Mayo, E., & Ferguson, M. A. (2004). The role of accountability in suppressing managers’ preinterview bias against African-Ameri-can sales job applicants. Journal of Personal Selling & Sales Management, 24(2), 113–124.
28
Fyfe, J. J. (1979). Administrative interventions on police shooting discretion: An empirical examination. Jour-nal of Criminal Justice, 7(4), 309–323. https://doi.org/10.1016/0047-2352(79)90065-5
Gaertner, S. L., & Dovidio, J. F. (1977). The subtlety of White racism, arousal, and helping behavior. Jour-nal of Personality and Social Psychology, 35(10), 691–707. https://doi.org/10.1037/0022-3514.35.10.691
Gaertner, S. L., & Dovidio, J. F. (1986). The aversive form of racism. In J. F. Dovidio & S. L. Gaertner (Eds.), Prejudice, discrimination, and racism (pp. 61–89). Academic Press.
Gaertner, S. L., Dovidio, J. F., & Johnson, G. (1982). Race of victim, nonresponsive bystanders, and helping behavior. Journal of Social Psychology, 117(1), 69–77. https://doi.org/10.1080/00224545.1982.9713409
Garrett, B. L., & Stoughton, S. W. (2017). A tactical fourth amendment. Virginia Law Review 103(2), 211–304. https://www.virginialawreview.org/sites/virginialawre-view.org/files/Garrett-Stoughton_Online.pdf
Gau, J. M., Corsaro, N., Stewart, E. A., & Brunson, R. K. (2012). Examining macro-level impacts on procedur-al justice and police legitimacy. Journal of Crimi-nal Justice, 40(4), 333–343. https://doi.org/10.1016/j.jcrimjus.2012.05.002
Goff, P. A., Di Leone, B. A. L., & Kahn, K. B. (2012). Racism leads to pushups: How racial discrimination threatens subordinate men’s masculinity. Journal of Experimental Social Psychology, 48(5), 1111–1116. https://doi.org/10.1016/j.jesp.2012.03.015
Goff, P. A., Jackson, M. C., DiLeone, B. A. L., Culotta, C. M., & DiTomasso, N. A. (2014). The essence of inno-cence: Consequences of dehumanizing Black chil-dren. Journal of Personality and Social Psychology, 106(4), 526–545. http://dx.doi.org/10.1037/a0035663
Goff, P. A., & Martin, K. D. (2012). Unity breeds fairness: The Consortium for Police Leadership in Equity report on the Las Vegas Metropolitan Police De-partment. The Consortium for Police Leadership in Equity.
Goff, P. A., Martin, K. D., & Gamson-Smiedt, M. (2012). Protecting equity: The Consortium for Police Lead-ership in Equity report on the San Jose Police De-partment. The Consortium for Police Leadership in Equity.
Goff, P. A., Steele, C. M., & Davies, P. G. (2008). The space between us: Stereotype threat and dis-tance in interracial contexts. Journal of Personali-ty and Social Psychology, 94(1), 91–107. https://doi.org/10.1037/0022-3514.94.1.91
Govorun, O., & Payne, B. K. (2006). Ego-depletion and prejudice: Separating automatic and controlled com-ponents. Social Cognition, 24(2), 111–136. https://doi.org/10.1521/soco.2006.24.2.111
Hadden, B., Tolliver, W., Snowden, F., & Brown-Manning, R. (2016). An authentic discourse: Recentering race and racism as factors that contribute to police vio-lence against unarmed Black or African American men. Journal of Human Behavior in the Social Envi-ronment, 26(3–4), 336–349. https://doi.org/10.1080/10911359.2015.1129252
Harris, A. P. (2000). Gender, violence, race, and crim-inal justice. Stanford Law Review, 52(4), 777–807. https://www.jstor.org/stable/1229430
Harris, L. T., & Fiske, S. T. (2006). Dehumanizing the low-est of the low: Neuroimaging responses to extreme out-groups. Psychological Science, 17(10), 847–853. https://doi.org/10.1111/j.1467-9280.2006.01793.x
Hauenstein, N. M. A., McGonigle, T., & Flinder, S. W. (2001). A meta-analysis of the relationship between procedural justice and distributive justice: Implica-tions for justice research. Employee Responsibil-ities and Rights Journal, 13(1), 39–56. https://doi.org/10.1023/A:1014482124497
Herbert, S. (2001). “Hard charger” or “station queen”? Policing and the masculinist state. Gen-der, Place and Culture, 8(1), 55–71. https://doi.org/10.1080/09663690120026325
Hitlan, R. T., Pryor, J. B., Hesson-McInnis, M. S., & Olson, M. (2009). Antecedents of gender harassment: An analysis of person and situation factors. Sex Roles, 61(11–12), 794–807. https://doi.org/10.1007/s11199-009-9689-2
Hollander-Blumoff, R., & Tyler, T. R. (2011). Procedural justice and the rule of law: Fostering legitimacy in alternative dispute resolution. Journal of Dispute Resolution, 2011(1), 1–20. https://scholarship.law.missouri.edu/cgi/viewcontent.cgi?article=1612&con-text=jdr
29
Hugenberg, K., & Bodenhausen, G. V. (2003). Fac-ing prejudice: Implicit prejudice and the percep-tion of facial threat. Psychological Science, 14(6), 640–643. https://doi.org/10.1046/j.0956-7976.2003.psci_1478.x
James, L., James, S., & Vila, B. (2018). The impact of work shift and fatigue on police officer response in simulated interactions with citizens. Journal of Experimental Criminology, 14(1), 111–120. https://doi.org/10.1007/s11292-017-9294-2
Jany, L. (2018, August 9). Minneapolis police taking a different approach to homelessness. StarTribune. http://www.startribune.com/to-minneapolis-home-less-small-results-of-police-outreach-initiative-al-ready-tangible/490405691/
Jones, N. (2004). “It’s not where you live, it’s how you live”: How young women negotiate conflict and vi-olence in the inner city. Annals of the American Academy of Political and Social Science, 595(1), 49–62. https://doi.org/10.1177/0002716204267394
Jones, N. (2014). “The regular routine”: Proactive po-licing and adolescent development among young, poor Black men. New Directions for Child and Ado-lescent Development, 2014(143), 33–54. https://doi.org/10.1002/cad.20053
Kennedy, D. M. (2015, February 19). What you think about dangerous inner-city neighbor-hoods is wrong. Washington Post. https://www.washingtonpost .com/opinions/book-review-ghettoside-by-jill-leovy/2015/02/19/b7fbb2ae-b077-11e4-827f-93f454140e2b_story.html
Kenrick, A. C., Sinclair, S., Richeson, J., Verosky, S. C., & Lun, J. (2016). Moving while Black: Intergroup at-titudes influence judgments of speed. Journal of Experimental Psychology: General, 145(2), 147–154. https://doi.org/10.1037/xge0000115
Kerfoot, D., & Knights, D. (1996). “The best is yet to come?”: The quest for embodiment in managerial work. In D. Collinson & J. Hearn (Eds.), Men as man-agers, managers as men (pp. 78–98). Sage.
Kimmel, M. S. (2009). Masculinity as homophobia: Fear, shame, and silence in the construction of gender identity. In M. M. Gergen & S. N. Davis (Eds.), Sex, gender, and sexuality: The new basics (pp. 58–70). Oxford University Press.
Knowles, J., Persico, N., & Todd, P. (2001). Racial bias in motor vehicle searches: Theory and evidence. Jour-nal of Political Economy, 109(1), 230–237. https://www.journals.uchicago.edu/doi/10.1086/318603
Laniyonu, A., & Goff, P. A. (2019). Policing the most vul-nerable: Measuring disparities in police use of force and injury among persons with serious mental ill-ness (Unpublished manuscript). Center for Policing Equity.
LaPiere, R. T. (1934). Attitudes vs. actions. Social Forces, 13(2), 230–237. https://www.jstor.org/stable/2570339
Lee, T. L., & Fiske, S. T. (2006). Not an outgroup, not yet an ingroup: Immigrants in the stereotype con-tent model. International Journal of Intercultural Relations, 30(6), 751–768. https://doi.org/10.1016/j.ijintrel.2006.06.005
Lorenz, K. (2005). On aggression. Routledge.
Maass, A., Cadinu, M., Guarnieri, G., & Grasselli, A. (2003). Sexual harassment under social identity threat: The computer harassment paradigm. Journal of Personality and Social Psychology, 85(5), 853–870. https://doi.org/10.1037/0022-3514.85.5.853
MacDonald, J., & Braga, A. A. (2018). Did post-Floyd et al. reforms reduce racial disparities in NYPD stop, question, and frisk practices? An exploratory analy-sis using external and internal benchmarks. Justice Quarterly, 36(5), 954–983. https://doi.org/10.1080/07418825.2018.1427278
Macintyre, S., Prenzler, T., & Chapman, J. (2008). Early intervention to reduce complaints: An Australian Vic-toria police initiative. International Journal of Police Science & Management, 10(2), 238–250. https://doi.org/10.1350/ijps.2008.10.2.77
Macrae, C. N., Milne, A. B., & Bodenhausen, G. V. (1994). Stereotypes as energy-saving devices: A peek inside the cognitive toolbox. Journal of Personal-ity & Social Psychology, 66(1), 37–47. https://doi.org/10.1037/0022-3514.66.1.37
Markus, H. R., & Kitayama, S. (1991). Culture and the self: Implications for cognition, emotion, and motivation. Psychological Review, 98(2), 224–253. https://doi.org/10.1037//0033-295X.98.2.224
30
McConnell, A., & Leibold, J. (2001). Relations among the Implicit Association Test, discriminatory behavior, and explicit measures of racial attitudes. Journal of Experimental Social Psychology, 37(5), 435–442. https://doi.org/10.1006/jesp.2000.1470
Mekawi, Y., & Bresin, K. (2015). Is the evidence from racial bias shooting task studies a smoking gun? Results from a meta-analysis. Journal of Experi-mental Social Psychology, 61, 120–130. https://doi.org/10.1016/j.jesp.2015.08.002
Mendes, W. B., Blascovich, J., Lickel, B., & Hunter, S. (2002). Challenge and threat during social interac-tions with White and Black men. Personality and Social Psychology Bulletin, 28(7), 939–952. https://www.researchgate.net/publication/230676410_In-tergroup_threat_Challenge_and_threat_during_so-cial_interactions_with_White_and_Black_men
Messerschmidt, J. (2000). Becoming “real men”: Ado-lescent masculinity challenges and sexual violence. Men and Masculinities, 2(3), 286–307. https://doi.org/10.1177/1097184X00002003003
Miller, E. K. (2000). The prefrontal cortex and cognitive control. Nature Reviews Neuroscience, 1(1), 59–65. https://doi.org/10.1038/35036228
Miller, N., Pedersen, W. C., Earleywine, M., & Pollock, V. E. (2003). A theoretical model of triggered dis-placed aggression. Personality and Social Psychol-ogy Review, 71(1), 75–97. https://doi.org/10.1207/S15327957PSPR0701_5
Mischel, W. (1968). Personality and assessment. Wiley.
Mummolo, J. (2018). Modern police tactics, police–cit-izen interactions, and the prospects for reform. The Journal of Politics, 80(1), 1–15. https://doi.org/10.1086/694393
Munsch, C. L., & Willer, R. (2012). The role of gender identity threat in perceptions of date rape and sexual coercion. Violence Against Women, 18(10), 1125–1146. https://doi.org/10.1177/1077801212465151
Najdowski, C. J., Bottoms, B. L., & Goff, P. A. (2015). Stereotype threat and racial differences in citizens’ experiences of police encounters. Law and Human Behavior, 39(5), 463–477. https://doi.org/10.1037/lhb0000140
National Academies of Sciences, Engineering, and Medi-cine. (2018). Proactive policing: Effects on crime and communities. National Academies Press. https://doi.org/10.17226/24928
Navon, D., & Gopher, D. (1979). On the economy of the human-processing system. Psychological Re-view, 86(3), 214–255. https://doi.org/10.1037/0033-295X.86.3.214
O’Brien, L. T., & Crandall, C. S. (2003). Stereo-type threat and arousal: Effects on women’s math performance. Personality and Social Psy-chology Bulletin, 29(6), 782–789. https://doi.org/10.1177/0146167203029006010
Pashler, H. (1994). Dual-task interference in simple tasks: Data and theory. Psychological Bulletin, 116(2), 220–244. https://doi.org/10.1037/0033-2909.116.2.220
Payne, B. K. (2001). Prejudice and perception: The role of automatic and controlled processes in misperceiving a weapon. Journal of Personality and Social Psychology, 81(2), 181–192. https://doi.org/10.1037/0022-3514.81.2.181
Payne, B. K. (2006). Weapon bias: Split-second decisions and unintended stereotyping. Current Directions in Psychological Science, 15(6), 287–291. https://doi.org/10.1111/j.1467-8721.2006.00454.x
Peguero, A. A. (2008). Bullying victimization and extra-curricular activity. Journal of School Violence, 7(3), 71–85. https://doi.org/10.1080/15388220801955570
Plant, E. A., & Peruche, B. M. (2005). The consequences of race for police officers’ responses to criminal sus-pects. Psychological Science, 16(3), 180–184. https://doi.org/10.1111/j.0956-7976.2005.00800.x
Plant, E. A., Peruche, B. M., & Butz, D. A. (2005). Elimi-nating automatic racial bias: Making race non-diag-nostic for responses to criminal suspects. Journal of Experimental Social Psychology, 41(2), 141–156. https://doi.org/10.1016/j.jesp.2004.07.004
Plous, S., & Williams, T. (1995). Racial stereotypes from the days of American slavery: A continuing legacy. Journal of Applied Social Psychology, 25(9), 795–817. https://doi.org/10.1111/j.1559-1816.1995.tb01776.x
31
Pogue, T. E., Michael, J. A., & Pérez, G. (2014). An analy-sis of commuting patterns in the North San Joaquin Valley. University of the Pacific, Eberhardt School of Business.
Prokos, A., & Padavic, I. (2002). “There oughtta be a law against bitches”: Masculinity lessons in police acad-emy training. Gender, Work & Organization, 9(4), 439–459. https://doi.org/10.1111/1468-0432.00168
Pryor, J. B., Giedd, J. L., & Williams, K. B. (1995). A social psychological model for predicting sexual harass-ment. Journal of Social Issues, 51(1), 69–84. https://doi.org/10.1111/j.1540-4560.1995.tb01309.x
Pryor, J. B., LaVite, C. M., & Stoller, L. M. (1993). A social psychological analysis of sexual harassment: The person/situation interaction. Journal of Vocation-al Behavior, 42(1), 68–83. https://doi.org/10.1006/jvbe.1993.1005
Reaves, B. A. (2015). Local police departments, 2013: Personnel, policies, and practices. Bureau of Justice Statistics Bulletins (NCJ 248677). U.S. Department of Justice. https://www.bjs.gov/content/pub/pdf/lp-d13ppp.pdf
Richardson, L. S., & Goff, P. A. (2014). Interrogating racial violence. Ohio State Journal of Criminal Law, 12(1), 115–152. https://static1.squarespace.com/static/55ad38b1e4b0185f0285195f/t/5c4918d-37ba7fc52100bbfd7/1548294356226/Interrogatin-gRacialViolence.pdf
Richeson, J. A., & Shelton, J. N. (2003). When preju-dice does not pay: Effects of interracial contact on executive function. Psychological Science, 14(3), 287–290. https://doi.org/10.1111/1467-9280.03437
Robinson, M. D., Schmeichel, B. J., & Inzlicht, M. (2010). A cognitive control perspective of self-control strength and its depletion. Social and Personality Psychology Compass, 4(3), 189–200. https://doi.org/10.1111/j.1751-9004.2009.00244.x
Rogers, R. W., & Prentice-Dunn, S. (1981). Deindividu-ation and anger-mediated interracial aggression: Unmasking regressive racism. Journal of Personal-ity and Social Psychology, 41(1), 63–73. https://doi.org/10.1037/0022-3514.41.1.63
Ross, C. T. (2015). A multi-level Bayesian analysis of racial bias in police shootings at the county-level in the United States, 2011–2014. PloS ONE, 10(11), e0141854. https://doi.org/10.1371/journal.pone.0141854
Ross, L., & Nisbett, R. E. (2011). The person and the situation: Perspectives of social psychology. Pinter & Martin.
Schmader, T., & Johns, M. (2003). Converging evi-dence that stereotype threat reduces working memory capacity. Journal of Personality and Social Psychology, 85(3), 440–452. https://doi.org/10.1037/0022-3514.85.3.440
Schoenfeld, H. (2005). Violated trust: Conceptualizing prosecutorial misconduct. Journal of Contempo-rary Criminal Justice, 21(3), 250–271. https://doi.org/10.1177/1043986205278722
Sekaquaptewa, D., Espinoza, P., Thompson, M., Vargas, P., & von Hippel, W. (2003). Stereotypic explana-tory bias: Implicit stereotyping as a predictor of discrimination. Journal of Experimental Social Psy-chology, 39(1), 75–82. https://doi.org/10.1016/S0022-1031(02)00512-7
Shades of the “old” LAPD [Editorial]. (2010, November 16). LA Times. https://www.latimes.com/archives/la-xpm-2010-nov-16-la-ed-lapd-20101116-story.html
Shelley, T. O., Morabito, M. S., & Tobin-Gurley, J. (2011). Gendered institutions and gender roles: Under-standing the experiences of women in policing. Criminal Justice Studies, 24(4), 351–367. https://doi.org/10.1080/1478601X.2011.625698
Sherman, L. W. (1980). Causes of police behavior: The current state of quantitative research. Journal of Research in Crime and Delinquency, 17(1), 69–100. https://doi.org/10.1177/002242788001700106
Sidanius, J., Liu, J. H., Shaw, J. S., & Pratto, F. (1994). Social dominance orientation, hierarchy attenuators and hierarchy enhancers: Social dominance theo-ry and the criminal justice system. Journal of Ap-plied Social Psychology, 24(4), 338–366. https://doi.org/10.1111/j.1559-1816.1994.tb00586.x
32
Sigelman, L., & Tuch, S. A. (1997). Metastereotypes: Blacks’ perceptions of Whites’ stereotypes of Blacks. Public Opinion Quarterly, 61(1), 87–101. https://doi.org/10.1086/297788
Sim, J. J., Correll, J., & Sadler, M. S. (2013). Under-standing police and expert performance: When training attenuates (vs. exacerbates) stereotypic bias in the decision to shoot. Personality and So-cial Psychology Bulletin, 39(3), 291–304. https://doi.org/10.1177/0146167212473157
Sniderman, P., & Piazza, T. (1993). The scar of race. Harvard University Press.
Sommers, S. (2012). Situations matter: Understanding how context transforms your world. Riverhead Books.
Steele, C. M., & Aronson, J. (1995). Stereotype threat and the intellectual test performance of African Americans. Journal of Personality and Social Psy-chology, 69(5), 797–811. https://doi.org/10.1037/0022-3514.69.5.797
Steele, C. M., Spencer, S. J., & Aronson, J. (2002). Contending with group image: The psychology of stereotype and social identity threat. Advances in Experimental Social Psychology, 34, 379–440. https://doi.org/10.1016/S0065-2601(02)80009-0
Stoughton, S. W. (2014a). Policing facts. Tulane Law Review, 88(5), 847–898. https://scholarcommons.sc.edu/cgi/viewcontent.cgi?article=2020&contex-t=law_facpub
Stoughton, S. W. (2014b). How police training contrib-utes to avoidable deaths. The Atlantic. https://www.theatlantic.com/national/archive/2014/12/po-lice-gun-shooting-training-ferguson/383681/
Stoughton, S. W. (2017). Terry v. Ohio and the (un)for-gettable frisk. Ohio State Journal of Criminal Law, 15(19), 19–33. https://scholarcommons.sc.edu/cgi/viewcontent.cgi?article=2174&context=law_facpub
Swencionis, J. K., & Goff, P. A. (2017). The psychologi-cal science of racial bias and policing. Psychology, Public Policy, and Law, 23(4), 398–409. https://doi.org/10.1037/law0000130
Swencionis, J. K., Pouget, E. R., & Goff, P. A. (2020). Hierarchy maintenance policing: Social dominance and police use of force (Unpublished manuscript). Center for Policing Equity.
Trinkner, R., Kerrison, E. M., & Goff, P. A. (2019). The force of fear: Police stereotype threat, self-legitima-cy, and support for excessive force. Law and Human Behavior, 43(5), 421–435. http://dx.doi.org/10.1037/lhb0000339
Trinkner, R., Tyler, T. R., & Goff, P. A. (2016). Justice from within: The relations between a procedurally just organizational climate and police organizational effi-ciency, endorsement of democratic policing, and of-ficer well-being. Psychology, Public Policy, and Law, 22(2), 158–172. https://doi.org/10.1037/law0000085
Tyler, T. R. (1988). What is procedural justice? Criteria used by citizens to assess the fairness of legal pro-cedures. Law Society Review, 22(1), 103–135. https://doi.org/10.2307/3053563
Tyler, T. R. (1990). Why people obey the law. Yale Uni-versity Press. (See Chapter 1, “Procedural Justice, Legitimacy, and Compliance,” pp. 3–7.)
Tyler, T. R. (2000). Social justice: Outcome and proce-dure. International Journal of Psychology, 35(2), 117–125. https://doi.org/10.1080/002075900399411
Tyler, T. R. (2003). Procedural justice, legitimacy, and the effective rule of law. Crime and Justice, 30(2003), 283–357. https://doi.org/10.1086/652233
Tyler, T. R. (2004). Enhancing police legitimacy. The Annals of the American Academy of Political and Social Science, 593(1), 84–99. https://doi.org/10.1177/0002716203262627
Tyler, T. R. (2006). Psychological perspectives on legit-imacy and legitimation. Annual Review of Psychol-ogy, 57, 375–400. https://doi.org/10.1146/annurev.psych.57.102904.190038
Tyler, T. R., & Huo, Y. (2002). Trust in the law: Encourag-ing public cooperation with the police and courts. Russell Sage Foundation.
33
U.S. Department of Justice, Civil Rights Division. (2017). The Civil Rights Division’s pattern and practice po-lice reform work: 1994–present. https://www.justice.gov/crt/file/922421/download
Vandello, J. A., Bosson, J. K., Cohen, D., Burnaford, R. M., & Weaver, J. R. (2008). Precarious manhood. Journal of Personality and Social Psychology, 95(6), 1325–1339. https://doi.org/10.1037/a0012453
Vorauer, J. D., Main, K. J., & O’Connell, G. B. (1998). How do individuals expect to be viewed by mem-bers of lower status groups? Content and implica-tions of meta-stereotypes. Journal of Personality and Social Psychology, 75(4), 917–937. https://doi.org/10.1037/0022-3514.75.4.917
Walker, S., Alpert, G. P., & Kenney, D. J. (2000). Early warning systems for police: Concept, history, and issues. Police Quarterly, 3(2), 132–152. https://doi.org/10.1177/1098611100003002001
Walker, S., & Katz, C. M. (2008). The police in America: An introduction (6th ed.). McGraw-Hill.
Weitzer, R., & Tuch, S. A. (2004). Race and perceptions of police misconduct. Social Problems, 51(3), 305–325. https://doi.org/10.1525/sp.2004.51.3.305
Wells, R. (2017, May 1). Lessons from the LA riots: How a consent decree helped a troubled police department change. CNN. https://www.cnn.com/2017/04/28/us/lapd-change-since-la-riots/index.html
Wicker, A. W. (1969). Attitudes versus actions: The rela-tionship of verbal and overt behavioral responses to attitude objects. Journal of Social Issues, 25(4), 41–78. https://doi.org/10.1111/j.1540-4560.1969.tb00619.x
Wigon, C. (2014, December 18). The LAPD didn’t catch an alleged serial killer for 30 years. Is it because the victims were Black? Vanity Fair. https://www.vanityfair.com/hollywood/2014/12/tales-of-the-grim-sleeper-nick-broomfield
Wogan, J. B. (2016). How police chiefs plan to avoid “lawful but awful” shootings. Governing.com. https://www.governing.com/topics/public-justice-safety/gov-police-chiefs-shootings.html
Wolfe, S. E., & Piquero, A. R. (2011). Organization-al justice and police misconduct. Criminal Jus-tice and Behavior, 38(4), 332–353. https://doi.org/10.1177/0093854810397739
Worden, R. E. (2015). The “causes” of police brutality: Theory and evidence on police use of force. In E. R. Maguire & D. E. Duffee (Eds.), Criminal justice the-ory: Explaining the nature and behavior of criminal justice (2nd ed., pp. 149–204). Routledge.
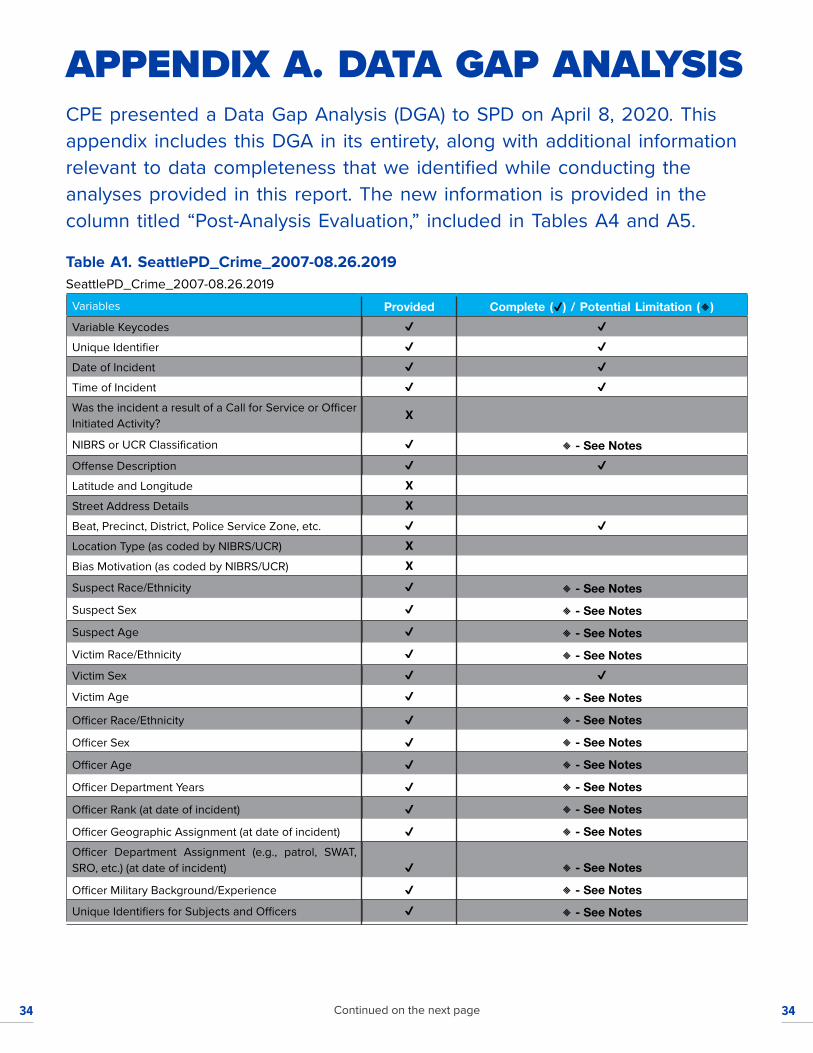
34 34
CPE presented a Data Gap Analysis (DGA) to SPD on April 8, 2020. This appendix includes this DGA in its entirety, along with additional information relevant to data completeness that we identified while conducting the analyses provided in this report. The new information is provided in the column titled “Post-Analysis Evaluation,” included in Tables A4 and A5.
Table A1. SeattlePD_Crime_2007-08.26.2019SeattlePD_Crime_2007-08.26.2019
Variables Provided Complete (✔) / Potential Limitation (🔸)Variable Keycodes ✔ ✔
Unique Identifier ✔ ✔
Date of Incident ✔ ✔
Time of Incident ✔ ✔
Was the incident a result of a Call for Service or Officer Initiated Activity?
X
NIBRS or UCR Classification ✔ 🔸 - See NotesOffense Description ✔ ✔
Latitude and Longitude XStreet Address Details XBeat, Precinct, District, Police Service Zone, etc. ✔ ✔
Location Type (as coded by NIBRS/UCR) XBias Motivation (as coded by NIBRS/UCR) X
Suspect Race/Ethnicity ✔ 🔸 - See NotesSuspect Sex ✔ 🔸 - See NotesSuspect Age ✔ 🔸 - See NotesVictim Race/Ethnicity ✔ 🔸 - See NotesVictim Sex ✔ ✔
Victim Age ✔ 🔸 - See Notes
Officer Race/Ethnicity ✔ 🔸 - See Notes
Officer Sex ✔ 🔸 - See Notes
Officer Age ✔ 🔸 - See Notes
Officer Department Years ✔ 🔸 - See Notes
Officer Rank (at date of incident) ✔ 🔸 - See Notes
Officer Geographic Assignment (at date of incident) ✔ 🔸 - See NotesOfficer Department Assignment (e.g., patrol, SWAT, SRO, etc.) (at date of incident) ✔ 🔸 - See Notes
Officer Military Background/Experience ✔ 🔸 - See NotesUnique Identifiers for Subjects and Officers ✔ 🔸 - See Notes
Continued on the next page
APPENDIX A. DATA GAP ANALYSIS
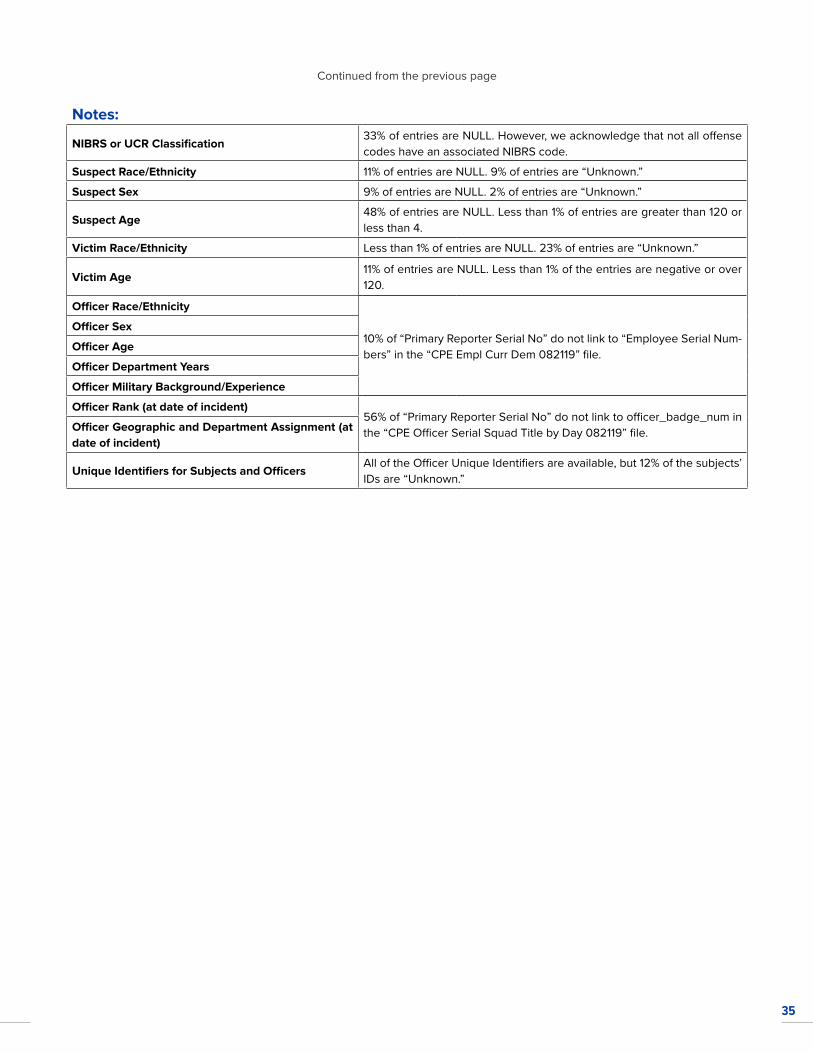
3534
Notes:
NIBRS or UCR Classification33% of entries are NULL. However, we acknowledge that not all offense codes have an associated NIBRS code.
Suspect Race/Ethnicity 11% of entries are NULL. 9% of entries are “Unknown.”
Suspect Sex 9% of entries are NULL. 2% of entries are “Unknown.”
Suspect Age48% of entries are NULL. Less than 1% of entries are greater than 120 or less than 4.
Victim Race/Ethnicity Less than 1% of entries are NULL. 23% of entries are “Unknown.”
Victim Age11% of entries are NULL. Less than 1% of the entries are negative or over 120.
Officer Race/Ethnicity
10% of “Primary Reporter Serial No” do not link to “Employee Serial Num-bers” in the “CPE Empl Curr Dem 082119” file.
Officer Sex
Officer Age
Officer Department Years
Officer Military Background/Experience
Officer Rank (at date of incident)56% of “Primary Reporter Serial No” do not link to officer_badge_num in the “CPE Officer Serial Squad Title by Day 082119” file.Officer Geographic and Department Assignment (at
date of incident)
Unique Identifiers for Subjects and OfficersAll of the Officer Unique Identifiers are available, but 12% of the subjects’ IDs are “Unknown.”
Continued from the previous page
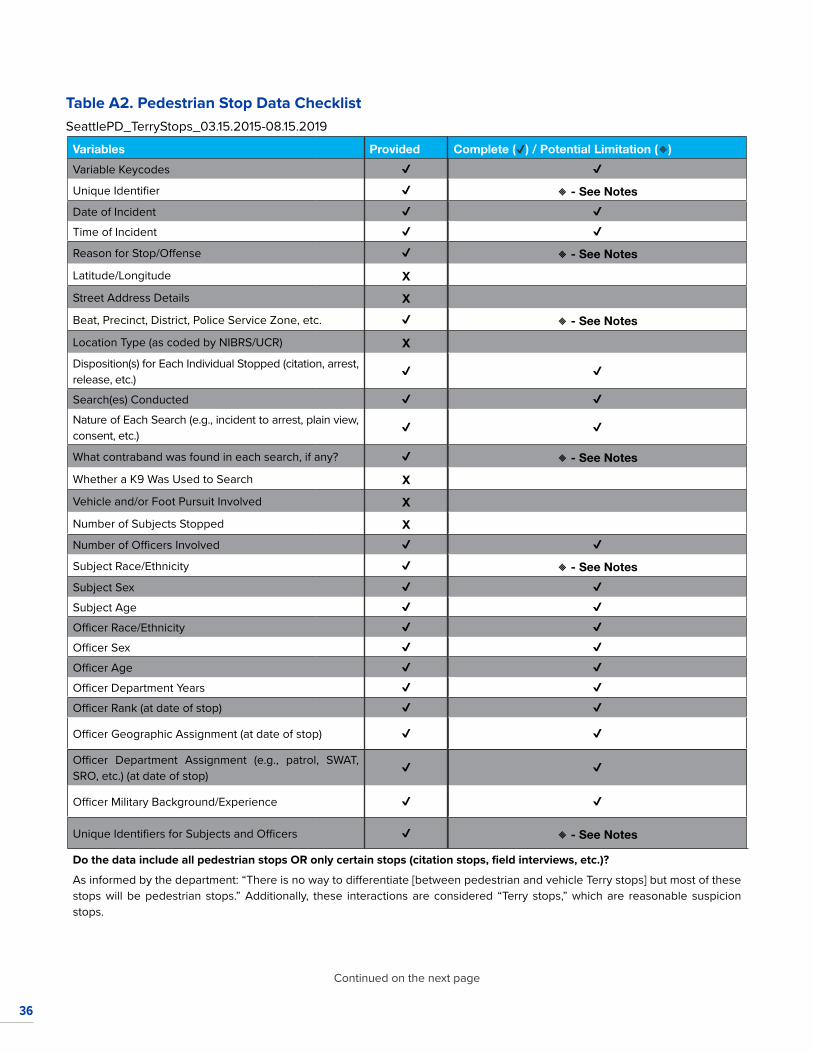
36
Table A2. Pedestrian Stop Data ChecklistSeattlePD_TerryStops_03.15.2015-08.15.2019
Variables Provided Complete (✔) / Potential Limitation (🔸)Variable Keycodes ✔ ✔
Unique Identifier ✔ 🔸 - See NotesDate of Incident ✔ ✔
Time of Incident ✔ ✔
Reason for Stop/Offense ✔ 🔸 - See NotesLatitude/Longitude XStreet Address Details XBeat, Precinct, District, Police Service Zone, etc. ✔ 🔸 - See NotesLocation Type (as coded by NIBRS/UCR) XDisposition(s) for Each Individual Stopped (citation, arrest, release, etc.)
✔ ✔
Search(es) Conducted ✔ ✔
Nature of Each Search (e.g., incident to arrest, plain view, consent, etc.)
✔ ✔
What contraband was found in each search, if any? ✔ 🔸 - See NotesWhether a K9 Was Used to Search XVehicle and/or Foot Pursuit Involved XNumber of Subjects Stopped XNumber of Officers Involved ✔ ✔
Subject Race/Ethnicity ✔ 🔸 - See NotesSubject Sex ✔ ✔
Subject Age ✔ ✔
Officer Race/Ethnicity ✔ ✔
Officer Sex ✔ ✔
Officer Age ✔ ✔
Officer Department Years ✔ ✔
Officer Rank (at date of stop) ✔ ✔
Officer Geographic Assignment (at date of stop) ✔ ✔
Officer Department Assignment (e.g., patrol, SWAT, SRO, etc.) (at date of stop)
✔ ✔
Officer Military Background/Experience ✔ ✔
Unique Identifiers for Subjects and Officers ✔ 🔸 - See Notes
Do the data include all pedestrian stops OR only certain stops (citation stops, field interviews, etc.)?
As informed by the department: “There is no way to differentiate [between pedestrian and vehicle Terry stops] but most of these stops will be pedestrian stops.” Additionally, these interactions are considered “Terry stops,” which are reasonable suspicion stops.
Continued on the next page
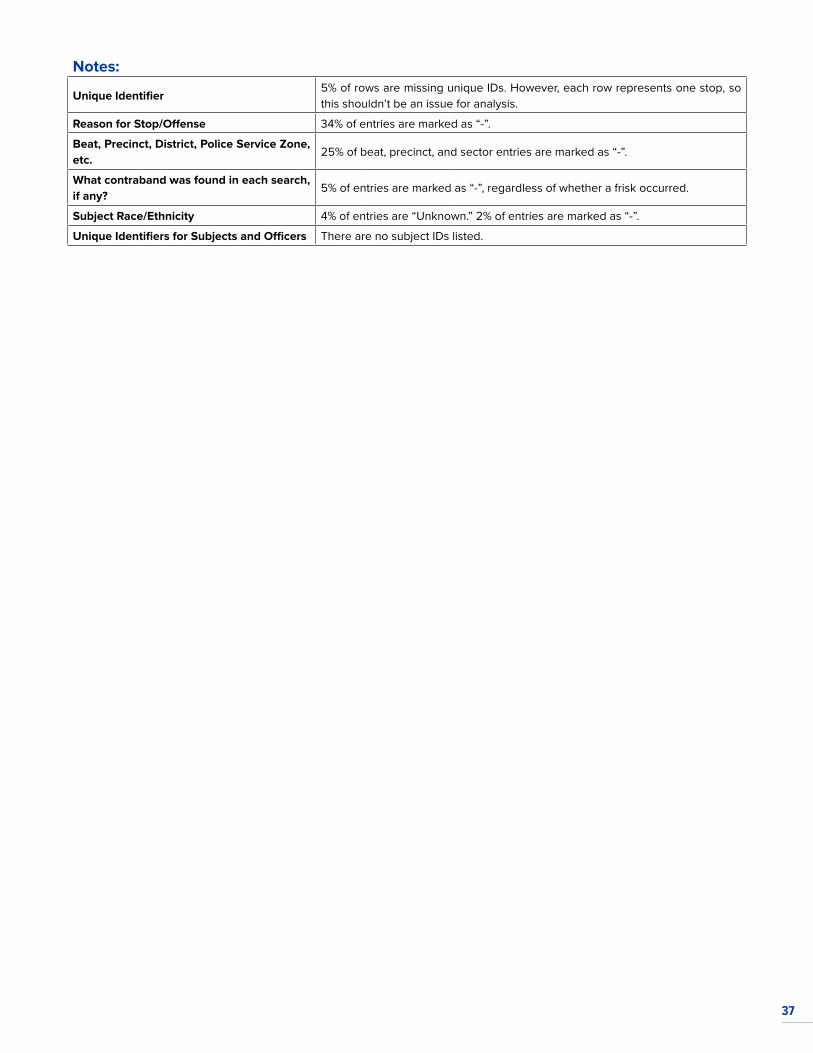
37
Notes:
Unique Identifier5% of rows are missing unique IDs. However, each row represents one stop, so this shouldn’t be an issue for analysis.
Reason for Stop/Offense 34% of entries are marked as “-”.
Beat, Precinct, District, Police Service Zone, etc.
25% of beat, precinct, and sector entries are marked as “-”.
What contraband was found in each search, if any?
5% of entries are marked as “-”, regardless of whether a frisk occurred.
Subject Race/Ethnicity 4% of entries are “Unknown.” 2% of entries are marked as “-”.
Unique Identifiers for Subjects and Officers There are no subject IDs listed.
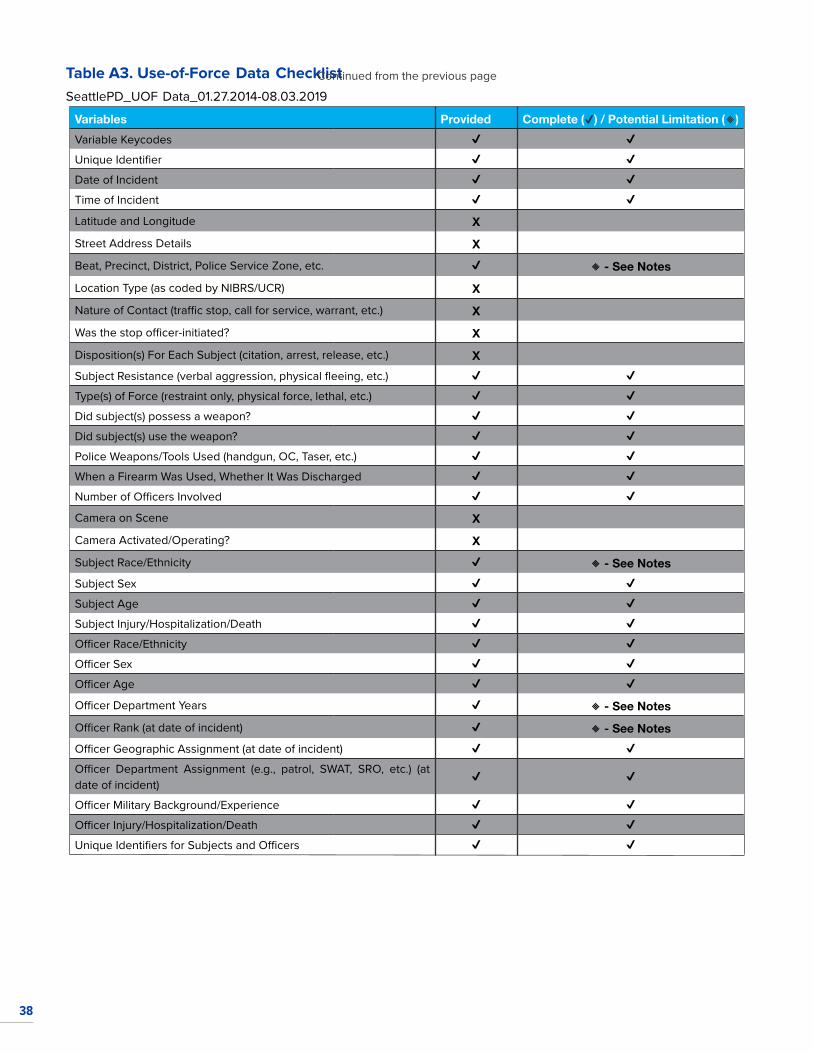
38
Table A3. Use-of-Force Data ChecklistSeattlePD_UOF Data_01.27.2014-08.03.2019
Variables Provided Complete (✔) / Potential Limitation (🔸)Variable Keycodes ✔ ✔
Unique Identifier ✔ ✔
Date of Incident ✔ ✔
Time of Incident ✔ ✔
Latitude and Longitude XStreet Address Details XBeat, Precinct, District, Police Service Zone, etc. ✔ 🔸 - See NotesLocation Type (as coded by NIBRS/UCR) XNature of Contact (traffic stop, call for service, warrant, etc.) XWas the stop officer-initiated? XDisposition(s) For Each Subject (citation, arrest, release, etc.) XSubject Resistance (verbal aggression, physical fleeing, etc.) ✔ ✔
Type(s) of Force (restraint only, physical force, lethal, etc.) ✔ ✔
Did subject(s) possess a weapon? ✔ ✔
Did subject(s) use the weapon? ✔ ✔
Police Weapons/Tools Used (handgun, OC, Taser, etc.) ✔ ✔
When a Firearm Was Used, Whether It Was Discharged ✔ ✔
Number of Officers Involved ✔ ✔
Camera on Scene XCamera Activated/Operating? XSubject Race/Ethnicity ✔ 🔸 - See NotesSubject Sex ✔ ✔
Subject Age ✔ ✔
Subject Injury/Hospitalization/Death ✔ ✔
Officer Race/Ethnicity ✔ ✔
Officer Sex ✔ ✔
Officer Age ✔ ✔
Officer Department Years ✔ 🔸 - See NotesOfficer Rank (at date of incident) ✔ 🔸 - See NotesOfficer Geographic Assignment (at date of incident) ✔ ✔
Officer Department Assignment (e.g., patrol, SWAT, SRO, etc.) (at date of incident)
✔ ✔
Officer Military Background/Experience ✔ ✔
Officer Injury/Hospitalization/Death ✔ ✔
Unique Identifiers for Subjects and Officers ✔ ✔
Continued from the previous page
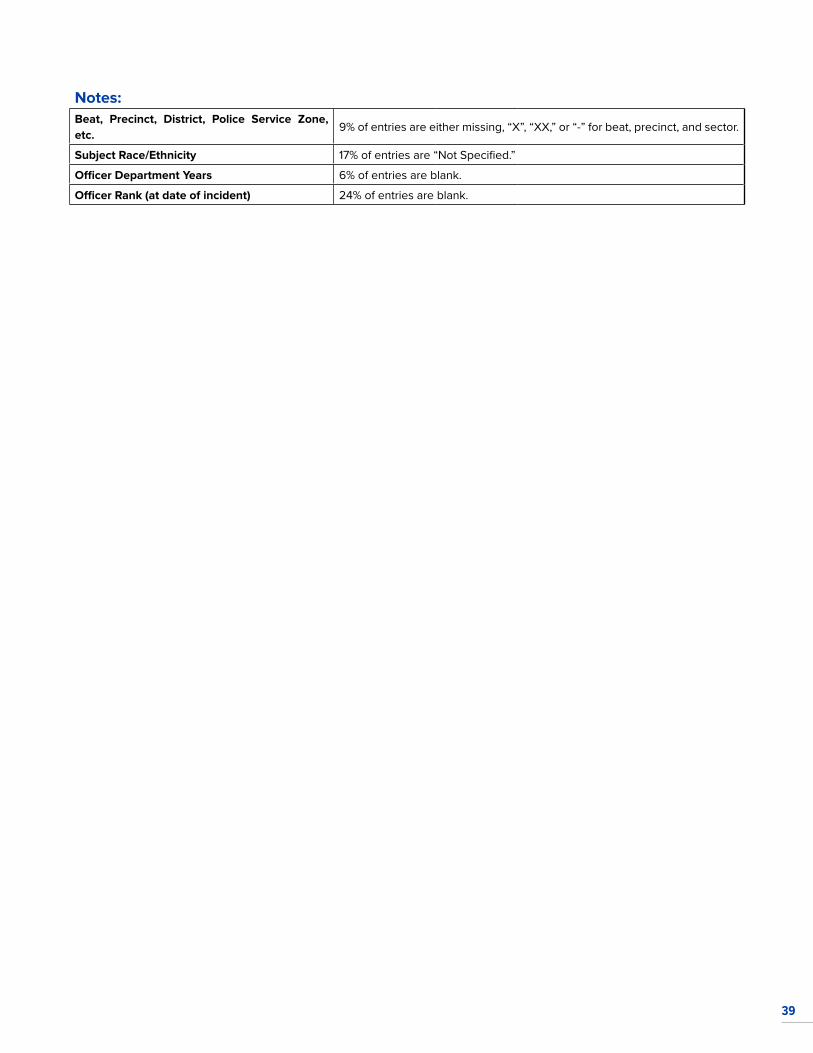
39
Notes:Beat, Precinct, District, Police Service Zone, etc.
9% of entries are either missing, “X”, “XX,” or “-” for beat, precinct, and sector.
Subject Race/Ethnicity 17% of entries are “Not Specified.”
Officer Department Years 6% of entries are blank.
Officer Rank (at date of incident) 24% of entries are blank.
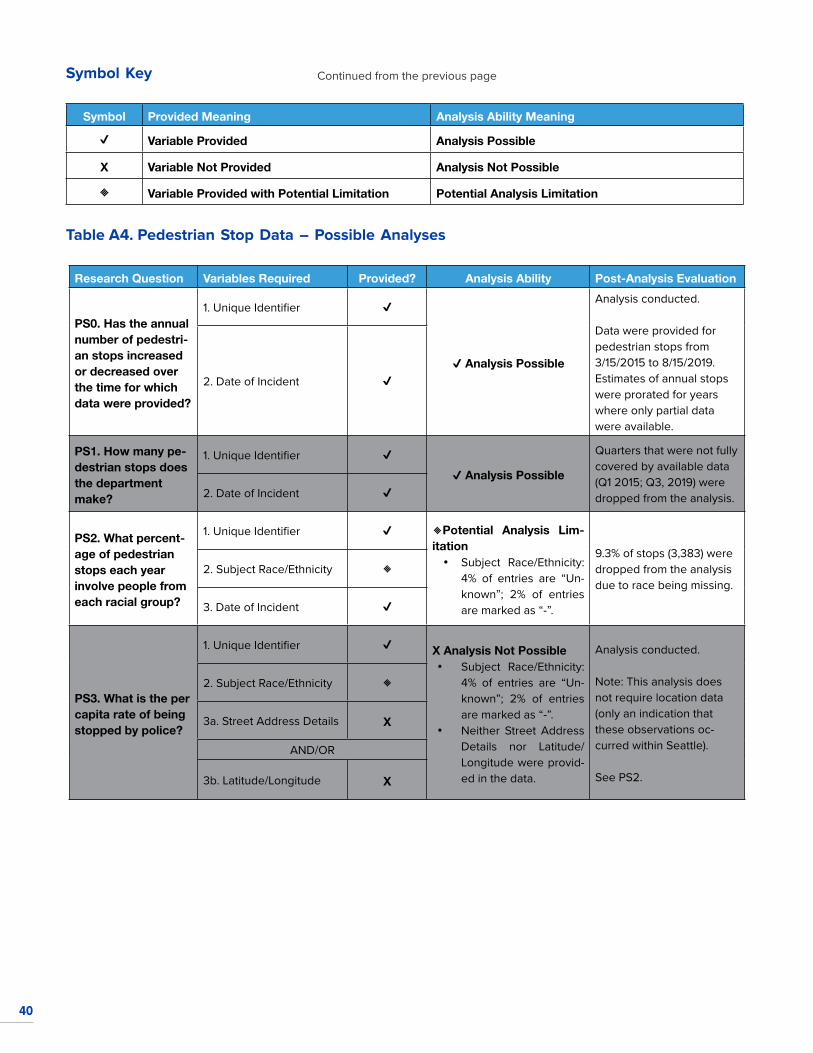
40
Symbol Key
Symbol Provided Meaning Analysis Ability Meaning
✔ Variable Provided Analysis Possible
X Variable Not Provided Analysis Not Possible
🔸 Variable Provided with Potential Limitation Potential Analysis Limitation
Table A4. Pedestrian Stop Data – Possible Analyses
Research Question Variables Required Provided? Analysis Ability Post-Analysis Evaluation
PS0. Has the annual number of pedestri-an stops increased or decreased over the time for which data were provided?
1. Unique Identifier ✔
✔ Analysis Possible
Analysis conducted.
Data were provided for pedestrian stops from 3/15/2015 to 8/15/2019. Estimates of annual stops were prorated for years where only partial data were available.
2. Date of Incident ✔
PS1. How many pe-destrian stops does the department make?
1. Unique Identifier ✔
✔ Analysis Possible
Quarters that were not fully covered by available data (Q1 2015; Q3, 2019) were dropped from the analysis.2. Date of Incident ✔
PS2. What percent-age of pedestrian stops each year involve people from each racial group?
1. Unique Identifier ✔ 🔸Potential Analysis Lim-itation
• Subject Race/Ethnicity: 4% of entries are “Un-known”; 2% of entries are marked as “-”.
9.3% of stops (3,383) were dropped from the analysis due to race being missing.
2. Subject Race/Ethnicity 🔸
3. Date of Incident ✔
PS3. What is the per capita rate of being stopped by police?
1. Unique Identifier ✔ X Analysis Not Possible• Subject Race/Ethnicity:
4% of entries are “Un-known”; 2% of entries are marked as “-”.
• Neither Street Address Details nor Latitude/Longitude were provid-ed in the data.
Analysis conducted.
Note: This analysis does not require location data (only an indication that these observations oc-curred within Seattle).
See PS2.
2. Subject Race/Ethnicity 🔸
3a. Street Address Details X
AND/OR
3b. Latitude/Longitude X
Continued from the previous page
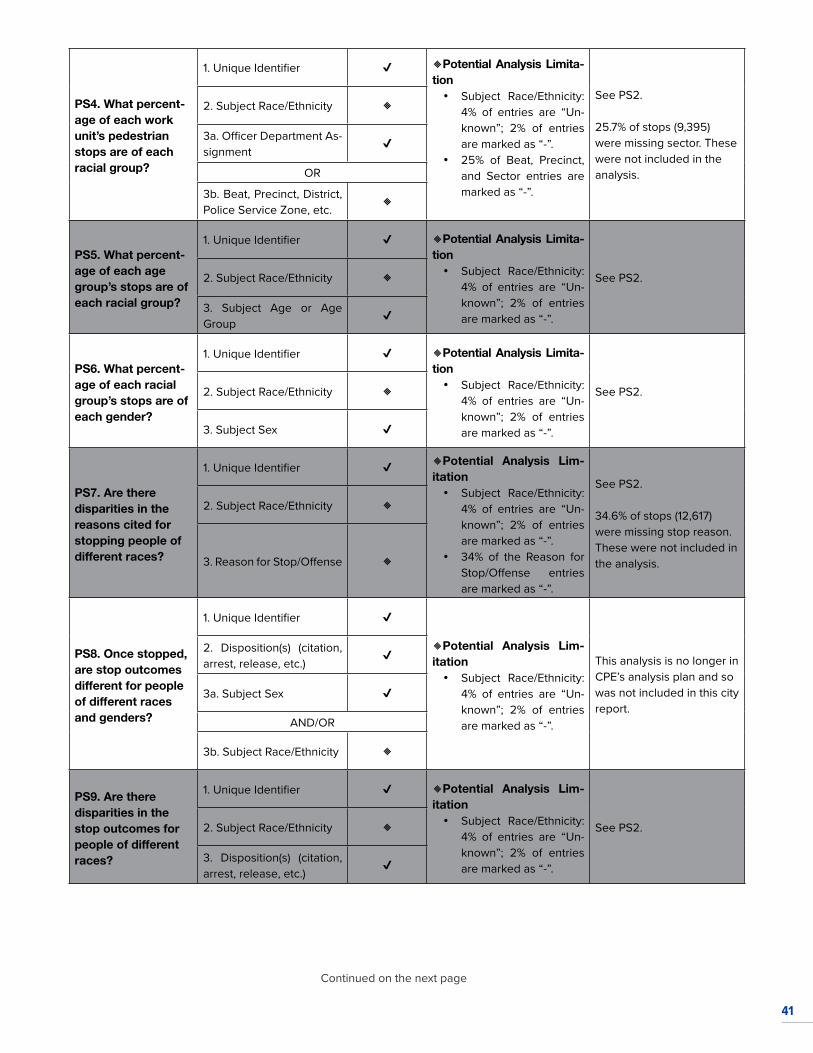
41
PS4. What percent-age of each work unit’s pedestrian stops are of each racial group?
1. Unique Identifier ✔ 🔸Potential Analysis Limita-tion
• Subject Race/Ethnicity: 4% of entries are “Un-known”; 2% of entries are marked as “-”.
• 25% of Beat, Precinct, and Sector entries are marked as “-”.
See PS2.
25.7% of stops (9,395) were missing sector. These were not included in the analysis.
2. Subject Race/Ethnicity 🔸
3a. Officer Department As-signment
✔
OR
3b. Beat, Precinct, District, Police Service Zone, etc.
🔸
PS5. What percent-age of each age group’s stops are of each racial group?
1. Unique Identifier ✔ 🔸Potential Analysis Limita-tion
• Subject Race/Ethnicity: 4% of entries are “Un-known”; 2% of entries are marked as “-”.
See PS2.2. Subject Race/Ethnicity 🔸
3. Subject Age or Age Group
✔
PS6. What percent-age of each racial group’s stops are of each gender?
1. Unique Identifier ✔ 🔸Potential Analysis Limita-tion
• Subject Race/Ethnicity: 4% of entries are “Un-known”; 2% of entries are marked as “-”.
See PS2.2. Subject Race/Ethnicity 🔸
3. Subject Sex ✔
PS7. Are there disparities in the reasons cited for stopping people of different races?
1. Unique Identifier ✔ 🔸Potential Analysis Lim-itation
• Subject Race/Ethnicity: 4% of entries are “Un-known”; 2% of entries are marked as “-”.
• 34% of the Reason for Stop/Offense entries are marked as “-”.
See PS2.
34.6% of stops (12,617) were missing stop reason. These were not included in the analysis.
2. Subject Race/Ethnicity 🔸
3. Reason for Stop/Offense 🔸
PS8. Once stopped, are stop outcomes different for people of different races and genders?
1. Unique Identifier ✔
🔸Potential Analysis Lim-itation
• Subject Race/Ethnicity: 4% of entries are “Un-known”; 2% of entries are marked as “-”.
This analysis is no longer in CPE’s analysis plan and so was not included in this city report.
2. Disposition(s) (citation, arrest, release, etc.)
✔
3a. Subject Sex ✔
AND/OR
3b. Subject Race/Ethnicity 🔸
PS9. Are there disparities in the stop outcomes for people of different races?
1. Unique Identifier ✔ 🔸Potential Analysis Lim-itation
• Subject Race/Ethnicity: 4% of entries are “Un-known”; 2% of entries are marked as “-”.
See PS2.2. Subject Race/Ethnicity 🔸
3. Disposition(s) (citation, arrest, release, etc.)
✔
Continued on the next page
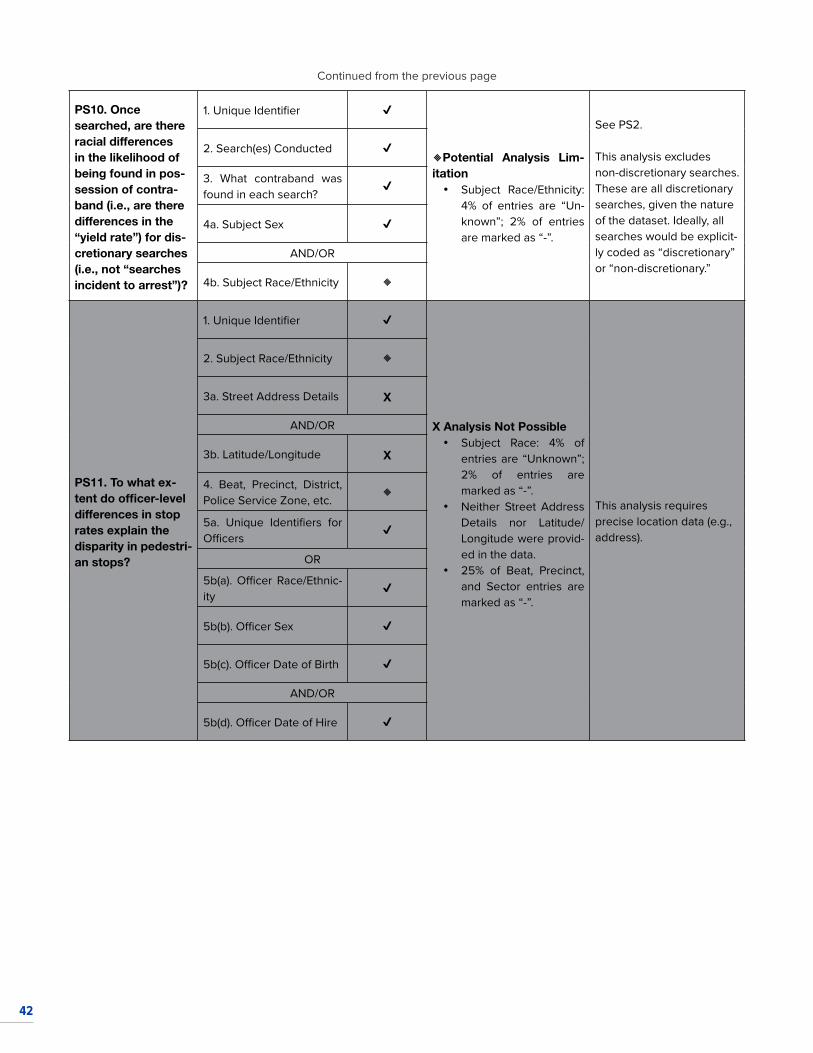
42
PS10. Once searched, are there racial differences in the likelihood of being found in pos-session of contra-band (i.e., are there differences in the “yield rate”) for dis-cretionary searches (i.e., not “searches incident to arrest”)?
1. Unique Identifier ✔
🔸Potential Analysis Lim-itation
• Subject Race/Ethnicity: 4% of entries are “Un-known”; 2% of entries are marked as “-”.
See PS2.
This analysis excludes non-discretionary searches. These are all discretionary searches, given the nature of the dataset. Ideally, all searches would be explicit-ly coded as “discretionary” or “non-discretionary.”
2. Search(es) Conducted ✔
3. What contraband was found in each search?
✔
4a. Subject Sex ✔
AND/OR
4b. Subject Race/Ethnicity 🔸
PS11. To what ex-tent do officer-level differences in stop rates explain the disparity in pedestri-an stops?
1. Unique Identifier ✔
X Analysis Not Possible• Subject Race: 4% of
entries are “Unknown”; 2% of entries are marked as “-”.
• Neither Street Address Details nor Latitude/Longitude were provid-ed in the data.
• 25% of Beat, Precinct, and Sector entries are marked as “-”.
This analysis requires precise location data (e.g., address).
2. Subject Race/Ethnicity 🔸
3a. Street Address Details X
AND/OR
3b. Latitude/Longitude X
4. Beat, Precinct, District, Police Service Zone, etc.
🔸
5a. Unique Identifiers for Officers
✔
OR
5b(a). Officer Race/Ethnic-ity
✔
5b(b). Officer Sex ✔
5b(c). Officer Date of Birth ✔
AND/OR
5b(d). Officer Date of Hire ✔
Continued from the previous page
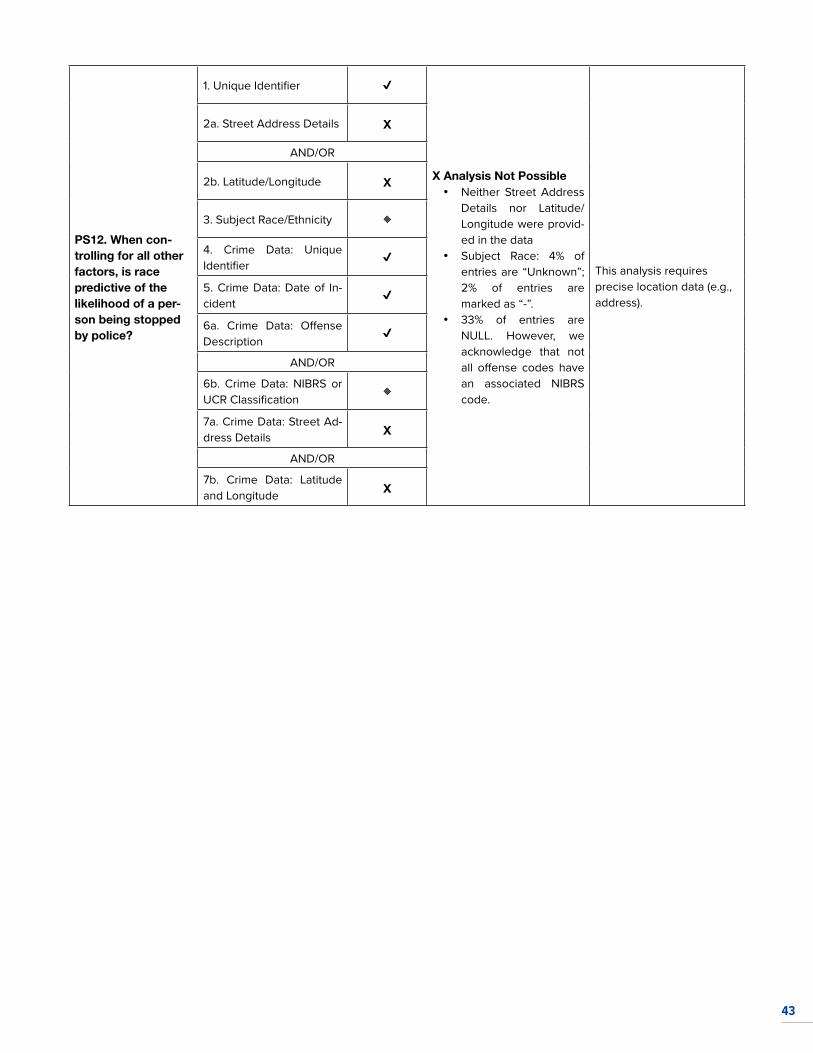
43
PS12. When con-trolling for all other factors, is race predictive of the likelihood of a per-son being stopped by police?
1. Unique Identifier ✔
X Analysis Not Possible• Neither Street Address
Details nor Latitude/Longitude were provid-ed in the data
• Subject Race: 4% of entries are “Unknown”; 2% of entries are marked as “-”.
• 33% of entries are NULL. However, we acknowledge that not all offense codes have an associated NIBRS code.
This analysis requires precise location data (e.g., address).
2a. Street Address Details X
AND/OR
2b. Latitude/Longitude X
3. Subject Race/Ethnicity 🔸
4. Crime Data: Unique Identifier
✔
5. Crime Data: Date of In-cident
✔
6a. Crime Data: Offense Description
✔
AND/OR
6b. Crime Data: NIBRS or UCR Classification
🔸
7a. Crime Data: Street Ad-dress Details X
AND/OR
7b. Crime Data: Latitude and Longitude X
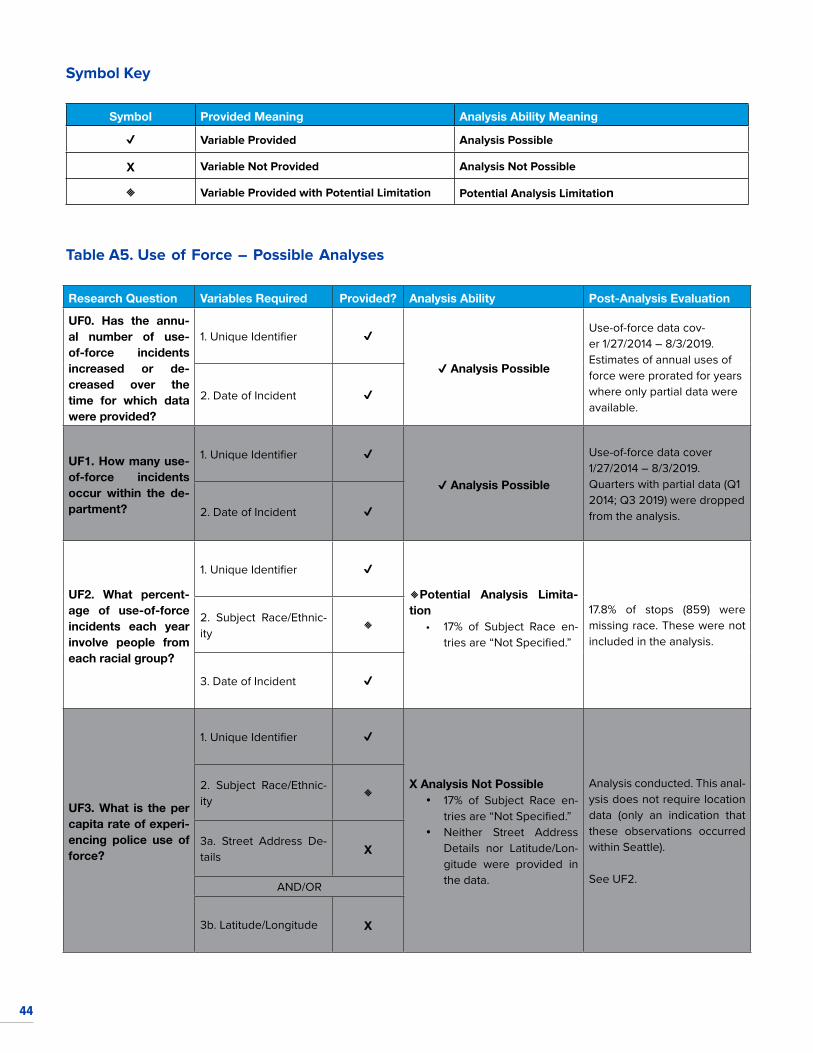
44
Symbol Key
Symbol Provided Meaning Analysis Ability Meaning
✔ Variable Provided Analysis Possible
X Variable Not Provided Analysis Not Possible
🔸 Variable Provided with Potential Limitation Potential Analysis Limitation
Table A5. Use of Force – Possible Analyses
Research Question Variables Required Provided? Analysis Ability Post-Analysis Evaluation
UF0. Has the annu-al number of use-of-force incidents increased or de-creased over the time for which data were provided?
1. Unique Identifier ✔
✔ Analysis Possible
Use-of-force data cov-er 1/27/2014 – 8/3/2019. Estimates of annual uses of force were prorated for years where only partial data were available.
2. Date of Incident ✔
UF1. How many use-of-force incidents occur within the de-partment?
1. Unique Identifier ✔
✔ Analysis Possible
Use-of-force data cover 1/27/2014 – 8/3/2019. Quarters with partial data (Q1 2014; Q3 2019) were dropped from the analysis.2. Date of Incident ✔
UF2. What percent-age of use-of-force incidents each year involve people from each racial group?
1. Unique Identifier ✔
🔸Potential Analysis Limita-tion
• 17% of Subject Race en-tries are “Not Specified.”
17.8% of stops (859) were missing race. These were not included in the analysis.
2. Subject Race/Ethnic-ity
🔸
3. Date of Incident ✔
UF3. What is the per capita rate of experi-encing police use of force?
1. Unique Identifier ✔
X Analysis Not Possible• 17% of Subject Race en-
tries are “Not Specified.”• Neither Street Address
Details nor Latitude/Lon-gitude were provided in the data.
Analysis conducted. This anal-ysis does not require location data (only an indication that these observations occurred within Seattle).
See UF2.
2. Subject Race/Ethnic-ity
🔸
3a. Street Address De-tails X
AND/OR
3b. Latitude/Longitude X
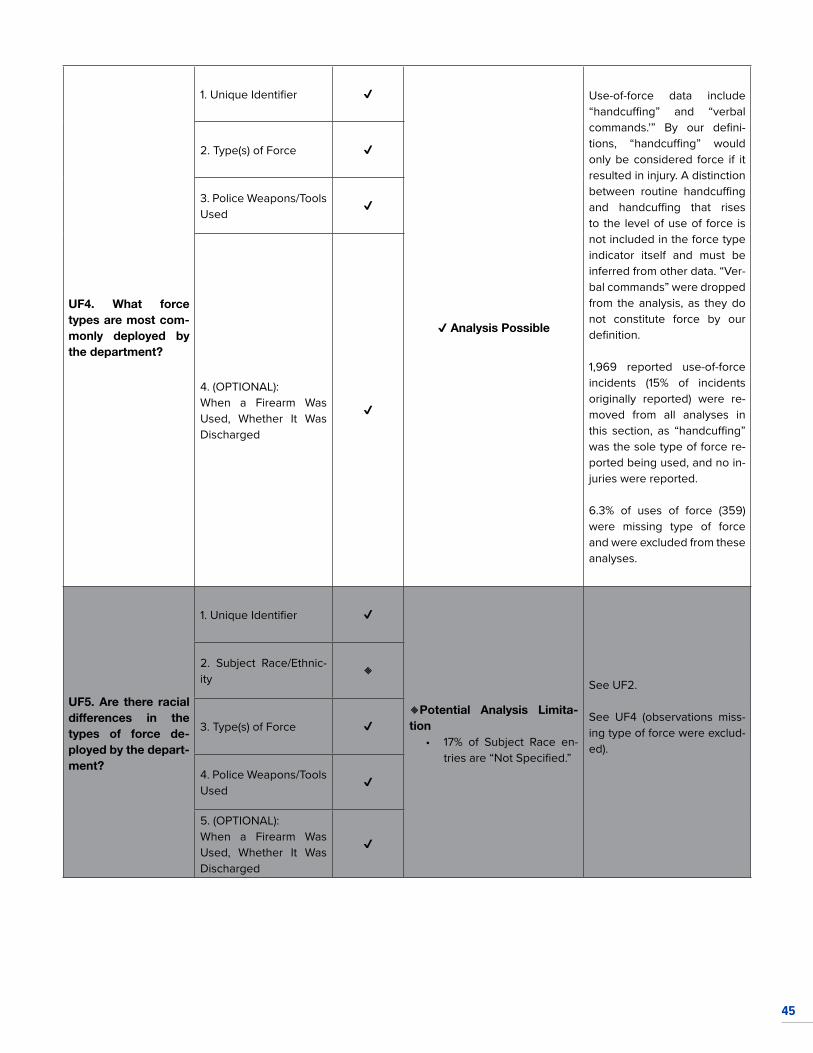
45
UF4. What force types are most com-monly deployed by the department?
1. Unique Identifier ✔
✔ Analysis Possible
Use-of-force data include “handcuffing” and “verbal commands.’” By our defini-tions, “handcuffing” would only be considered force if it resulted in injury. A distinction between routine handcuffing and handcuffing that rises to the level of use of force is not included in the force type indicator itself and must be inferred from other data. “Ver-bal commands” were dropped from the analysis, as they do not constitute force by our definition.
1,969 reported use-of-force incidents (15% of incidents originally reported) were re-moved from all analyses in this section, as “handcuffing” was the sole type of force re-ported being used, and no in-juries were reported.
6.3% of uses of force (359) were missing type of force and were excluded from these analyses.
2. Type(s) of Force ✔
3. Police Weapons/Tools Used
✔
4. (OPTIONAL):When a Firearm Was Used, Whether It Was Discharged
✔
UF5. Are there racial differences in the types of force de-ployed by the depart-ment?
1. Unique Identifier ✔
🔸Potential Analysis Limita-tion
• 17% of Subject Race en-tries are “Not Specified.”
See UF2.
See UF4 (observations miss-ing type of force were exclud-ed).
2. Subject Race/Ethnic-ity
🔸
3. Type(s) of Force ✔
4. Police Weapons/Tools Used
✔
5. (OPTIONAL):When a Firearm Was Used, Whether It Was Discharged
✔
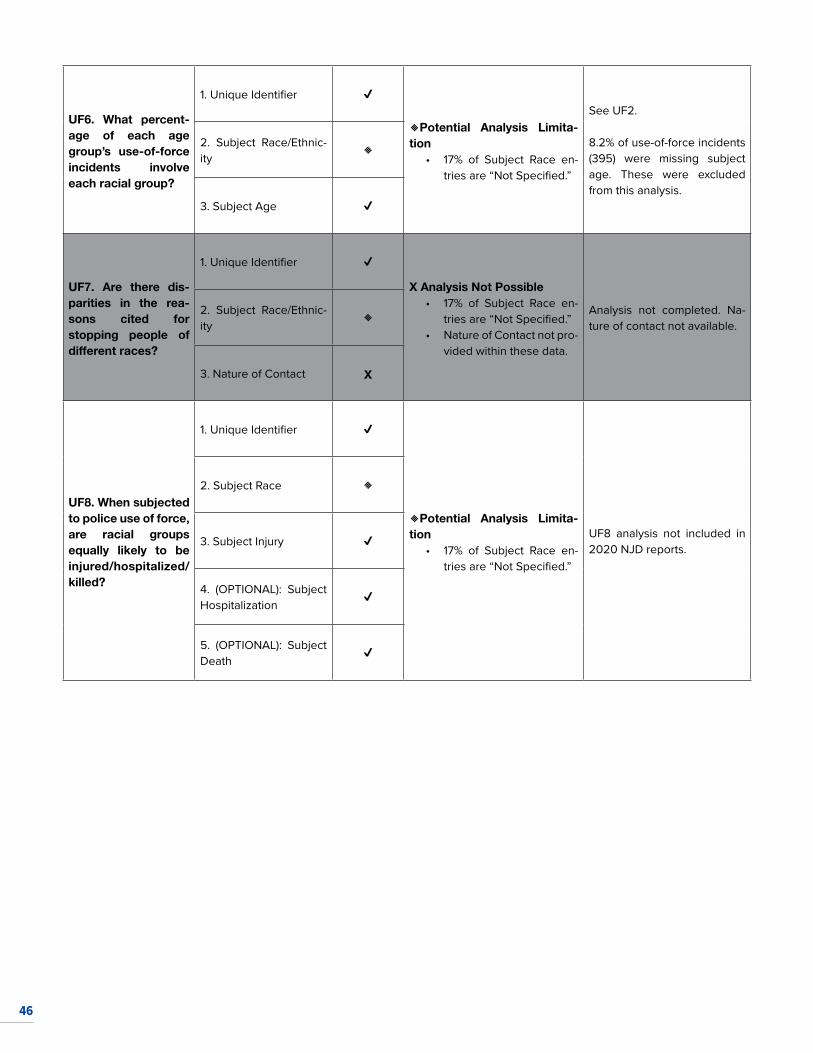
46
UF6. What percent-age of each age group’s use-of-force incidents involve each racial group?
1. Unique Identifier ✔
🔸Potential Analysis Limita-tion
• 17% of Subject Race en-tries are “Not Specified.”
See UF2.
8.2% of use-of-force incidents (395) were missing subject age. These were excluded from this analysis.
2. Subject Race/Ethnic-ity
🔸
3. Subject Age ✔
UF7. Are there dis-parities in the rea-sons cited for stopping people of different races?
1. Unique Identifier ✔
X Analysis Not Possible• 17% of Subject Race en-
tries are “Not Specified.”• Nature of Contact not pro-
vided within these data.
Analysis not completed. Na-ture of contact not available.
2. Subject Race/Ethnic-ity
🔸
3. Nature of Contact X
UF8. When subjected to police use of force, are racial groups equally likely to be injured/hospitalized/ killed?
1. Unique Identifier ✔
🔸Potential Analysis Limita-tion
• 17% of Subject Race en-tries are “Not Specified.”
UF8 analysis not included in 2020 NJD reports.
2. Subject Race 🔸
3. Subject Injury ✔
4. (OPTIONAL): Subject Hospitalization
✔
5. (OPTIONAL): Subject Death
✔
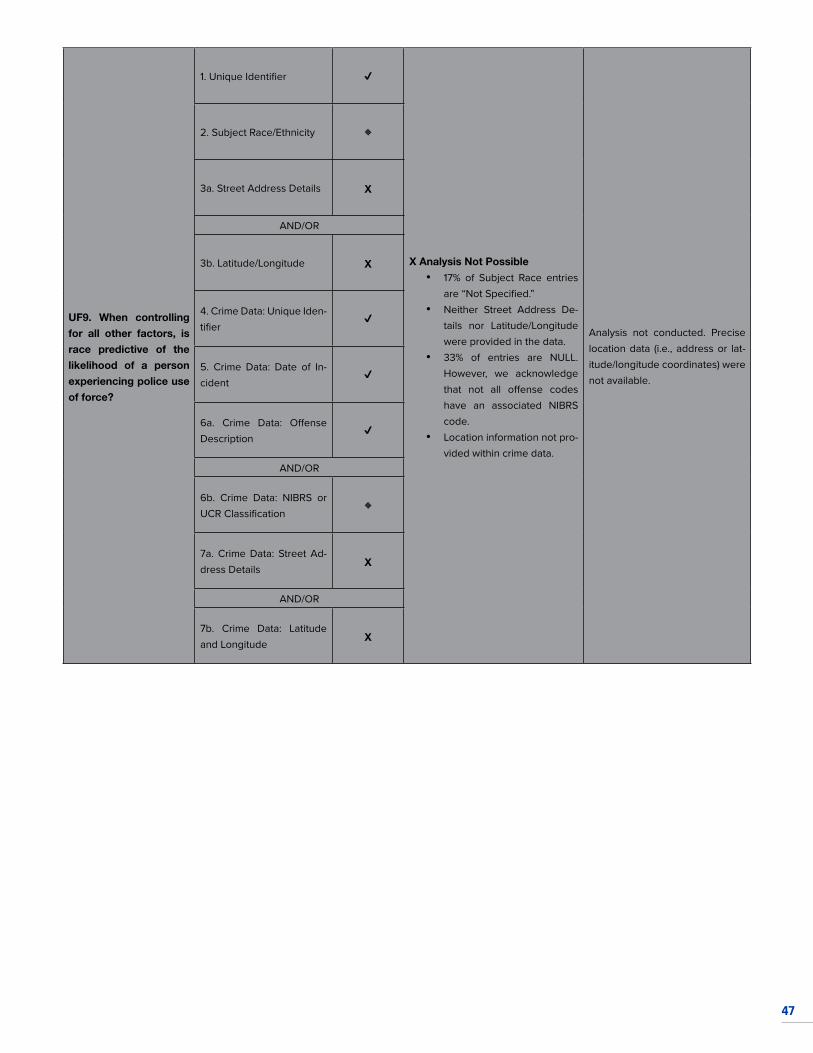
47
UF9. When controlling for all other factors, is race predictive of the likelihood of a person experiencing police use of force?
1. Unique Identifier ✔
X Analysis Not Possible• 17% of Subject Race entries
are “Not Specified.”• Neither Street Address De-
tails nor Latitude/Longitude were provided in the data.
• 33% of entries are NULL. However, we acknowledge that not all offense codes have an associated NIBRS code.
• Location information not pro-vided within crime data.
Analysis not conducted. Precise location data (i.e., address or lat-itude/longitude coordinates) were not available.
2. Subject Race/Ethnicity 🔸
3a. Street Address Details X
AND/OR
3b. Latitude/Longitude X
4. Crime Data: Unique Iden-tifier
✔
5. Crime Data: Date of In-cident
✔
6a. Crime Data: Offense Description
✔
AND/OR
6b. Crime Data: NIBRS or UCR Classification
🔸
7a. Crime Data: Street Ad-dress Details
X
AND/OR
7b. Crime Data: Latitude and Longitude
X
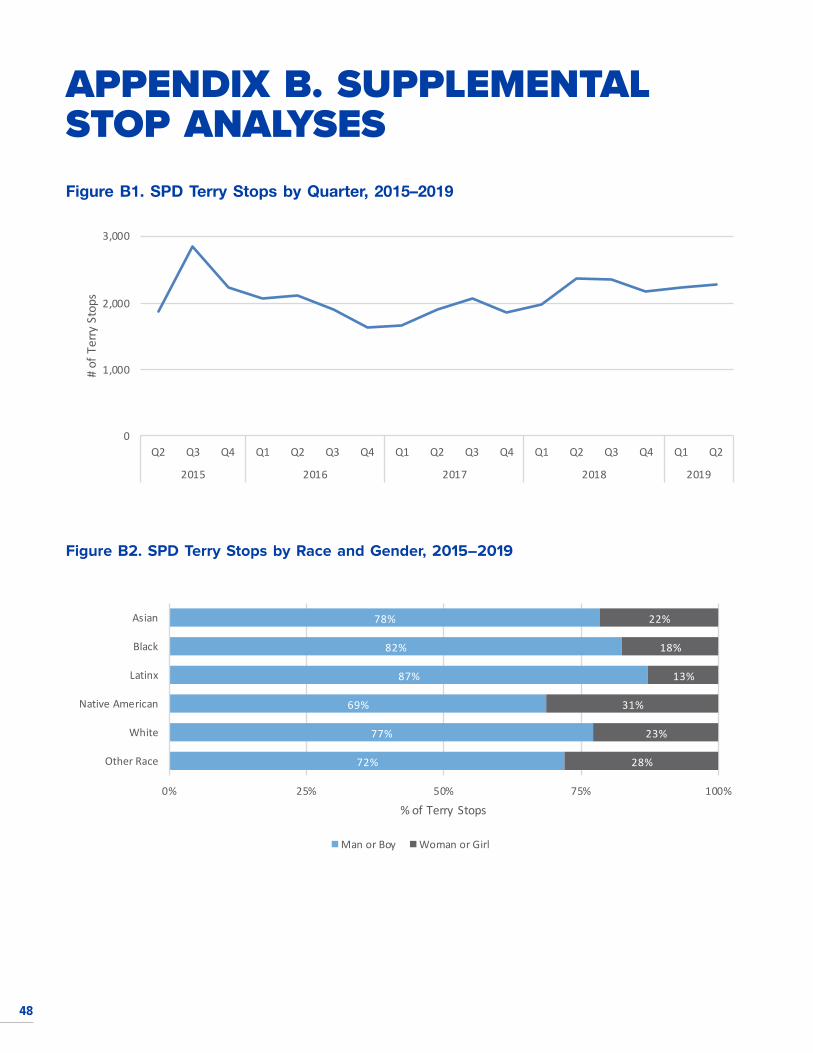
48
APPENDIX B. SUPPLEMENTAL STOP ANALYSES Figure B1. SPD Terry Stops by Quarter, 2015–2019
Figure B2. SPD Terry Stops by Race and Gender, 2015–2019
0
1,000
2,000
3,000
Q2 Q3 Q4 Q1 Q2 Q3 Q4 Q1 Q2 Q3 Q4 Q1 Q2 Q3 Q4 Q1 Q2
2015 2016 2017 2018 2019
# of
Ter
ry S
tops
Woman or Girl
72%
77%
69%
87%
82%
78%
28%
23%
31%
13%
18%
22%
0% 25% 50% 75% 100%
Other Race
White
Native American
Latinx
Black
Asian
% of Terry Stops
Man or Boy Woman or Girl
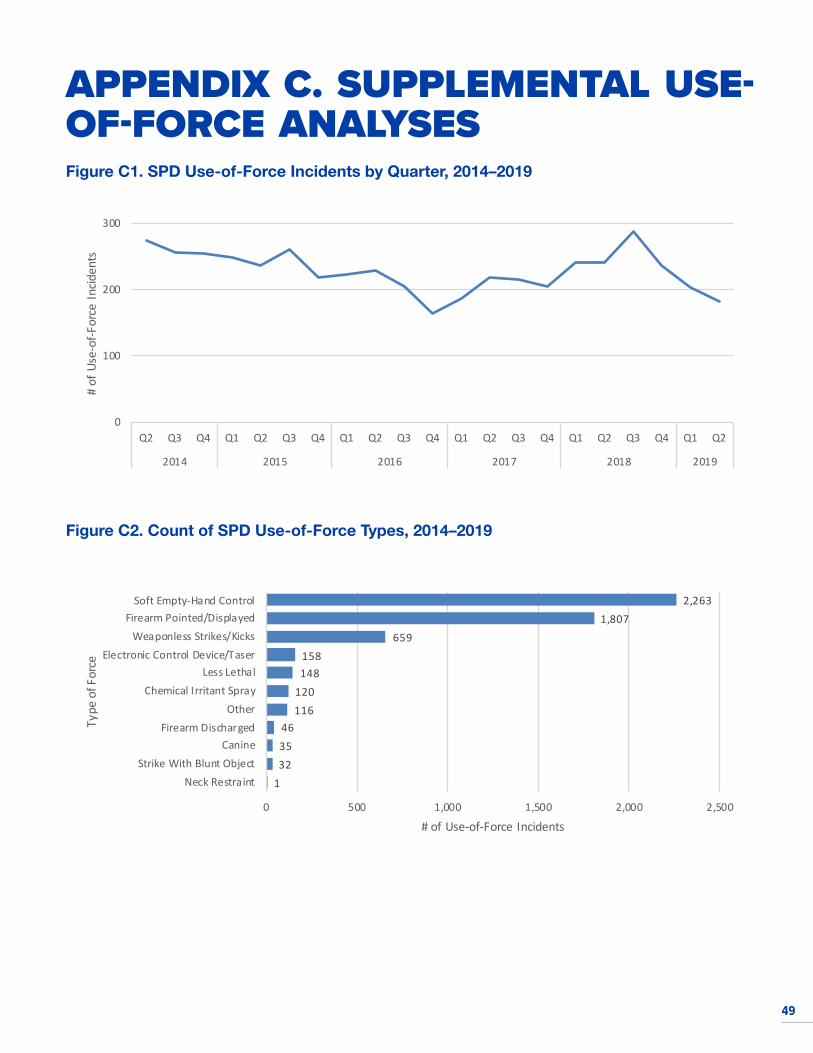
49
APPENDIX C. SUPPLEMENTAL USE-OF-FORCE ANALYSESFigure C1. SPD Use-of-Force Incidents by Quarter, 2014–2019
Figure C2. Count of SPD Use-of-Force Types, 2014–2019
0
100
200
300
Q2 Q3 Q4 Q1 Q2 Q3 Q4 Q1 Q2 Q3 Q4 Q1 Q2 Q3 Q4 Q1 Q2 Q3 Q4 Q1 Q2
2014 2015 2016 2017 2018 2019
# of
Use
-of-F
orce
Incid
ents
1323546
116120148158
6591,807
2,263
0 500 1,000 1,500 2,000 2,500
Neck RestraintStrike With Blunt Object
CanineFirearm Discharged
OtherChemical Irritant Spray
Less LethalElectronic Control Device/Taser
Weaponless Strikes/KicksFirearm Pointed/Displayed
Soft Empty-Hand Control
# of Use-of-Force Incidents
Type
of F
orce
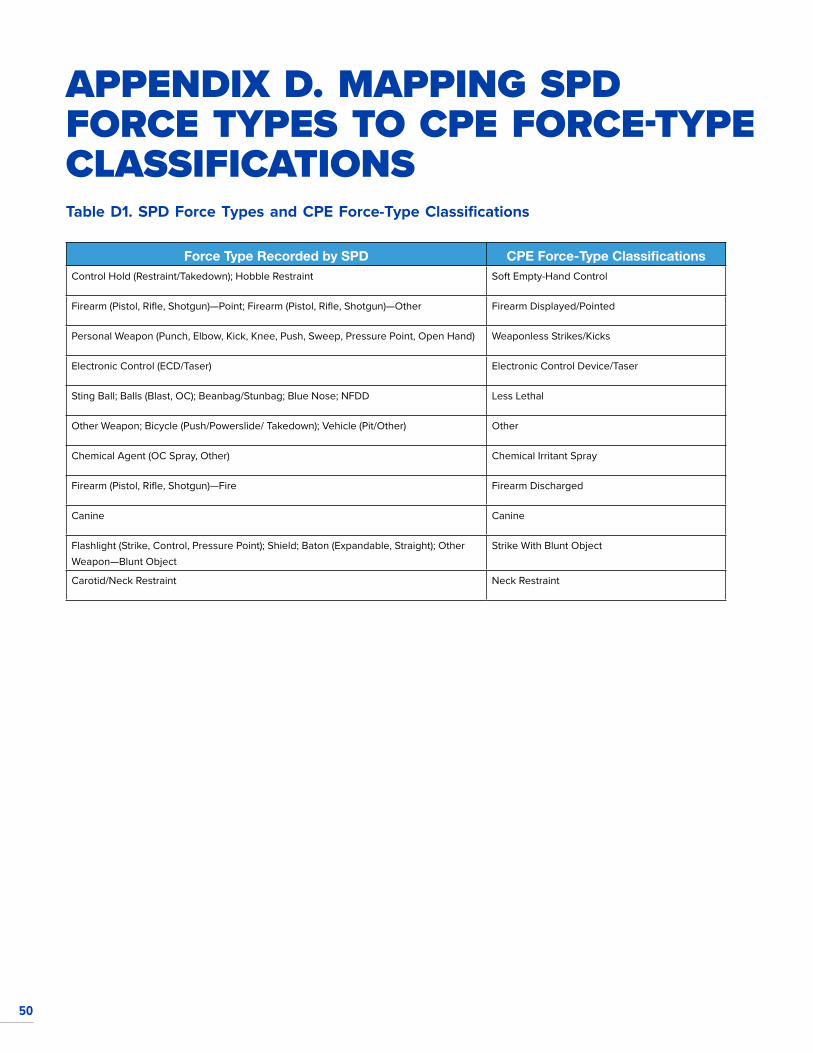
50
APPENDIX D. MAPPING SPD FORCE TYPES TO CPE FORCE-TYPE CLASSIFICATIONS Table D1. SPD Force Types and CPE Force-Type Classifications
Force Type Recorded by SPD CPE Force-Type ClassificationsControl Hold (Restraint/Takedown); Hobble Restraint Soft Empty-Hand Control
Firearm (Pistol, Rifle, Shotgun)—Point; Firearm (Pistol, Rifle, Shotgun)—Other Firearm Displayed/Pointed
Personal Weapon (Punch, Elbow, Kick, Knee, Push, Sweep, Pressure Point, Open Hand) Weaponless Strikes/Kicks
Electronic Control (ECD/Taser) Electronic Control Device/Taser
Sting Ball; Balls (Blast, OC); Beanbag/Stunbag; Blue Nose; NFDD Less Lethal
Other Weapon; Bicycle (Push/Powerslide/ Takedown); Vehicle (Pit/Other) Other
Chemical Agent (OC Spray, Other) Chemical Irritant Spray
Firearm (Pistol, Rifle, Shotgun)—Fire Firearm Discharged
Canine Canine
Flashlight (Strike, Control, Pressure Point); Shield; Baton (Expandable, Straight); Other Weapon—Blunt Object
Strike With Blunt Object
Carotid/Neck Restraint Neck Restraint