Embed Size (px)
Citation preview

THE SCIENCE OF JET
John Wesson
JET–R(99)13
“This document is intended for publication in the open literature. It is madeavailable on the understanding that it may not be further circulated andextracts may not be published prior to publication of the original, without theconsent of the Publications Officer, JET Joint Undertaking, Abingdon, Oxon,OX14 3EA, UK”.
“Enquiries about Copyright and reproduction should be addressed to thePublications Officer, JET Joint Undertaking, Abingdon, Oxon, OX14 3EA”.
i
FOREWORD
The idea of writing an account of the achievements of JET in a coherent way for a wider readership
arose a few years ago when it became clear that JET as a Joint Undertaking would end in 1999. I was
convinced that such a book, if well written, would serve an important purpose not only for JET but for
the European Fusion Community at large. I was therefore extremely pleased when John Wesson agreed
to attempt this difficult task immediately following his retirement, while the JET history was still fresh
in his mind. I am delighted that John has been able to complete the book in time for the farewell
celebrations of the Joint Undertaking and that his account makes such interesting reading.
The JET Project truly deserves to be remembered and honoured in this way. It is fair to say that
JET has been one of the most successful joint ventures in Europe, not only from a scientific point of
view but also as one of the most efficient organisations in Big Science. Here I would like to record our
debt to the founding fathers of JET: Donato Palumbo, the then Director of Fusion in the European
Commission, who used his great perseverance and immense diplomatic skill to steer this large project
through all obstacles to its approval in 1978. Hans-Otto Wüster, the first Director of JET, who successfully
set up the complex administrative, scientific and engineering structure of the project and fostered such
a splendid team spirit among its staff. And finally his successor as Director, Paul-Henri Rebut, who
must be remembered both for his vision and drive in the design and construction of this great machine
and for his contributions to its scientific success. They have all shown themselves to be men of great
foresight, courage and dedication.
JET has been a major step en route to a fusion reactor, linking the specialised medium size
tokamaks of the 70’s and 80’s to the Next Step (ITER) which calls for a plasma dominated by alpha
particle effects and maintained for 1000 seconds or steady state. With its D-shaped plasma cross-
section, which later was combined with a divertor, its plasma volume of 100 cubic metres, its plasma
current of several mega-amperes and its tritium and remote handling capabilities, the JET machine
broke completely new ground. As a result JET was able to take fusion research a large step forward,
bringing us to the point where the physics can be extrapolated to a reactor with confidence.
On a personal note I should add that I have felt truly privileged to be associated with scientists
and engineers from all over Europe working like a big close-knit family towards the common goal of
making the dream of controlled fusion become reality. Working with this team of dedicated and able
staff, both as physicist and Director, has certainly been the culmination of my professional career.
I hope that this book will communicate to many people inside and outside fusion some of the
scientific excitement that we experienced in bringing about the great success of this unique European
Joint Undertaking.
M. Keilhacker
November 1999

ii
iii
PREFACE
Can we produce useful power from the fusion of the nuclei of the light elements?.This question
has driven a massive international research effort which has now provided sufficient understanding
a allow the design of a fusion reactor. The research carried out on JET, the Joint European Torus,
which is the world’s largest fusion experiment, has received worldwide acclaim.Its success is
the result of the devotion of the scientists and engineers involved, their efforts.being repaid by
the excitement which comes from working at the frontiers of knowledge with an excellent
experimental facility which allows the discovery of new results.
Following the pattern of modern science, new results from the JET experiments were
quickly made available to other researchers at regular meetings and conferences. The more
important of the research papers finally appearing as articles in the scientific journals. Through
this process the results from JET are scattered over a variety of conference proceedings and
embedded in many bound volumes of journals. The purpose of the present book is to bring
together the contributions of those involved and to give a coherent account of the scientific
achievements from JET.
During the writing I have been asked many times, “for what type of reader is the book
intended?” It is not simple to answer this question because I have in mind different types of
readers.Firstly, I would like JET scientists themselves to find some satisfaction from seeing the
“JET story” put together. Then I would hope that newcomers to the subject will find it useful to
learn what has gone before. And finally it would be rewarding if the book found a wider readership
both inside and outside the fusion community.
In an attempt to fulfil this broad ambition the book starts with a simple introduction to
fusion research and progressively introduces the concepts required for an appreciation of the
scientific advances coming from JET. Thus the technical level increases with successive
chapters.After the introductory chapters we come to the early JET experiments, and these lead
to the core aspects of the research - stability, plasma confinement, interaction between the plasma
and the neighbouring material surfaces, and basic physics. In the penultimate chapter we reach
the high point - the production of the thermonuclear power. The final chapter then gives an
overview and assessment of the JET research, and measures the achievements against the aims
declared at the outset of the undertaking.
I do not know how it will appear to the reader but, as one who has been involved in the
research from the early days, I am very impressed by the progress made. Personally, I have
found encouragement in the confidence and dynamism of my colleagues and have been full of
admiration for the remarkable technical developments, the outstanding improvements in
diagnostic techniques, and the theoretical advances inspired by the experimental results, all of
which have contributed to the success of JET.My hope now is that fusion research will continue
with the same imaginative commitment.
iv
I must record my indebtedness to my colleagues. No matter what aspects of the work I was
dealing with, I was always able to turn to very helpful and knowledgeable experts in the JET
project to answer my questions. Many colleagues have read parts of the manuscript and detected
my errors.I would particularly like to mention those who read the whole draft and have given me
their advice - Roy Bickerton, Rob Felton, Alan Gibson, Chris Gowers, MartinK eilhacker,
MerviMantsinen, Phil Morgan and Paul Thomas. I must thank Lynda Lee for her patience and
care in typing the manuscript, and RogerBasto w for his help in preparing the large number of
figures. Finally, I am very much indebted to Stuart Morris for the skill and commitment he has
put into preparing the manuscript for printing.
JET, Oxfordshire, England
November 1999 JOHN WESSON
v
CONTENTS
1. Bringing the sun to earth 1
2. Some plasma physics 9
3. Tokamaks 13
4. JET - quite a step 21
5. The construction 29
6. And now experiments 37
7. The scientific spring 43
8. JET plasmas 51
9. Towards a reactor 77
10. Stability and instability 81
11. Confining the plasma 101
12. Handling the power 123
13. Basic physics 141
14. Fusion power 153
15. Success 165
Appendix I The chronology of JET 172
Appendix II Team lists 175

vi
vii
UNITS
The system of units used is m.k.s. Following the convention generally accepted in the subject,
temperatures are written either in joules or in eV (or keV). Thus in place of the conventional kT°(where k is Boltzmann’s constant and T° is in degrees Kelvin) we write T (joules), so that
T°= T (joules)/1.381 × 10–23. The temperature in electron-volts is defined by the potential
difference in volts through which an electron must fall to acquire an energy T, that is
T(eV)=T(joules)/e w here e is the electronic charge. Thus T(eV) = T(joules)/1.602 × 10–19.
Whenever the temperature given is in eV this is explicitly stated.

viii
1
1. BRINGING THE SUN TO EARTH
JET came into operation in 1983, its purpose being to make a substantial step in the search for a
means of obtaining power from nuclear fusion. It had been preceded by a world-wide exploration
of the subject which began in the late 1940s. However, the story starts a century earlier with the
problem of understanding the sun.
Mankind had always recognised that it owed its survival to the continuous supply of heat and
light inexplicably provided by the sun, but the mystery of this provision deepened with the
discovery of the law of the conservation of energy. This law meant that the energy radiated by
the sun had to be accounted for in terms of an energy source. What could it be?
It is easy to calculate the magnitude of the problem. The power received at the earth is
1.4kilowatts per square metre. Since the sun radiates uniformly in all directions we can calculate
the total power emitted by the sun by multiplying this figure by the area of a spherearound the
sun, passing through the earth. The radius of this sphere is the distance ofthe ear th from the sun,
150 million kilometres, and so the area of our sphere (4πr2) is 2.8 ×10 23 square metres.
Multiplying by 1.4 kilowatts per square metre gives the total power, 4 × 10²³ kilowatts. When
we recall that a typical electricity generating plant produces around 106 kilowatts we recognise
that the magnitude of the sunÕs output is difficult to conceive.
In the nineteenth century physicists must have been very concerned about the need to
provide an answer to this very obvious problem. The only sources of energy they had to call on
were chemical energy and gravitational energy. Let us look at these in turn.
In the case of chemical energy it is easy to take a typical fuel, coal say, and imagine it to
burn in an oxygen atmosphere. Coal and oxygen have a calorific value of about 10 megajoules
per kilogram, and since the mass of the sun was known from its gravitational attraction to be
2 ×10 30 kilograms, the maximum energy available from such a source would be 2 ×10 31
megajoules. How long would this last at the observed power output of the sun? Dividing the
energy by the power output of 4 × 10²⁰ megawatts gives a time of 5 × 10¹⁰ seconds, which is
about 1,600 years. The biologists believed that evolutionary timescales implied that the earth
had existed in essentially the same state for hundreds of millions of years, and the geologists
thought the age of the earth was likely to be measured in billions of years. A few thousand years
would not do.
The idea of gravitational collapse is that in a contraction of the sun each spherical shell
within the sun would move inward under the gravitational force of the mass enclosed by the
shell. The work done by this force is then available as heat. If the total power released by such a
contraction is equated to the sunÕs heat output it gives a required rate of contraction. This
calculation was carried out by Lord Kelvin and by Helmholtz. The problem was that when the
contraction was extrapolated back in time, it only provided the requisite power for tens of millions
2
of years. Furthermore, going back for such a time, the sun would have been so large it would
have enveloped the earth. Again this was in conflict with the evidence of the earthÕs antiquity. As
the years passed the problem of the sunÕs energy source remained unsolved.
With the development of relativity and nuclear physics in the first two decades of the
twentieth century the necessary tools for constructing a satisfactory theory became available,
and they were used by Sir Arthur Eddington to guide the thinking toward a solution of the
problem. In the 1920s Eddington came to see the sun, and similar stars, as a sphere of hot gas
mainly composed of hydrogen. The temperature necessary for the pressure of the gas to balance
the inward gravitational forces was around 15 million degrees Kelvin. Eddington conjectured
that under these conditions it would be possible for hydrogen nuclei to fuse together, and that if
they formed a helium nucleus energy would be released. By that time it was realised that a
helium nucleus has less mass than four hydrogen atoms, and relativity predicts that the
mass loss ∆m would be converted into an energy E = ∆mc2, where c is the velocity of light.
Although uncertainties remained Eddington was basically correct. His ideas were given a
firm theoretical basis by Hans Bethe who, in 1939, showed that various nuclear processes were
possible, depending on the precise conditions. In the sun the dominant process starts from
hydrogen nuclei, which are simply protons, and proceeds in three stages. In the first stage two
protons fuse, releasing a positron and forming a deuteron. This is an extremely slow process, but
once the deuteron is formed it lasts only a few seconds before a further proton is added to form
the light isotope of helium, He3. The He3 nuclei then wait on average for about a million years
before two of them fuse to form He4 with the release of two protrons.
The total energy released in this sequence of reactions is 6 × 10⁸ megajoules per kilogram
of hydrogen. This is about 60 million times the energy per kilogram available from chemical
fuels.
The realisation that the fusion of light elements could release nuclear energy provided the
basis for inventive minds to search for a practical way of producing power.
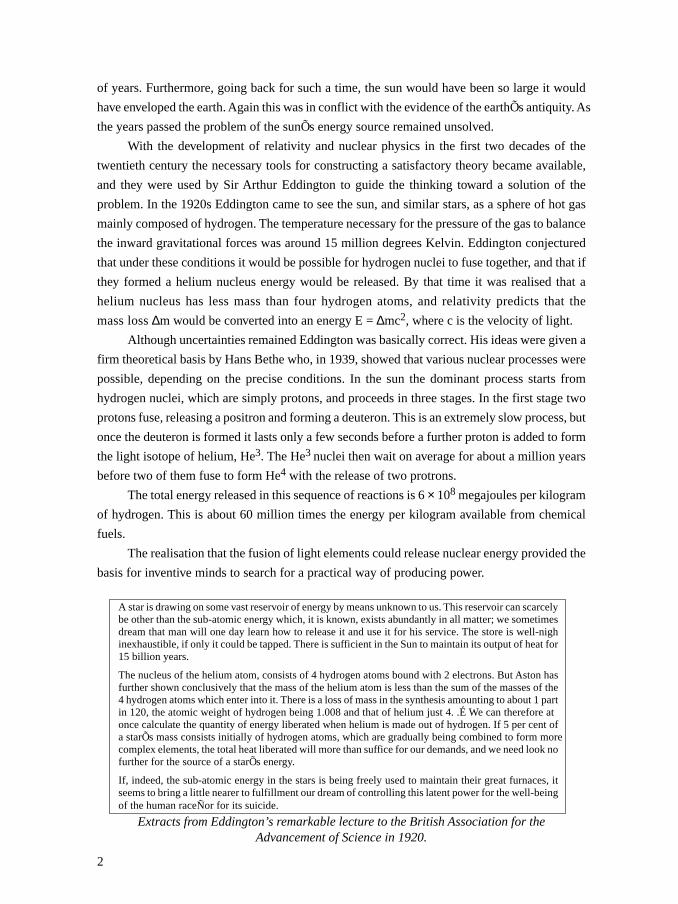
A star is drawing on some vast reservoir of energy by means unknown to us. This reservoir can scarcelybe other than the sub-atomic energy which, it is known, exists abundantly in all matter; we sometimesdream that man will one day learn how to release it and use it for his service. The store is well-nighinexhaustible, if only it could be tapped. There is sufficient in the Sun to maintain its output of heat for15 billion years.
The nucleus of the helium atom, consists of 4 hydrogen atoms bound with 2 electrons. But Aston hasfurther shown conclusively that the mass of the helium atom is less than the sum of the masses of the4 hydrogen atoms which enter into it. There is a loss of mass in the synthesis amounting to about 1 partin 120, the atomic weight of hydrogen being 1.008 and that of helium just 4. .É We can therefore atonce calculate the quantity of energy liberated when helium is made out of hydrogen. If 5 per cent ofa starÕs mass consists initially of hydrogen atoms, which are gradually being combined to form morecomplex elements, the total heat liberated will more than suffice for our demands, and we need look nofurther for the source of a starÕs energy.
If, indeed, the sub-atomic energy in the stars is being freely used to maintain their great furnaces, itseems to bring a little nearer to fulfillment our dream of controlling this latent power for the well-beingof the human raceÑor for its suicide.
Extracts from Eddington’s remarkable lecture to the British Association for theAdvancement of Science in 1920.
3
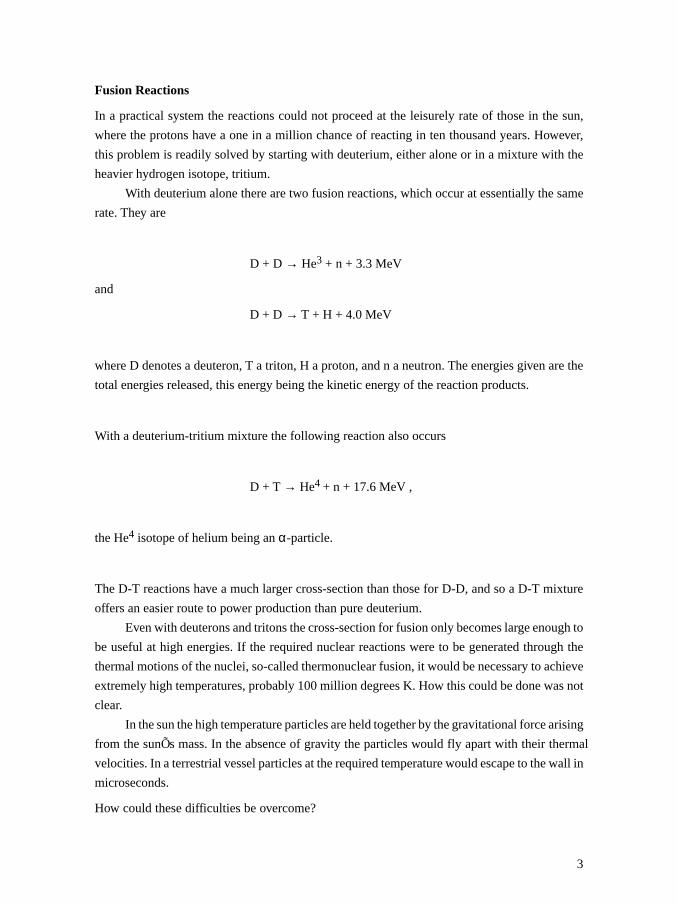
Fusion Reactions
In a practical system the reactions could not proceed at the leisurely rate of those in the sun,
where the protons have a one in a million chance of reacting in ten thousand years. However,
this problem is readily solved by starting with deuterium, either alone or in a mixture with the
heavier hydrogen isotope, tritium.
With deuterium alone there are two fusion reactions, which occur at essentially the same
rate. They are
D + D → He3 + n + 3.3 MeV
and
D + D → T + H + 4.0 MeV
where D denotes a deuteron, T a triton, H a proton, and n a neutron. The energies given are the
total energies released, this energy being the kinetic energy of the reaction products.
With a deuterium-tritium mixture the following reaction also occurs
D + T → He4 + n + 17.6 MeV ,
the He4 isotope of helium being an α-particle.
The D-T reactions have a much larger cross-section than those for D-D, and so a D-T mixture
offers an easier route to power production than pure deuterium.
Even with deuterons and tritons the cross-section for fusion only becomes large enough to
be useful at high energies. If the required nuclear reactions were to be generated through the
thermal motions of the nuclei, so-called thermonuclear fusion, it would be necessary to achieve
extremely high temperatures, probably 100 million degrees K. How this could be done was not
clear.
In the sun the high temperature particles are held together by the gravitational force arising
from the sunÕs mass. In the absence of gravity the particles would fly apart with their thermal
velocities. In a terrestrial vessel particles at the required temperature would escape to the wall in
microseconds.
How could these difficulties be overcome?
4
Plasmas and Magnetic Fields
If the temperature of a gas is raised above about 10,000K virtually all of the atoms become
ionised, with electrons becoming separated from their nuclei. The resulting ions and electrons
then form two intermixed fluids. However, the electrostatic attraction between their positive and
negative charges is so strong that only small charge imbalances are allowed. The result is that
the ionised gas remains almost neutral throughout. This constitutes a fourth state of matter called
a plasma. We shall see later that a plasma has some of the properties of other states of matter, but
also exhibits a wide range of unique features. Fusion research has been largely aimed at
understanding very high temperature plasmas, and the subsequent chapters will relate the
discoveries that have been made.
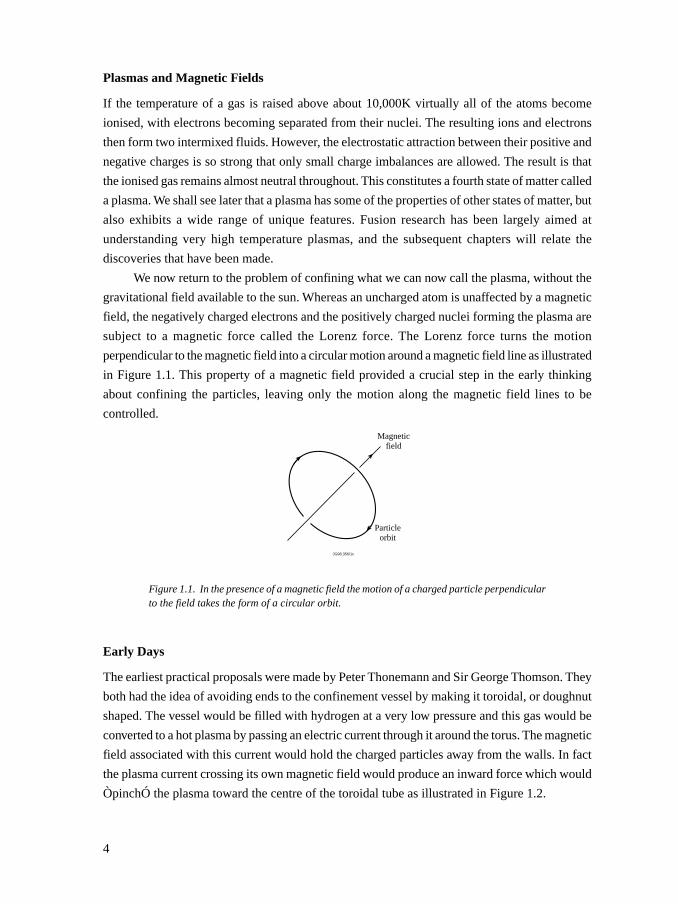
We now return to the problem of confining what we can now call the plasma, without the
gravitational field available to the sun. Whereas an uncharged atom is unaffected by a magnetic
field, the negatively charged electrons and the positively charged nuclei forming the plasma are
subject to a magnetic force called the Lorenz force. The Lorenz force turns the motion
perpendicular to the magnetic field into a circular motion around a magnetic field line as illustrated
in Figure 1.1. This property of a magnetic field provided a crucial step in the early thinking
about confining the particles, leaving only the motion along the magnetic field lines to be
controlled.
Figure 1.1. In the presence of a magnetic field the motion of a charged particle perpendicularto the field takes the form of a circular orbit.
Early Days
The earliest practical proposals were made by Peter Thonemann and Sir George Thomson. They
both had the idea of avoiding ends to the confinement vessel by making it toroidal, or doughnut
shaped. The vessel would be filled with hydrogen at a very low pressure and this gas would be
converted to a hot plasma by passing an electric current through it around the torus. The magnetic
field associated with this current would hold the charged particles away from the walls. In fact
the plasma current crossing its own magnetic field would produce an inward force which would
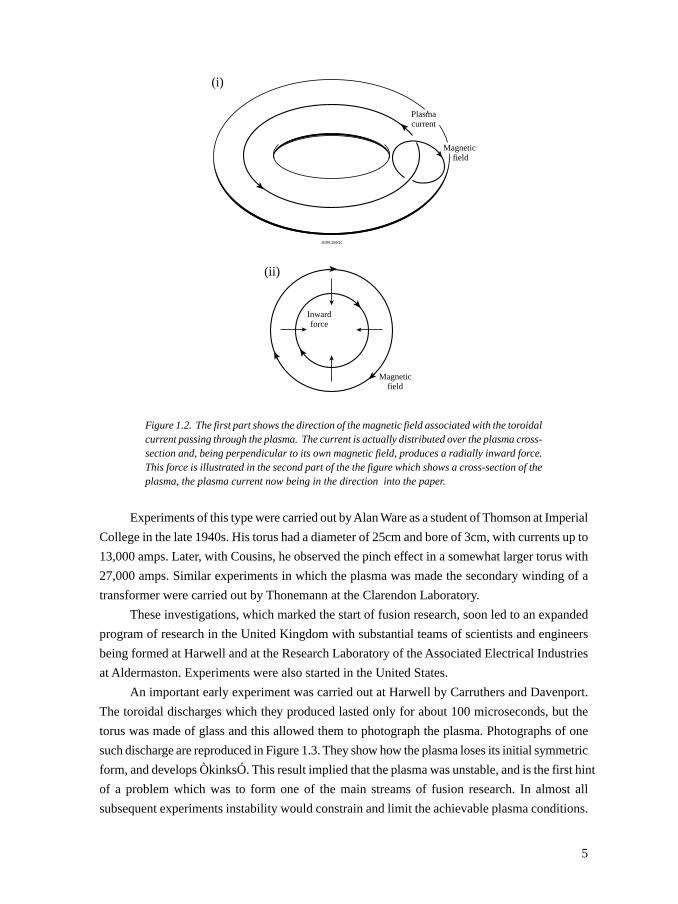
ÒpinchÓ the plasma toward the centre of the toroidal tube as illustrated in Figure 1.2.
Magneticfield
Particleorbit
JG98.356/1c
5
Figure 1.2. The first part shows the direction of the magnetic field associated with the toroidalcurrent passing through the plasma. The current is actually distributed over the plasma cross-section and, being perpendicular to its own magnetic field, produces a radially inward force.This force is illustrated in the second part of the the figure which shows a cross-section of theplasma, the plasma current now being in the direction into the paper.
Experiments of this type were carried out by Alan Ware as a student of Thomson at Imperial
College in the late 1940s. His torus had a diameter of 25cm and bore of 3cm, with currents up to
13,000 amps. Later, with Cousins, he observed the pinch effect in a somewhat larger torus with
27,000 amps. Similar experiments in which the plasma was made the secondary winding of a
transformer were carried out by Thonemann at the Clarendon Laboratory.
These investigations, which marked the start of fusion research, soon led to an expanded
program of research in the United Kingdom with substantial teams of scientists and engineers
being formed at Harwell and at the Research Laboratory of the Associated Electrical Industries
at Aldermaston. Experiments were also started in the United States.
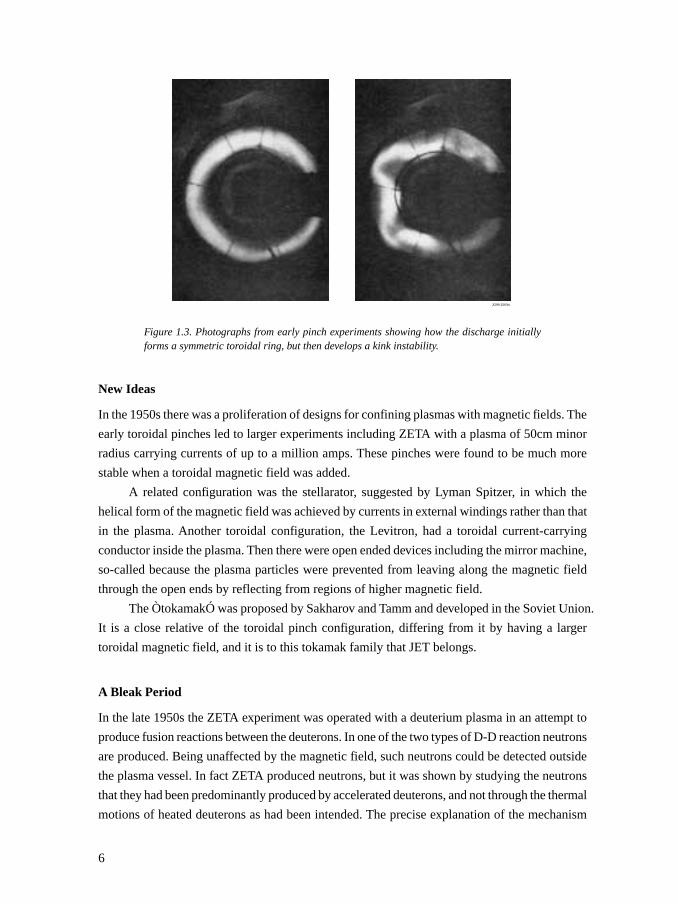
An important early experiment was carried out at Harwell by Carruthers and Davenport.
The toroidal discharges which they produced lasted only for about 100 microseconds, but the
torus was made of glass and this allowed them to photograph the plasma. Photographs of one
such discharge are reproduced in Figure 1.3. They show how the plasma loses its initial symmetric
form, and develops ÒkinksÓ. This result implied that the plasma was unstable, and is the first hint
of a problem which was to form one of the main streams of fusion research. In almost all
subsequent experiments instability would constrain and limit the achievable plasma conditions.
Magneticfield
JG99.156/1c
Inwardforce
(ii)
(i)
Magnetic field
Plasmacurrent
6
Figure 1.3. Photographs from early pinch experiments showing how the discharge initiallyforms a symmetric toroidal ring, but then develops a kink instability.
New Ideas
In the 1950s there was a proliferation of designs for confining plasmas with magnetic fields. The
early toroidal pinches led to larger experiments including ZETA with a plasma of 50cm minor
radius carrying currents of up to a million amps. These pinches were found to be much more
stable when a toroidal magnetic field was added.
A related configuration was the stellarator, suggested by Lyman Spitzer, in which the
helical form of the magnetic field was achieved by currents in external windings rather than that
in the plasma. Another toroidal configuration, the Levitron, had a toroidal current-carrying
conductor inside the plasma. Then there were open ended devices including the mirror machine,
so-called because the plasma particles were prevented from leaving along the magnetic field
through the open ends by reflecting from regions of higher magnetic field.
The ÒtokamakÓ was proposed by Sakharov and Tamm and developed in the Soviet Union.
It is a close relative of the toroidal pinch configuration, differing from it by having a larger
toroidal magnetic field, and it is to this tokamak family that JET belongs.
A Bleak Period
In the late 1950s the ZETA experiment was operated with a deuterium plasma in an attempt to
produce fusion reactions between the deuterons. In one of the two types of D-D reaction neutrons
are produced. Being unaffected by the magnetic field, such neutrons could be detected outside
the plasma vessel. In fact ZETA produced neutrons, but it was shown by studying the neutrons
that they had been predominantly produced by accelerated deuterons, and not through the thermal
motions of heated deuterons as had been intended. The precise explanation of the mechanism
JG99.156/4c
7
has never come to light, but the non-thermonuclear origin of the neutrons certainly cast a shadow
over the results.
A wide variety of configurations was explored in the 1960s, but the outcome was not
encouraging. Each confinement system was found to be subject to instabilities, which either
destroyed the configuration or led to a deterioration of the plasma confinement.
It is probable that the gloom of this period was not really justified. The expectation had
been of rapid progress and it took some time to adjust to the longer timescale required to reach
a thermonuclear reactor.
The way forward was shown by the tokamak experiments. Having a higher toroidal magnetic
field for a given plasma current, this configuration precludes the worst instabilities of the pinch,
and allows a comparatively quiescent plasma. In addition, the interaction of the plasma with the
wall was carefully controlled. By the late 1960s the Soviet tokamak programme, under the
guidance of Lev Artsimovitch, had started to produce impressive results, including the
achievement of temperatures around 10 million K.
We shall return to the development of tokamaks, and the JET experiment, shortly but first
we need to take a little time to look at some basic plasma physics.
Bibliography
It was clear to the pioneers that there were difficult problems to be solved if useful thermonuclear
power was to be achieved. The required temperature alone seemed formidable. In 1949 Gamow and
Critchfield, in their book on the Atomic Nucleus and Nuclear Energy Sources, expressed the opinion
that ÒIt goes without saying that the problem of obtaining such high temperatures
[10 million degrees] on earth is of almost unsurpassable technical difficultyÓ (page 268).
The early history of scientific developments is rarely straightforward, and fusion research is no
different. Reasonable claims to early contributions can be made by a number of people. However, the
first reported directly relevant experiment seems to be that by Cousins and Ware at Imperial College.
Their paper, which reports toroidal experiments with evidence of the pinch effect, is in the Proceedings
of the Physical Society, B64, 159 (1951). The photographs of instabilities by Carruthers and
Davenport shown in Figure 1.3 are from the Proceedings of the Physical Society B70, 49 (1957).
Until 1958 the main experimental work was secret. The opening up of the subject in January
of that year was marked by the publication in Nature of the experimental work by several groups,
most notably that working on ZETA. In the following year a United Nations Conference in
Geneva brought together a large variety of Òstate of the artÓ developments from several countries.
These are published in the Proceedings of the Second United Nations Conference of the Peaceful
Uses of Atomic Energy, Volumes 31 and 32 (1959). From then onwards international collaboration
was to be an outstanding feature of fusion research.

8
9
2. SOME PLASMA PHYSICS
As already described, if a gas is heated sufficiently the force binding the electrons in the atoms
is overcome and electrons are separated from the atom. The remaining atom is deficient in
electrons and forms a positive ion. For any species of atom there will be a plasma temperature
above which all the atoms have lost an electron, and the gas is then said to be fully ionised. In the
case of the hydrogen isotopes, hydrogen, deuterium and tritium, the atom has only one electron,
and consequently they become fully ionised at a comparatively low temperature.
The plasma can be thought of in two basic ways, both of which are useful. In the first we
can ask how individual electrons and ions behave. In particular it is of great importance that
their motion is dominated by the effect of a magnetic field. The second way is to regard the
electrons and ions as forming fluids. The electron and ion fluids then have their separate
temperatures and pressures. They also have other properties familiar from normal gases, such as
viscosity and thermal conductivity. It is sometimes convenient to think of the electrons and ions
as jointly forming a single fluid and, in particular, the single fluid model provides the simplest
approach to analysing stability.
Before looking at the specific properties of the plasma it is useful to obtain some feel for
the magnitudes involved with the plasmas of interest.
The plasma densities are most easily appreciated by a comparison with the density of
molecules in the atmosphere. This is about 3 × 1025 molecules per cubic metre. The plasmas we
shall discuss will have electron and ion densities of a few times 1019 per cubic metre. That is, the
densities are about one millionth of the atmospheric density. The mass density is correspondingly
small. Whereas a cubic metre of air weighs roughly a kilogram, a typical JET plasma, with a
volume of 100 cubic metres, weighs only as much as a postage stamp.
The required temperatures on the other hand are impressively high, higher than at the
centre of the sun. They need to be high because the rate at which the desired fusion reactions
occur is very low at low temperatures. The target temperature for a fusion reactor is in the range
100-200 million degrees. At such temperatures the reaction rate for a deuterium - tritium mixture
is 40,000 times higher than at “only” 10 million degrees.
The temperature of the plasma is just a simple way of describing the average kinetic energy
of the particles. Knowing the temperature we can straightforwardly calculate the thermal energy,1/2 mv2, of the particles. Electrons and ions at the same temperature have the same energy but,
because the electrons have a much smaller mass, this corresponds to a much higher velocity for
the electrons. At 100 million degrees deuterons have a thermal velocity of 600 kilometres per
second, and electrons have a velocity 40,000 kilometres per second, more than one tenth of the
speed of light.
It is traditional and convenient to give plasma temperatures in electron volts, eV, or kilo-
electron volts, keV. The electron volt is defined as the energy an electron would receive in
10
falling through an electric potential of one volt. The conversion is given by 1eV = 11,600 K, and
for present purposes it is adequate to think of 100 million degrees as 10 keV. From here on we
shall use the eV notation.
The Effect of a Magnetic Field
The behaviour of charged particles in a magnetic field is fundamental to our subject. In a uniform
magnetic field the motion of a charged particle has two parts. Firstly, it has a circular motion
perpendicular to the magnetic field, the radius of the circle being called the Larmor radius. This
radius increases with the energy of the particle and decreases with the strength of the magnetic
field. For a typical ion in a JET plasma the Larmor radius is a few millimetres. For an electron
the Larmor radius is smaller by the square root of the electron-ion mass ratio and is typically a
tenth of a millimetre. Because of the opposite signs of their charges the electrons and ions circulate
in opposite directions.
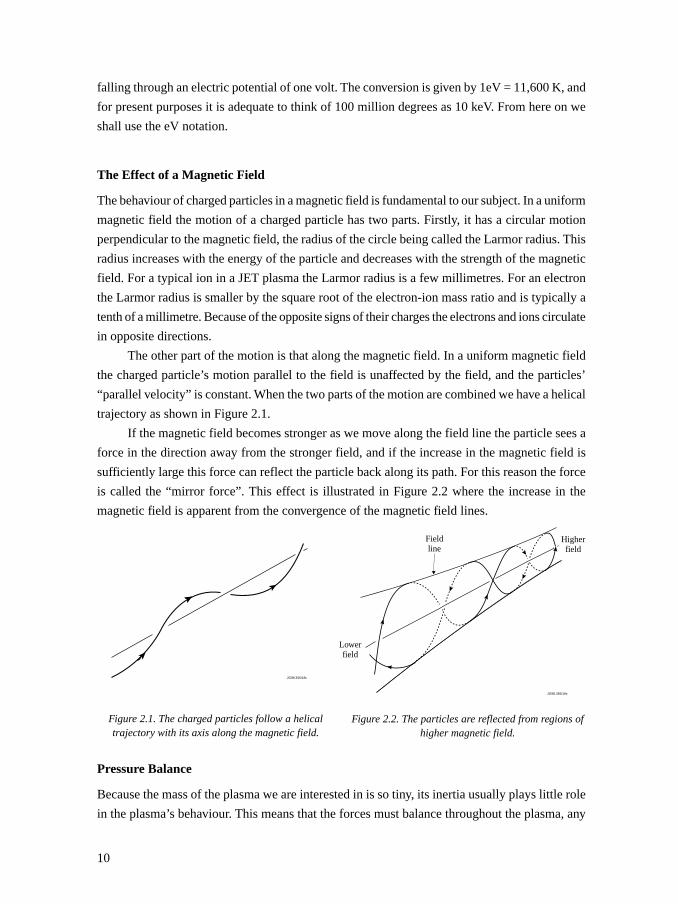
The other part of the motion is that along the magnetic field. In a uniform magnetic field
the charged particle’s motion parallel to the field is unaffected by the field, and the particles’
“parallel velocity” is constant. When the two parts of the motion are combined we have a helical
trajectory as shown in Figure 2.1.
If the magnetic field becomes stronger as we move along the field line the particle sees a
force in the direction away from the stronger field, and if the increase in the magnetic field is
sufficiently large this force can reflect the particle back along its path. For this reason the force
is called the “mirror force”. This effect is illustrated in Figure 2.2 where the increase in the
magnetic field is apparent from the convergence of the magnetic field lines.
Pressure Balance
Because the mass of the plasma we are interested in is so tiny, its inertia usually plays little role
in the plasma’s behaviour. This means that the forces must balance throughout the plasma, any
Lowerfield
Fieldline
Higherfield
JG98.356/19c
JG98.356/18c
Figure 2.1. The charged particles follow a helicaltrajectory with its axis along the magnetic field.
Figure 2.2. The particles are reflected from regions ofhigher magnetic field.
11
imbalance being removed by a rapid adjustment.
In a steady equilibrium, the two forces which balance are the gradient of the plasma pressure
and the magnetic force which arises from the current crossing the magnetic field. This magnetic
force is just that which drives an electric motor. The magnetic force is perpendicular to both the
current and the magnetic field, and consequently its component along the magnetic field is zero.
This means that there can be no plasma pressure force along the magnetic field, and consequently
the plasma adjusts to have a constant pressure along each field line.
The magnetic force can also be thought of as a magnetic pressure. In the simple case of
straight magnetic field lines a magnetic field of strength B has a pressure B2/2µo where µo is a
constant equal to 4π × 10−7 in Standard International units. A gradient in B2/2µo has the same
effect as a gradient in plasma pressure. However, the magnetic force is more subtle because, in
addition to the simple B2/2µo pressure, any curvature of the magnetic field lines contributes an
extra force in the direction of the centre of curvature, and this must be included in the force balance.
Collisions
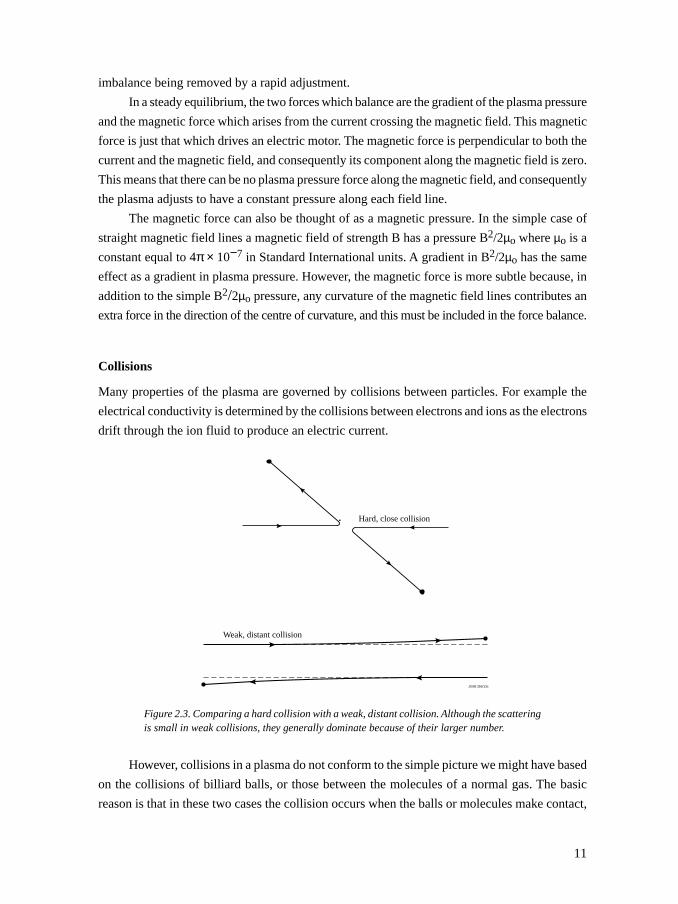
Many properties of the plasma are governed by collisions between particles. For example the
electrical conductivity is determined by the collisions between electrons and ions as the electrons
drift through the ion fluid to produce an electric current.
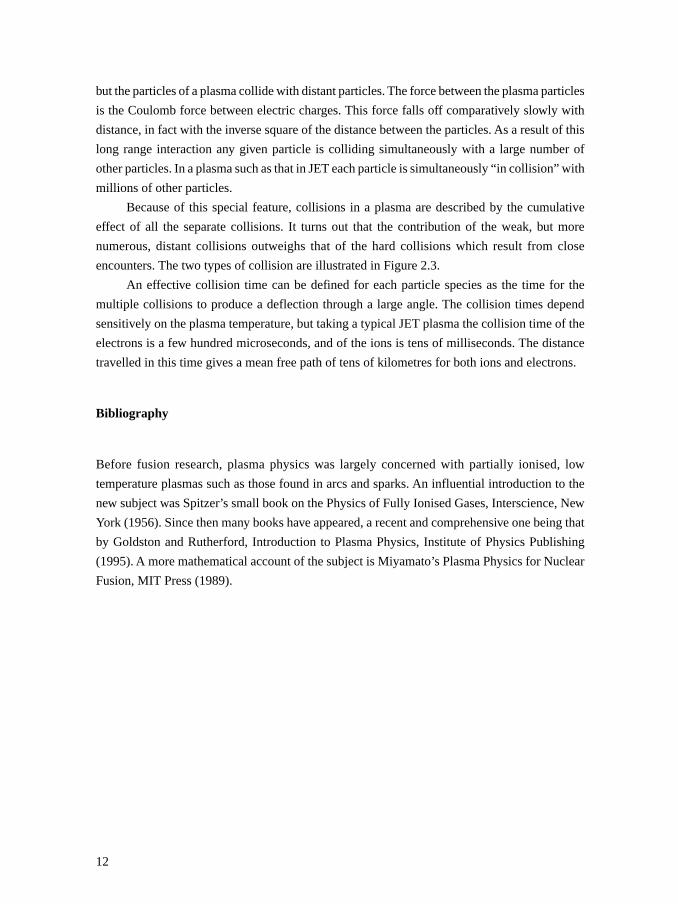
Figure 2.3. Comparing a hard collision with a weak, distant collision. Although the scatteringis small in weak collisions, they generally dominate because of their larger number.
However, collisions in a plasma do not conform to the simple picture we might have based
on the collisions of billiard balls, or those between the molecules of a normal gas. The basic
reason is that in these two cases the collision occurs when the balls or molecules make contact,
JG98.356/13c
Hard, close collision
Weak, distant collision
12
but the particles of a plasma collide with distant particles. The force between the plasma particles
is the Coulomb force between electric charges. This force falls off comparatively slowly with
distance, in fact with the inverse square of the distance between the particles. As a result of this
long range interaction any given particle is colliding simultaneously with a large number of
other particles. In a plasma such as that in JET each particle is simultaneously “in collision” with
millions of other particles.
Because of this special feature, collisions in a plasma are described by the cumulative
effect of all the separate collisions. It turns out that the contribution of the weak, but more
numerous, distant collisions outweighs that of the hard collisions which result from close
encounters. The two types of collision are illustrated in Figure 2.3.
An effective collision time can be defined for each particle species as the time for the
multiple collisions to produce a deflection through a large angle. The collision times depend
sensitively on the plasma temperature, but taking a typical JET plasma the collision time of the
electrons is a few hundred microseconds, and of the ions is tens of milliseconds. The distance
travelled in this time gives a mean free path of tens of kilometres for both ions and electrons.
Bibliography
Before fusion research, plasma physics was largely concerned with partially ionised, low
temperature plasmas such as those found in arcs and sparks. An influential introduction to the
new subject was Spitzer’s small book on the Physics of Fully Ionised Gases, Interscience, New
York (1956). Since then many books have appeared, a recent and comprehensive one being that
by Goldston and Rutherford, Introduction to Plasma Physics, Institute of Physics Publishing
(1995). A more mathematical account of the subject is Miyamato’s Plasma Physics for Nuclear
Fusion, MIT Press (1989).
13
3. TOKAMAKS
The tokamak was first developed in the Soviet Union in the early 1960s, the name “tokamak”
being formed from the Russian words toroidalnaya kamera and magnitnaya katushka meaning
“toroidal chamber” and “magnetic coil”.
The advantage of toroidal, as opposed to linear, geometry is obvious from the avoidance
of “ends”. The simplest magnetic field in a torus would be a purely toroidal magnetic field in
which all the field lines form circles passing round the torus. However, a plasma placed in such
a field cannot come to an equilibrium force balance. The pressure of a toroidal plasma would
cause it to expand and the toroidal magnetic field is unable to provide a balancing force. The
result would be a very rapid loss of the whole plasma.
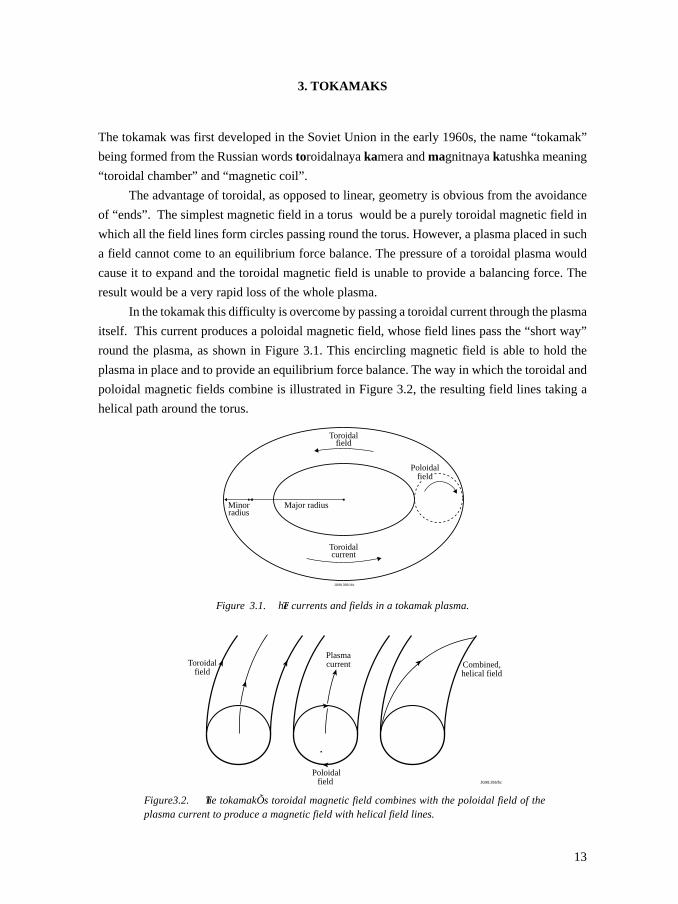
In the tokamak this difficulty is overcome by passing a toroidal current through the plasma
itself. This current produces a poloidal magnetic field, whose field lines pass the “short way”
round the plasma, as shown in Figure 3.1. This encircling magnetic field is able to hold the
plasma in place and to provide an equilibrium force balance. The way in which the toroidal and
poloidal magnetic fields combine is illustrated in Figure 3.2, the resulting field lines taking a
helical path around the torus.
Figure 3.1. The currents and fields in a tokamak plasma.
Figure3.2. The tokamakÕs toroidal magnetic field combines with the poloidal field of theplasma current to produce a magnetic field with helical field lines.
PlasmacurrentToroidal
field
JG98.356/5c
Combined,helical field
Poloidalfield
JG98.356/16c
Toroidalfield
Toroidalcurrent
Minorradius
Major radius
Poloidalfield
14
With a plasma in toroidally axisymmetric equilibrium the path of a magnetic field line
maps out a toroidal surface. Every field line remains within its “magnetic surface” and these
surfaces form a nested set. The current lines also lie in the magnetic surfaces, and the plasma
pressure is constant on each surface.
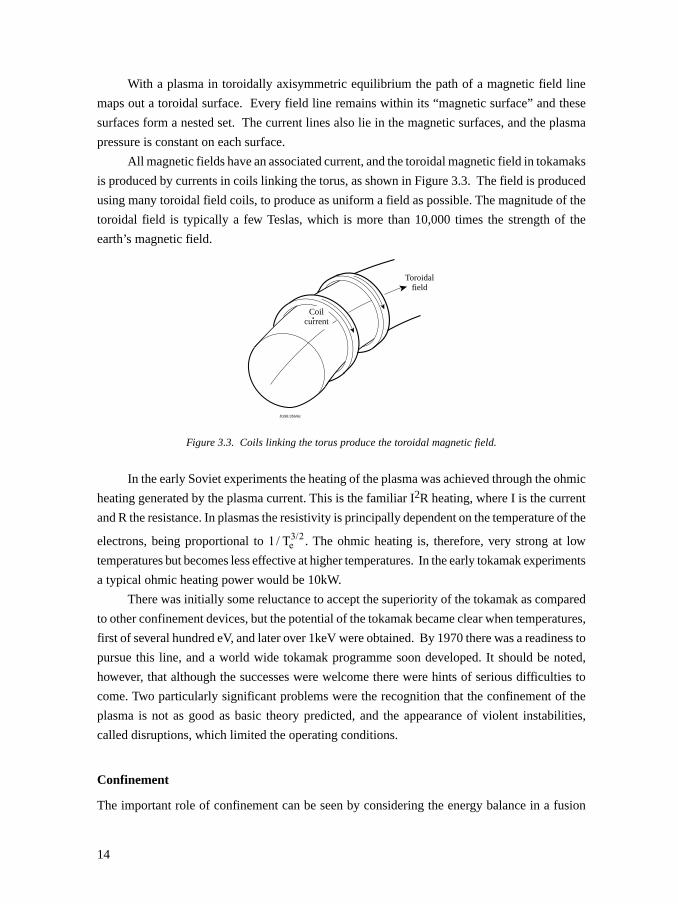
All magnetic fields have an associated current, and the toroidal magnetic field in tokamaks
is produced by currents in coils linking the torus, as shown in Figure 3.3. The field is produced
using many toroidal field coils, to produce as uniform a field as possible. The magnitude of the
toroidal field is typically a few Teslas, which is more than 10,000 times the strength of the
earth’s magnetic field.
Figure 3.3. Coils linking the torus produce the toroidal magnetic field.
In the early Soviet experiments the heating of the plasma was achieved through the ohmic
heating generated by the plasma current. This is the familiar I2R heating, where I is the current
and R the resistance. In plasmas the resistivity is principally dependent on the temperature of the
electrons, being proportional to 1 3 2/ /Te . The ohmic heating is, therefore, very strong at low
temperatures but becomes less effective at higher temperatures. In the early tokamak experiments
a typical ohmic heating power would be 10kW.
There was initially some reluctance to accept the superiority of the tokamak as compared
to other confinement devices, but the potential of the tokamak became clear when temperatures,
first of several hundred eV, and later over 1keV were obtained. By 1970 there was a readiness to
pursue this line, and a world wide tokamak programme soon developed. It should be noted,
however, that although the successes were welcome there were hints of serious difficulties to
come. Two particularly significant problems were the recognition that the confinement of the
plasma is not as good as basic theory predicted, and the appearance of violent instabilities,
called disruptions, which limited the operating conditions.
Confinement
The important role of confinement can be seen by considering the energy balance in a fusion
Toroidalfield
JG98.356/6c
Coilcurrent
15
reactor. The particles in a reacting plasma have been heated to a high temperature. This requires
an input of energy which is wasted for ions which are lost before they undergo an energy producing
fusion reaction. We see, therefore, that the confinement must be sufficiently good that a large
enough fraction of the ions react before their energy is lost. This leads to a simple criterion, first
derived by Lawson, that the product nτ of the density n and confinement time τ must be greater
than 6 × 10¹⁹ m−3 s.
We shall see later that the subject of plasma confinement in tokamaks is full of mysteries.
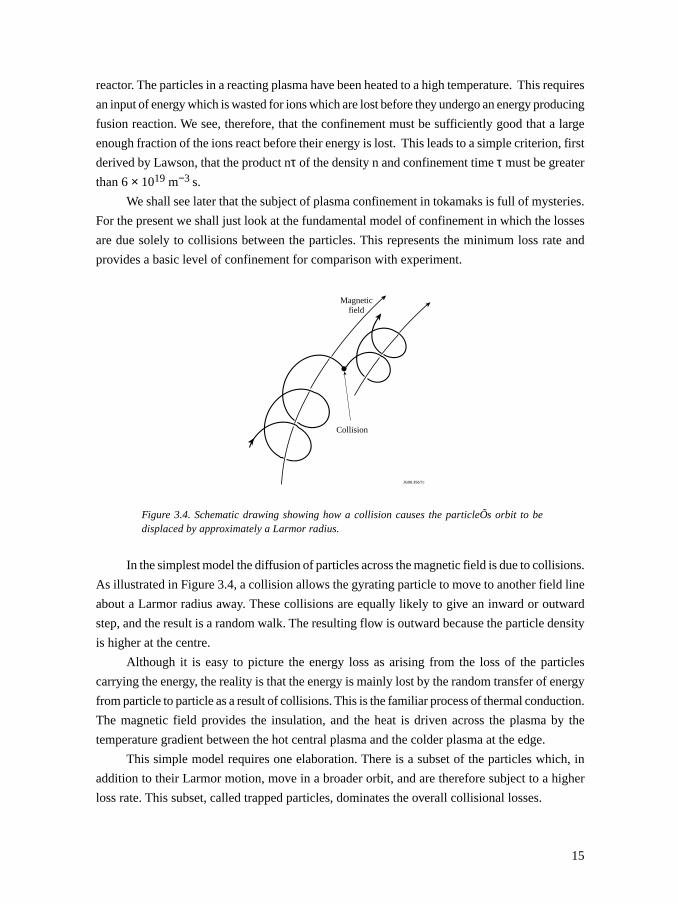
For the present we shall just look at the fundamental model of confinement in which the losses
are due solely to collisions between the particles. This represents the minimum loss rate and
provides a basic level of confinement for comparison with experiment.
Figure 3.4. Schematic drawing showing how a collision causes the particleÕs orbit to bedisplaced by approximately a Larmor radius.
In the simplest model the diffusion of particles across the magnetic field is due to collisions.
As illustrated in Figure 3.4, a collision allows the gyrating particle to move to another field line
about a Larmor radius away. These collisions are equally likely to give an inward or outward
step, and the result is a random walk. The resulting flow is outward because the particle density
is higher at the centre.
Although it is easy to picture the energy loss as arising from the loss of the particles
carrying the energy, the reality is that the energy is mainly lost by the random transfer of energy
from particle to particle as a result of collisions. This is the familiar process of thermal conduction.
The magnetic field provides the insulation, and the heat is driven across the plasma by the
temperature gradient between the hot central plasma and the colder plasma at the edge.
This simple model requires one elaboration. There is a subset of the particles which, in
addition to their Larmor motion, move in a broader orbit, and are therefore subject to a higher
loss rate. This subset, called trapped particles, dominates the overall collisional losses.
Collision
Magneticfield
JG98.356/7c
16
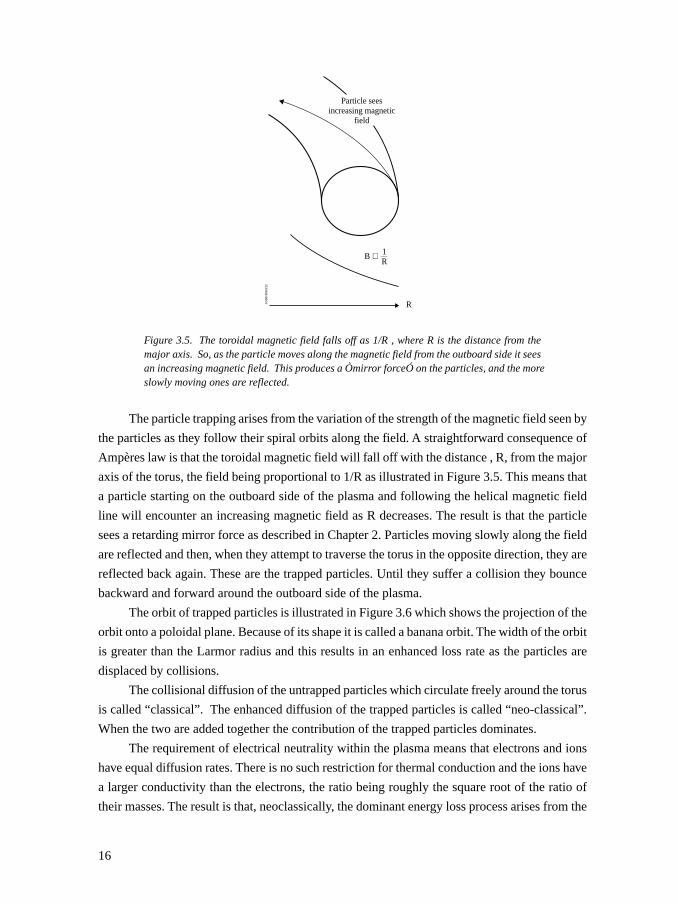
Figure 3.5. The toroidal magnetic field falls off as 1/R , where R is the distance from themajor axis. So, as the particle moves along the magnetic field from the outboard side it seesan increasing magnetic field. This produces a Òmirror forceÓ on the particles, and the moreslowly moving ones are reflected.
The particle trapping arises from the variation of the strength of the magnetic field seen by
the particles as they follow their spiral orbits along the field. A straightforward consequence of
Ampères law is that the toroidal magnetic field will fall off with the distance , R, from the major
axis of the torus, the field being proportional to 1/R as illustrated in Figure 3.5. This means that
a particle starting on the outboard side of the plasma and following the helical magnetic field
line will encounter an increasing magnetic field as R decreases. The result is that the particle
sees a retarding mirror force as described in Chapter 2. Particles moving slowly along the field
are reflected and then, when they attempt to traverse the torus in the opposite direction, they are
reflected back again. These are the trapped particles. Until they suffer a collision they bounce
backward and forward around the outboard side of the plasma.
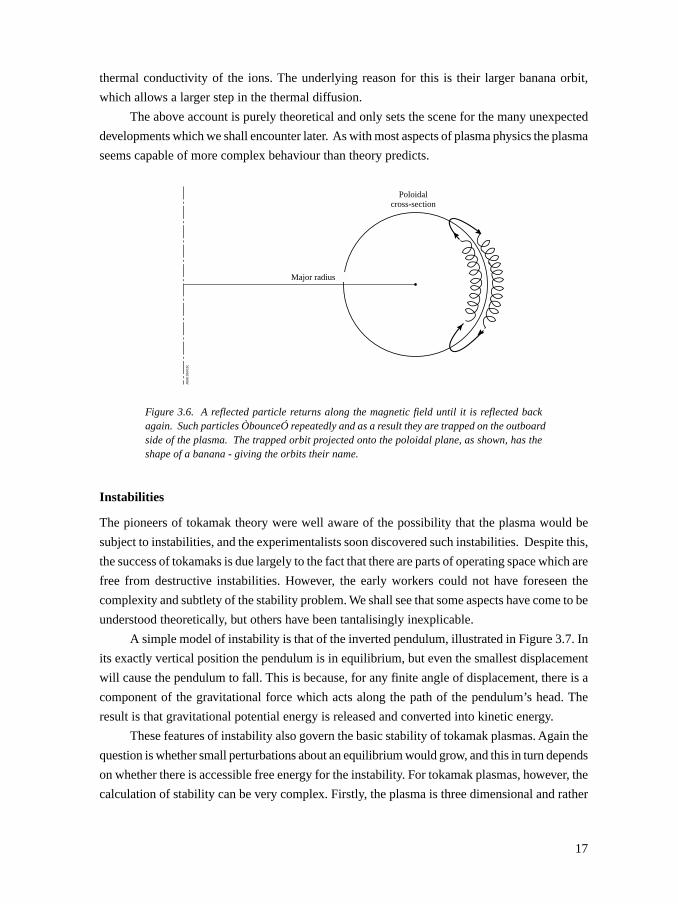
The orbit of trapped particles is illustrated in Figure 3.6 which shows the projection of the
orbit onto a poloidal plane. Because of its shape it is called a banana orbit. The width of the orbit
is greater than the Larmor radius and this results in an enhanced loss rate as the particles are
displaced by collisions.
The collisional diffusion of the untrapped particles which circulate freely around the torus
is called “classical”. The enhanced diffusion of the trapped particles is called “neo-classical”.
When the two are added together the contribution of the trapped particles dominates.
The requirement of electrical neutrality within the plasma means that electrons and ions
have equal diffusion rates. There is no such restriction for thermal conduction and the ions have
a larger conductivity than the electrons, the ratio being roughly the square root of the ratio of
their masses. The result is that, neoclassically, the dominant energy loss process arises from the
Particle seesincreasing magnetic
field
R
B ∝ 1R
JG98.3
56/2
1c
17
thermal conductivity of the ions. The underlying reason for this is their larger banana orbit,
which allows a larger step in the thermal diffusion.
The above account is purely theoretical and only sets the scene for the many unexpected
developments which we shall encounter later. As with most aspects of plasma physics the plasma
seems capable of more complex behaviour than theory predicts.
Figure 3.6. A reflected particle returns along the magnetic field until it is reflected backagain. Such particles ÒbounceÓ repeatedly and as a result they are trapped on the outboardside of the plasma. The trapped orbit projected onto the poloidal plane, as shown, has theshape of a banana - giving the orbits their name.
Instabilities
The pioneers of tokamak theory were well aware of the possibility that the plasma would be
subject to instabilities, and the experimentalists soon discovered such instabilities. Despite this,
the success of tokamaks is due largely to the fact that there are parts of operating space which are
free from destructive instabilities. However, the early workers could not have foreseen the
complexity and subtlety of the stability problem. We shall see that some aspects have come to be
understood theoretically, but others have been tantalisingly inexplicable.
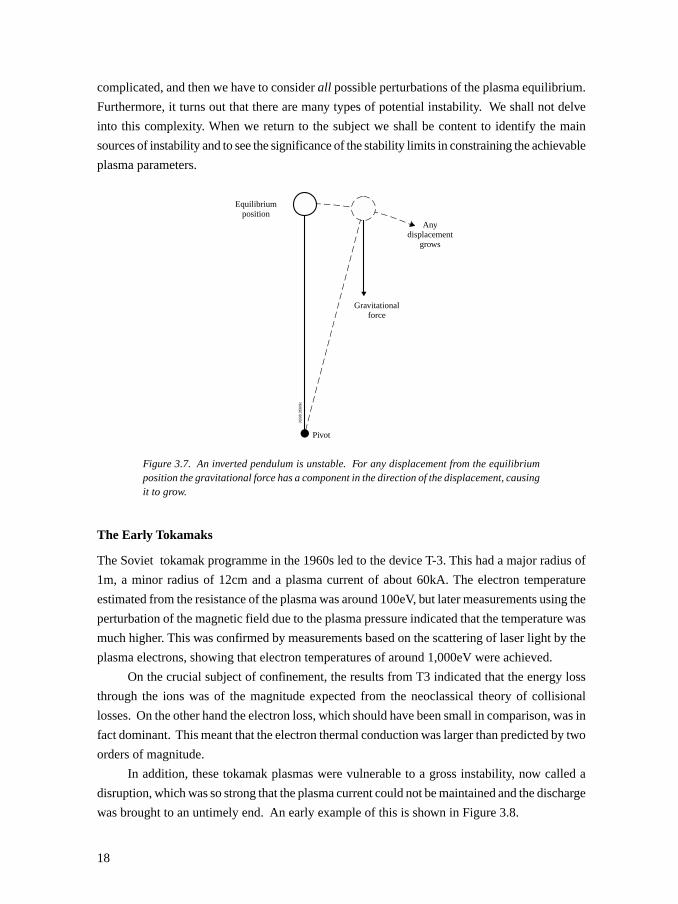
A simple model of instability is that of the inverted pendulum, illustrated in Figure 3.7. In
its exactly vertical position the pendulum is in equilibrium, but even the smallest displacement
will cause the pendulum to fall. This is because, for any finite angle of displacement, there is a
component of the gravitational force which acts along the path of the pendulum’s head. The
result is that gravitational potential energy is released and converted into kinetic energy.
These features of instability also govern the basic stability of tokamak plasmas. Again the
question is whether small perturbations about an equilibrium would grow, and this in turn depends
on whether there is accessible free energy for the instability. For tokamak plasmas, however, the
calculation of stability can be very complex. Firstly, the plasma is three dimensional and rather
JG98
.356
/15c
Poloidalcross-section
Major radius
18
complicated, and then we have to consider all possible perturbations of the plasma equilibrium.
Furthermore, it turns out that there are many types of potential instability. We shall not delve
into this complexity. When we return to the subject we shall be content to identify the main
sources of instability and to see the significance of the stability limits in constraining the achievable
plasma parameters.
Figure 3.7. An inverted pendulum is unstable. For any displacement from the equilibriumposition the gravitational force has a component in the direction of the displacement, causingit to grow.
The Early Tokamaks
The Soviet tokamak programme in the 1960s led to the device T-3. This had a major radius of
1m, a minor radius of 12cm and a plasma current of about 60kA. The electron temperature
estimated from the resistance of the plasma was around 100eV, but later measurements using the
perturbation of the magnetic field due to the plasma pressure indicated that the temperature was
much higher. This was confirmed by measurements based on the scattering of laser light by the
plasma electrons, showing that electron temperatures of around 1,000eV were achieved.
On the crucial subject of confinement, the results from T3 indicated that the energy loss
through the ions was of the magnitude expected from the neoclassical theory of collisional
losses. On the other hand the electron loss, which should have been small in comparison, was in
fact dominant. This meant that the electron thermal conduction was larger than predicted by two
orders of magnitude.
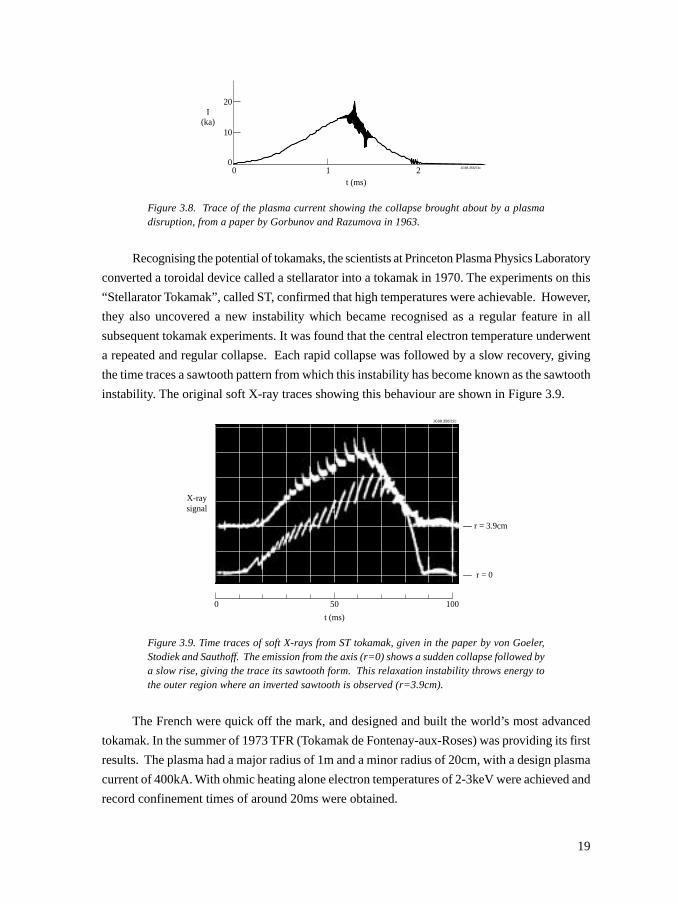
In addition, these tokamak plasmas were vulnerable to a gross instability, now called a
disruption, which was so strong that the plasma current could not be maintained and the discharge
was brought to an untimely end. An early example of this is shown in Figure 3.8.
JG98
.356
/9c
Pivot
Gravitationalforce
Anydisplacement
grows
Equilibriumposition
19
Figure 3.8. Trace of the plasma current showing the collapse brought about by a plasmadisruption, from a paper by Gorbunov and Razumova in 1963.
Recognising the potential of tokamaks, the scientists at Princeton Plasma Physics Laboratory
converted a toroidal device called a stellarator into a tokamak in 1970. The experiments on this
“Stellarator Tokamak”, called ST, confirmed that high temperatures were achievable. However,
they also uncovered a new instability which became recognised as a regular feature in all
subsequent tokamak experiments. It was found that the central electron temperature underwent
a repeated and regular collapse. Each rapid collapse was followed by a slow recovery, giving
the time traces a sawtooth pattern from which this instability has become known as the sawtooth
instability. The original soft X-ray traces showing this behaviour are shown in Figure 3.9.
Figure 3.9. Time traces of soft X-rays from ST tokamak, given in the paper by von Goeler,Stodiek and Sauthoff. The emission from the axis (r=0) shows a sudden collapse followed bya slow rise, giving the trace its sawtooth form. This relaxation instability throws energy tothe outer region where an inverted sawtooth is observed (r=3.9cm).
The French were quick off the mark, and designed and built the world’s most advanced
tokamak. In the summer of 1973 TFR (Tokamak de Fontenay-aux-Roses) was providing its first
results. The plasma had a major radius of 1m and a minor radius of 20cm, with a design plasma
current of 400kA. With ohmic heating alone electron temperatures of 2-3keV were achieved and
record confinement times of around 20ms were obtained.
JG98.356/23c
20
00 1 2
10
t (ms)
I(ka)
0 50
t (ms)
100
— r = 3.9cm
— r = 0
X-raysignal
JG98.356/22c
20
These early tokamaks provided much needed encouragement for the fusion programme
and their success opened up a plausible path to a reactor. It was clearly desirable to make a large
step in that direction, and in Europe it was agreed that this could be most readily achieved by a
collaborative project. With this aim in mind a team was set up to design a Joint European Torus
- JET. The decision as to how large the step should be could not be based purely on established
scientific principles, since they did not exist. However, one simple calculation could be made. If
the experiment was to succeed in producing a significant amount of fusion power, the energy of
the α-particles produced could only be retained within the plasma if their orbits in the magnetic
field were smaller than the width of the plasma. The condition for this depends only on the
plasma current, and the required current is around 3MA. A current of this size was therefore
envisaged, but it would be up to the JET design team to identify the important goals and to
propose the device which was best able to achieve them.
Bibliography
The earliest theoretical work related to tokamaks was carried out by Sakharov and Tamm in
1951, and is recorded in Volume 1 of Plasma Physics and Controlled Fusion, published by
Pergamon Press in 1961. An account of the exploratory tokamak experiments is given by
Artsimovitch in his book Controlled Thermonuclear Reactions (published in English in 1964 by
Oliver and Boyd) and later in a review, Tokamak Devices, in Nuclear Fusion, 12, 215 (1972).
An introductory account of tokamaks was provided by Wesson’s book, Tokamaks
(Clarendon Press), in 1987. A substantially expanded second edition of this book was published
in 1997. A more theoretical treatment is White’s Theory of Tokamak Plasmas (North-Holland
1989), and in 1992 Kadomtsev published his insightful book Tokamak Plasma: A Complex
Physical System (IOP Publishing).
21
4. JET - QUITE A STEP
What was known
Let us first get a feel for the magnitude of the step to the proposed JET tokamak by comparing its
physical size to that of the largest tokamak then existing, that is TFR. The plasma volume in
TFR was less than 1m3. The volume for JET turned out to be over 100m3. Measured in these
terms, therefore, the step was more than a factor of 100. Whereas the minor radius in TFR could
be spanned by one hand, the JET vacuum vessel would be twice the height of a man, so that it
would easily be possible to stand inside. Along with the increase in physical size the plasma
current, a crucial parameter, would be increased by an order of magnitude.
The scientific framework for making design decisions was very shaky. Perhaps the foremost
issue was how to reach thermonuclear conditions. The fundamental uncertainty was the
confinement properties of the hotter plasmas that would be required. The only base from which
to work was that of previous experiments with ohmic heating. In these experiments the anomalous
loss through electron thermal conduction was dominant, and the loss through the ion channel
was thought to be close to the minimum value as given by neoclassical transport resulting simply
from collisions. It was plausible, at least, that at higher temperatures the ion heat loss would
remain neoclassical. In that case theory predicts a lowering of the ion thermal conductivity with
increasing temperature. The question would then be that of the electron heat loss. In the absence
of experimental information it was natural to look to theory. Unfortunately there was no accepted
theory. Then, as now, there were fashionable ideas, but the remarkable truth is that theory has
never satisfactorily got to grips with anomalous transport.
Thus, little could be said with confidence and this, of course, was part of the justification
for the JET experiment. It was necessary to discover the rules governing confinement in plasmas
closer to reactor conditions.
There were other important uncertainties. Perhaps the most fundamental was the question
of the so-called β-limit. β is essentially a measure of the ratio of the plasma energy to the energy
of the magnetic field. This ratio appears naturally in the theory of magnetohdrodynamic (mhd)
instabilities, and it was natural, therefore, to expect that these instabilities would impose a limit
on the achievable value of β. This would mean that for a given magnetic field, the plasma energy
could not exceed a critical value. When the JET design team started its work the question of a
β-limit arose, and the absence of any theoretical calculation of the limit provoked the design
team to instigate calculations which were ultimately to lead to the establishment of a sound
understanding of the β-limit.
Another subject surrounded by mystery was “disruptions”. It was known that increasing
the plasma density too far would cause a fatal disruption of the plasma. The same happened if,
for a given toroidal magnetic field, the plasma current was increased to too high a value. Since
22
high density was to be desired for a high thermonuclear reaction rate, and since larger currents
were expected to improve confinement, the disruption problem was crucial. However, disruptions
were not understood, and even the pattern of their occurrence was somewhat unclear. It did
seem, however, that the limit to the plasma current was related to the so-called safety factor,
written as q. This is essentially the ratio of the toroidal and poloidal magnetic fields divided by
the ratio of the major and minor radii of the plasma, R/a. That is, q = (BT/Bp)/(R/a).
Faced with these uncertainties the JET team had to come up with a design. The plasma
current was chosen to be 3.8MA, sufficient to confine α-particles, with the possibility of extending
this to 4.8MA. The toroidal field is limited by the force it imparts to the toroidal field coils
linking the plasma. The JET design implied a conservative view of the acceptable force, and
allowed a toroidal magnetic field at the centre of the plasma of 2.8T with a possible extension to
3.5T.
The Geometry
The remaining key decision was the geometry. Should the plasma be circular or elongated, and
what should be the aspect ratio, R/a. While there are physics issues involved, these decisions
appear to have been made with more practical considerations in mind.
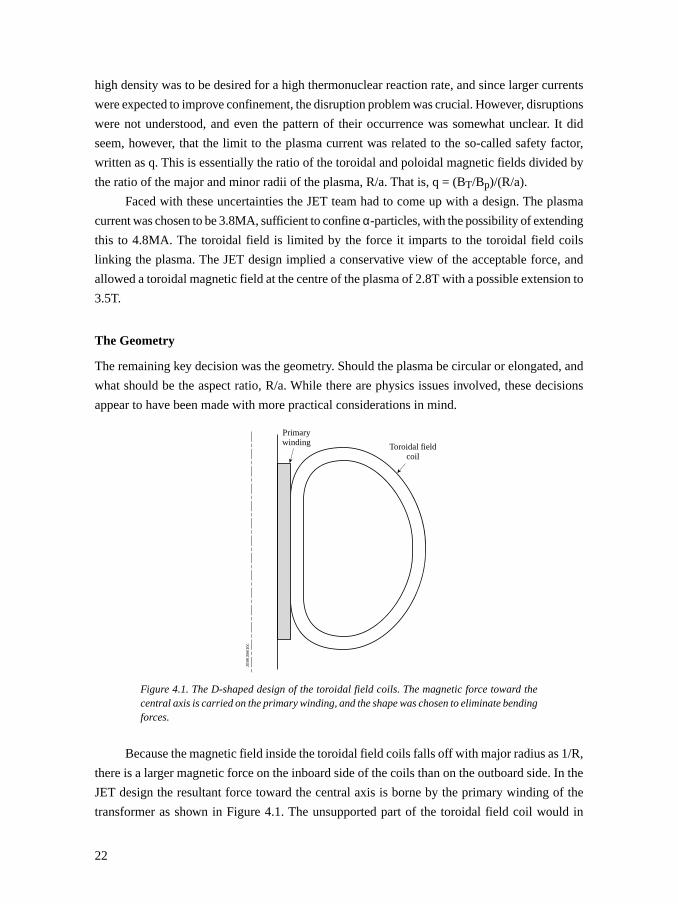
Figure 4.1. The D-shaped design of the toroidal field coils. The magnetic force toward thecentral axis is carried on the primary winding, and the shape was chosen to eliminate bendingforces.
Because the magnetic field inside the toroidal field coils falls off with major radius as 1/R,
there is a larger magnetic force on the inboard side of the coils than on the outboard side. In the
JET design the resultant force toward the central axis is borne by the primary winding of the
transformer as shown in Figure 4.1. The unsupported part of the toroidal field coil would in
Primarywinding Toroidal field
coil
JG98
.356
/10c
23
general be subject to bending and tensile stresses. However, if we imagine that the coil were free
to adjust its shape and balance the magnetic pressure at each position, the bending forces would
be reduced to zero. This principle was adopted for JET and as a result the coil is D-shaped, the
weaker magnetic field at the outside requiring a smaller curvature to provide a balancing force
from the tensile stress. The vacuum vessel was then designed to use the space inside the coils
and this gave a height-width ratio of 1.6.
The aspect-ratio was decided on the basis of minimising the cost. With a range of
assumptions the optimum value of R/a was found to be between 2 and 3, and the chosen value
was 2.4.
The Size
The values of the parameters given above now allow us to see how the physical size of JET was
determined. It seemed from earlier experiments that a safety factor, q, of about 3 was needed to
provide an adequate margin of stability. With the geometric ratios given above, and a toroidal
field of 3T, this requirement on q means that the poloidal magnetic field, Bp , should not be
greater than 0.5T. The size of the plasma then follows from Ampère’s law, which relates the total
current to Bp and the minor radius. For a given plasma current, too small a plasma gives too high
a Bp and too small a safety factor. With the given geometry, and the value Bp=0.5T , a current of
4MA requires a minor radius, a, of just over 1m. With the geometric ratios chosen for JET, R/a
= 2.4 and b/a = 1.6, the conveniently rounded dimensions R=3m and b = 2m give a satisfactory
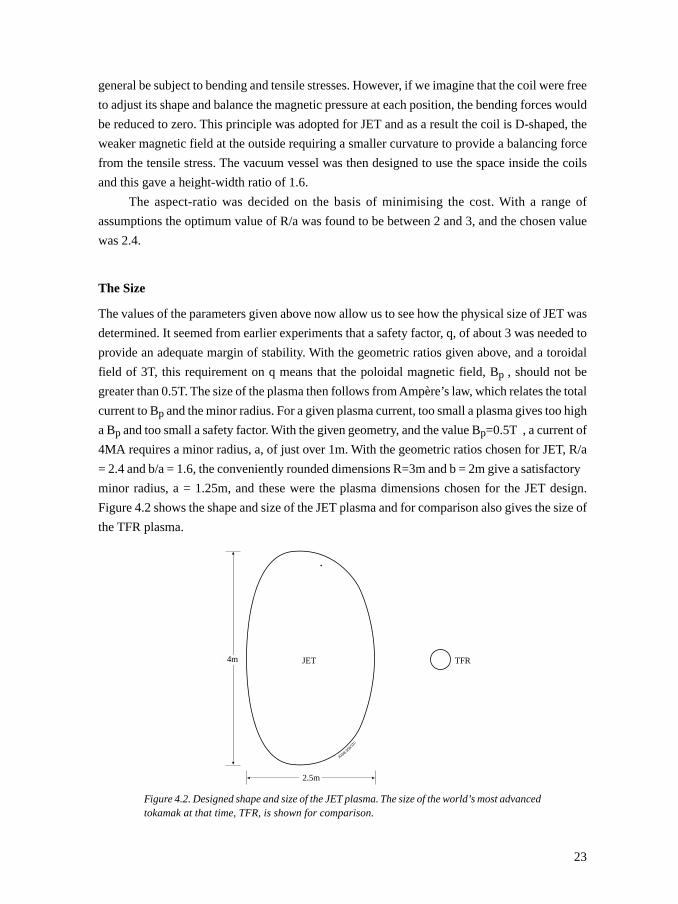
minor radius, a = 1.25m, and these were the plasma dimensions chosen for the JET design.
Figure 4.2 shows the shape and size of the JET plasma and for comparison also gives the size of
the TFR plasma.
Figure 4.2. Designed shape and size of the JET plasma. The size of the world’s most advancedtokamak at that time, TFR, is shown for comparison.
TFRJET
2.5m
4m
JG98.35
6/11
c
24
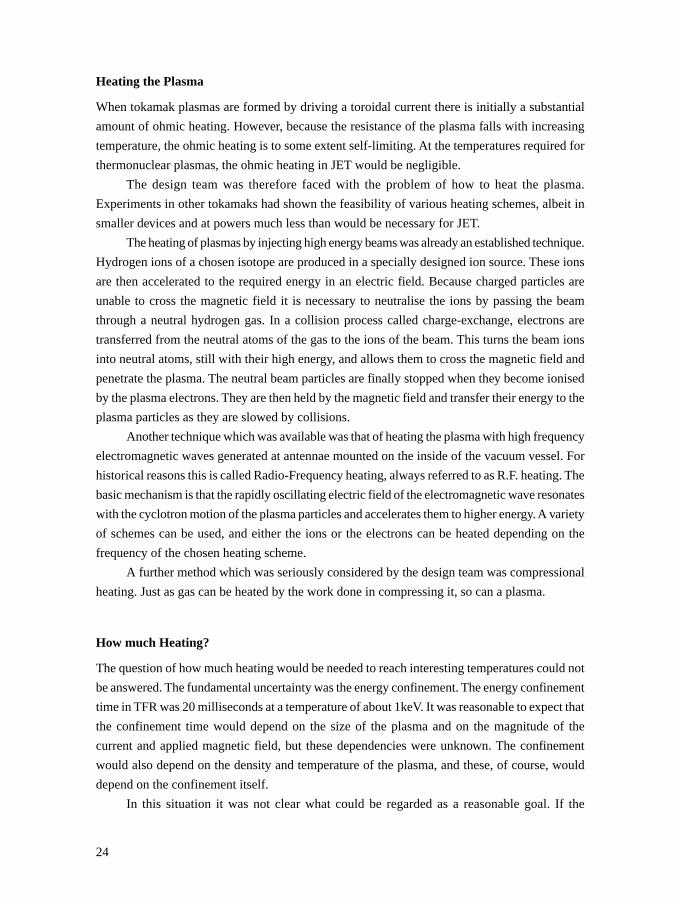
Heating the Plasma
When tokamak plasmas are formed by driving a toroidal current there is initially a substantial
amount of ohmic heating. However, because the resistance of the plasma falls with increasing
temperature, the ohmic heating is to some extent self-limiting. At the temperatures required for
thermonuclear plasmas, the ohmic heating in JET would be negligible.
The design team was therefore faced with the problem of how to heat the plasma.
Experiments in other tokamaks had shown the feasibility of various heating schemes, albeit in
smaller devices and at powers much less than would be necessary for JET.
The heating of plasmas by injecting high energy beams was already an established technique.
Hydrogen ions of a chosen isotope are produced in a specially designed ion source. These ions
are then accelerated to the required energy in an electric field. Because charged particles are
unable to cross the magnetic field it is necessary to neutralise the ions by passing the beam
through a neutral hydrogen gas. In a collision process called charge-exchange, electrons are
transferred from the neutral atoms of the gas to the ions of the beam. This turns the beam ions
into neutral atoms, still with their high energy, and allows them to cross the magnetic field and
penetrate the plasma. The neutral beam particles are finally stopped when they become ionised
by the plasma electrons. They are then held by the magnetic field and transfer their energy to the
plasma particles as they are slowed by collisions.
Another technique which was available was that of heating the plasma with high frequency
electromagnetic waves generated at antennae mounted on the inside of the vacuum vessel. For
historical reasons this is called Radio-Frequency heating, always referred to as R.F. heating. The
basic mechanism is that the rapidly oscillating electric field of the electromagnetic wave resonates
with the cyclotron motion of the plasma particles and accelerates them to higher energy. A variety
of schemes can be used, and either the ions or the electrons can be heated depending on the
frequency of the chosen heating scheme.
A further method which was seriously considered by the design team was compressional
heating. Just as gas can be heated by the work done in compressing it, so can a plasma.
How much Heating?
The question of how much heating would be needed to reach interesting temperatures could not
be answered. The fundamental uncertainty was the energy confinement. The energy confinement
time in TFR was 20 milliseconds at a temperature of about 1keV. It was reasonable to expect that
the confinement time would depend on the size of the plasma and on the magnitude of the
current and applied magnetic field, but these dependencies were unknown. The confinement
would also depend on the density and temperature of the plasma, and these, of course, would
depend on the confinement itself.
In this situation it was not clear what could be regarded as a reasonable goal. If the
25
expectations were put too high they would lead to disappointment. Rather than review the wide
range of unconvincing conjectures made at the time, let us first obtain some feel for the
expectations by making the simple assumption that the energy loss process is thermal conduction,
and neglect the dependence of the conductivity on all of the variables listed above apart from
size.
Thermal conduction is a diffusive process, and its characteristic time is proportional to the
square of the linear dimensions. In our case this means that we can take the energy confinement
time to be proportional to the area of the minor cross-section of the plasma. In TFR this was
0.13m2 and in JET it would be almost 8m2. The 20 millisecond energy confinement time of TFR
then gives a confinement in JET of 0.02 × (8/0.13)s = 1.2s.
The degree of uncertainty is easily seen by imagining that the thermal conductivity might
vary with temperature as T1/2 or T-1/2 . Neither of these dependencies is dramatic, but in
extrapolating from the 1keV temperatures of the early experiments to a possible 10keV in JET
the range of predicted values for the confinement time would be 0.4s to 4s, covering an order of
magnitude.
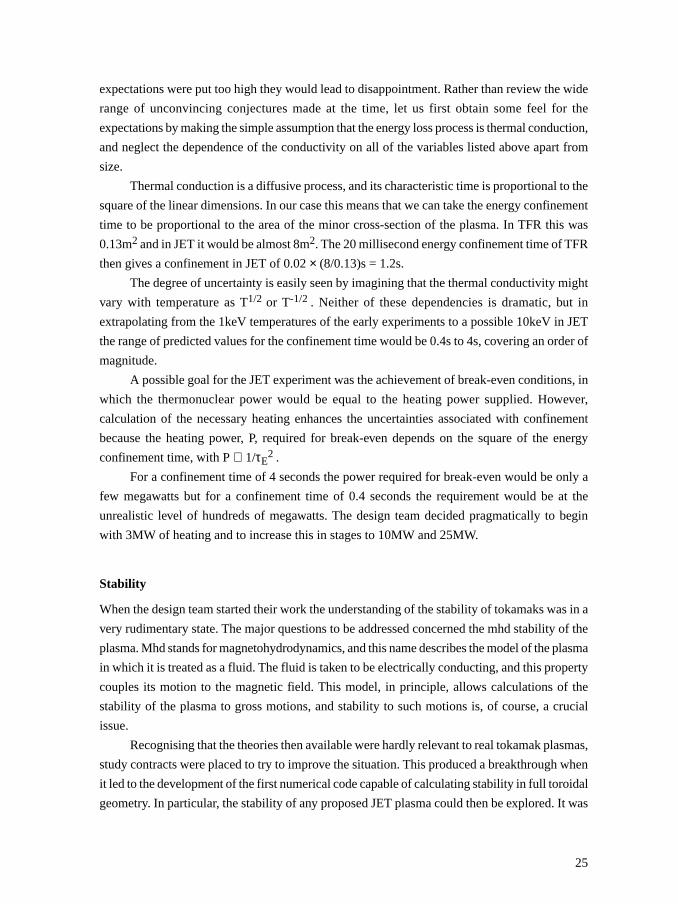
A possible goal for the JET experiment was the achievement of break-even conditions, in
which the thermonuclear power would be equal to the heating power supplied. However,
calculation of the necessary heating enhances the uncertainties associated with confinement
because the heating power, P, required for break-even depends on the square of the energy
confinement time, with P ∝ 1/τE2 .
For a confinement time of 4 seconds the power required for break-even would be only a
few megawatts but for a confinement time of 0.4 seconds the requirement would be at the
unrealistic level of hundreds of megawatts. The design team decided pragmatically to begin
with 3MW of heating and to increase this in stages to 10MW and 25MW.
Stability
When the design team started their work the understanding of the stability of tokamaks was in a
very rudimentary state. The major questions to be addressed concerned the mhd stability of the
plasma. Mhd stands for magnetohydrodynamics, and this name describes the model of the plasma
in which it is treated as a fluid. The fluid is taken to be electrically conducting, and this property
couples its motion to the magnetic field. This model, in principle, allows calculations of the
stability of the plasma to gross motions, and stability to such motions is, of course, a crucial
issue.
Recognising that the theories then available were hardly relevant to real tokamak plasmas,
study contracts were placed to try to improve the situation. This produced a breakthrough when
it led to the development of the first numerical code capable of calculating stability in full toroidal
geometry. In particular, the stability of any proposed JET plasma could then be explored. It was
26
to turn out that the question of the stability of JET plasmas would drive many of the major
advances in the understanding of tokamak stability.
An important discovery arising from the stability code was that an instability of the plasma
core which was predicted to occur in cylindrical geometry can be stable in toroidal geometry.
Another development arose from the choice of a vertically elongated plasma for JET. It was
already known that this configuration is subject to an instability force in the vertical direction.
Without stabilisation this force would lead to an extremely fast instability. However, analysis
showed that the vacuum vessel would slow the instability to a growth-rate which could be
controlled by a feedback system, and such a system became part of the JET design.
The Design Proposal
The design team had started their work in September 1973. By September 1975 they had prepared
their design proposal. This document, called R5, had more than 600 pages. It listed the scant
information about tokamak physics then available, made its arguments for the specific JET
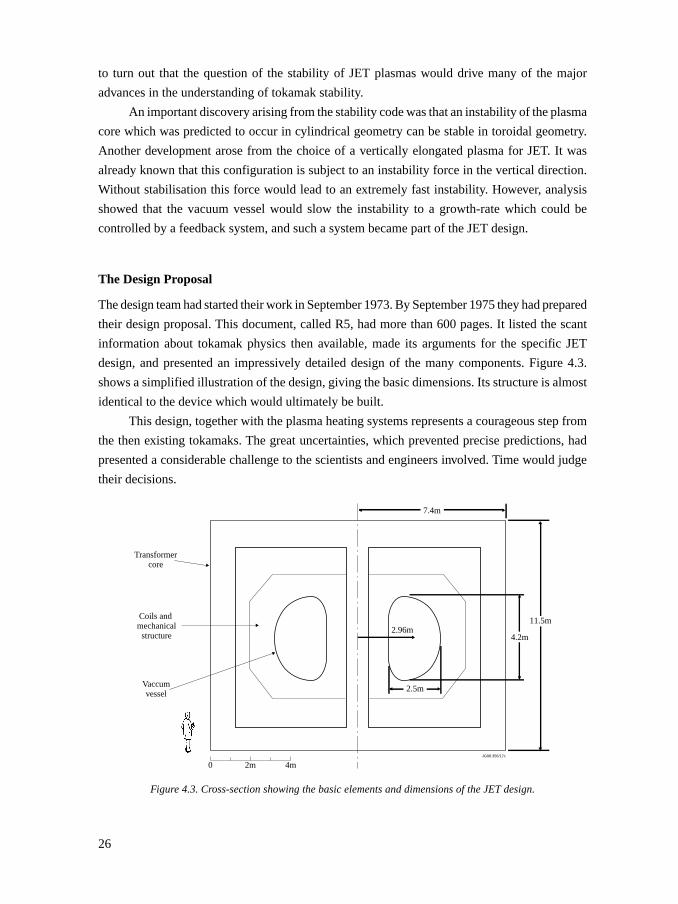
design, and presented an impressively detailed design of the many components. Figure 4.3.
shows a simplified illustration of the design, giving the basic dimensions. Its structure is almost
identical to the device which would ultimately be built.
This design, together with the plasma heating systems represents a courageous step from
the then existing tokamaks. The great uncertainties, which prevented precise predictions, had
presented a considerable challenge to the scientists and engineers involved. Time would judge
their decisions.
Figure 4.3. Cross-section showing the basic elements and dimensions of the JET design.
2.96m
JG98.356/17c
2.5m
11.5m
4.2m
7.4m
Vaccumvessel
Coils and mechanical
structure
Transformercore
0 2m 4m
27
The Stated Aims
As we have seen the design was based on assessments as to what were reasonable aims, and
what could be achieved. Along with the design, the aims were spelt out clearly in the design
document and we must record these stated aims.
“The essential objective of JET is to obtain and study a plasma in conditions and dimensions
approaching those needed in a thermonuclear reactor. These studies will be aimed at defining
the parameters, the size and the working conditions of a Tokamak reactor. The realisation of this
objective involves four main areas of work:
(i) the scaling of plasma behaviour as parameters approach the reactor range,
(ii) the plasma-wall interaction in these conditions,
(iii) the study of plasma heating and
(iv) the study of α-particle production, confinement and consequent plasma heating.”
We shall recall these goals when we come to summarise JET’s achievements.
Bibliography
The best reference is the report R5, or more fully EUR-JET-R5, entitled “JET Project - Design
Proposal”. This is a splendid account of the work of the design team led by Paul-Henri Rebut. Its
contents and approach are best represented by giving the report’s abstract is full.
This proposal describes a large Tokamak experiment, which aims to study plasma
behaviour in conditions and dimensions approaching those required in a fusion reactor.
The maximum plasma minor radius (a) is 1.25 m and the major radius (Ro) is 2.96m.
An important feature is the flexibility to study, for plasma currents in the 1→3 MA
range, a wide range of aspect ratios (Ro/a = 2.37 → 5), toroidal magnetic fields (up
to 3.6T), minor radii (0.6 → 1.25m) and elongation ratios (b/a = 1 → 3.5).
The cost of the apparatus, power supplies, plasma heating equipment and specific
diagnostics is estimated as 70.1 Muc [1975 prices, in year 2000 prices 200 Meuros].
The total construction phase cost including commissioning, buildings and staff is
135 Muc. These figures include an average overall contingency of 30%. The
construction time for the project is estimated at 5years and requires 370 professional
man years of effort in the construction organisation with additional effort deployed
by the Associated Laboratories in such areas as diagnostics and plasma heating.
This design proposal is arranged as follows:
The Preface gives an introduction to the field of fusion research and relates JET to
28
the European and International programmes. Chapter I is a concise summary of the
design proposal, it describes the objectives of research with JET, and gives a brief
description of: the apparatus; the cost and construction schedules; the proposed
experimental programme and the possible modes of operation of the device. A detailed
account of the project is given in the rest of the report of which Chapters IV and VII
comprise the engineering design and the staff and cost estimates respectively.
The design team was comprised of 7 groups totalling 56 members. The “Scientific” group,
responsible for “Physics, Additional Heating, Diagnostics, Divertor and Cost Scaling”, was led
by Alan Gibson.
29
5. THE CONSTRUCTION
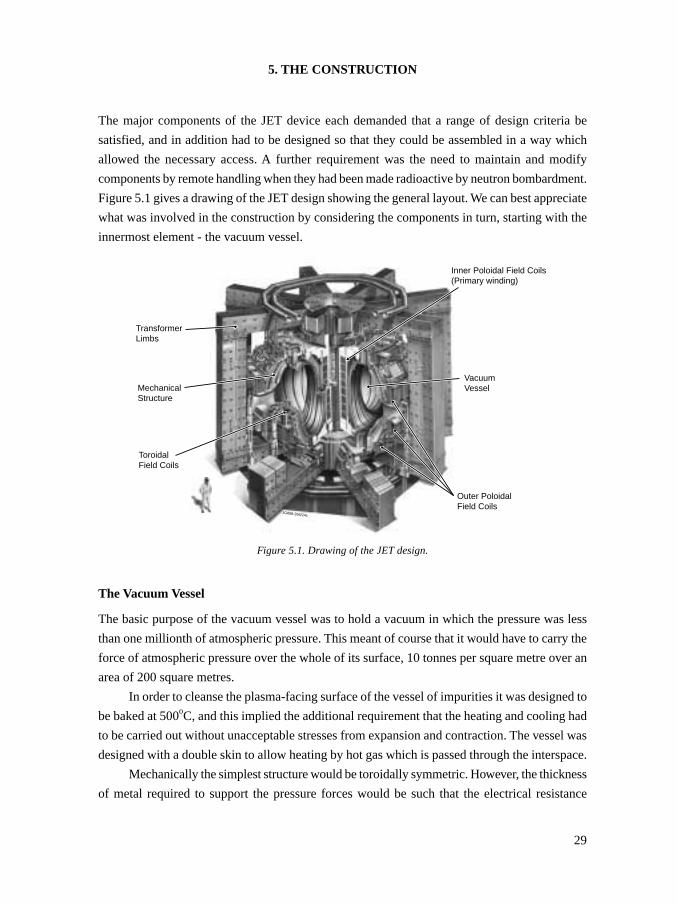
The major components of the JET device each demanded that a range of design criteria be
satisfied, and in addition had to be designed so that they could be assembled in a way which
allowed the necessary access. A further requirement was the need to maintain and modify
components by remote handling when they had been made radioactive by neutron bombardment.
Figure 5.1 gives a drawing of the JET design showing the general layout. We can best appreciate
what was involved in the construction by considering the components in turn, starting with the
innermost element - the vacuum vessel.
Figure 5.1. Drawing of the JET design.
The Vacuum Vessel
The basic purpose of the vacuum vessel was to hold a vacuum in which the pressure was less
than one millionth of atmospheric pressure. This meant of course that it would have to carry the
force of atmospheric pressure over the whole of its surface, 10 tonnes per square metre over an
area of 200 square metres.
In order to cleanse the plasma-facing surface of the vessel of impurities it was designed to
be baked at 500oC, and this implied the additional requirement that the heating and cooling had
to be carried out without unacceptable stresses from expansion and contraction. The vessel was
designed with a double skin to allow heating by hot gas which is passed through the interspace.
Mechanically the simplest structure would be toroidally symmetric. However, the thickness
of metal required to support the pressure forces would be such that the electrical resistance
Inner Poloidal Field Coils(Primary winding)
VacuumVessel
Outer PoloidalField Coils
ToroidalField Coils
MechanicalStructure
TransformerLimbs
JG898.356/24c
30
would be very low. The consequence would be that the toroidal electric field applied to drive the
plasma current would also drive an unacceptably large current through the vacuum vessel. The
solution was to alternate sections with enough metal to provide the required strength with sections
having a high resistance. The high resistance sections were bellows whose convolutions
substantially increase their resistance. This structure is illustrated in Figure 5.2.
As if these complications were not enough the nickel alloy construction called for eight
kilometres of vacuum tight welds.
Figure 5.2. Part-section of the vacuum vessel wall, showing the alternating rigid and bellowssectors.
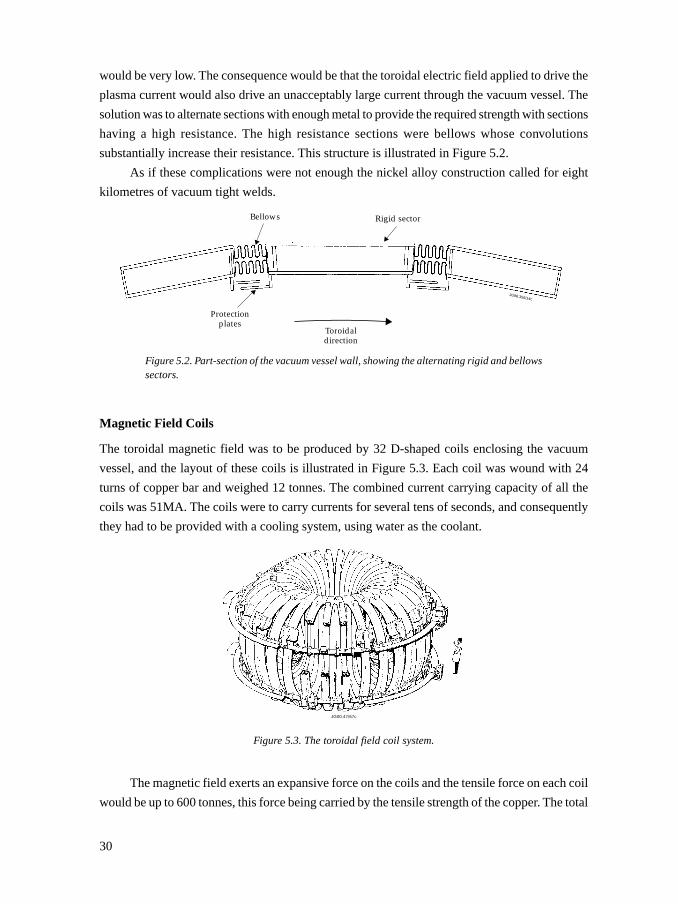
Magnetic Field Coils
The toroidal magnetic field was to be produced by 32 D-shaped coils enclosing the vacuum
vessel, and the layout of these coils is illustrated in Figure 5.3. Each coil was wound with 24
turns of copper bar and weighed 12 tonnes. The combined current carrying capacity of all the
coils was 51MA. The coils were to carry currents for several tens of seconds, and consequently
they had to be provided with a cooling system, using water as the coolant.
JG00.47/67c
Figure 5.3. The toroidal field coil system.
The magnetic field exerts an expansive force on the coils and the tensile force on each coil
would be up to 600 tonnes, this force being carried by the tensile strength of the copper. The total
Bellows Rigid sector
Protectionplates
Toroidaldirection
JG98.356/14c
31
force on each coil would be almost 2000 tonnes, directed toward the major axis of the torus. A
further force arises from the interaction of the currents in the coils with the poloidal magnetic
field. The current in the toroidal field coils crosses the vertical component of the poloidal field in
opposite directions in the upper and lower halves. This produces a twisting force which, in the
JET design, is carried by an outer mechanical structure, illustrated in Figure 5.4.
JG00.47/68c
Figure 5.4. The mechanical structure which supports the toroidal field coils against themagnetic twisting force.
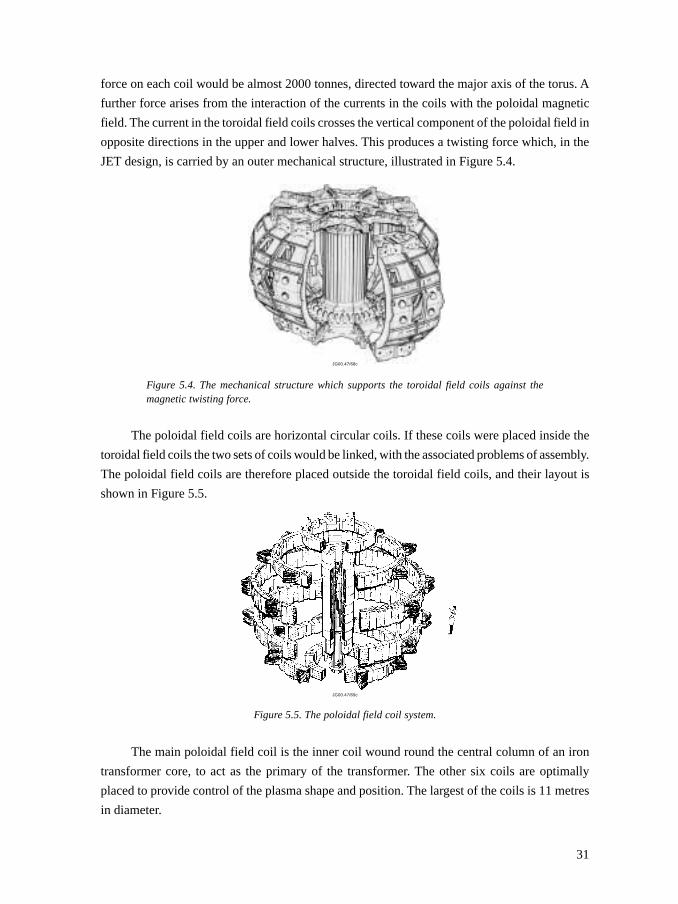
The poloidal field coils are horizontal circular coils. If these coils were placed inside the
toroidal field coils the two sets of coils would be linked, with the associated problems of assembly.
The poloidal field coils are therefore placed outside the toroidal field coils, and their layout is
shown in Figure 5.5.
JG00.47/69c
Figure 5.5. The poloidal field coil system.
The main poloidal field coil is the inner coil wound round the central column of an iron
transformer core, to act as the primary of the transformer. The other six coils are optimally
placed to provide control of the plasma shape and position. The largest of the coils is 11 metres
in diameter.
32
The laminated iron transformer core would dominate the appearance of JET having 8
limbs enveloping the other components. This massive structure, which would weigh 2,600 tonnes,
is illustrated in Figure 5.6.
JG00.47/70c
Figure 5.6. Layout of the iron transformer core.
Power Supplies
Electrical power was needed to supply the currents in both the toroidal and poloidal field coils,
a similar power being required for each.
JET was designed to allow a pulse repetition rate of one every 15 minutes. Each pulse
would call for a total power of up to 800MW - the output of a medium sized power station. In
previous machines this pulsed load had been dealt with using heavy flywheels driven up to
speed by motor generators, the energy in the flywheel then being extracted during the plasma
pulse. The system used for JET combined this procedure with several hundred megawatts taken
directly from the electricity grid.
Plasma Heating Systems
It was decided that the main heating would be provided by two heating systems - neutral beam
injection and ion cyclotron resonance heating. Each of these systems consisted of a number of
separate units, so the power could be increased over time by increasing the number of injectors
and antennae. The plan was for an initial installation of a few megawatts in each system, to be
increased later to 25MW of neutral beams and an ion cyclotron power of around 15MW.
The choice of energy for the netural beam particles involved a compromise. At too low an
energy the beam would not penetrate to the centre of the plasma. At too high an energy the
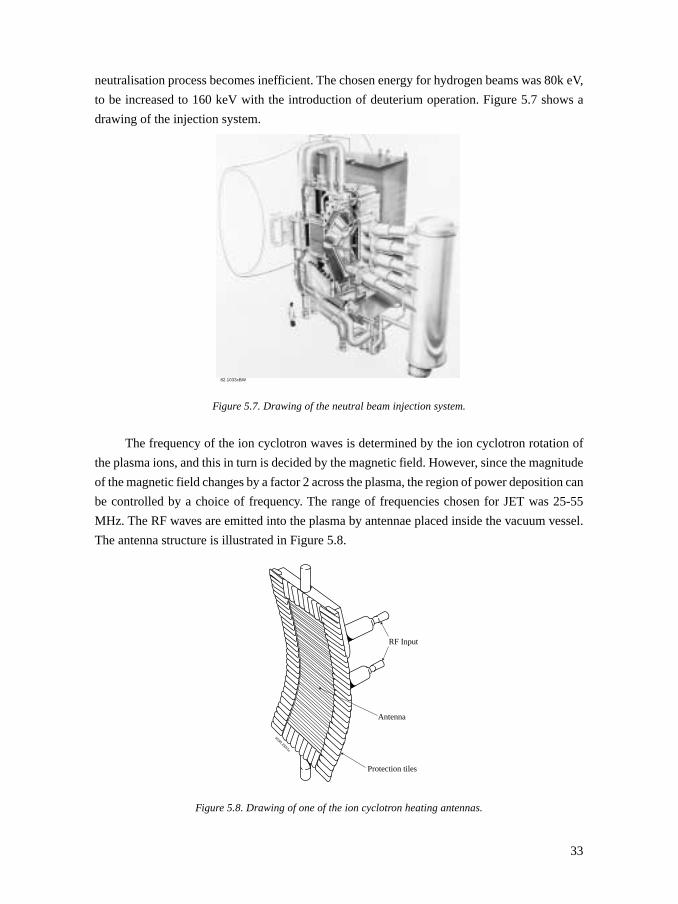
33
neutralisation process becomes inefficient. The chosen energy for hydrogen beams was 80k eV,
to be increased to 160 keV with the introduction of deuterium operation. Figure 5.7 shows a
drawing of the injection system.
82.1033cBW
Figure 5.7. Drawing of the neutral beam injection system.
The frequency of the ion cyclotron waves is determined by the ion cyclotron rotation of
the plasma ions, and this in turn is decided by the magnetic field. However, since the magnitude
of the magnetic field changes by a factor 2 across the plasma, the region of power deposition can
be controlled by a choice of frequency. The range of frequencies chosen for JET was 25-55
MHz. The RF waves are emitted into the plasma by antennae placed inside the vacuum vessel.
The antenna structure is illustrated in Figure 5.8.
Figure 5.8. Drawing of one of the ion cyclotron heating antennas.
RF Input
Antenna
Protection tiles
JG99.292/1c
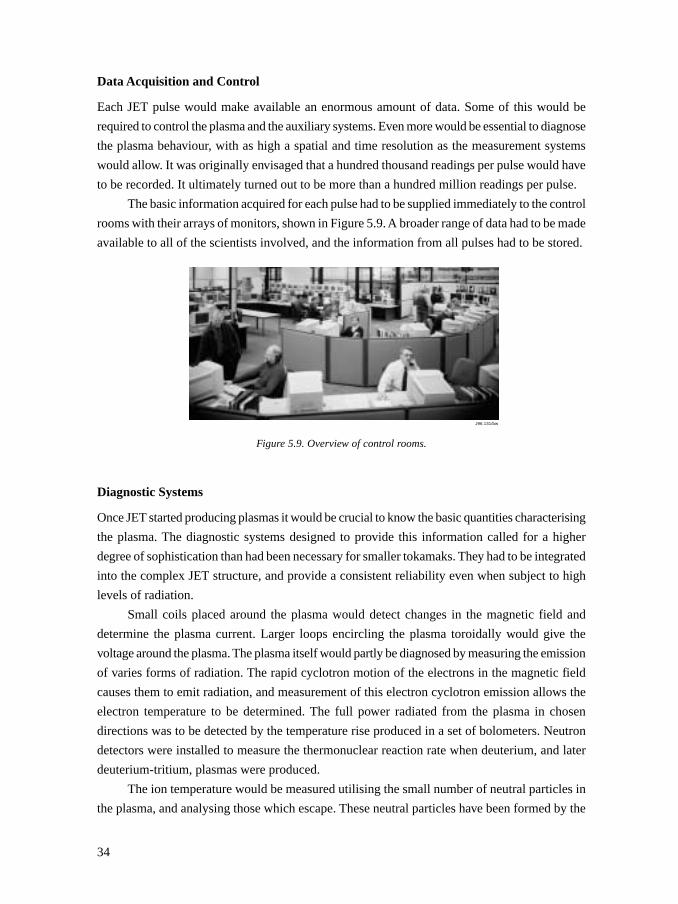
34
Data Acquisition and Control
Each JET pulse would make available an enormous amount of data. Some of this would be
required to control the plasma and the auxiliary systems. Even more would be essential to diagnose
the plasma behaviour, with as high a spatial and time resolution as the measurement systems
would allow. It was originally envisaged that a hundred thousand readings per pulse would have
to be recorded. It ultimately turned out to be more than a hundred million readings per pulse.
The basic information acquired for each pulse had to be supplied immediately to the control
rooms with their arrays of monitors, shown in Figure 5.9. A broader range of data had to be made
available to all of the scientists involved, and the information from all pulses had to be stored.
J96.131/bw
Figure 5.9. Overview of control rooms.
Diagnostic Systems
Once JET started producing plasmas it would be crucial to know the basic quantities characterising
the plasma. The diagnostic systems designed to provide this information called for a higher
degree of sophistication than had been necessary for smaller tokamaks. They had to be integrated
into the complex JET structure, and provide a consistent reliability even when subject to high
levels of radiation.
Small coils placed around the plasma would detect changes in the magnetic field and
determine the plasma current. Larger loops encircling the plasma toroidally would give the
voltage around the plasma. The plasma itself would partly be diagnosed by measuring the emission
of varies forms of radiation. The rapid cyclotron motion of the electrons in the magnetic field
causes them to emit radiation, and measurement of this electron cyclotron emission allows the
electron temperature to be determined. The full power radiated from the plasma in chosen
directions was to be detected by the temperature rise produced in a set of bolometers. Neutron
detectors were installed to measure the thermonuclear reaction rate when deuterium, and later
deuterium-tritium, plasmas were produced.
The ion temperature would be measured utilising the small number of neutral particles in
the plasma, and analysing those which escape. These neutral particles have been formed by the
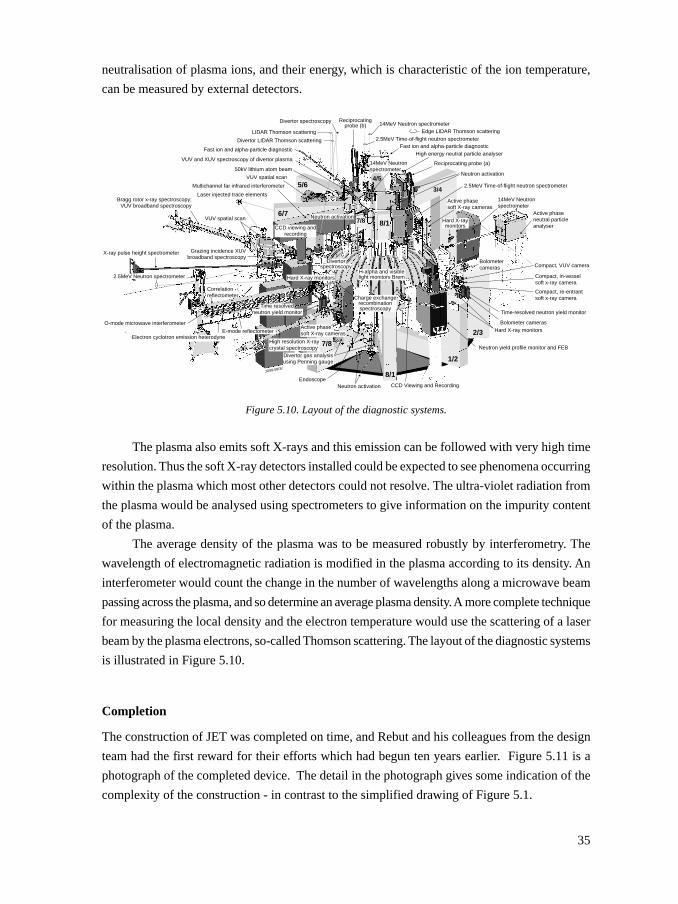
35
neutralisation of plasma ions, and their energy, which is characteristic of the ion temperature,
can be measured by external detectors.
Figure 5.10. Layout of the diagnostic systems.
The plasma also emits soft X-rays and this emission can be followed with very high time
resolution. Thus the soft X-ray detectors installed could be expected to see phenomena occurring
within the plasma which most other detectors could not resolve. The ultra-violet radiation from
the plasma would be analysed using spectrometers to give information on the impurity content
of the plasma.
The average density of the plasma was to be measured robustly by interferometry. The
wavelength of electromagnetic radiation is modified in the plasma according to its density. An
interferometer would count the change in the number of wavelengths along a microwave beam
passing across the plasma, and so determine an average plasma density. A more complete technique
for measuring the local density and the electron temperature would use the scattering of a laser
beam by the plasma electrons, so-called Thomson scattering. The layout of the diagnostic systems
is illustrated in Figure 5.10.
Completion
The construction of JET was completed on time, and Rebut and his colleagues from the design
team had the first reward for their efforts which had begun ten years earlier. Figure 5.11 is a
photograph of the completed device. The detail in the photograph gives some indication of the
complexity of the construction - in contrast to the simplified drawing of Figure 5.1.
Compact, VUV camera
Active phaseneutral particleanalyser
14MeV Neutronspectrometer
14MeV Neutron spectrometerDivertor spectroscopy
Neutron activation
2.5MeV Time-of-flight neutron spectrometer
Reciprocating probe (a)
Charge exchangerecombinationspectroscopy
Reciprocatingprobe (b)
High energy neutral particle analyser
Bolometer camerasHard X-ray monitors
Neutron yield profile monitor and FEB
Hard X-raymonitors
Compact, re-entrantsoft x-ray camera
Compact, in-vesselsoft x-ray camera
Time-resolved neutron yield monitor
CCD Viewing and RecordingNeutron activation
High resolution X-raycrystal spectroscopy
JG99.68/3c
Bolometercameras
Endoscope
2/3
1/2
8/1
7/8
8/16/7
5/6
7/8
4/5
3/4
Active phasesoft X-ray cameras
O-mode microwave interferometer
X-ray pulse height spectrometer
VUV spatial scan
VUV spatial scan
50kV lithium atom beam
VUV and XUV spectroscopy of divertor plasma
Fast ion and alpha-particle diagnostic
LIDAR Thomson scattering
Divertor LIDAR Thomson scattering
Laser injected trace elements
Multichannel far infrared interferometer
Grazing incidence XUVbroadband spectroscopy
Bragg rotor x-ray spectroscopy;VUV broadband spectroscopy
Electron cyclotron emission heterodyne
Active phasesoft X-ray cameras
14MeV Neutronspectrometer
Fast ion and alpha-particle diagnostic2.5MeV Time-of-flight neutron spectrometer
Edge LIDAR Thomson scattering
CCD viewing andrecording
Neutron activation
Time resolvedneutron yield monitor
Divertorspectroscopy
H-alpha and visiblelight monitors BremHard X-ray monitors
E-mode reflectometer
Correlationreflectometer
Divertor gas analysisusing Penning gauge
2.5MeV Neutron spectrometer
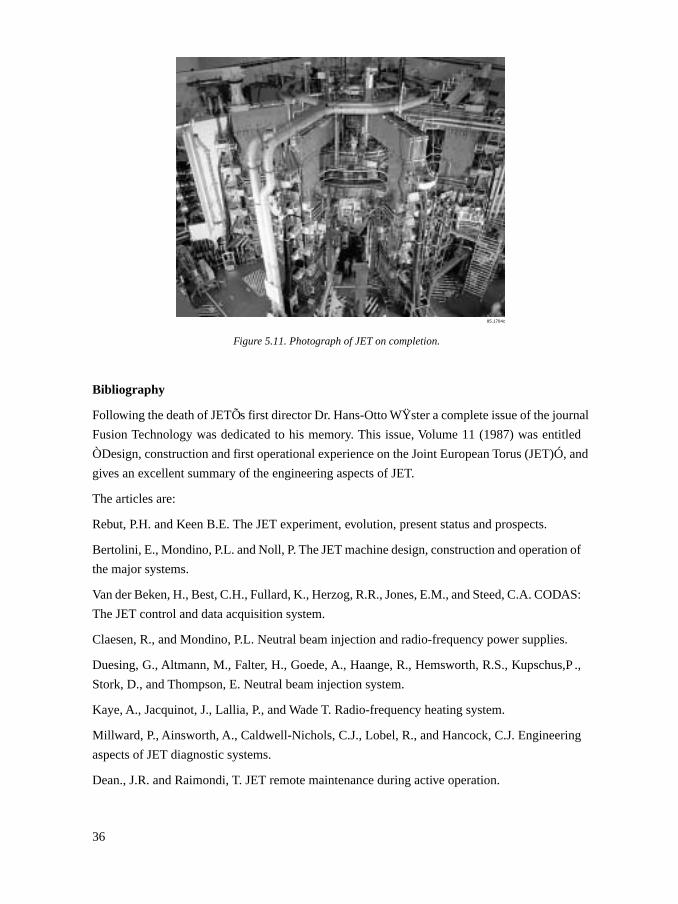
36
85.1784c
Figure 5.11. Photograph of JET on completion.
Bibliography
Following the death of JETÕs first director Dr. Hans-Otto WŸster a complete issue of the journal
Fusion Technology was dedicated to his memory. This issue, Volume 11 (1987) was entitled
ÒDesign, construction and first operational experience on the Joint European Torus (JET)Ó, and
gives an excellent summary of the engineering aspects of JET.
The articles are:
Rebut, P.H. and Keen B.E. The JET experiment, evolution, present status and prospects.
Bertolini, E., Mondino, P.L. and Noll, P. The JET machine design, construction and operation of
the major systems.
Van der Beken, H., Best, C.H., Fullard, K., Herzog, R.R., Jones, E.M., and Steed, C.A. CODAS:
The JET control and data acquisition system.
Claesen, R., and Mondino, P.L. Neutral beam injection and radio-frequency power supplies.
Duesing, G., Altmann, M., Falter, H., Goede, A., Haange, R., Hemsworth, R.S., Kupschus,P .,
Stork, D., and Thompson, E. Neutral beam injection system.
Kaye, A., Jacquinot, J., Lallia, P., and Wade T. Radio-frequency heating system.
Millward, P., Ainsworth, A., Caldwell-Nichols, C.J., Lobel, R., and Hancock, C.J. Engineering
aspects of JET diagnostic systems.
Dean., J.R. and Raimondi, T. JET remote maintenance during active operation.
37
6. AND NOW EXPERIMENTS
JET started operation in 1983, four years after site work began.
As the starting date approached, excitement was mixed with an appreciation that with
such a complex system there would be unexpected problems. However, the start of machine
operation went smoothly and the first plasma was produced on 25th June. The operator’s note
reads “first light, a bit of current”. The plasma current was a tiny 17kA, but in subsequent
plasmas the current was increased in stages and by October had reached 1 MA.
Operation of JET involved a large team of engineers and scientists, each of these groups
being based in a control room equipped with an array of monitors. The control rooms were over
a hundred metres from the tokamak itself. The conditions for forming the plasma were worked
out by the engineers and scientists in collaboration, the setting up procedure requiring the
programming the huge power supplies to provide the toroidal magnetic field and plasma current
necessary to generate and maintain the required plasma. The experimentalists had the diagnostic
systems ready for the moment the plasma current started and a plasma was formed.
An unusual experience for those operating JET was to be able to watch the traces of the
measured plasma characteristics on the computer screens in real time. At the start of fusion
research, plasmas typically lasted for a thousandth of a second. By the time the construction of
JET was started, times had increased to a fraction of a second. Now, with pulse lengths of ten
seconds it was possible to take an interest in the plasma evolution as it occurred.
In the early experiments the plasma was formed from hydrogen, and the only heating was
the ohmic heating of the plasma current. Despite this the early experimental results were eagerly
awaited. The result of most interest was the energy confinement time. It turned out to be in the
middle of the anticipated range, the best confinement times being about half a second. It would
have been encouraging to have found a much longer time, but at least the most pessimistic
forecasts could be discounted.
The temperatures were something of a surprise. Using empirical formulas for confinement,
temperatures of 1 keV or less had been predicted but temperatures of up to 4 keV were obtained.
This was partly due to the high level of impurity in the plasma, which substantially increased its
resistance and hence the ohmic heating. In retrospect it is now clear that another effect was
playing a role. It was explained earlier how particles can be trapped in the weaker, outboard
magnetic field. Electrons so trapped cannot carry their share of the current, and consequently the
resistance of the plasma is increased. In the experiments this increased the heating and raised the
temperature still further. At the time, any increased resistivity due to trapped particles was
conjectural and, as we shall see, it was only later that the phenomenon was directly demonstrated.
Although the high level of impurity produced a higher plasma temperature, it was completely
unacceptable. Many of the impurity atoms were not fully ionised and the residual atomic electrons
allow radiation and energy loss from the partially ionised ions. In the early experiments radiation

38
from impurities constituted 70% or more of the power lost from the plasma. A concern for the
longer term was that the presence of a high level of impurities would dilute the plasma and
reduce the thermonuclear power.
There were also indications that the presence of impurities played a direct role in the
abrupt disruptive terminations of the plasma which, as with other tokamaks, soon became a
regular feature of the experimental programme. It was conjectured that radiation from impurities
could lead to a contraction of the plasma leading to a violently unstable configuration. Disruptions
were to remain a serious problem and considerable effort was to be expended in clarifying their
causes.
Figure 6.1. Showing the growth of the plasma displacement resulting from the uncontrolledvertical instability.
Much of the behaviour on JET was familiar from experiments on smaller tokamaks.
However, in the early JET experiments the first of many unexpected phenomena appeared.
Figure 6.2. As the plasma moves downward during the instability it interacts with the vacuumvessel. The induced currents produce very large forces.
Plasma
Vacuumvessel
JG99.237/8c
0 0.1s tJG99.237/4c
1m
0
Downwarddisplacement
of plasma
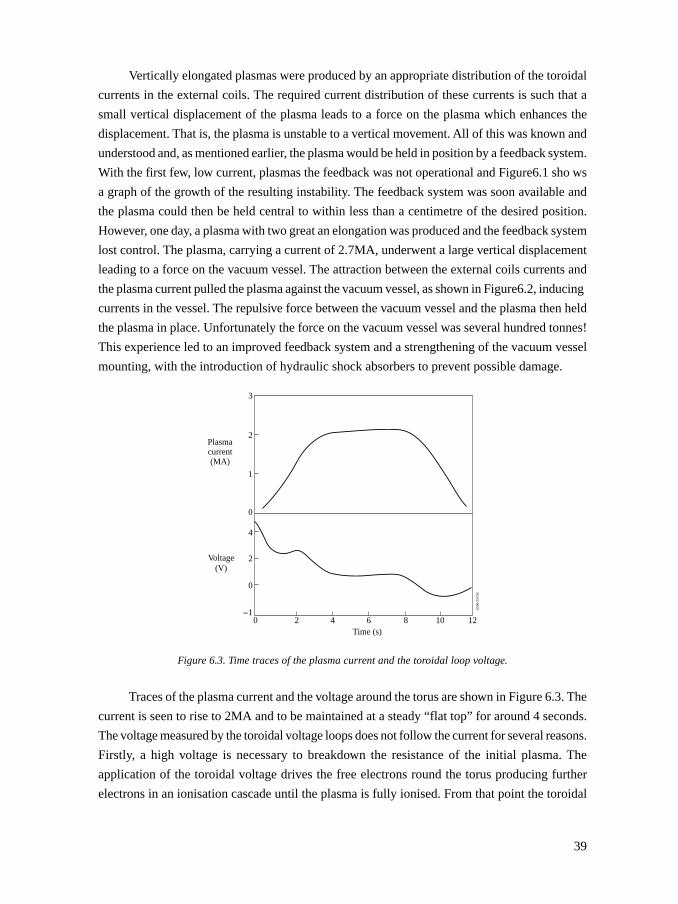
39
Vertically elongated plasmas were produced by an appropriate distribution of the toroidal
currents in the external coils. The required current distribution of these currents is such that a
small vertical displacement of the plasma leads to a force on the plasma which enhances the
displacement. That is, the plasma is unstable to a vertical movement. All of this was known and
understood and, as mentioned earlier, the plasma would be held in position by a feedback system.
With the first few, low current, plasmas the feedback was not operational and Figure6.1 sho ws
a graph of the growth of the resulting instability. The feedback system was soon available and
the plasma could then be held central to within less than a centimetre of the desired position.
However, one day, a plasma with two great an elongation was produced and the feedback system
lost control. The plasma, carrying a current of 2.7MA, underwent a large vertical displacement
leading to a force on the vacuum vessel. The attraction between the external coils currents and
the plasma current pulled the plasma against the vacuum vessel, as shown in Figure6.2, inducing
currents in the vessel. The repulsive force between the vacuum vessel and the plasma then held
the plasma in place. Unfortunately the force on the vacuum vessel was several hundred tonnes!
This experience led to an improved feedback system and a strengthening of the vacuum vessel
mounting, with the introduction of hydraulic shock absorbers to prevent possible damage.
Figure 6.3. Time traces of the plasma current and the toroidal loop voltage.
Traces of the plasma current and the voltage around the torus are shown in Figure 6.3. The
current is seen to rise to 2MA and to be maintained at a steady “flat top” for around 4 seconds.
The voltage measured by the toroidal voltage loops does not follow the current for several reasons.
Firstly, a high voltage is necessary to breakdown the resistance of the initial plasma. The
application of the toroidal voltage drives the free electrons round the torus producing further
electrons in an ionisation cascade until the plasma is fully ionised. From that point the toroidal
1
Plasmacurrent(MA)
Voltage(V)
0
4
2
0
-10 2 4 6
Time (s)8 10 12
JG99
.237
/2c
2
3
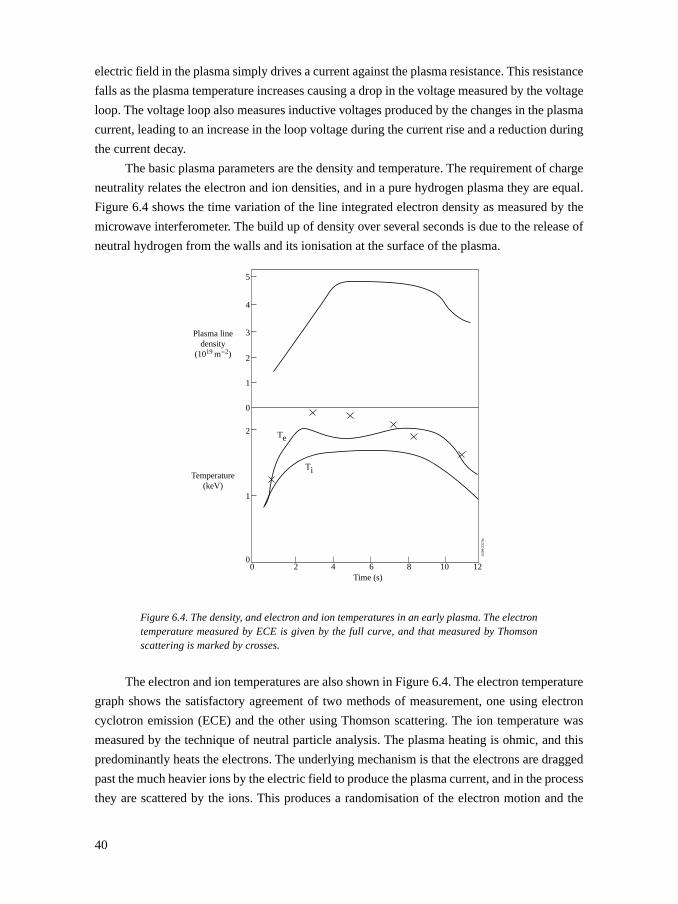
40
electric field in the plasma simply drives a current against the plasma resistance. This resistance
falls as the plasma temperature increases causing a drop in the voltage measured by the voltage
loop. The voltage loop also measures inductive voltages produced by the changes in the plasma
current, leading to an increase in the loop voltage during the current rise and a reduction during
the current decay.
The basic plasma parameters are the density and temperature. The requirement of charge
neutrality relates the electron and ion densities, and in a pure hydrogen plasma they are equal.
Figure 6.4 shows the time variation of the line integrated electron density as measured by the
microwave interferometer. The build up of density over several seconds is due to the release of
neutral hydrogen from the walls and its ionisation at the surface of the plasma.
Figure 6.4. The density, and electron and ion temperatures in an early plasma. The electrontemperature measured by ECE is given by the full curve, and that measured by Thomsonscattering is marked by crosses.
The electron and ion temperatures are also shown in Figure 6.4. The electron temperature
graph shows the satisfactory agreement of two methods of measurement, one using electron
cyclotron emission (ECE) and the other using Thomson scattering. The ion temperature was
measured by the technique of neutral particle analysis. The plasma heating is ohmic, and this
predominantly heats the electrons. The underlying mechanism is that the electrons are dragged
past the much heavier ions by the electric field to produce the plasma current, and in the process
they are scattered by the ions. This produces a randomisation of the electron motion and the
0 2
5
4
3
2
2
1
0
Te
Ti
Plasma linedensity
(1019 m
-2)
Temperature(keV)
1
04 6
Time (s)8 10 12
JG99
.237
/3c
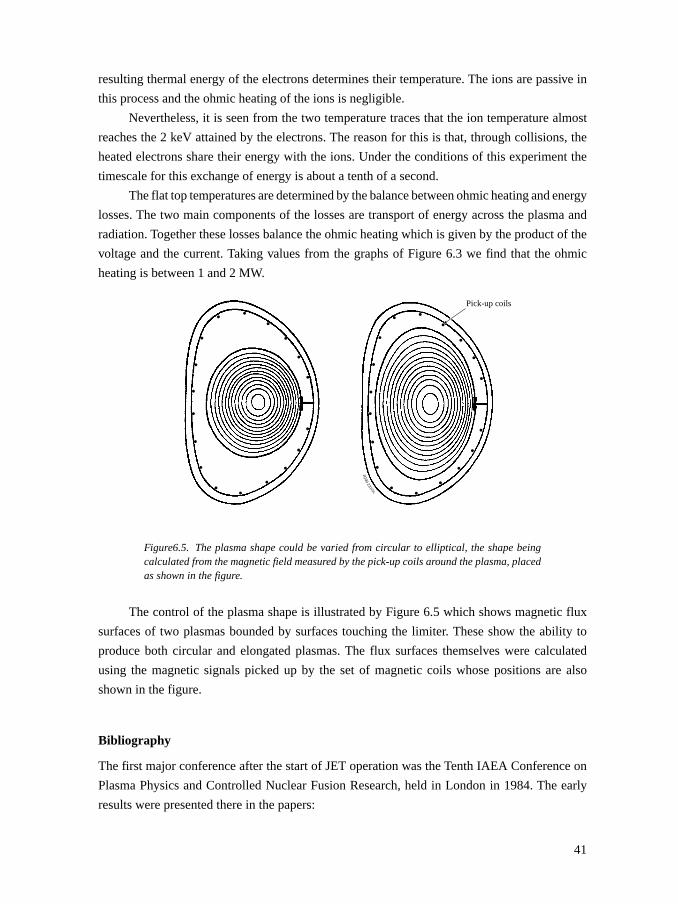
41
resulting thermal energy of the electrons determines their temperature. The ions are passive in
this process and the ohmic heating of the ions is negligible.
Nevertheless, it is seen from the two temperature traces that the ion temperature almost
reaches the 2 keV attained by the electrons. The reason for this is that, through collisions, the
heated electrons share their energy with the ions. Under the conditions of this experiment the
timescale for this exchange of energy is about a tenth of a second.
The flat top temperatures are determined by the balance between ohmic heating and energy
losses. The two main components of the losses are transport of energy across the plasma and
radiation. Together these losses balance the ohmic heating which is given by the product of the
voltage and the current. Taking values from the graphs of Figure 6.3 we find that the ohmic
heating is between 1 and 2 MW.
Figure6.5. The plasma shape could be varied from circular to elliptical, the shape beingcalculated from the magnetic field measured by the pick-up coils around the plasma, placedas shown in the figure.
The control of the plasma shape is illustrated by Figure 6.5 which shows magnetic flux
surfaces of two plasmas bounded by surfaces touching the limiter. These show the ability to
produce both circular and elongated plasmas. The flux surfaces themselves were calculated
using the magnetic signals picked up by the set of magnetic coils whose positions are also
shown in the figure.
Bibliography
The first major conference after the start of JET operation was the Tenth IAEA Conference on
Plasma Physics and Controlled Nuclear Fusion Research, held in London in 1984. The early
results were presented there in the papers:
Pick-up coilsJG
99237/1c
42
Rebut, P.H., et al. First experiments in JET. Vol. I p11.
Cordey, J.G. et al. Particle and energy confinement in ohmically heated JET plasmas. Vol. I
p167.
Behringer, K.H. et al. Impurity studies and transport code modelling of JET plasmas. Vol. I
p291.
Thomas, P.R., Wesson, J.A., et al. MHD behaviour and discharge optimisation in JET. Vol.I.
p353.
This last paper reports the first observations of the vertical instability, and a more complete
account is given in
Noll, P. et al. Stabilisation of vertical position and control of plasma shape in JET. Proc. 11th
Symposium on Fusion Engineering , Texes 1985. Vol. I p33.
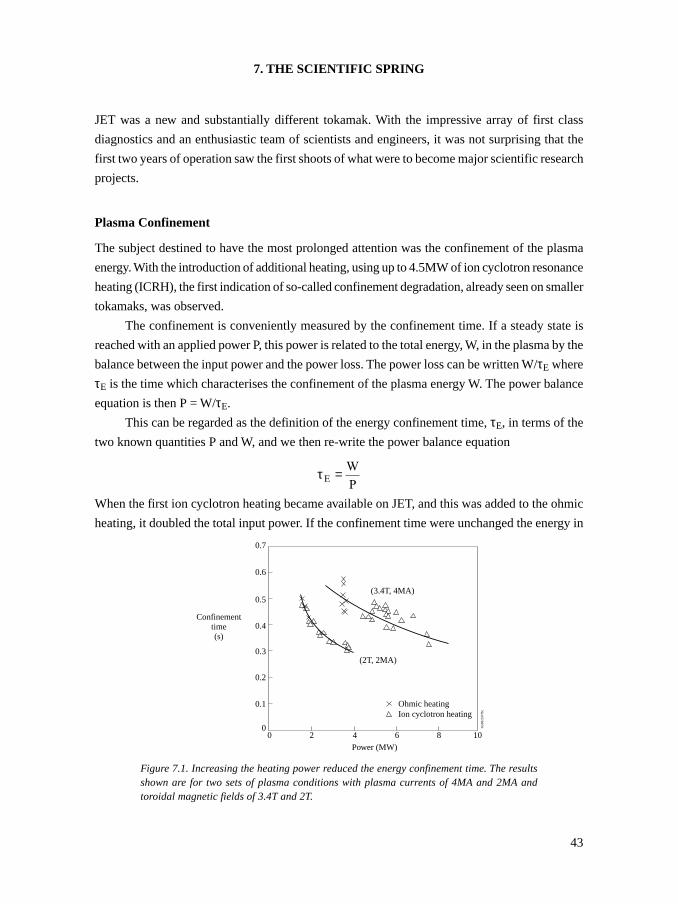
43
7. THE SCIENTIFIC SPRING
JET was a new and substantially different tokamak. With the impressive array of first class
diagnostics and an enthusiastic team of scientists and engineers, it was not surprising that the
first two years of operation saw the first shoots of what were to become major scientific research
projects.
Plasma Confinement
The subject destined to have the most prolonged attention was the confinement of the plasma
energy. With the introduction of additional heating, using up to 4.5MW of ion cyclotron resonance
heating (ICRH), the first indication of so-called confinement degradation, already seen on smaller
tokamaks, was observed.
The confinement is conveniently measured by the confinement time. If a steady state is
reached with an applied power P, this power is related to the total energy, W, in the plasma by the
balance between the input power and the power loss. The power loss can be written W/τE where
τE is the time which characterises the confinement of the plasma energy W. The power balance
equation is then P = W/τE.
This can be regarded as the definition of the energy confinement time, τE, in terms of the
two known quantities P and W, and we then re-write the power balance equation
τ EW
P=
When the first ion cyclotron heating became available on JET, and this was added to the ohmic
heating, it doubled the total input power. If the confinement time were unchanged the energy in
Figure 7.1. Increasing the heating power reduced the energy confinement time. The resultsshown are for two sets of plasma conditions with plasma currents of 4MA and 2MA andtoroidal magnetic fields of 3.4T and 2T.
(3.4T, 4MA)
(2T, 2MA)
Ohmic heatingIon cyclotron heating
0 2
0.7
0.6
Confinementtime(s)
0.5
0.4
0.3
0.2
0.1
04 6Power (MW)
JG99
.237
/5c
8 10
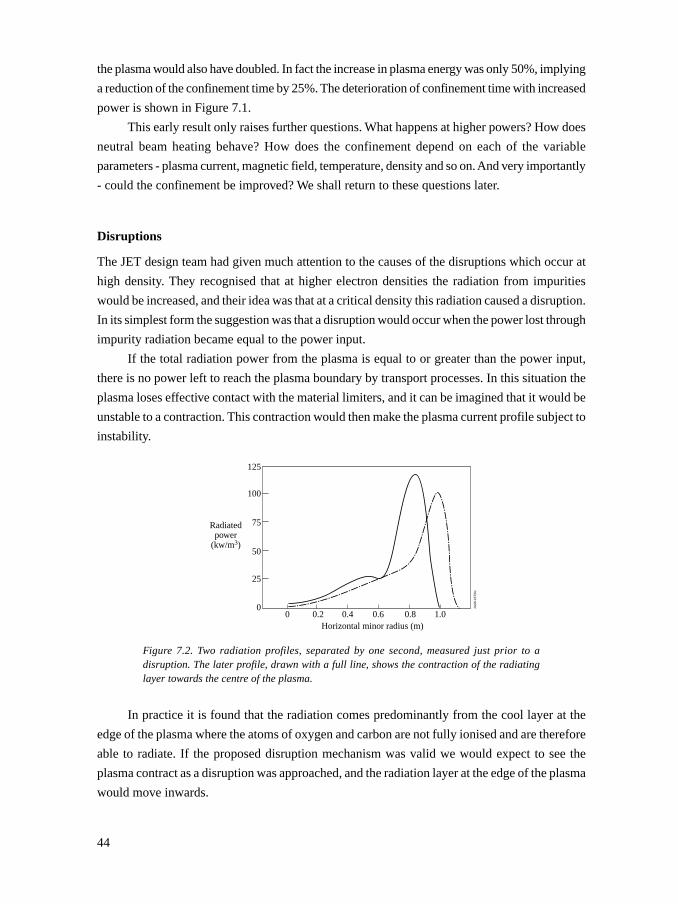
44
the plasma would also have doubled. In fact the increase in plasma energy was only 50%, implying
a reduction of the confinement time by 25%. The deterioration of confinement time with increased
power is shown in Figure 7.1.
This early result only raises further questions. What happens at higher powers? How does
neutral beam heating behave? How does the confinement depend on each of the variable
parameters - plasma current, magnetic field, temperature, density and so on. And very importantly
- could the confinement be improved? We shall return to these questions later.
Disruptions
The JET design team had given much attention to the causes of the disruptions which occur at
high density. They recognised that at higher electron densities the radiation from impurities
would be increased, and their idea was that at a critical density this radiation caused a disruption.
In its simplest form the suggestion was that a disruption would occur when the power lost through
impurity radiation became equal to the power input.
If the total radiation power from the plasma is equal to or greater than the power input,
there is no power left to reach the plasma boundary by transport processes. In this situation the
plasma loses effective contact with the material limiters, and it can be imagined that it would be
unstable to a contraction. This contraction would then make the plasma current profile subject to
instability.
Figure 7.2. Two radiation profiles, separated by one second, measured just prior to adisruption. The later profile, drawn with a full line, shows the contraction of the radiatinglayer towards the centre of the plasma.
In practice it is found that the radiation comes predominantly from the cool layer at the
edge of the plasma where the atoms of oxygen and carbon are not fully ionised and are therefore
able to radiate. If the proposed disruption mechanism was valid we would expect to see the
plasma contract as a disruption was approached, and the radiation layer at the edge of the plasma
would move inwards.
100
75Radiatedpower
(kw/m3)50
125
25
00 0.2 0.4
Horizontal minor radius (m)0.6 0.8 1.0
JG99
.237
/6c
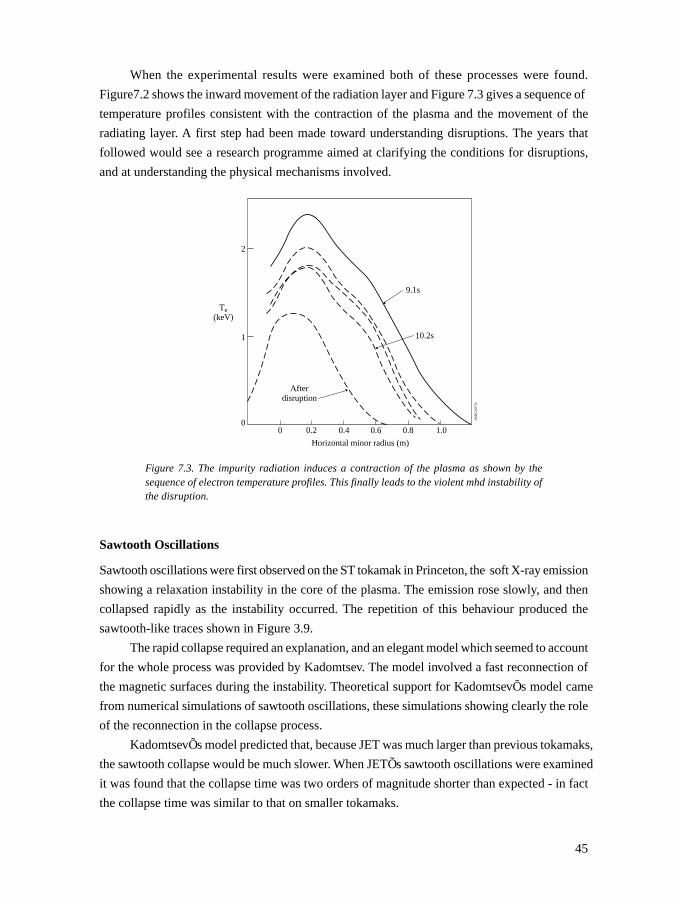
45
When the experimental results were examined both of these processes were found.
Figure7.2 shows the inward movement of the radiation layer and Figure 7.3 gives a sequence of
temperature profiles consistent with the contraction of the plasma and the movement of the
radiating layer. A first step had been made toward understanding disruptions. The years that
followed would see a research programme aimed at clarifying the conditions for disruptions,
and at understanding the physical mechanisms involved.
Figure 7.3. The impurity radiation induces a contraction of the plasma as shown by thesequence of electron temperature profiles. This finally leads to the violent mhd instability ofthe disruption.
Sawtooth Oscillations
Sawtooth oscillations were first observed on the ST tokamak in Princeton, the soft X-ray emission
showing a relaxation instability in the core of the plasma. The emission rose slowly, and then
collapsed rapidly as the instability occurred. The repetition of this behaviour produced the
sawtooth-like traces shown in Figure 3.9.
The rapid collapse required an explanation, and an elegant model which seemed to account
for the whole process was provided by Kadomtsev. The model involved a fast reconnection of
the magnetic surfaces during the instability. Theoretical support for KadomtsevÕs model came
from numerical simulations of sawtooth oscillations, these simulations showing clearly the role
of the reconnection in the collapse process.
KadomtsevÕs model predicted that, because JET was much larger than previous tokamaks,
the sawtooth collapse would be much slower. When JETÕs sawtooth oscillations were examined
it was found that the collapse time was two orders of magnitude shorter than expected - in fact
the collapse time was similar to that on smaller tokamaks.
2
Te(keV)
1
00 0.2 0.4
Horizontal minor radius (m)
9.1s
10.2s
Afterdisruption
0.6 0.8 1.0
JG99
.237
/7c
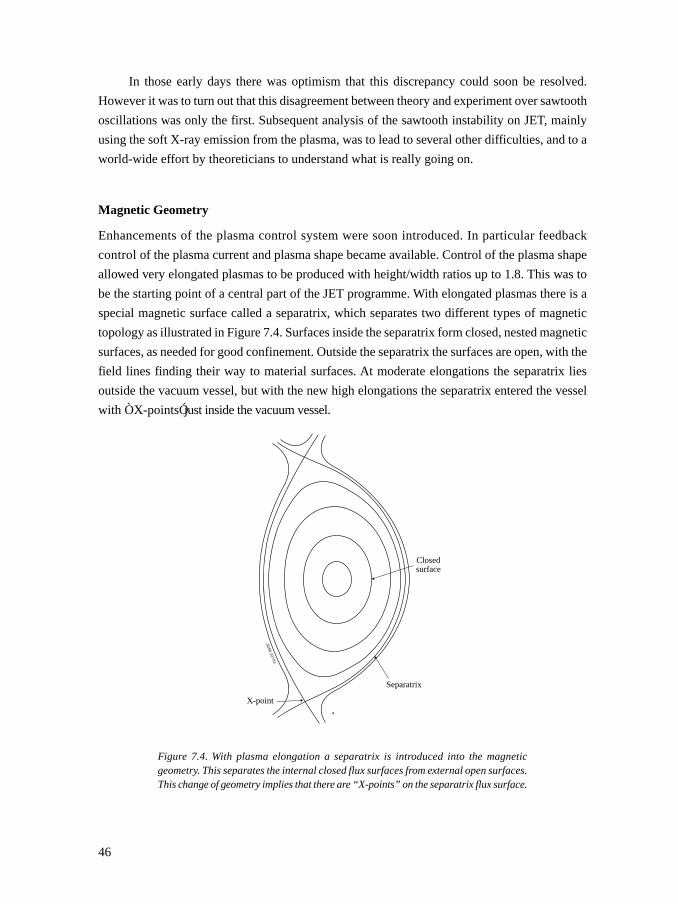
46
In those early days there was optimism that this discrepancy could soon be resolved.
However it was to turn out that this disagreement between theory and experiment over sawtooth
oscillations was only the first. Subsequent analysis of the sawtooth instability on JET, mainly
using the soft X-ray emission from the plasma, was to lead to several other difficulties, and to a
world-wide effort by theoreticians to understand what is really going on.
Magnetic Geometry
Enhancements of the plasma control system were soon introduced. In particular feedback
control of the plasma current and plasma shape became available. Control of the plasma shape
allowed very elongated plasmas to be produced with height/width ratios up to 1.8. This was to
be the starting point of a central part of the JET programme. With elongated plasmas there is a
special magnetic surface called a separatrix, which separates two different types of magnetic
topology as illustrated in Figure 7.4. Surfaces inside the separatrix form closed, nested magnetic
surfaces, as needed for good confinement. Outside the separatrix the surfaces are open, with the
field lines finding their way to material surfaces. At moderate elongations the separatrix lies
outside the vacuum vessel, but with the new high elongations the separatrix entered the vessel
with ÒX-pointsÓ just inside the vacuum vessel.
Closedsurface
Separatrix
X-point
JG99.227/1c
Figure 7.4. With plasma elongation a separatrix is introduced into the magneticgeometry. This separates the internal closed flux surfaces from external open surfaces.This change of geometry implies that there are “X-points” on the separatrix flux surface.
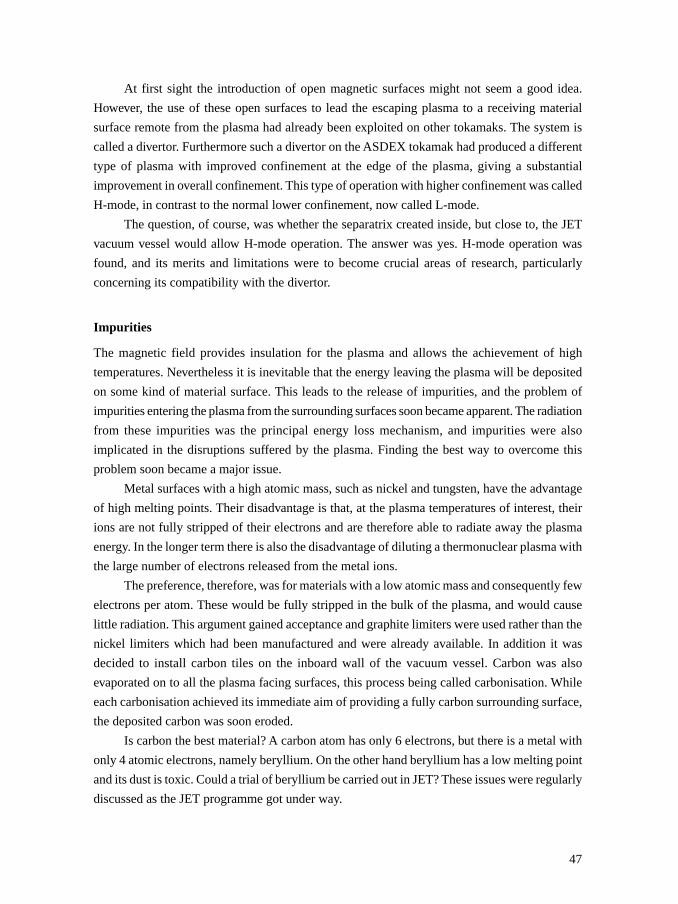
47
At first sight the introduction of open magnetic surfaces might not seem a good idea.
However, the use of these open surfaces to lead the escaping plasma to a receiving material
surface remote from the plasma had already been exploited on other tokamaks. The system is
called a divertor. Furthermore such a divertor on the ASDEX tokamak had produced a different
type of plasma with improved confinement at the edge of the plasma, giving a substantial
improvement in overall confinement. This type of operation with higher confinement was called
H-mode, in contrast to the normal lower confinement, now called L-mode.
The question, of course, was whether the separatrix created inside, but close to, the JET
vacuum vessel would allow H-mode operation. The answer was yes. H-mode operation was
found, and its merits and limitations were to become crucial areas of research, particularly
concerning its compatibility with the divertor.
Impurities
The magnetic field provides insulation for the plasma and allows the achievement of high
temperatures. Nevertheless it is inevitable that the energy leaving the plasma will be deposited
on some kind of material surface. This leads to the release of impurities, and the problem of
impurities entering the plasma from the surrounding surfaces soon became apparent. The radiation
from these impurities was the principal energy loss mechanism, and impurities were also
implicated in the disruptions suffered by the plasma. Finding the best way to overcome this
problem soon became a major issue.
Metal surfaces with a high atomic mass, such as nickel and tungsten, have the advantage
of high melting points. Their disadvantage is that, at the plasma temperatures of interest, their
ions are not fully stripped of their electrons and are therefore able to radiate away the plasma
energy. In the longer term there is also the disadvantage of diluting a thermonuclear plasma with
the large number of electrons released from the metal ions.
The preference, therefore, was for materials with a low atomic mass and consequently few
electrons per atom. These would be fully stripped in the bulk of the plasma, and would cause
little radiation. This argument gained acceptance and graphite limiters were used rather than the
nickel limiters which had been manufactured and were already available. In addition it was
decided to install carbon tiles on the inboard wall of the vacuum vessel. Carbon was also
evaporated on to all the plasma facing surfaces, this process being called carbonisation. While
each carbonisation achieved its immediate aim of providing a fully carbon surrounding surface,
the deposited carbon was soon eroded.
Is carbon the best material? A carbon atom has only 6 electrons, but there is a metal with
only 4 atomic electrons, namely beryllium. On the other hand beryllium has a low melting point
and its dust is toxic. Could a trial of beryllium be carried out in JET? These issues were regularly
discussed as the JET programme got under way.
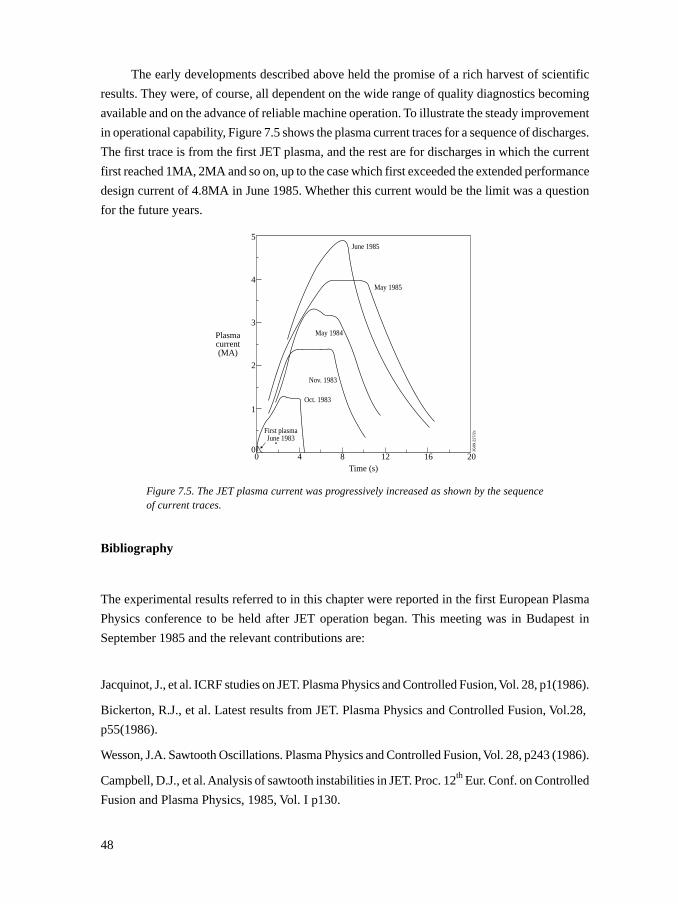
48
The early developments described above held the promise of a rich harvest of scientific
results. They were, of course, all dependent on the wide range of quality diagnostics becoming
available and on the advance of reliable machine operation. To illustrate the steady improvement
in operational capability, Figure 7.5 shows the plasma current traces for a sequence of discharges.
The first trace is from the first JET plasma, and the rest are for discharges in which the current
first reached 1MA, 2MA and so on, up to the case which first exceeded the extended performance
design current of 4.8MA in June 1985. Whether this current would be the limit was a question
for the future years.
Figure 7.5. The JET plasma current was progressively increased as shown by the sequenceof current traces.
Bibliography
The experimental results referred to in this chapter were reported in the first European Plasma
Physics conference to be held after JET operation began. This meeting was in Budapest in
September 1985 and the relevant contributions are:
Jacquinot, J., et al. ICRF studies on JET. Plasma Physics and Controlled Fusion, Vol. 28, p1(1986).
Bickerton, R.J., et al. Latest results from JET. Plasma Physics and Controlled Fusion, Vol.28,
p55(1986).
Wesson, J.A. Sawtooth Oscillations. Plasma Physics and Controlled Fusion, Vol. 28, p243 (1986).
Campbell, D.J., et al. Analysis of sawtooth instabilities in JET. Proc. 12th Eur. Conf. on Controlled
Fusion and Plasma Physics, 1985, Vol. I p130.
JG99
.227
/2c
5
4
3
1
00 4 8 12
Time (s)
Plasmacurrent(MA)
16 20
2
First plasmaJune 1983
Nov. 1983
Oct. 1983
May 1984
May 1985
June 1985
49
Wesson, J., Gowers, C., Han, W., Mast, F., Nave, F., Turner, M. and Watkins, M. Density limit
disruptions in JET, Proc. 12th Eur. Conf. on Controlled Fusion and Plasma Physics, 1985, Vol. I,
p147.
Tanga, A., et al. The formation of a magnetic separatrix in JET. Proc. 12th Eur. Conf. on Controlled
Fusion and Plasma Physics, 1985, Vol. I, p70.
Denne, B., et al. Spectroscopic measurements of the impurity content of JET plasmas with ohmic
and RF heating. Proc. 12th Eur. Conf. on Plasma Physics and Controlled Fusion, 1985, Vol. I,
p379.
The suggestion that density limit disruptions occur at a critical level of radiation power loss was
made by
Gibson, A. Radiation limits to tokamak operation. Nuclear Fusion 16, 546 (1976),
and the idea was further developed by
Rebut, P.H. and Green, B.J. Effect of impurity radiation on tokamak equilibrium. Plasma Physics
and Controlled Fusion Research (Proc. 6th Int. Conf. Berchtesgaden 1976) Vol. 2, 3IAEA Vienna
(1977).

50
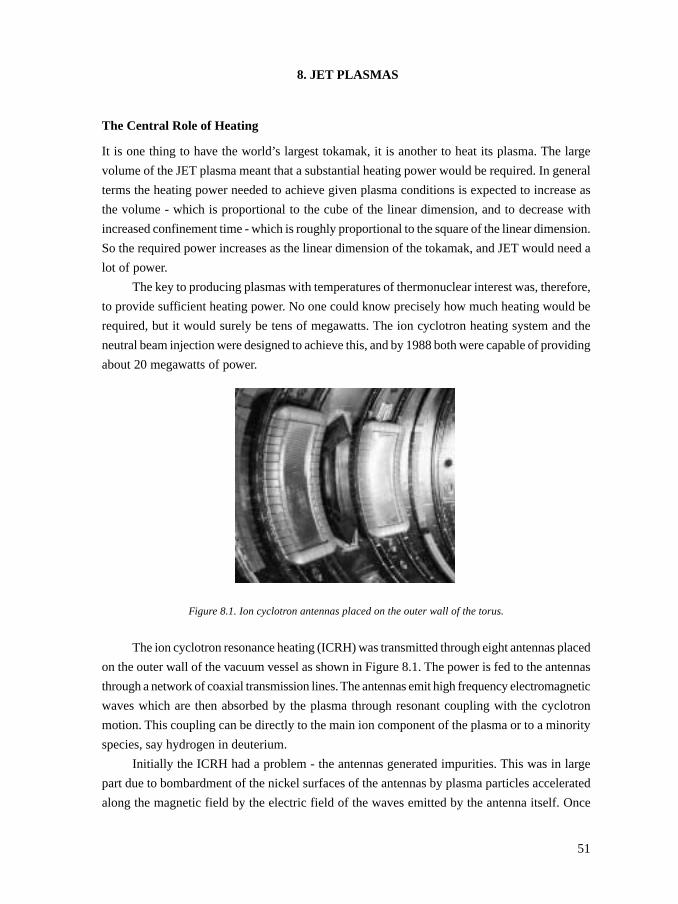
51
8. JET PLASMAS
The Central Role of Heating
It is one thing to have the world’s largest tokamak, it is another to heat its plasma. The large
volume of the JET plasma meant that a substantial heating power would be required. In general
terms the heating power needed to achieve given plasma conditions is expected to increase as
the volume - which is proportional to the cube of the linear dimension, and to decrease with
increased confinement time - which is roughly proportional to the square of the linear dimension.
So the required power increases as the linear dimension of the tokamak, and JET would need a
lot of power.
The key to producing plasmas with temperatures of thermonuclear interest was, therefore,
to provide sufficient heating power. No one could know precisely how much heating would be
required, but it would surely be tens of megawatts. The ion cyclotron heating system and the
neutral beam injection were designed to achieve this, and by 1988 both were capable of providing
about 20 megawatts of power.
Figure 8.1. Ion cyclotron antennas placed on the outer wall of the torus.
The ion cyclotron resonance heating (ICRH) was transmitted through eight antennas placed
on the outer wall of the vacuum vessel as shown in Figure 8.1. The power is fed to the antennas
through a network of coaxial transmission lines. The antennas emit high frequency electromagnetic
waves which are then absorbed by the plasma through resonant coupling with the cyclotron
motion. This coupling can be directly to the main ion component of the plasma or to a minority
species, say hydrogen in deuterium.
Initially the ICRH had a problem - the antennas generated impurities. This was in large
part due to bombardment of the nickel surfaces of the antennas by plasma particles accelerated
along the magnetic field by the electric field of the waves emitted by the antenna itself. Once
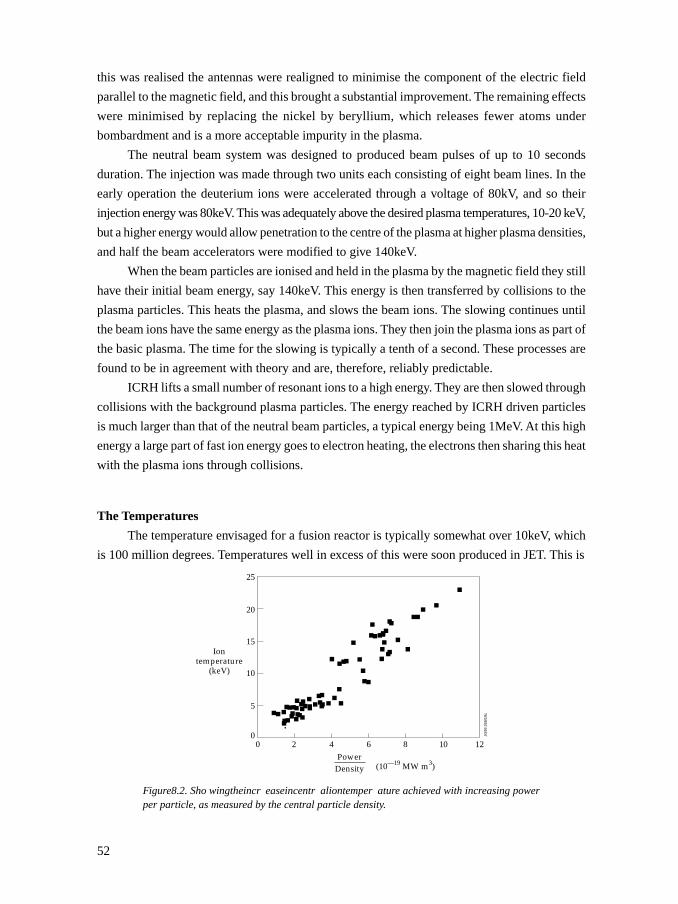
52
this was realised the antennas were realigned to minimise the component of the electric field
parallel to the magnetic field, and this brought a substantial improvement. The remaining effects
were minimised by replacing the nickel by beryllium, which releases fewer atoms under
bombardment and is a more acceptable impurity in the plasma.
The neutral beam system was designed to produced beam pulses of up to 10 seconds
duration. The injection was made through two units each consisting of eight beam lines. In the
early operation the deuterium ions were accelerated through a voltage of 80kV, and so their
injection energy was 80keV. This was adequately above the desired plasma temperatures, 10-20 keV,
but a higher energy would allow penetration to the centre of the plasma at higher plasma densities,
and half the beam accelerators were modified to give 140keV.
When the beam particles are ionised and held in the plasma by the magnetic field they still
have their initial beam energy, say 140keV. This energy is then transferred by collisions to the
plasma particles. This heats the plasma, and slows the beam ions. The slowing continues until
the beam ions have the same energy as the plasma ions. They then join the plasma ions as part of
the basic plasma. The time for the slowing is typically a tenth of a second. These processes are
found to be in agreement with theory and are, therefore, reliably predictable.
ICRH lifts a small number of resonant ions to a high energy. They are then slowed through
collisions with the background plasma particles. The energy reached by ICRH driven particles
is much larger than that of the neutral beam particles, a typical energy being 1MeV. At this high
energy a large part of fast ion energy goes to electron heating, the electrons then sharing this heat
with the plasma ions through collisions.
The Temperatures
The temperature envisaged for a fusion reactor is typically somewhat over 10keV, which
is 100 million degrees. Temperatures well in excess of this were soon produced in JET. This is
Figure8.2. Sho wingtheincr easeincentr aliontemper ature achieved with increasing powerper particle, as measured by the central particle density.
Iontemperature
(keV)
25
020 4
JG99
.269
/19c
20
15
5
10
8 106 12
(10—19 MW m3)
PowerDensity
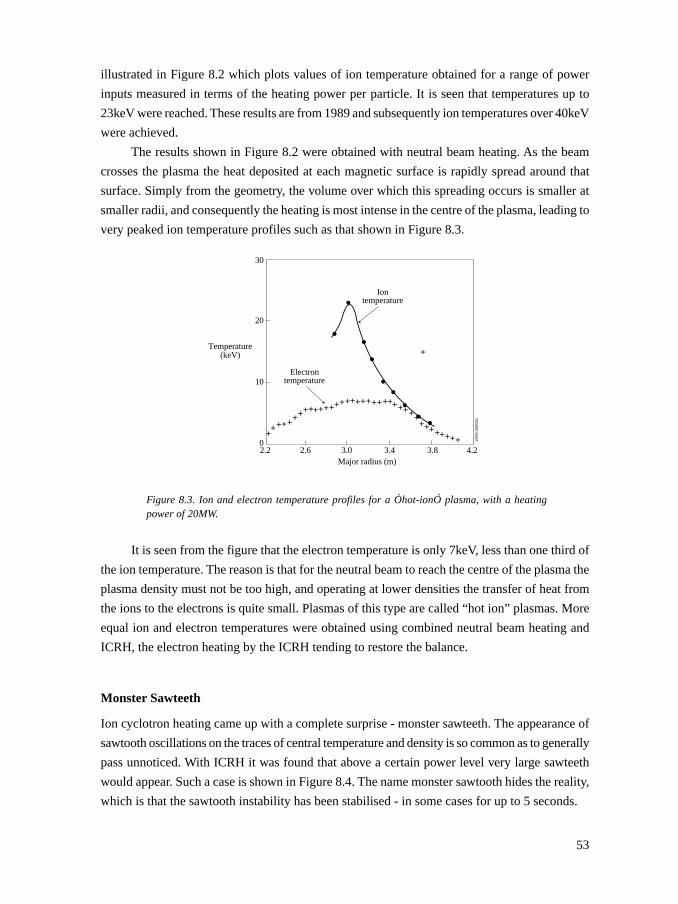
53
illustrated in Figure 8.2 which plots values of ion temperature obtained for a range of power
inputs measured in terms of the heating power per particle. It is seen that temperatures up to
23keV were reached. These results are from 1989 and subsequently ion temperatures over 40keV
were achieved.
The results shown in Figure 8.2 were obtained with neutral beam heating. As the beam
crosses the plasma the heat deposited at each magnetic surface is rapidly spread around that
surface. Simply from the geometry, the volume over which this spreading occurs is smaller at
smaller radii, and consequently the heating is most intense in the centre of the plasma, leading to
very peaked ion temperature profiles such as that shown in Figure 8.3.
Figure 8.3. Ion and electron temperature profiles for a Òhot-ionÓ plasma, with a heatingpower of 20MW.
It is seen from the figure that the electron temperature is only 7keV, less than one third of
the ion temperature. The reason is that for the neutral beam to reach the centre of the plasma the
plasma density must not be too high, and operating at lower densities the transfer of heat from
the ions to the electrons is quite small. Plasmas of this type are called “hot ion” plasmas. More
equal ion and electron temperatures were obtained using combined neutral beam heating and
ICRH, the electron heating by the ICRH tending to restore the balance.
Monster Sawteeth
Ion cyclotron heating came up with a complete surprise - monster sawteeth. The appearance of
sawtooth oscillations on the traces of central temperature and density is so common as to generally
pass unnoticed. With ICRH it was found that above a certain power level very large sawteeth
would appear. Such a case is shown in Figure 8.4. The name monster sawtooth hides the reality,
which is that the sawtooth instability has been stabilised - in some cases for up to 5 seconds.
2.2
10
0
20
Iontemperature
Electrontemperature
30
2.6 3.0 3.4 3.8 4.2
JG99
.269
/20c
Major radius (m)
Temperature(keV)
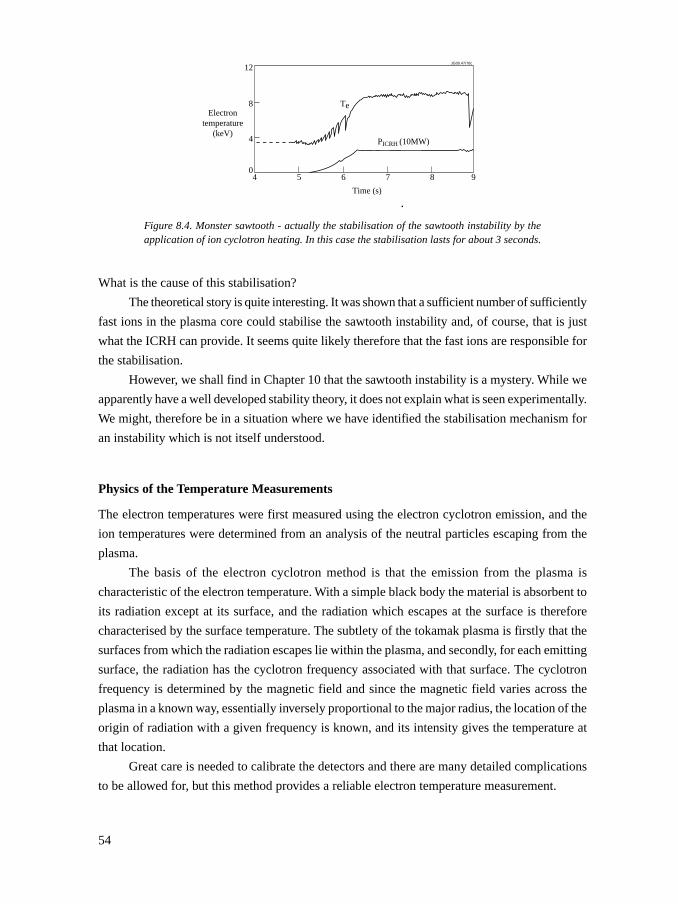
54
Figure 8.4. Monster sawtooth - actually the stabilisation of the sawtooth instability by theapplication of ion cyclotron heating. In this case the stabilisation lasts for about 3 seconds.
What is the cause of this stabilisation?
The theoretical story is quite interesting. It was shown that a sufficient number of sufficiently
fast ions in the plasma core could stabilise the sawtooth instability and, of course, that is just
what the ICRH can provide. It seems quite likely therefore that the fast ions are responsible for
the stabilisation.
However, we shall find in Chapter 10 that the sawtooth instability is a mystery. While we
apparently have a well developed stability theory, it does not explain what is seen experimentally.
We might, therefore be in a situation where we have identified the stabilisation mechanism for
an instability which is not itself understood.
Physics of the Temperature Measurements
The electron temperatures were first measured using the electron cyclotron emission, and the
ion temperatures were determined from an analysis of the neutral particles escaping from the
plasma.
The basis of the electron cyclotron method is that the emission from the plasma is
characteristic of the electron temperature. With a simple black body the material is absorbent to
its radiation except at its surface, and the radiation which escapes at the surface is therefore
characterised by the surface temperature. The subtlety of the tokamak plasma is firstly that the
surfaces from which the radiation escapes lie within the plasma, and secondly, for each emitting
surface, the radiation has the cyclotron frequency associated with that surface. The cyclotron
frequency is determined by the magnetic field and since the magnetic field varies across the
plasma in a known way, essentially inversely proportional to the major radius, the location of the
origin of radiation with a given frequency is known, and its intensity gives the temperature at
that location.
Great care is needed to calibrate the detectors and there are many detailed complications
to be allowed for, but this method provides a reliable electron temperature measurement.
Electrontemperature
(keV)
54
Time (s)
JG00.47/76c
0
8
4
12
6 7 8 9
Te
PICRH (10MW)
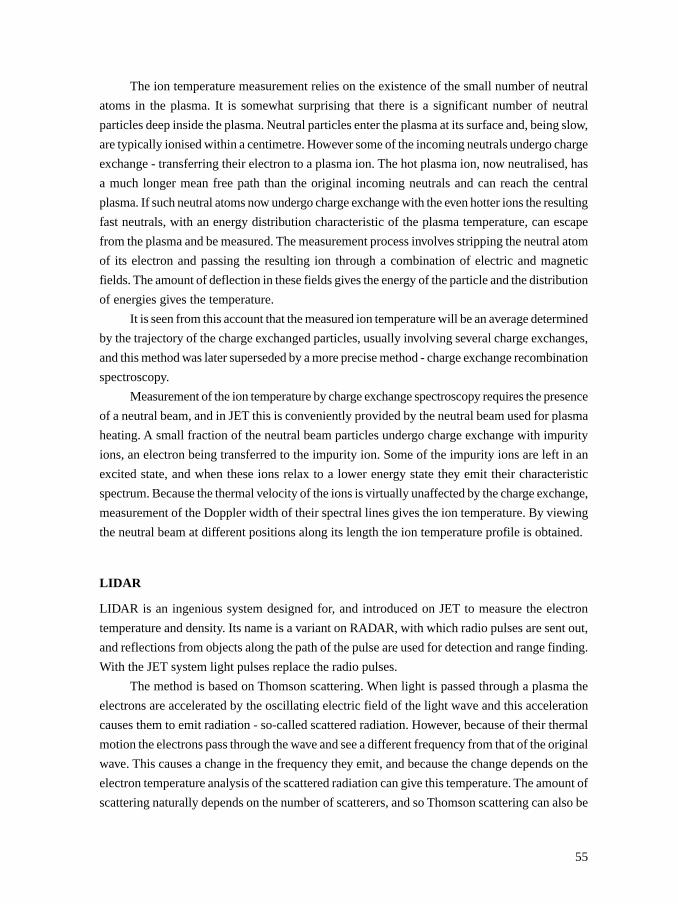
55
The ion temperature measurement relies on the existence of the small number of neutral
atoms in the plasma. It is somewhat surprising that there is a significant number of neutral
particles deep inside the plasma. Neutral particles enter the plasma at its surface and, being slow,
are typically ionised within a centimetre. However some of the incoming neutrals undergo charge
exchange - transferring their electron to a plasma ion. The hot plasma ion, now neutralised, has
a much longer mean free path than the original incoming neutrals and can reach the central
plasma. If such neutral atoms now undergo charge exchange with the even hotter ions the resulting
fast neutrals, with an energy distribution characteristic of the plasma temperature, can escape
from the plasma and be measured. The measurement process involves stripping the neutral atom
of its electron and passing the resulting ion through a combination of electric and magnetic
fields. The amount of deflection in these fields gives the energy of the particle and the distribution
of energies gives the temperature.
It is seen from this account that the measured ion temperature will be an average determined
by the trajectory of the charge exchanged particles, usually involving several charge exchanges,
and this method was later superseded by a more precise method - charge exchange recombination
spectroscopy.
Measurement of the ion temperature by charge exchange spectroscopy requires the presence
of a neutral beam, and in JET this is conveniently provided by the neutral beam used for plasma
heating. A small fraction of the neutral beam particles undergo charge exchange with impurity
ions, an electron being transferred to the impurity ion. Some of the impurity ions are left in an
excited state, and when these ions relax to a lower energy state they emit their characteristic
spectrum. Because the thermal velocity of the ions is virtually unaffected by the charge exchange,
measurement of the Doppler width of their spectral lines gives the ion temperature. By viewing
the neutral beam at different positions along its length the ion temperature profile is obtained.
LIDAR
LIDAR is an ingenious system designed for, and introduced on JET to measure the electron
temperature and density. Its name is a variant on RADAR, with which radio pulses are sent out,
and reflections from objects along the path of the pulse are used for detection and range finding.
With the JET system light pulses replace the radio pulses.
The method is based on Thomson scattering. When light is passed through a plasma the
electrons are accelerated by the oscillating electric field of the light wave and this acceleration
causes them to emit radiation - so-called scattered radiation. However, because of their thermal
motion the electrons pass through the wave and see a different frequency from that of the original
wave. This causes a change in the frequency they emit, and because the change depends on the
electron temperature analysis of the scattered radiation can give this temperature. The amount of
scattering naturally depends on the number of scatterers, and so Thomson scattering can also be
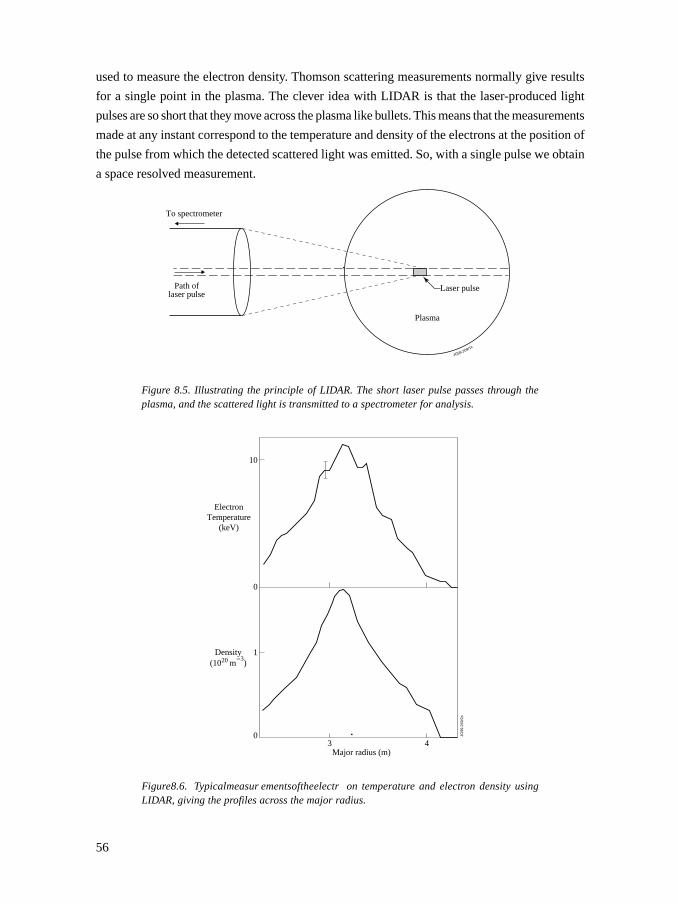
56
used to measure the electron density. Thomson scattering measurements normally give results
for a single point in the plasma. The clever idea with LIDAR is that the laser-produced light
pulses are so short that they move across the plasma like bullets. This means that the measurements
made at any instant correspond to the temperature and density of the electrons at the position of
the pulse from which the detected scattered light was emitted. So, with a single pulse we obtain
a space resolved measurement.
Figure 8.5. Illustrating the principle of LIDAR. The short laser pulse passes through theplasma, and the scattered light is transmitted to a spectrometer for analysis.
Figure8.6. Typicalmeasur ementsoftheelectr on temperature and electron density usingLIDAR, giving the profiles across the major radius.
JG99.269/1c
Path oflaser pulse
Plasma
Laser pulse
To spectrometer
ElectronTemperature
(keV)
10
0
JG99
.269
/2c
1
03 4
Major radius (m)
Density(1020 m
-3)
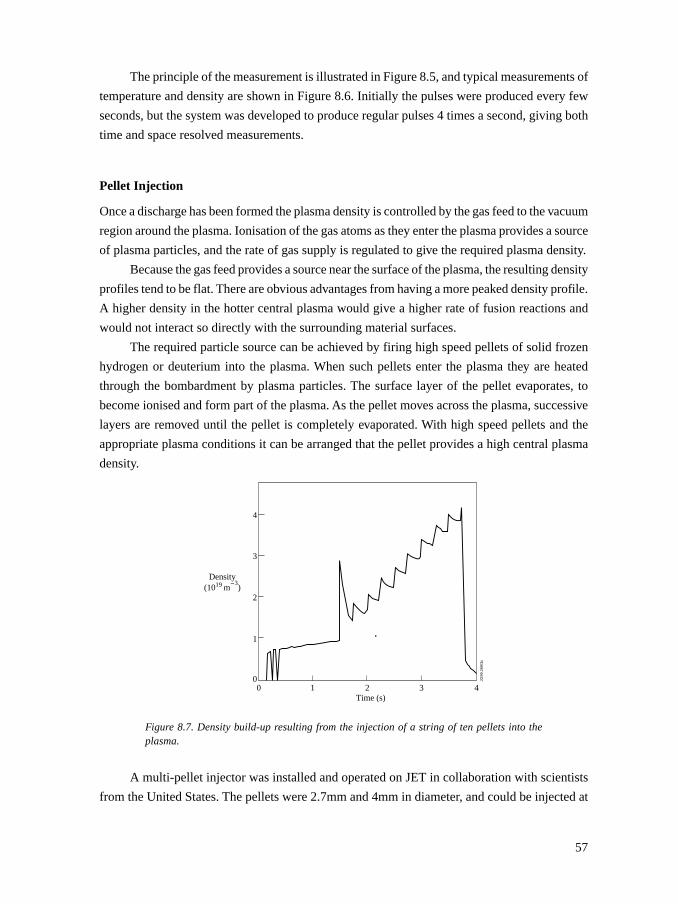
57
The principle of the measurement is illustrated in Figure 8.5, and typical measurements of
temperature and density are shown in Figure 8.6. Initially the pulses were produced every few
seconds, but the system was developed to produce regular pulses 4 times a second, giving both
time and space resolved measurements.
Pellet Injection
Once a discharge has been formed the plasma density is controlled by the gas feed to the vacuum
region around the plasma. Ionisation of the gas atoms as they enter the plasma provides a source
of plasma particles, and the rate of gas supply is regulated to give the required plasma density.
Because the gas feed provides a source near the surface of the plasma, the resulting density
profiles tend to be flat. There are obvious advantages from having a more peaked density profile.
A higher density in the hotter central plasma would give a higher rate of fusion reactions and
would not interact so directly with the surrounding material surfaces.
The required particle source can be achieved by firing high speed pellets of solid frozen
hydrogen or deuterium into the plasma. When such pellets enter the plasma they are heated
through the bombardment by plasma particles. The surface layer of the pellet evaporates, to
become ionised and form part of the plasma. As the pellet moves across the plasma, successive
layers are removed until the pellet is completely evaporated. With high speed pellets and the
appropriate plasma conditions it can be arranged that the pellet provides a high central plasma
density.
Figure 8.7. Density build-up resulting from the injection of a string of ten pellets into theplasma.
A multi-pellet injector was installed and operated on JET in collaboration with scientists
from the United States. The pellets were 2.7mm and 4mm in diameter, and could be injected at
Density(1019 m
-3)
4
010 2
Time (s)
JG99
.269
/3c
3
2
1
3 4
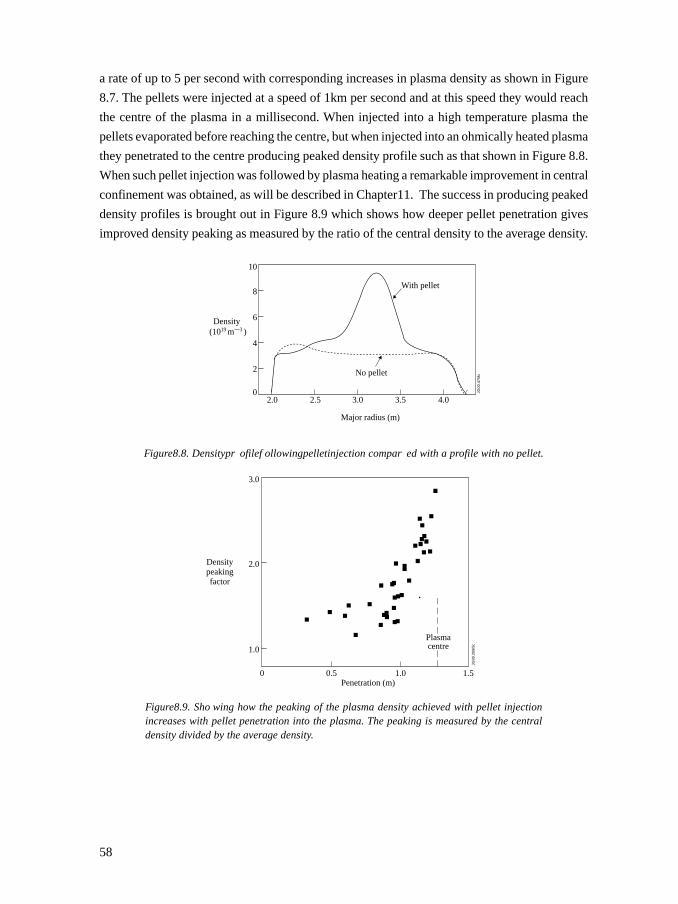
58
a rate of up to 5 per second with corresponding increases in plasma density as shown in Figure
8.7. The pellets were injected at a speed of 1km per second and at this speed they would reach
the centre of the plasma in a millisecond. When injected into a high temperature plasma the
pellets evaporated before reaching the centre, but when injected into an ohmically heated plasma
they penetrated to the centre producing peaked density profile such as that shown in Figure 8.8.
When such pellet injection was followed by plasma heating a remarkable improvement in central
confinement was obtained, as will be described in Chapter11. The success in producing peaked
density profiles is brought out in Figure 8.9 which shows how deeper pellet penetration gives
improved density peaking as measured by the ratio of the central density to the average density.
Figure8.8. Densitypr ofilef ollowingpelletinjection compar ed with a profile with no pellet.
Figure8.9. Sho wing how the peaking of the plasma density achieved with pellet injectionincreases with pellet penetration into the plasma. The peaking is measured by the centraldensity divided by the average density.
Densitypeakingfactor
0.50Penetration (m)
Plasmacentre
JG99
.269
/5c
1.0
2.0
3.0
1.0 1.5
10
8
6
4
2
Density(1019 m—3 )
02.0 2.5 3.0 3.5 4.0
Major radius (m)
JG00
.47/
8c
With pellet
No pellet
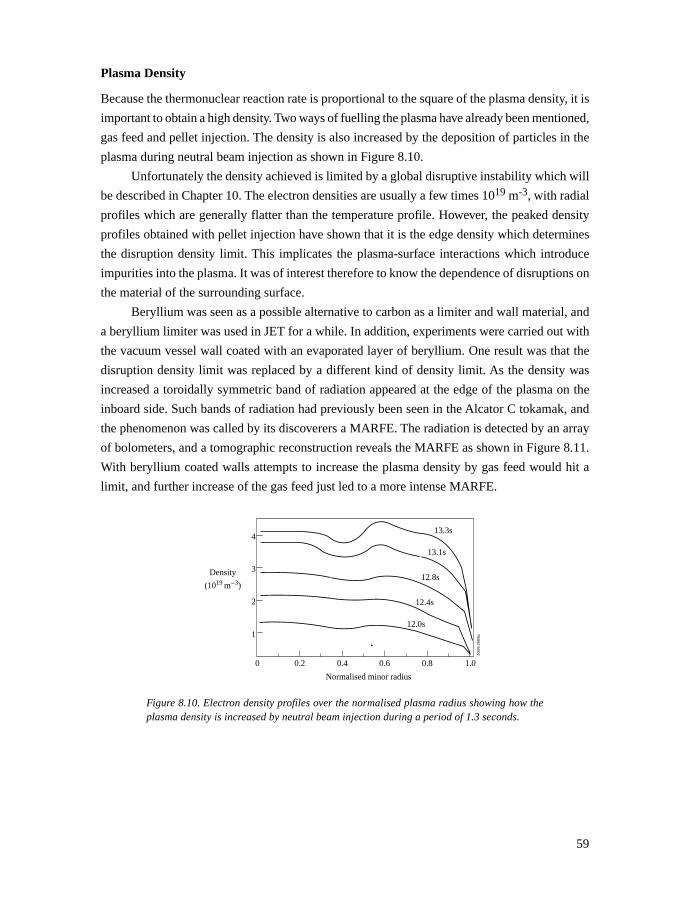
59
Plasma Density
Because the thermonuclear reaction rate is proportional to the square of the plasma density, it is
important to obtain a high density. Two ways of fuelling the plasma have already been mentioned,
gas feed and pellet injection. The density is also increased by the deposition of particles in the
plasma during neutral beam injection as shown in Figure 8.10.
Unfortunately the density achieved is limited by a global disruptive instability which will
be described in Chapter 10. The electron densities are usually a few times 1019 m-3, with radial
profiles which are generally flatter than the temperature profile. However, the peaked density
profiles obtained with pellet injection have shown that it is the edge density which determines
the disruption density limit. This implicates the plasma-surface interactions which introduce
impurities into the plasma. It was of interest therefore to know the dependence of disruptions on
the material of the surrounding surface.
Beryllium was seen as a possible alternative to carbon as a limiter and wall material, and
a beryllium limiter was used in JET for a while. In addition, experiments were carried out with
the vacuum vessel wall coated with an evaporated layer of beryllium. One result was that the
disruption density limit was replaced by a different kind of density limit. As the density was
increased a toroidally symmetric band of radiation appeared at the edge of the plasma on the
inboard side. Such bands of radiation had previously been seen in the Alcator C tokamak, and
the phenomenon was called by its discoverers a MARFE. The radiation is detected by an array
of bolometers, and a tomographic reconstruction reveals the MARFE as shown in Figure 8.11.
With beryllium coated walls attempts to increase the plasma density by gas feed would hit a
limit, and further increase of the gas feed just led to a more intense MARFE.
Figure 8.10. Electron density profiles over the normalised plasma radius showing how theplasma density is increased by neutral beam injection during a period of 1.3 seconds.
Density
(1019 m-3)
0
Normalised minor radius
JG99
.269
/6c
413.3s
13.1s
12.8s
12.4s
12.0s
3
2
1
1.00.4 0.6 0.80.2
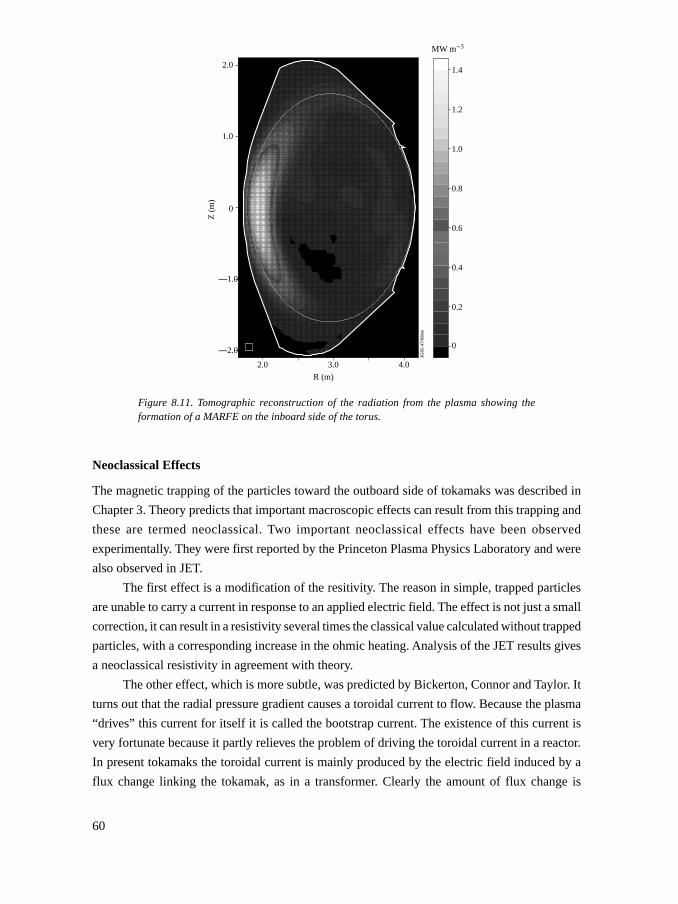
60
Figure 8.11. Tomographic reconstruction of the radiation from the plasma showing theformation of a MARFE on the inboard side of the torus.
Neoclassical Effects
The magnetic trapping of the particles toward the outboard side of tokamaks was described in
Chapter 3. Theory predicts that important macroscopic effects can result from this trapping and
these are termed neoclassical. Two important neoclassical effects have been observed
experimentally. They were first reported by the Princeton Plasma Physics Laboratory and were
also observed in JET.
The first effect is a modification of the resitivity. The reason in simple, trapped particles
are unable to carry a current in response to an applied electric field. The effect is not just a small
correction, it can result in a resistivity several times the classical value calculated without trapped
particles, with a corresponding increase in the ohmic heating. Analysis of the JET results gives
a neoclassical resistivity in agreement with theory.
The other effect, which is more subtle, was predicted by Bickerton, Connor and Taylor. It
turns out that the radial pressure gradient causes a toroidal current to flow. Because the plasma
“drives” this current for itself it is called the bootstrap current. The existence of this current is
very fortunate because it partly relieves the problem of driving the toroidal current in a reactor.
In present tokamaks the toroidal current is mainly produced by the electric field induced by a
flux change linking the tokamak, as in a transformer. Clearly the amount of flux change is
2.0 3.0 4.0
—2.0
—1.0
0
1.0
2.0
R (m)
Z (
m)
0
0.2
0.4
0.6
0.8
1.0
1.2
1.4
MW m-3
JG00
.47/
66bw
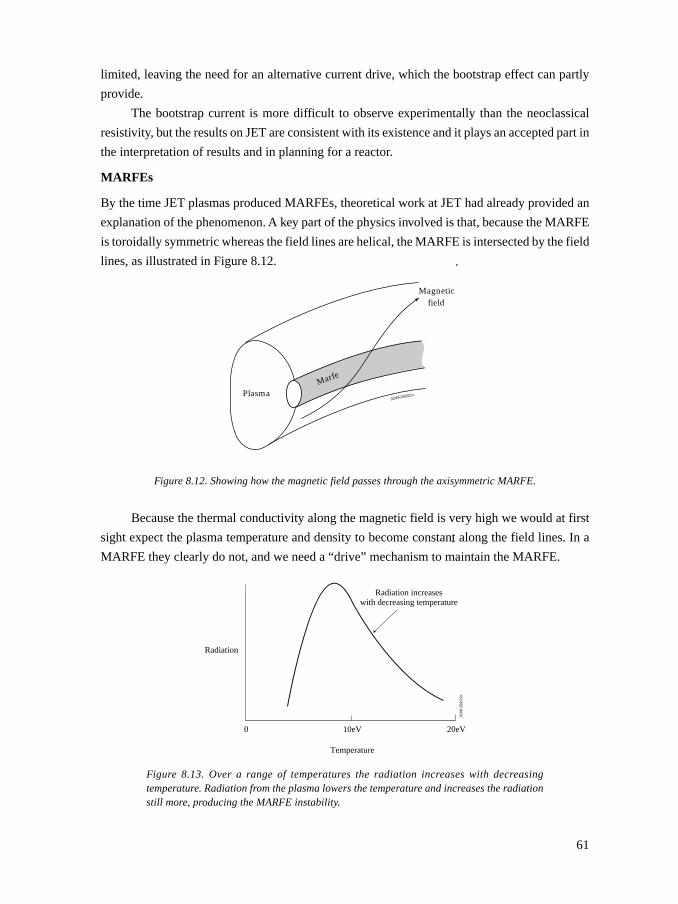
61
limited, leaving the need for an alternative current drive, which the bootstrap effect can partly
provide.
The bootstrap current is more difficult to observe experimentally than the neoclassical
resistivity, but the results on JET are consistent with its existence and it plays an accepted part in
the interpretation of results and in planning for a reactor.
MARFEs
By the time JET plasmas produced MARFEs, theoretical work at JET had already provided an
explanation of the phenomenon. A key part of the physics involved is that, because the MARFE
is toroidally symmetric whereas the field lines are helical, the MARFE is intersected by the field
lines, as illustrated in Figure 8.12.
Figure 8.12. Showing how the magnetic field passes through the axisymmetric MARFE.
Because the thermal conductivity along the magnetic field is very high we would at first
sight expect the plasma temperature and density to become constant along the field lines. In a
MARFE they clearly do not, and we need a “drive” mechanism to maintain the MARFE.
Figure 8.13. Over a range of temperatures the radiation increases with decreasingtemperature. Radiation from the plasma lowers the temperature and increases the radiationstill more, producing the MARFE instability.
Magneticfield
PlasmaJG99.269/21c
Marfe
0 10eV
Temperature
Radiation
Radiation increaseswith decreasing temperature
20eV
JG99
.269
/22c
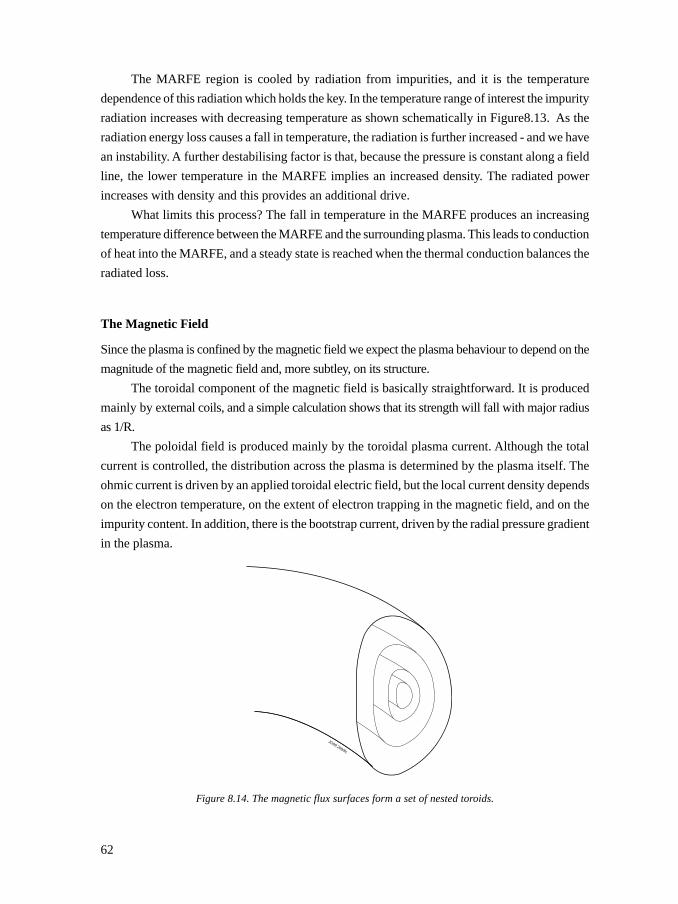
62
The MARFE region is cooled by radiation from impurities, and it is the temperature
dependence of this radiation which holds the key. In the temperature range of interest the impurity
radiation increases with decreasing temperature as shown schematically in Figure8.13. As the
radiation energy loss causes a fall in temperature, the radiation is further increased - and we have
an instability. A further destabilising factor is that, because the pressure is constant along a field
line, the lower temperature in the MARFE implies an increased density. The radiated power
increases with density and this provides an additional drive.
What limits this process? The fall in temperature in the MARFE produces an increasing
temperature difference between the MARFE and the surrounding plasma. This leads to conduction
of heat into the MARFE, and a steady state is reached when the thermal conduction balances the
radiated loss.
The Magnetic Field
Since the plasma is confined by the magnetic field we expect the plasma behaviour to depend on the
magnitude of the magnetic field and, more subtley, on its structure.
The toroidal component of the magnetic field is basically straightforward. It is produced
mainly by external coils, and a simple calculation shows that its strength will fall with major radius
as 1/R.
The poloidal field is produced mainly by the toroidal plasma current. Although the total
current is controlled, the distribution across the plasma is determined by the plasma itself. The
ohmic current is driven by an applied toroidal electric field, but the local current density depends
on the electron temperature, on the extent of electron trapping in the magnetic field, and on the
impurity content. In addition, there is the bootstrap current, driven by the radial pressure gradient
in the plasma.
Figure 8.14. The magnetic flux surfaces form a set of nested toroids.
JG99.269/8c
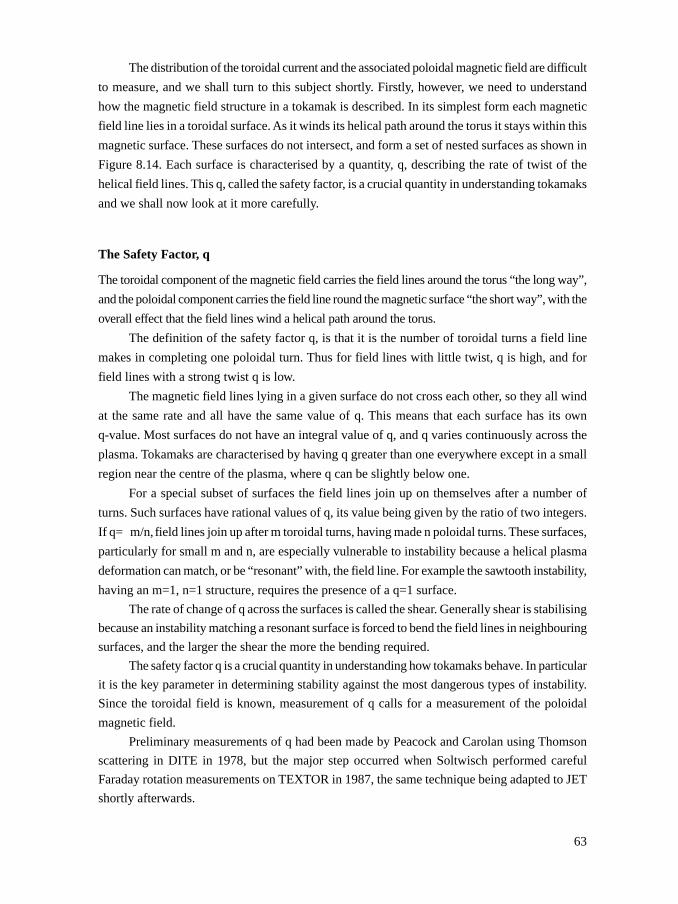
63
The distribution of the toroidal current and the associated poloidal magnetic field are difficult
to measure, and we shall turn to this subject shortly. Firstly, however, we need to understand
how the magnetic field structure in a tokamak is described. In its simplest form each magnetic
field line lies in a toroidal surface. As it winds its helical path around the torus it stays within this
magnetic surface. These surfaces do not intersect, and form a set of nested surfaces as shown in
Figure 8.14. Each surface is characterised by a quantity, q, describing the rate of twist of the
helical field lines. This q, called the safety factor, is a crucial quantity in understanding tokamaks
and we shall now look at it more carefully.
The Safety Factor, q
The toroidal component of the magnetic field carries the field lines around the torus “the long way”,
and the poloidal component carries the field line round the magnetic surface “the short way”, with the
overall effect that the field lines wind a helical path around the torus.
The definition of the safety factor q, is that it is the number of toroidal turns a field line
makes in completing one poloidal turn. Thus for field lines with little twist, q is high, and for
field lines with a strong twist q is low.
The magnetic field lines lying in a given surface do not cross each other, so they all wind
at the same rate and all have the same value of q. This means that each surface has its own
q-value. Most surfaces do not have an integral value of q, and q varies continuously across the
plasma. Tokamaks are characterised by having q greater than one everywhere except in a small
region near the centre of the plasma, where q can be slightly below one.
For a special subset of surfaces the field lines join up on themselves after a number of
turns. Such surfaces have rational values of q, its value being given by the ratio of two integers.
If q= m/n, field lines join up after m toroidal turns, having made n poloidal turns. These surfaces,
particularly for small m and n, are especially vulnerable to instability because a helical plasma
deformation can match, or be “resonant” with, the field line. For example the sawtooth instability,
having an m=1, n=1 structure, requires the presence of a q=1 surface.
The rate of change of q across the surfaces is called the shear. Generally shear is stabilising
because an instability matching a resonant surface is forced to bend the field lines in neighbouring
surfaces, and the larger the shear the more the bending required.
The safety factor q is a crucial quantity in understanding how tokamaks behave. In particular
it is the key parameter in determining stability against the most dangerous types of instability.
Since the toroidal field is known, measurement of q calls for a measurement of the poloidal
magnetic field.
Preliminary measurements of q had been made by Peacock and Carolan using Thomson
scattering in DITE in 1978, but the major step occurred when Soltwisch performed careful
Faraday rotation measurements on TEXTOR in 1987, the same technique being adapted to JET
shortly afterwards.
64
Measurement of q
In the Faraday rotation technique a polarised beam of light from a laser is passed through the
plasma. In the absence of a magnetic field the direction of the polarisation would be unchanged
by the plasma, but the effect of a magnetic field is to cause the direction of polarisation to rotate.
Careful measurements of the small rotation allow the poloidal magnetic field to be measured
and the q profile to be determined. However, the Faraday rotation measurement of magnetic
field is indirect because it only gives a line average of the product of the magnetic field and the
density.
We shall see later that the early measurements of q were full of surprises and uncertainties.
This brought into focus the remarkable fact that, although magnetic fields are central to
confinement in tokamaks, our ability to measure the magnetic field inside the plasma had for
several decades remained very limited. This situation was radically changed by a chance
observation on JET.
When neutral beams are injected to heat the plasma, some of the atoms are excited by
plasma electrons and emit radiation in the form of spectral lines, these spectral lines being
characteristic of the type of atom. The spectrum of the hydrogen atoms forming the beam is well
known. It was surprising, therefore, that when the spectrum from the beam was examined it
seemed to be full of strange lines.
It was soon realised that the magnetic field was the cause. It has been known for a century
that an object moving across a magnetic field experiences an electric field, and it is also known
that an electric field splits each spectral line of the atom into three lines. What had happened in
the JET experiment was that this so called “motional Stark effect” had split the lines, and the
superposition of lines from different beams had further complicated the spectrum.
Once the explanation was realised, the spectral pattern was understood. It was also clear
that the motional Stark effect provided a way of measuring the magnetic field. In particular, the
polarisation of the light emitted by the beams is related to pitch of the field lines and so to q. A
flawed attempt at this measurement was made in JET but plasma physicists in the United States
were quick to exploit the technique, and were able to obtain accurate measurements of the q-
profile.
A Measurement of Shear
We shall see in the next chapter that understanding of the sawtooth instability depends upon
knowledge of the q-profile, particularly inside and around the q=1 surface. In the early years of
JET hard information about q was not available, but an ingenious piece of analysis provided an
estimate of the rate of change of q, called the shear, at the q = 1 surface.
When hydrogen pellets are injected into the plasma, the hydrogen evaporating from their
surface emits radiation. It was found that as the pellet passed through the q=1 surface the
65
radiation was much reduced, and a plot of the intensity of the measured radiation across the
plasma radius showed a dip around this surface as shown in Figure 8.15.
Figure8.15. As the injected pellet crosses the q=1 magnetic surface there is a dip in theradiated light.
The basic reason is that the field lines on the q=1 surface join up on themselves after one
turn. So when the pellet passes through this surface, the cooling is localised to the field lines
passing through the pellet. At other radii the field line will wind round the magnetic surface, and
the cooling effect is more widely spread. The dip in radiation is therefore simply due to the
reduced thermal capacity of the interacting plasma around the q=1 surface.
The key point is that the rate of transition from strong cooling on the q=1 surface to
normal cooling away from it depends on the magnetic shear, and so measurement of the radial
width of the dip in the radiation enables us to calculate the shear.
The calculated value of shear was very small, implying a very flat q profile in the region
around q=1. This seemed to be in conflict with the q-profile obtained using the Faraday rotation
measurement. Could there be a local flattening of q around q=1, not detected by Faraday rotation?
This measurement of magnetic shear became one of the pieces of the puzzle presented by
the sawtooth instability and described in the next chapter - a puzzle not yet resolved.
Lower Hybrid Current Drive
So-called lower hybrid waves propagate in the plasma at frequencies between the electron and
ion cyclotron frequencies. When these waves are launched in the plasma they can drive a current
with good efficiency and this allows some control of the current profile. With this aim a lower
hybrid current drive system was installed on JET using a grill structure of waveguides placed
close to the plasma edge.
A prototype wave launcher was put in place in 1990 and, after an experimental programme,
the full system was installed and ready for use in 1994. This system operated at 3.7 GHz and was
capable of producing up to 7.3MW of power and sustaining current drive for more than ten
Lightintensity
Major radius (m)
Reduction aroundthe q = 1 surface
JG99
.269
/9c
3.44.0 3.8 3.64.2
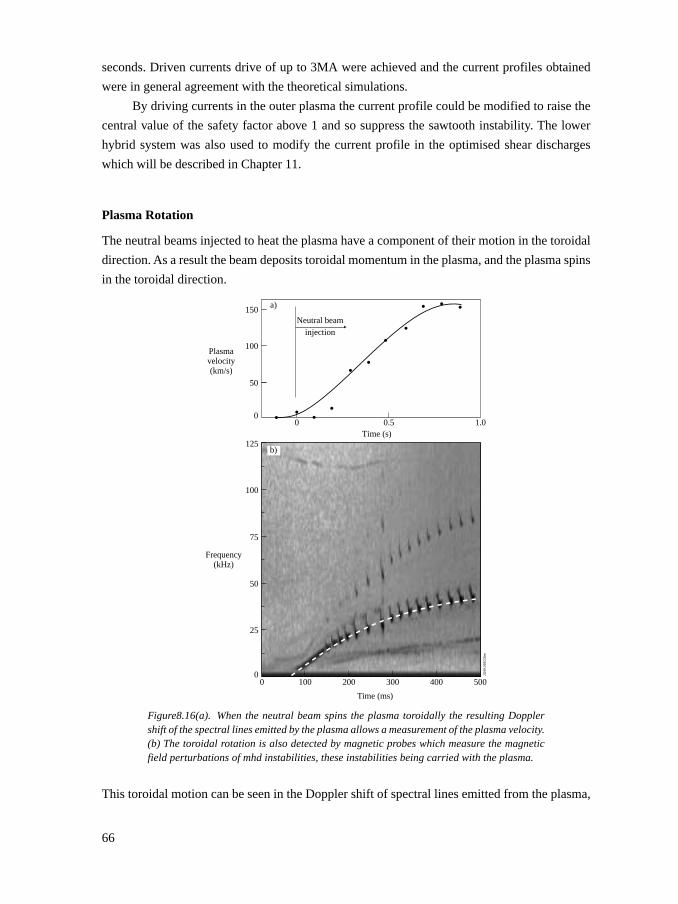
66
seconds. Driven currents drive of up to 3MA were achieved and the current profiles obtained
were in general agreement with the theoretical simulations.
By driving currents in the outer plasma the current profile could be modified to raise the
central value of the safety factor above 1 and so suppress the sawtooth instability. The lower
hybrid system was also used to modify the current profile in the optimised shear discharges
which will be described in Chapter 11.
Plasma Rotation
The neutral beams injected to heat the plasma have a component of their motion in the toroidal
direction. As a result the beam deposits toroidal momentum in the plasma, and the plasma spins
in the toroidal direction.
Figure8.16(a). When the neutral beam spins the plasma toroidally the resulting Dopplershift of the spectral lines emitted by the plasma allows a measurement of the plasma velocity.(b) The toroidal rotation is also detected by magnetic probes which measure the magneticfield perturbations of mhd instabilities, these instabilities being carried with the plasma.
This toroidal motion can be seen in the Doppler shift of spectral lines emitted from the plasma,
50
0
100Plasmavelocity(km/s)
150
0 0.5Time (s)
Neutral beaminjection
1.0
JG99
.269
/23b
w
125
100
75
50
25
00 100 200 300
Time (ms)
400 500
Frequency(kHz)
a)
b)
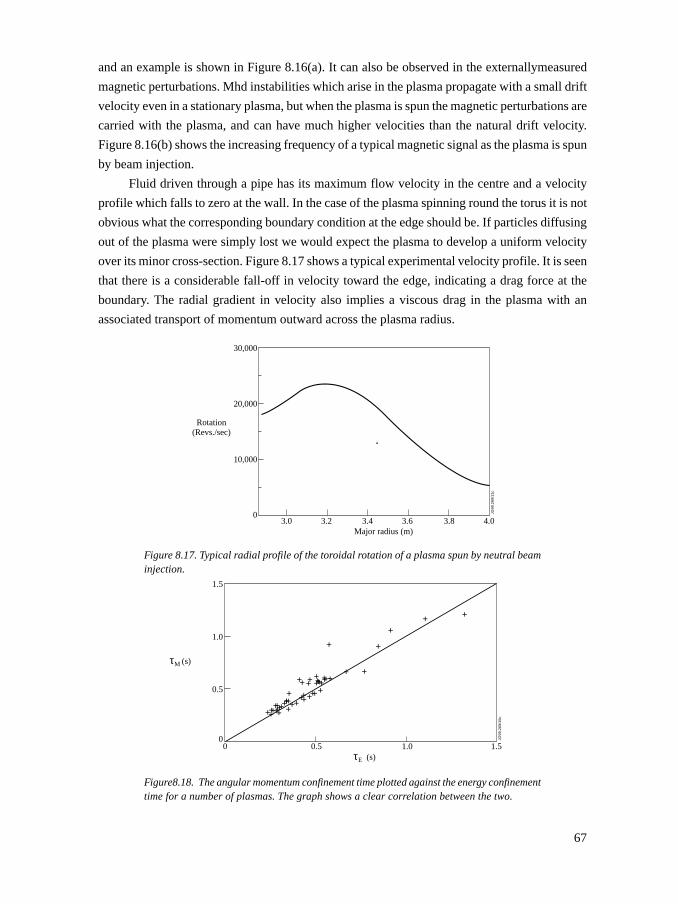
67
and an example is shown in Figure 8.16(a). It can also be observed in the externallymeasured
magnetic perturbations. Mhd instabilities which arise in the plasma propagate with a small drift
velocity even in a stationary plasma, but when the plasma is spun the magnetic perturbations are
carried with the plasma, and can have much higher velocities than the natural drift velocity.
Figure 8.16(b) shows the increasing frequency of a typical magnetic signal as the plasma is spun
by beam injection.
Fluid driven through a pipe has its maximum flow velocity in the centre and a velocity
profile which falls to zero at the wall. In the case of the plasma spinning round the torus it is not
obvious what the corresponding boundary condition at the edge should be. If particles diffusing
out of the plasma were simply lost we would expect the plasma to develop a uniform velocity
over its minor cross-section. Figure 8.17 shows a typical experimental velocity profile. It is seen
that there is a considerable fall-off in velocity toward the edge, indicating a drag force at the
boundary. The radial gradient in velocity also implies a viscous drag in the plasma with an
associated transport of momentum outward across the plasma radius.
Figure 8.17. Typical radial profile of the toroidal rotation of a plasma spun by neutral beaminjection.
Figure8.18. The angular momentum confinement time plotted against the energy confinementtime for a number of plasmas. The graph shows a clear correlation between the two.
Rotation(Revs./sec)
Major radius (m)3.0
0
10,000
20,000
30,000
3.2 3.4 3.6 3.8 4.0
JG99
.269
/11c
τM (s)
0.50τE (s)
0.5
0
1.0
1.5
1.0 1.5
+
+ +
++ +
++++++++++ +++++
++++++++++++++++++++++++++
JG99
.269
/15c
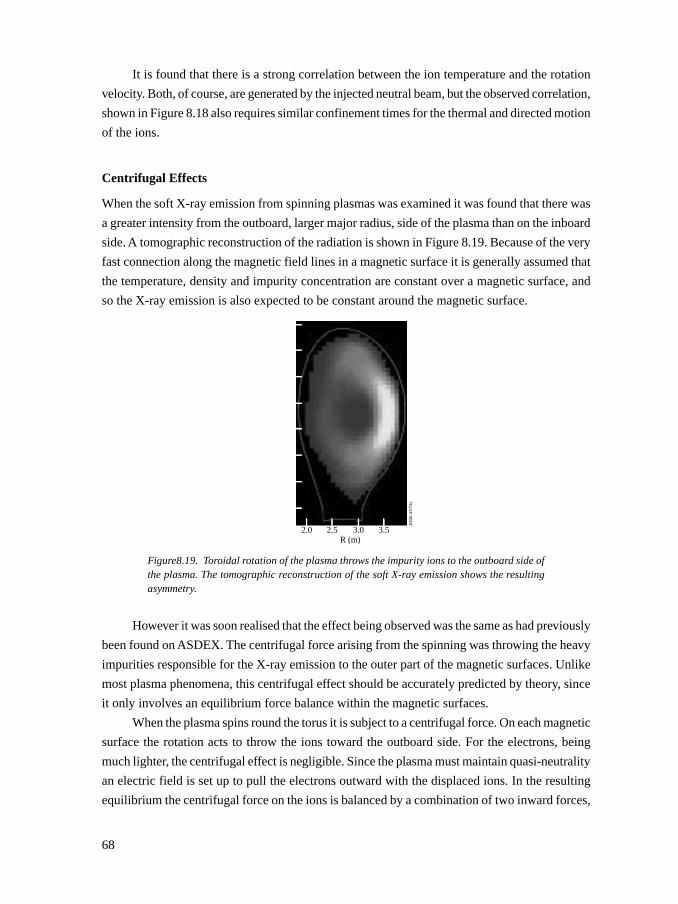
68
It is found that there is a strong correlation between the ion temperature and the rotation
velocity. Both, of course, are generated by the injected neutral beam, but the observed correlation,
shown in Figure 8.18 also requires similar confinement times for the thermal and directed motion
of the ions.
Centrifugal Effects
When the soft X-ray emission from spinning plasmas was examined it was found that there was
a greater intensity from the outboard, larger major radius, side of the plasma than on the inboard
side. A tomographic reconstruction of the radiation is shown in Figure 8.19. Because of the very
fast connection along the magnetic field lines in a magnetic surface it is generally assumed that
the temperature, density and impurity concentration are constant over a magnetic surface, and
so the X-ray emission is also expected to be constant around the magnetic surface.
Figure8.19. Toroidal rotation of the plasma throws the impurity ions to the outboard side ofthe plasma. The tomographic reconstruction of the soft X-ray emission shows the resultingasymmetry.
However it was soon realised that the effect being observed was the same as had previously
been found on ASDEX. The centrifugal force arising from the spinning was throwing the heavy
impurities responsible for the X-ray emission to the outer part of the magnetic surfaces. Unlike
most plasma phenomena, this centrifugal effect should be accurately predicted by theory, since
it only involves an equilibrium force balance within the magnetic surfaces.
When the plasma spins round the torus it is subject to a centrifugal force. On each magnetic
surface the rotation acts to throw the ions toward the outboard side. For the electrons, being
much lighter, the centrifugal effect is negligible. Since the plasma must maintain quasi-neutrality
an electric field is set up to pull the electrons outward with the displaced ions. In the resulting
equilibrium the centrifugal force on the ions is balanced by a combination of two inward forces,
JG00
.47/
74c
2.0 2.5 3.0 3.5R (m)
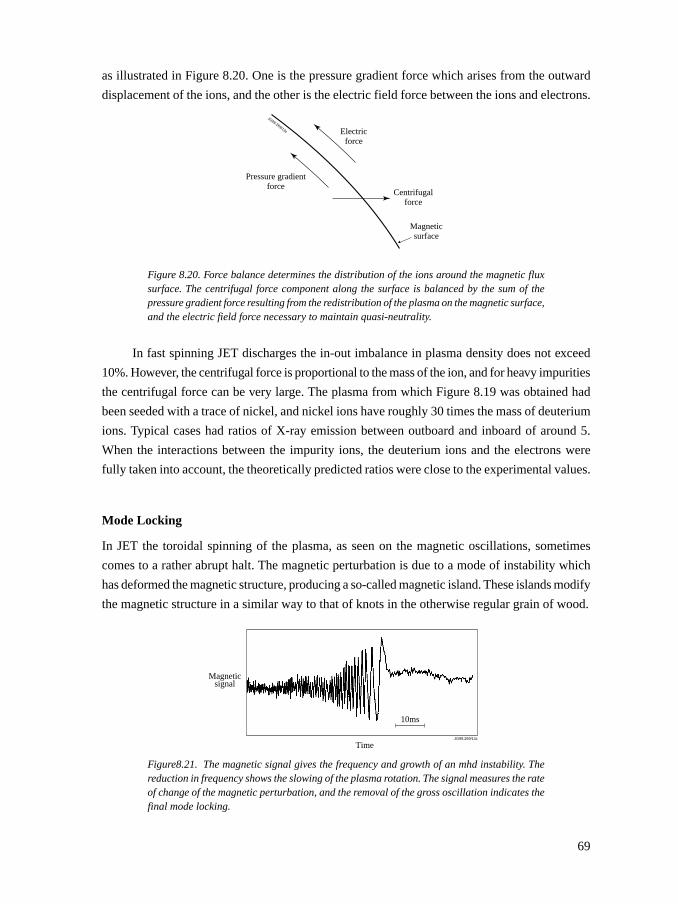
69
as illustrated in Figure 8.20. One is the pressure gradient force which arises from the outward
displacement of the ions, and the other is the electric field force between the ions and electrons.
Figure 8.20. Force balance determines the distribution of the ions around the magnetic fluxsurface. The centrifugal force component along the surface is balanced by the sum of thepressure gradient force resulting from the redistribution of the plasma on the magnetic surface,and the electric field force necessary to maintain quasi-neutrality.
In fast spinning JET discharges the in-out imbalance in plasma density does not exceed
10%. However, the centrifugal force is proportional to the mass of the ion, and for heavy impurities
the centrifugal force can be very large. The plasma from which Figure 8.19 was obtained had
been seeded with a trace of nickel, and nickel ions have roughly 30 times the mass of deuterium
ions. Typical cases had ratios of X-ray emission between outboard and inboard of around 5.
When the interactions between the impurity ions, the deuterium ions and the electrons were
fully taken into account, the theoretically predicted ratios were close to the experimental values.
Mode Locking
In JET the toroidal spinning of the plasma, as seen on the magnetic oscillations, sometimes
comes to a rather abrupt halt. The magnetic perturbation is due to a mode of instability which
has deformed the magnetic structure, producing a so-called magnetic island. These islands modify
the magnetic structure in a similar way to that of knots in the otherwise regular grain of wood.
Figure8.21. The magnetic signal gives the frequency and growth of an mhd instability. Thereduction in frequency shows the slowing of the plasma rotation. The signal measures the rateof change of the magnetic perturbation, and the removal of the gross oscillation indicates thefinal mode locking.
Pressure gradientforce
Electricforce
Centrifugalforce
Magneticsurface
JG99.269/13c
10ms
Time
Magneticsignal
JG99.269/14c
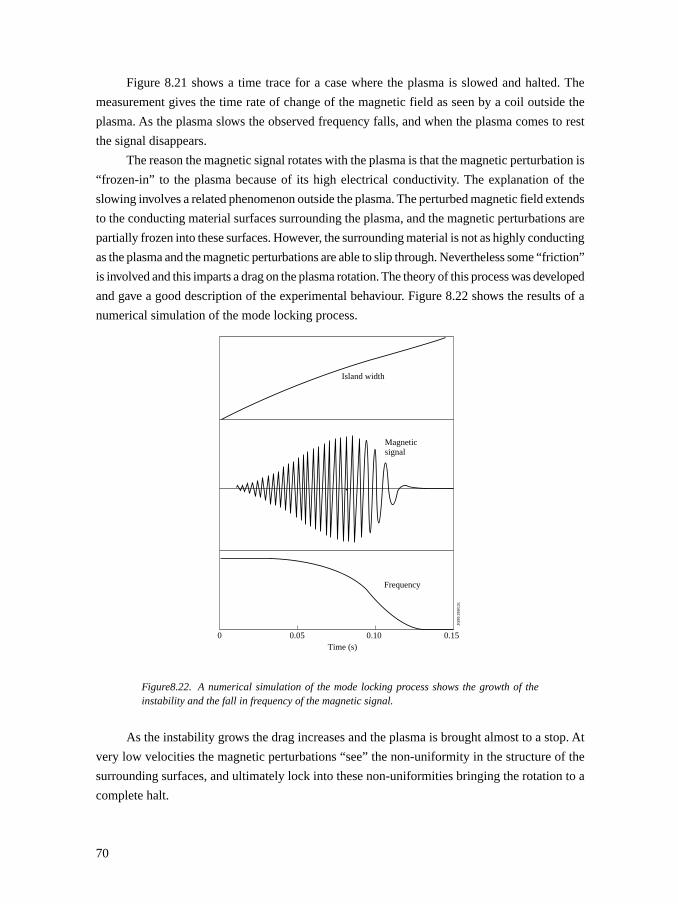
70
Figure 8.21 shows a time trace for a case where the plasma is slowed and halted. The
measurement gives the time rate of change of the magnetic field as seen by a coil outside the
plasma. As the plasma slows the observed frequency falls, and when the plasma comes to rest
the signal disappears.
The reason the magnetic signal rotates with the plasma is that the magnetic perturbation is
“frozen-in” to the plasma because of its high electrical conductivity. The explanation of the
slowing involves a related phenomenon outside the plasma. The perturbed magnetic field extends
to the conducting material surfaces surrounding the plasma, and the magnetic perturbations are
partially frozen into these surfaces. However, the surrounding material is not as highly conducting
as the plasma and the magnetic perturbations are able to slip through. Nevertheless some “friction”
is involved and this imparts a drag on the plasma rotation. The theory of this process was developed
and gave a good description of the experimental behaviour. Figure 8.22 shows the results of a
numerical simulation of the mode locking process.
Figure8.22. A numerical simulation of the mode locking process shows the growth of theinstability and the fall in frequency of the magnetic signal.
As the instability grows the drag increases and the plasma is brought almost to a stop. At
very low velocities the magnetic perturbations “see” the non-uniformity in the structure of the
surrounding surfaces, and ultimately lock into these non-uniformities bringing the rotation to a
complete halt.
Island width
Frequency
Magneticsignal
JG99
.269
/12c
0 0.05 0.10Time (s)
0.15
71
The experimental results on the basic features of JET plasma described in this chapter give
some idea of the rich variety of the physics involved. In the next three chapters we turn to the
main themes of the research involving these plasmas - the understanding and avoidance of
instabilities, the study and improvement of plasma confinement and the control of the interaction
between the plasma and the surrounding material surfaces.
Bibliography
An introduction to the JET ion cyclotron heating system together with some early results is
given in
Jacquinot, J., Bhatnagar, V., Brinkschulle, H., Bures, M., Corti, S., Cottrell, G.A., Evrard, M.,
Gambier, D., Kaye, A., Lallia, P.P., Sand, F., Schueller, C., Tanga, A., Thomsen, K., and Wade, T.
Additional heating experiments on JET with ion-cyclotron waves. Philosophical Transactions
of the Royal Society A322, 95 (1987).
A companion paper for dealing with neutral beams is
Duesing, G., Lomas, P., Stäbler, A., Thomas, P., and Thomson, E. First neutral beam heating in
JET, on p109 of the same journal.
A later account of neutral beam heating is given in
Thompson, E., Stork, D., de Esch, H.P.L., and the JET team. The use of neutral beam heating to
produce high performance fusion plasmas, including the injection of tritium beams into JET.
Physics of Fluids B5, 2468 (1993).
A further, more technical paper is
Jones, T.C.C., et al. Tritium operation of the JET neutral beam systems, Fusion Engineering and
Design 47,205 (1999).
The technical aspects of the ICRH system are dealt with in
Kaye, A., Brown, T., Bhatnagar, V., Crawley, P., Jacquinot, J., Lobel, R., Plancoulaine, J., Rebut.
P.H., Wade, T., and Walker, C. Present and Future JET ICRF antennas. Fusion Engineering and
Design 24, 1 (1994).
Further papers relating to ion cyclotron heating are
Eriksson, L.-G., and Hellsten T. Electron heating during ion cyclotron resonance in JET. Nuclear
Fusion 29, 875(1989).
Eriksson, L.-G., Hellsten, T., et al. Calculations of power deposition and velocity distributions
during ICRH: Comparison with experimental results. Nuclear Fusion 29, 87 (1989).
72
Eriksson, L.-G., Gianella, R., Hellsten, T., Kallne, E., and Sundstrom, G. Observations of toroidal
rotation induced by ICRH in JET Plasma. Physics and Controlled Fusion 34, 863 (1992).
Bhatnagar, V.P., Jacquinot, J., Start, D.F.H., and Tubbing, B.J.D. High concentration minority
ion cyclotron resonace heating in JET. Plasma Nuclear Fusion 32, 83 (1993).
Eriksson, L.-G., Hellsten, T., and Willen, U. Comparsion of time dependent simulations with
experiments in ion cyclotron heated plasmas. Nuclear Fusion 33, 1037 (1993).
Eriksson L.-G., Mantsinen, M.J., Rimini, F.G., Nguyen, F., Gormezano, C., Start, D.F.H., and
Gondhalekar, A. ICRH heating of plasmas with third harmonic deuterium resonance. Nuclear
Fusion 38, 265 (1998).
The discovery of the stabilisation implied by monster sawteeth was reported in
Campbell, D.J., Stork, D.M., and Wesson, J.A., et al. Stabilisation of sawteeth with additional
heating in the JET tokamaks. Physical Review Letters 60, 2148 (1988).
Charge exchange spectroscopy has been highly developed at JET as described in the following
papers.
Weisen, M., von Hellermann, M., Boileau, A., Horton, L.D., Mandl, W., and Summers, H.P.
Charge exchange spectroscopy measurements of ion temperature and toroidal rotation in JET.
Nuclear Fusion 29, 2187 (1989).
Mandl, W., Wolf, R., von Hellermann, M., and Summers, H.P. Beam emission spectroscopy as a
comprehensive diagnostic tool. Plasma Physics and Controlled Fusion 35, 1373 (1993).
Zastrow, K-D, Core, W.G.F., Eriksson, L.-G., von Hellermann, M.G., Howman, A.C., and König,
R.W.T. Transfer rates of toroidal angular momentum during neutral beam injection. Nuclear
Fusion 38, 257 (1998).
Svensson, J., von Hellermann, M., and König, R. Analysis of charge exchange spectra using
neutral networks at the JET tokamak. Plasma Physics and Controlled Fusion 4l, 315 (1999).
The Lidar system is described in
Saltzmann, H., Hirsch, K., Nielsen, P., Gowers, C., Gadd, A., Gadeberg, M. Murmann, H., and
Schrodter, C. First results from the LIDAR scattering system on JET. Nuclear Fusion 27, 1925
(1987).
Studies of the behaviour of injected pellets are described in
Houlberg, W.A., Attenberger, S.E. Baylor, L.R., Gadeberg, M., Jernigan, T.C., Kupschus, P.,
73
Milora, S.L., Schmidt, G.L., Swain, D.W., and Watkins, M.L. Pellet penetration experiments on
JET. Nuclear Fusion 32, 1951(1992),
and in
Baylor, L.R. Schmidth, G.L., et al. Pellet fuelling deposition measurements on JET and TFTR.
Nuclear Fusion 32, 2177 (1992).
The interferometer system for measuing the density is described together with some typical
results in
Fessey, J.A., Gowers C.W., Hugenhotz, C.A.J., and Slavin, K. Plasma electron density
measurements from the JET 2mm wave interferometer. Journal of Physics E, Scientific
Instruments 20, 619 (1987).
The detection of a bootstrap current was reported by
Cordey, J.G., Challis, C.D., and Stubberfield, P.M. Bootstrap current theory and experimental
evidence. Plasma Physics and Controlled Fusion 30, 1625 (1988).
More detail and information on the beam driven current is given in
Challis, C.D., Cordey, J.G., HamnÇn, M., Stubberfield, P.M., Christiansen, J.P., Lazzaro, E.,
Muir, D.G., Stork, D., and Thomson, E. Non-inductively driven currents in JET. Nuclear Fusion
29, 563 (1989).
Bootstrap currents carrying 70% of the plasma current were described in
Challis, C.D., Hender, T.C., O’Rourke, J., et al. High bootstrap current in ICRH plasma in JET.
Nuclear Fusion 33, 1097 (1993).
The applicability of neoclassical resistivity theory in JET is discussed in
Campbell, D.J., Lazzaro, E., Nave, M.F.F., Christiansen, J.P., Cordey, J.G., Schüller, F.C., and
Thomas, P.R. Plasma resistivity and field penetration in JET. Nucelar Fusion 28, 981 (1988).
MARFEs were explained by Stringer, T.E. in A theory of MARFES, Proceedings of 12th European
Conference on Controlled Fusion and Plasma Physics I, 86 (Budapest 1985).
The measurement of q using Faraday rotation is described in
O’Rourke, J. The change in the safety factor profile at a sawtooth collapse. Plasma Physics and
Controlled Fusion 33, 289, (1991).
74
The recognition of the motional stark effect is described in
Boileau, A., von Hellerman, M.G. Mandl, W., Summers, H.P., Weisen, M., and Zinoviev, B.,
Observations of motional Stark features in the Balmer spectrum of deuterium in the JET plasma.
Journal of Physics B, At. Mol. Opt. Phys. 22, L145 (1989),
and its use in measuring the magnetic field is illustrated by
Wolf, R.C., Eriksson, L.-G., von Hellermann, M., Konig, R., Mandl, W., and Porcelli, F. Motional
Stark effect measurements of the local ICRH induced diamagnetism in JET plasmas. Nuclear
Fusion 33, 1835 (1993).
The measurement of shear using soft x-ray emission is described in
Gill, R., Edwards, A.W., and Weller, A. Determination of shear on the q=1 surface of the JET
tokamak. Nuclear Fusion 29, 821 (1989).
Control of the shear using ion cyclotron waves is described in
Bhatnagar V.P. et al. Local magnetic shear control in a tokamak via fast wave minority ion
current drive: theory and experiments in JET. Nuclear Fusion 34, 1579 (1994).
Measurement of the neutral beam induced rotation is described in the paper by Zastrow, et al.,
listed above, and rotation due to ICRH is reported in
Eriksson, L.-G., Gianella, R., Hellsten, T., Kallne, E., and Sundstrom, G. Observations of toroidal
plasma rotation in JET discharges. Plasma Physics and Controlled Fusion 34, 687 (1992).
Rotation with ICRH only is described in
Eriksson, L.-G., Righi, E., and Zastrow, K.-D. Toroidal rotation in ICRF-heated H-modes on
JET. Plasma Physics and Controlled Fusion 39, 27 (1997).
The centrifugal effect on impurities is reported in
Alper, B., Edwards, A.W., Gianella, R., Gill, R.D., Ingeson, C., Romanelli, M., Wesson J., and
Zastrow, K.-D., Strong asymmetries in impurity distribution of JET plasmas. Proc. 23rd Eur.
Phys. Soc. Conf. on Controlled Fusion and Plasma Physics, Kiev, Part 1 p. a51 (1996),
and the theory was given in
Wesson J.A., Poloidal distribution of impurities in a rotating tokamak plasma. Nuclear Fusion
37, 577, (1997).
75
The basic physics of mode locking was explained by
Nave, M.F.F. and Wesson, J.A. Mode locking in tokamaks. Nuclear Fusion 30, 2575 (1990).
The neutrons resulting from D-D reactions in the plasma provided a further diagnostic as
described in
Jarvis, O.N., Gorini, G., Hone, M., Kallne, J., Sadler, G., Merlo, V., and van Belle, P. Neutron
spectrometry at JET. Review of Scientific Instruments 57, 1717 (1985).
Further investigations were reported in the papers
Boyd, D.A., Campbell, D.J., Cordey, J.G., Core, W.G.F., Christiansen, J.P., et al. 3He-d Fusion
reaction rate measurements during ICRH heating experiments in JET. Nuclear Fusion 30, 307
(1990).
Jarvis, O.N., Adams, J.M., Balet, B., Conroy, S., et al. Determination of deuterium concentrations
in JET plasmas. Nuclear Fusion 30, 307 (1990).
Marcus, F.B., Adams, J.M., Bond, D.S., Hone, M.A., Howarth, P.J.A., Jarvis, O.N., Laughlin,
M.J., Sadler, G., van Belle, P., and Watkins, N. Effects of sawtooth crashes on beam ions and
fusion product tritons in JET. Nuclear Fusion 34, 687 (1994).
Jarvis, O.N, Adams, J.M., Marcus, F.B., and Sadler, G.J. Neutron profile measurements in JET.
Fusion Engineering and Design 34-35, 59 (1997).
In certain discharges Helium 3 is accelerated to high energies (MeV) by the ICRH, and reactions
with impurity ions produce gamma radiation. This is described in
Jarvis, O.N., Adams, J.M., Howarth, P.J.A., Marcus, F.B., Righi, E., Sadler, G., Start, D.F.H.,
van Belle, P., Warrick, C., and Watkins, N. Gamma-ray emission profile measurements from
JET ICRF-heated discharges. Nuclear Fusion 36, 1513 (1996).

76
77
9. TOWARDS A REACTOR
The ultimate aim is a fusion reactor and with JET constructed and operating thoughts now turned
to the reactor issues which could be addressed.
A basic requirement is that the plasma should not be subject to gross instability. From both
theory and experimental experience it was established that stability boundaries impose operational
limits on various parameters. For example it was well known that lowering the surface value of
the safety factor q would at some point lead to a disruption of the plasma. It was therefore
important for JET to investigate and determine this boundary. Disruptions also occur under
other conditions, and there are further instabilities which, although not destroying the plasma,
lead to a deterioration of confinement. The JET experiments were to bring to light unexpected
behaviour, both good and bad. The next chapter will tell the story of these investigations.
Given overall stability, attention turns to the confinement requirements of a reactor. To
heat the plasma to reactor conditions the heating systems must be able to overcome the energy
losses from the plasma. However, if the energy confinement could be made good enough, the
heating provided by the fusion α-particles alone would be able to balance the heat loss from the
plasma. The plasma would then ignite and continue to burn without any applied heating.
It is possible to calculate an approximate condition for ignition which, through a coincidence
of the algebra, gives a simple requirement on the plasma. The α-particle production rate is
proportional to n2, the square of the particle density. In the temperature range of interest the
production rate happens also to be approximately proportional to the square of the temperature,
T2, and the α-particle heating per unit volume is therefore proportional to n2T2.
For ignition, this α-particle heating must be sufficient to balance the power loss from the
plasma which, per unit volume, is given by the plasma energy density, 3nT, divided by the
confinement time τE, giving a power loss proportional to nT/τE. Allowing for the geometry, with
a 50:50 deuterium-tritium mixture, and taking the peak values of n and T, the α-particle heating
will exceed the power loss for
where $T is measured in keV. So we obtain the ignition requirement
It is quite neat that the obviously important quantities n, T and τE should appear in such a simple
way. It is also very convenient that although we have calculated the ignition condition for a
deuterium-tritium plasma, the figure of merit τE can be calculated for, say, a pure deuterium
plasma - the idea being that, in principle, the deuterium could be replaced by a deuterium-tritium
mixture.
ˆ ˆ ˆ ˆn T > 5 10
nT2 2 21
E
×τ
ˆ ˆn T > 5 10 m keVs.E21 –3 τ ×
ˆ ˆnT
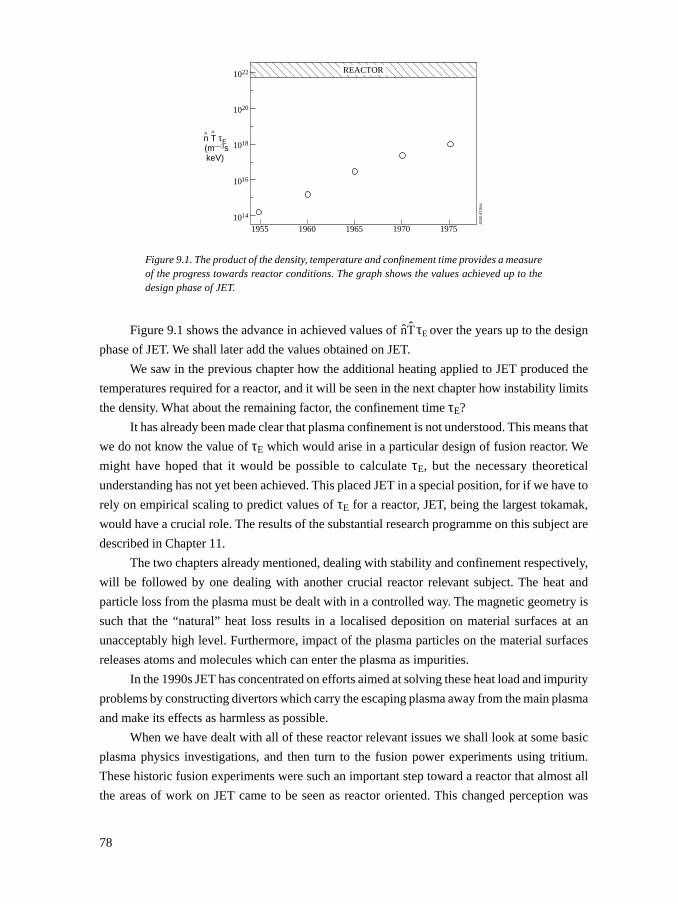
78
Figure 9.1. The product of the density, temperature and confinement time provides a measureof the progress towards reactor conditions. The graph shows the values achieved up to thedesign phase of JET.
Figure 9.1 shows the advance in achieved values of τE over the years up to the design
phase of JET. We shall later add the values obtained on JET.
We saw in the previous chapter how the additional heating applied to JET produced the
temperatures required for a reactor, and it will be seen in the next chapter how instability limits
the density. What about the remaining factor, the confinement time τE?
It has already been made clear that plasma confinement is not understood. This means that
we do not know the value of τE which would arise in a particular design of fusion reactor. We
might have hoped that it would be possible to calculate τE, but the necessary theoretical
understanding has not yet been achieved. This placed JET in a special position, for if we have to
rely on empirical scaling to predict values of τE for a reactor, JET, being the largest tokamak,
would have a crucial role. The results of the substantial research programme on this subject are
described in Chapter 11.
The two chapters already mentioned, dealing with stability and confinement respectively,
will be followed by one dealing with another crucial reactor relevant subject. The heat and
particle loss from the plasma must be dealt with in a controlled way. The magnetic geometry is
such that the “natural” heat loss results in a localised deposition on material surfaces at an
unacceptably high level. Furthermore, impact of the plasma particles on the material surfaces
releases atoms and molecules which can enter the plasma as impurities.
In the 1990s JET has concentrated on efforts aimed at solving these heat load and impurity
problems by constructing divertors which carry the escaping plasma away from the main plasma
and make its effects as harmless as possible.
When we have dealt with all of these reactor relevant issues we shall look at some basic
plasma physics investigations, and then turn to the fusion power experiments using tritium.
These historic fusion experiments were such an important step toward a reactor that almost all
the areas of work on JET came to be seen as reactor oriented. This changed perception was
REACTOR1022
1020
1018
1016
1014
1955 1960 1965 1970 1975
JG00
.47/
64c
n T τE(m—3skeV)
^^
ˆ ˆnT
79
further strengthened by requests for reactor relevent information from the team designing a
possible tokamak reactor to follow JET, namely ITER.
ITER stands for International Thermonuclear Reactor, and like JET its design team was
based on an international collaboration. There were four partners - the European Community,
Japan, the Russian Federation and the USA. The aim was to design a tokamak which would
ignite and produce fusion power in the gigawatt range. The successful design of such a reactor
calls for answers to many questions which only existing tokamaks can provide. In the crucial
areas of stability, confinement, heat exhaust, and deuterium-tritium plasmas JET was very well
placed to address the issues involved.

80
81
10. STABILITY AND INSTABILITY
In the early days of fusion research many approaches to magnetic confinement of plasmas were
tried. Each had its particular magnetic configuration, and most were found to be grossly unstable.
Tokamaks are basically stable. With the appropriate operating conditions they show none of the
fluctuations of the magnetic field which are the signatures of unstable plasmas.
However in pushing the plasma parameters toward the desired high pressures, and in
increasing the plasma current to achieve better confinement, a variety of instabilities appear. At
a low level these instabilities do not significantly affect confinement, but there are circumstances
where they completely disrupt the plasma and even bring a collapse of the plasma current.
Two other instabilities which are regularly seen are called the sawtooth instability and the
ELM, standing for Edge Localised Mode. Both of these instabilities have the form of a relaxation
oscillation - there is an abrupt instability, removing the destabilising conditions, and a slow
recovery returning the plasma to an unstable condition once again. This leads to a repetitive
instability. Both instabilities are localised, the sawtooth instability to the core of the plasma and
the ELM typically to the outer 10% of the radius. In their milder forms the sawtooth instability
and the ELM only have a weak effect on confinement, but in their grosser forms both present a
serious problem.
We shall look at these instabilities in turn, but first it should be made clear that they are not
the only instabilities. There are other small amplitude fluctuations and in particular, and crucially,
it is generally believed that the observed “degradation of confinement” is due to the small
fluctuations caused by an unidentified instability. The mysteries of plasma confinement are
described in Chapter 11.
Disruptions
It is hard to imagine a more dramatic end to a tokamak plasma than that caused by a “disruption”.
In fast JET disruptions the plasma energy is wholly lost in a few milliseconds and the plasma
current decays away in about ten milliseconds. Figure 10.1 shows the abruptness of the current
decay for a typical fast disruption. The associated power loss from the plasma can be several
gigawatts, a hundred times the applied heating power. These disruption events cause eddy currents
to flow in the vacuum vessel with associated forces of hundreds of tonnes. Some JET disruptions
end with part of the plasma current being transferred to a beam of relativistic electrons, constituting
a further threat to the surrounding material surfaces. Clearly a fusion reactor must not be subject
to such sudden destruction of the plasma, with the even larger forces involved.
There were two lines of investigation to follow. Firstly it was necessary to make an empirical
exploration of the operational boundaries which disruptions impose on disruption-free operation.
This was clearly an important question both for the operation of JET, and to provide design
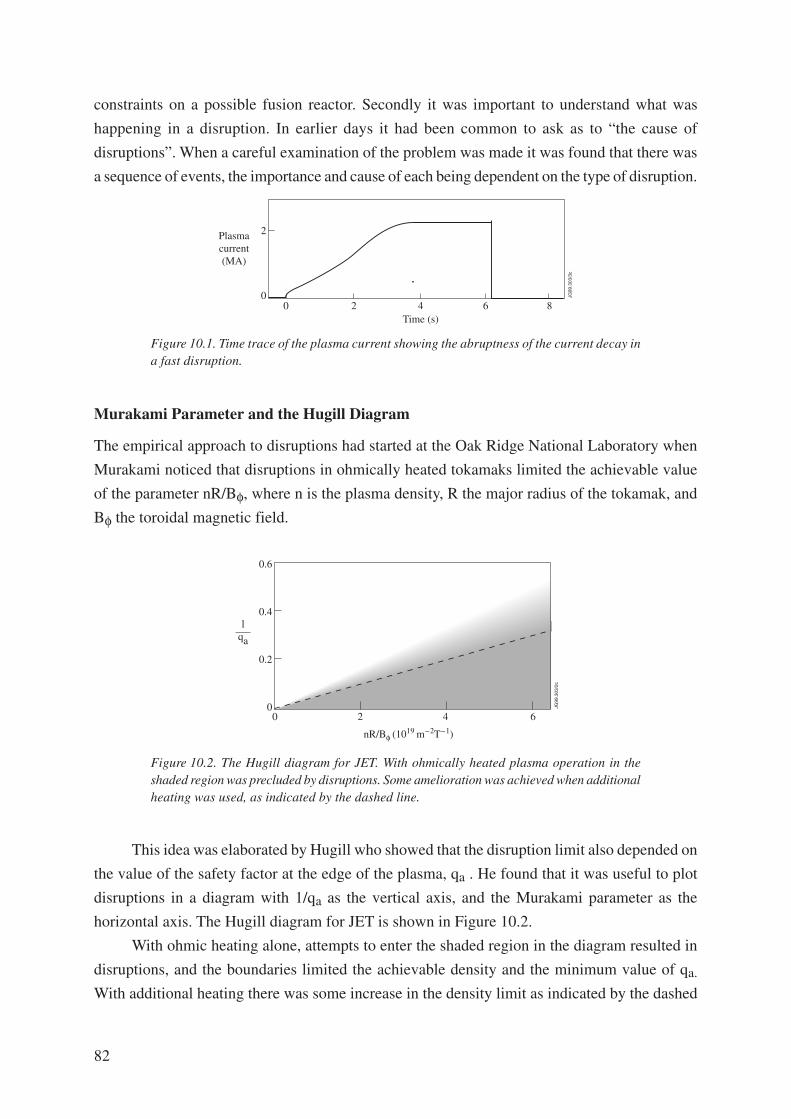
82
constraints on a possible fusion reactor. Secondly it was important to understand what was
happening in a disruption. In earlier days it had been common to ask as to “the cause of
disruptions”. When a careful examination of the problem was made it was found that there was
a sequence of events, the importance and cause of each being dependent on the type of disruption.
Figure 10.1. Time trace of the plasma current showing the abruptness of the current decay ina fast disruption.
Murakami Parameter and the Hugill Diagram
The empirical approach to disruptions had started at the Oak Ridge National Laboratory when
Murakami noticed that disruptions in ohmically heated tokamaks limited the achievable value
of the parameter nR/Bφ, where n is the plasma density, R the major radius of the tokamak, and
Bφ the toroidal magnetic field.
Figure 10.2. The Hugill diagram for JET. With ohmically heated plasma operation in theshaded region was precluded by disruptions. Some amelioration was achieved when additionalheating was used, as indicated by the dashed line.
This idea was elaborated by Hugill who showed that the disruption limit also depended on
the value of the safety factor at the edge of the plasma, qa . He found that it was useful to plot
disruptions in a diagram with 1/qa as the vertical axis, and the Murakami parameter as the
horizontal axis. The Hugill diagram for JET is shown in Figure 10.2.
With ohmic heating alone, attempts to enter the shaded region in the diagram resulted in
disruptions, and the boundaries limited the achievable density and the minimum value of qa.
With additional heating there was some increase in the density limit as indicated by the dashed
0 2 4Time (s)
Plasmacurrent(MA)
6 8
JG99
.303
/3c
2
0
0.6
0.4
0.2
00 2
nR/Bφ (1019 m
-2T-1)
JG99
.303
/2c
lqa
4 6
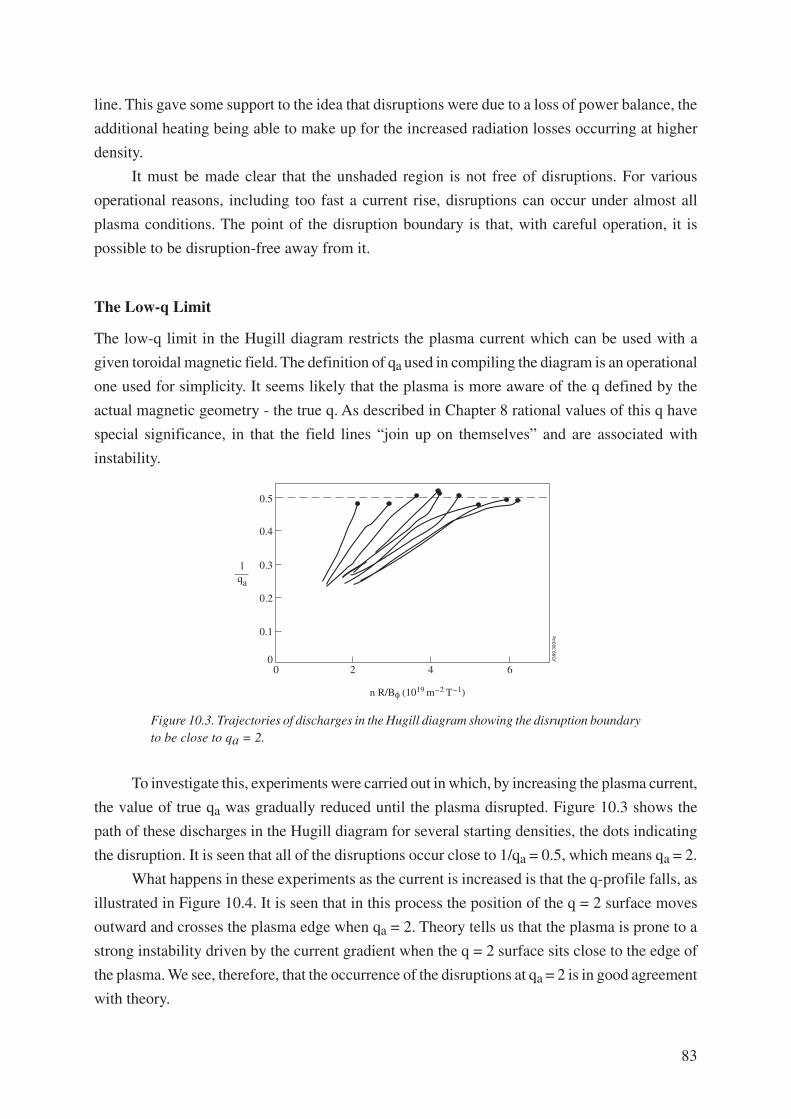
83
line. This gave some support to the idea that disruptions were due to a loss of power balance, the
additional heating being able to make up for the increased radiation losses occurring at higher
density.
It must be made clear that the unshaded region is not free of disruptions. For various
operational reasons, including too fast a current rise, disruptions can occur under almost all
plasma conditions. The point of the disruption boundary is that, with careful operation, it is
possible to be disruption-free away from it.
The Low-q Limit
The low-q limit in the Hugill diagram restricts the plasma current which can be used with a
given toroidal magnetic field. The definition of qa used in compiling the diagram is an operational
one used for simplicity. It seems likely that the plasma is more aware of the q defined by the
actual magnetic geometry - the true q. As described in Chapter 8 rational values of this q have
special significance, in that the field lines “join up on themselves” and are associated with
instability.
Figure 10.3. Trajectories of discharges in the Hugill diagram showing the disruption boundaryto be close to qa = 2.
To investigate this, experiments were carried out in which, by increasing the plasma current,
the value of true qa was gradually reduced until the plasma disrupted. Figure 10.3 shows the
path of these discharges in the Hugill diagram for several starting densities, the dots indicating
the disruption. It is seen that all of the disruptions occur close to 1/qa = 0.5, which means qa = 2.
What happens in these experiments as the current is increased is that the q-profile falls, as
illustrated in Figure 10.4. It is seen that in this process the position of the q = 2 surface moves
outward and crosses the plasma edge when qa = 2. Theory tells us that the plasma is prone to a
strong instability driven by the current gradient when the q = 2 surface sits close to the edge of
the plasma. We see, therefore, that the occurrence of the disruptions at qa = 2 is in good agreement
with theory.
0.5
0.4
0.3
0.2
lqa
0.1
00 2 4
JG99
.303
/4c
n R/Bφ (1019 m-2 T-1)
6
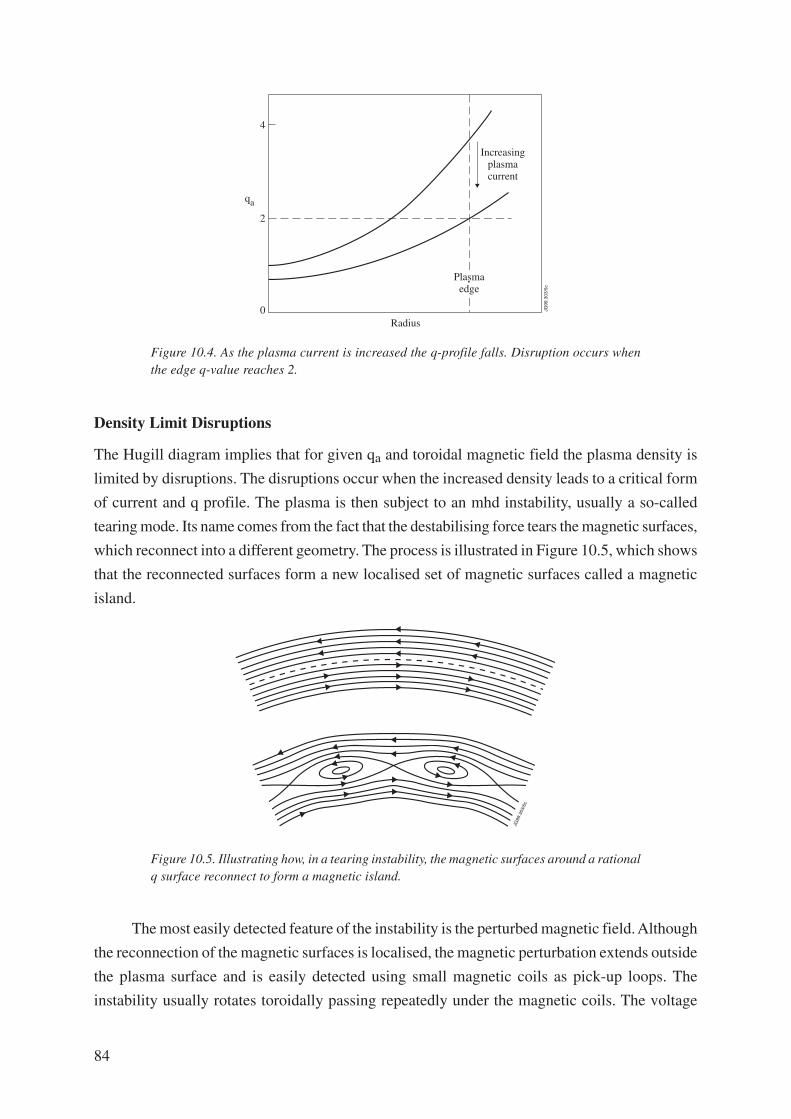
84
Figure 10.4. As the plasma current is increased the q-profile falls. Disruption occurs whenthe edge q-value reaches 2.
Density Limit Disruptions
The Hugill diagram implies that for given qa and toroidal magnetic field the plasma density is
limited by disruptions. The disruptions occur when the increased density leads to a critical form
of current and q profile. The plasma is then subject to an mhd instability, usually a so-called
tearing mode. Its name comes from the fact that the destabilising force tears the magnetic surfaces,
which reconnect into a different geometry. The process is illustrated in Figure 10.5, which shows
that the reconnected surfaces form a new localised set of magnetic surfaces called a magnetic
island.
Figure 10.5. Illustrating how, in a tearing instability, the magnetic surfaces around a rationalq surface reconnect to form a magnetic island.
The most easily detected feature of the instability is the perturbed magnetic field. Although
the reconnection of the magnetic surfaces is localised, the magnetic perturbation extends outside
the plasma surface and is easily detected using small magnetic coils as pick-up loops. The
instability usually rotates toroidally passing repeatedly under the magnetic coils. The voltage
4
2
0Radius
JG99
.303
/5c
qa
Increasingplasmacurrent
Plasmaedge
JG99
.303
/6c
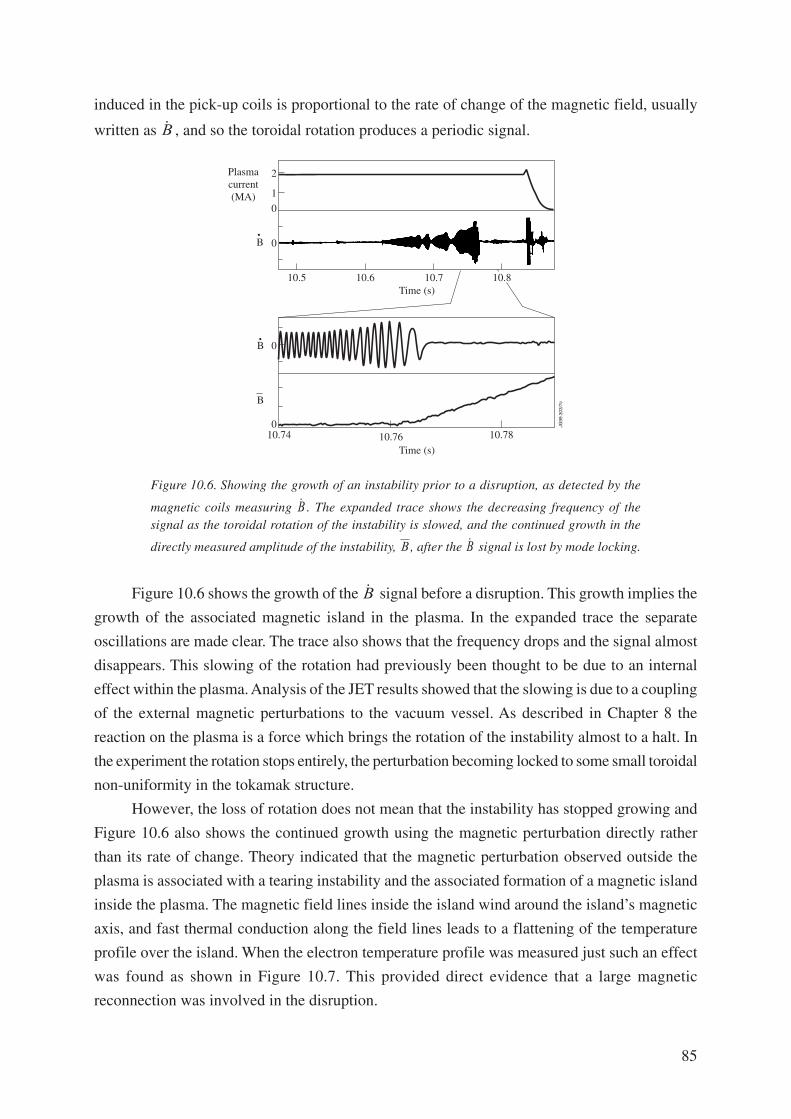
85
induced in the pick-up coils is proportional to the rate of change of the magnetic field, usually
written as &B , and so the toroidal rotation produces a periodic signal.
Figure 10.6. Showing the growth of an instability prior to a disruption, as detected by the
magnetic coils measuring &B . The expanded trace shows the decreasing frequency of thesignal as the toroidal rotation of the instability is slowed, and the continued growth in the
directly measured amplitude of the instability, B , after the &B signal is lost by mode locking.
Figure 10.6 shows the growth of the &B signal before a disruption. This growth implies the
growth of the associated magnetic island in the plasma. In the expanded trace the separate
oscillations are made clear. The trace also shows that the frequency drops and the signal almost
disappears. This slowing of the rotation had previously been thought to be due to an internal
effect within the plasma. Analysis of the JET results showed that the slowing is due to a coupling
of the external magnetic perturbations to the vacuum vessel. As described in Chapter 8 the
reaction on the plasma is a force which brings the rotation of the instability almost to a halt. In
the experiment the rotation stops entirely, the perturbation becoming locked to some small toroidal
non-uniformity in the tokamak structure.
However, the loss of rotation does not mean that the instability has stopped growing and
Figure 10.6 also shows the continued growth using the magnetic perturbation directly rather
than its rate of change. Theory indicated that the magnetic perturbation observed outside the
plasma is associated with a tearing instability and the associated formation of a magnetic island
inside the plasma. The magnetic field lines inside the island wind around the island’s magnetic
axis, and fast thermal conduction along the field lines leads to a flattening of the temperature
profile over the island. When the electron temperature profile was measured just such an effect
was found as shown in Figure 10.7. This provided direct evidence that a large magnetic
reconnection was involved in the disruption.
2
1
0
0
0
0
10.5
10.74 10.76 10.78
JG99
.303
/7c
10.6 10.7Time (s)
Time (s)
Plasmacurrent(MA)
B
B
10.8
B
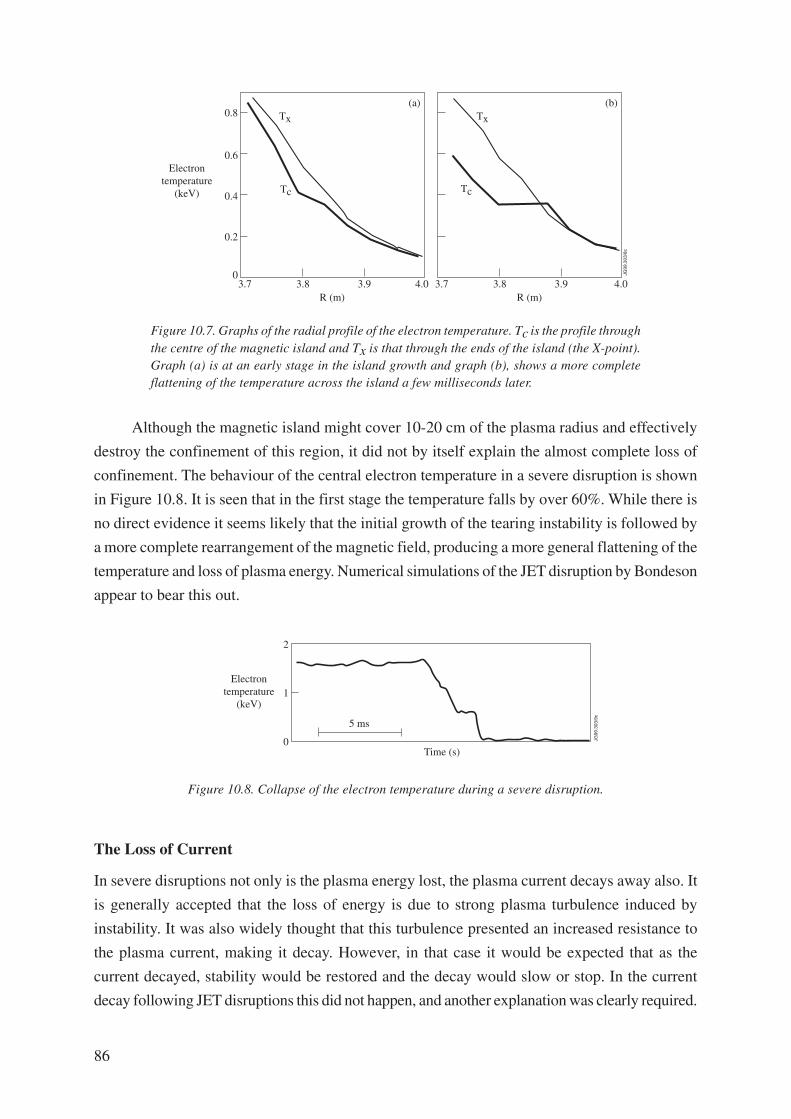
86
Figure 10.7. Graphs of the radial profile of the electron temperature. Tc is the profile throughthe centre of the magnetic island and Tx is that through the ends of the island (the X-point).Graph (a) is at an early stage in the island growth and graph (b), shows a more completeflattening of the temperature across the island a few milliseconds later.
Although the magnetic island might cover 10-20 cm of the plasma radius and effectively
destroy the confinement of this region, it did not by itself explain the almost complete loss of
confinement. The behaviour of the central electron temperature in a severe disruption is shown
in Figure 10.8. It is seen that in the first stage the temperature falls by over 60%. While there is
no direct evidence it seems likely that the initial growth of the tearing instability is followed by
a more complete rearrangement of the magnetic field, producing a more general flattening of the
temperature and loss of plasma energy. Numerical simulations of the JET disruption by Bondeson
appear to bear this out.
Figure 10.8. Collapse of the electron temperature during a severe disruption.
The Loss of Current
In severe disruptions not only is the plasma energy lost, the plasma current decays away also. It
is generally accepted that the loss of energy is due to strong plasma turbulence induced by
instability. It was also widely thought that this turbulence presented an increased resistance to
the plasma current, making it decay. However, in that case it would be expected that as the
current decayed, stability would be restored and the decay would slow or stop. In the current
decay following JET disruptions this did not happen, and another explanation was clearly required.
0.8(a) (b)
0.6
0.4
0.2
03.7 3.8 3.9
R (m) R (m)
JG99
.303
/8c
TxTx
TcTc
4.0 3.7 3.8 3.9 4.0
Electrontemperature
(keV)
Time (s)
JG99
.303
/9c
Electrontemperature
(keV)
5 ms
1
2
0
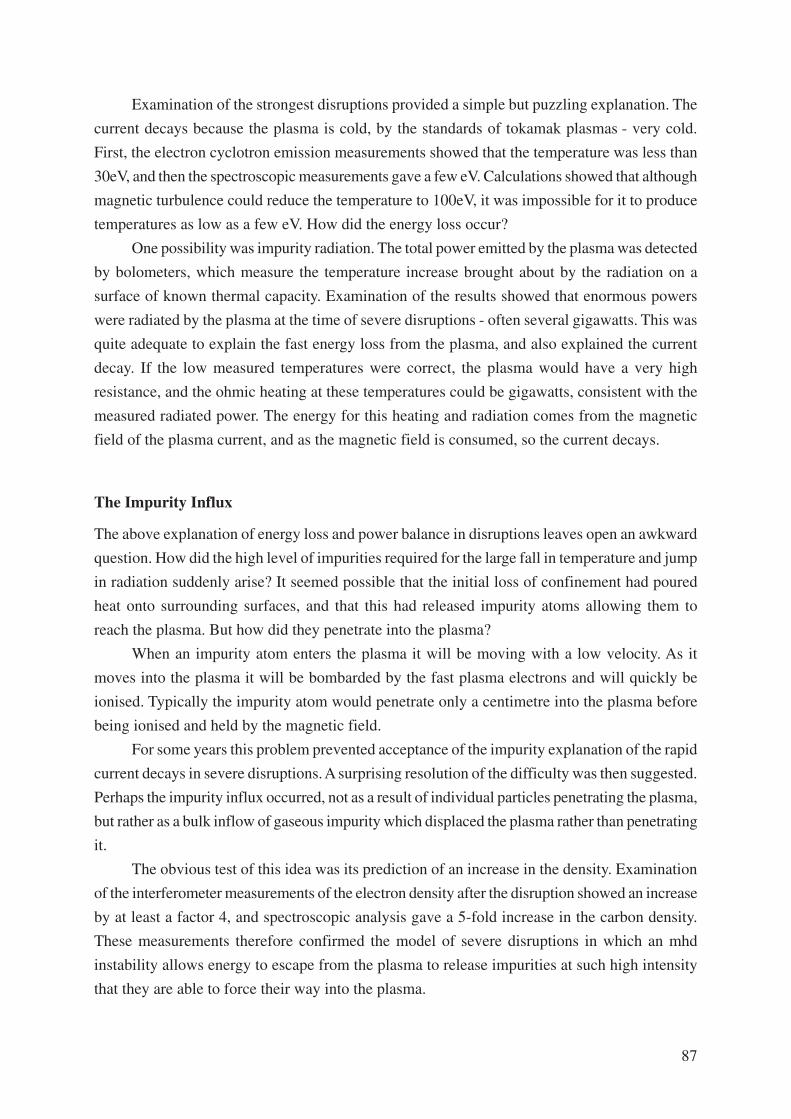
87
Examination of the strongest disruptions provided a simple but puzzling explanation. The
current decays because the plasma is cold, by the standards of tokamak plasmas - very cold.
First, the electron cyclotron emission measurements showed that the temperature was less than
30eV, and then the spectroscopic measurements gave a few eV. Calculations showed that although
magnetic turbulence could reduce the temperature to 100eV, it was impossible for it to produce
temperatures as low as a few eV. How did the energy loss occur?
One possibility was impurity radiation. The total power emitted by the plasma was detected
by bolometers, which measure the temperature increase brought about by the radiation on a
surface of known thermal capacity. Examination of the results showed that enormous powers
were radiated by the plasma at the time of severe disruptions - often several gigawatts. This was
quite adequate to explain the fast energy loss from the plasma, and also explained the current
decay. If the low measured temperatures were correct, the plasma would have a very high
resistance, and the ohmic heating at these temperatures could be gigawatts, consistent with the
measured radiated power. The energy for this heating and radiation comes from the magnetic
field of the plasma current, and as the magnetic field is consumed, so the current decays.
The Impurity Influx
The above explanation of energy loss and power balance in disruptions leaves open an awkward
question. How did the high level of impurities required for the large fall in temperature and jump
in radiation suddenly arise? It seemed possible that the initial loss of confinement had poured
heat onto surrounding surfaces, and that this had released impurity atoms allowing them to
reach the plasma. But how did they penetrate into the plasma?
When an impurity atom enters the plasma it will be moving with a low velocity. As it
moves into the plasma it will be bombarded by the fast plasma electrons and will quickly be
ionised. Typically the impurity atom would penetrate only a centimetre into the plasma before
being ionised and held by the magnetic field.
For some years this problem prevented acceptance of the impurity explanation of the rapid
current decays in severe disruptions. A surprising resolution of the difficulty was then suggested.
Perhaps the impurity influx occurred, not as a result of individual particles penetrating the plasma,
but rather as a bulk inflow of gaseous impurity which displaced the plasma rather than penetrating
it.
The obvious test of this idea was its prediction of an increase in the density. Examination
of the interferometer measurements of the electron density after the disruption showed an increase
by at least a factor 4, and spectroscopic analysis gave a 5-fold increase in the carbon density.
These measurements therefore confirmed the model of severe disruptions in which an mhd
instability allows energy to escape from the plasma to release impurities at such high intensity
that they are able to force their way into the plasma.
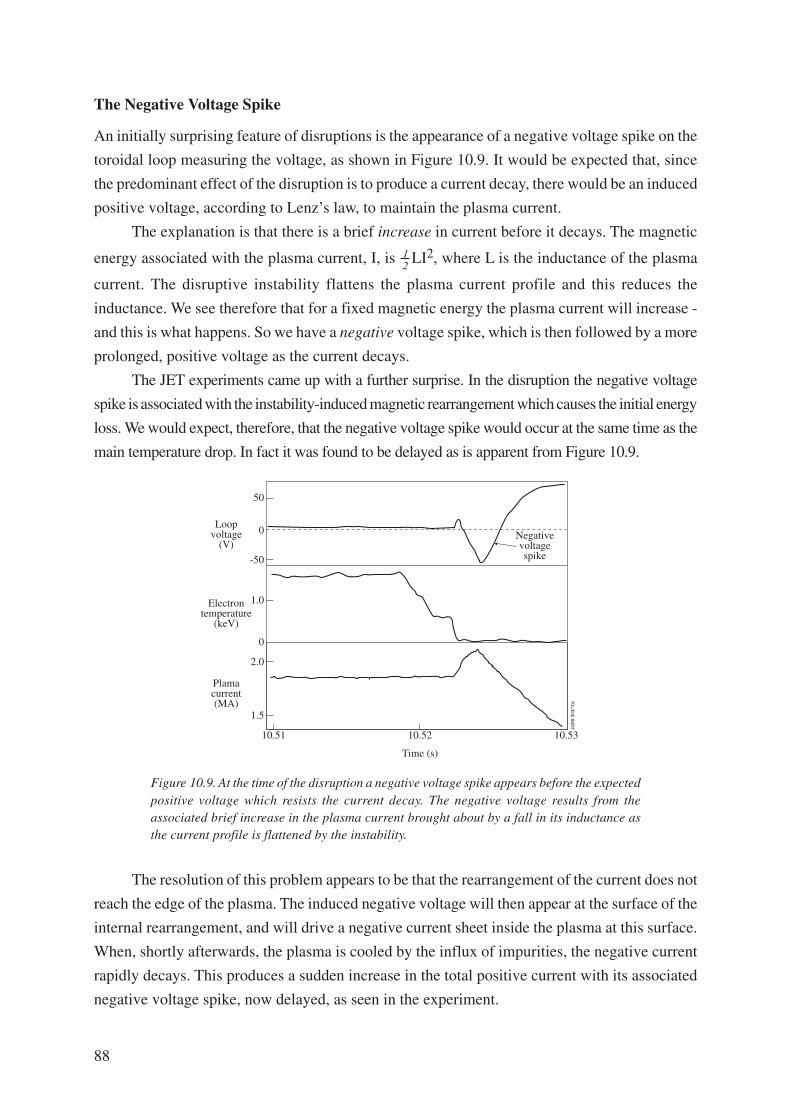
88
The Negative Voltage Spike
An initially surprising feature of disruptions is the appearance of a negative voltage spike on the
toroidal loop measuring the voltage, as shown in Figure 10.9. It would be expected that, since
the predominant effect of the disruption is to produce a current decay, there would be an induced
positive voltage, according to Lenz’s law, to maintain the plasma current.
The explanation is that there is a brief increase in current before it decays. The magnetic
energy associated with the plasma current, I, is 1
2LI2, where L is the inductance of the plasma
current. The disruptive instability flattens the plasma current profile and this reduces the
inductance. We see therefore that for a fixed magnetic energy the plasma current will increase -
and this is what happens. So we have a negative voltage spike, which is then followed by a more
prolonged, positive voltage as the current decays.
The JET experiments came up with a further surprise. In the disruption the negative voltage
spike is associated with the instability-induced magnetic rearrangement which causes the initial energy
loss. We would expect, therefore, that the negative voltage spike would occur at the same time as the
main temperature drop. In fact it was found to be delayed as is apparent from Figure 10.9.
Figure 10.9. At the time of the disruption a negative voltage spike appears before the expectedpositive voltage which resists the current decay. The negative voltage results from theassociated brief increase in the plasma current brought about by a fall in its inductance asthe current profile is flattened by the instability.
The resolution of this problem appears to be that the rearrangement of the current does not
reach the edge of the plasma. The induced negative voltage will then appear at the surface of the
internal rearrangement, and will drive a negative current sheet inside the plasma at this surface.
When, shortly afterwards, the plasma is cooled by the influx of impurities, the negative current
rapidly decays. This produces a sudden increase in the total positive current with its associated
negative voltage spike, now delayed, as seen in the experiment.
50
10.51 10.52
Time (s)
Plamacurrent(MA)
Electrontemperature
(keV)
Loopvoltage
(V)
10.53
JG99
.303
/10c
0
-50
1.0
0
2.0
1.5
Negativevoltagespike
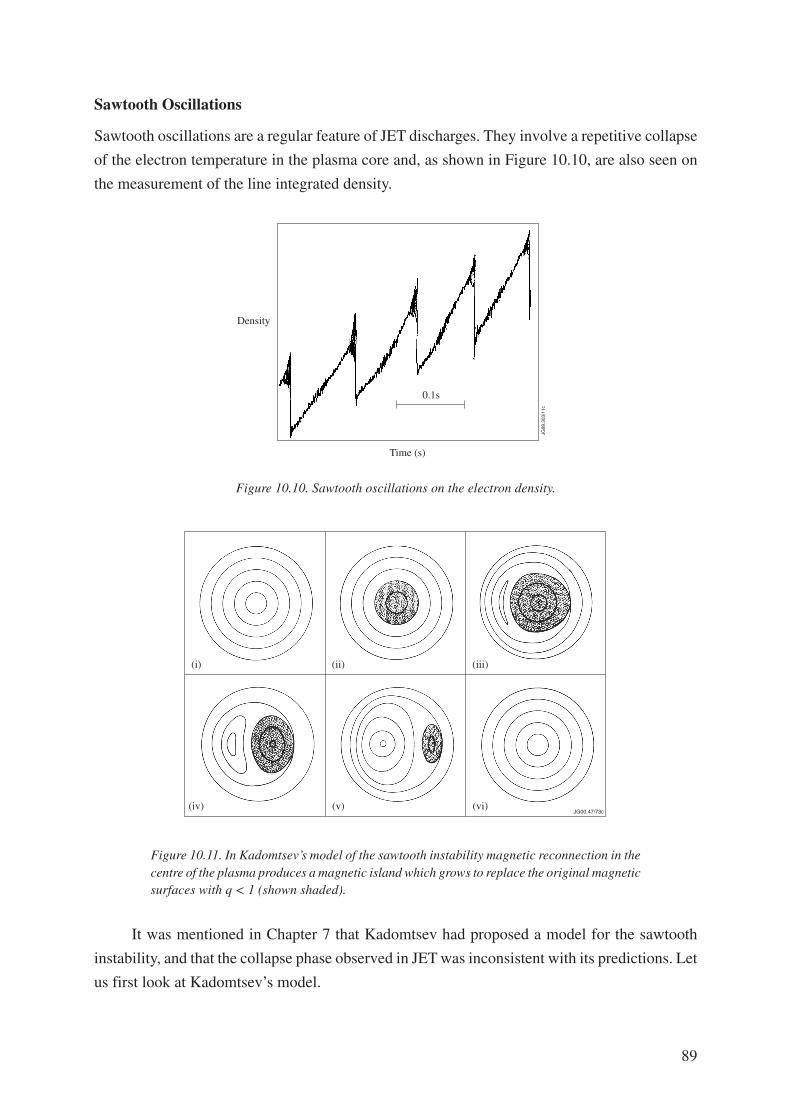
89
Sawtooth Oscillations
Sawtooth oscillations are a regular feature of JET discharges. They involve a repetitive collapse
of the electron temperature in the plasma core and, as shown in Figure 10.10, are also seen on
the measurement of the line integrated density.
Figure 10.10. Sawtooth oscillations on the electron density.
Figure 10.11. In Kadomtsev’s model of the sawtooth instability magnetic reconnection in thecentre of the plasma produces a magnetic island which grows to replace the original magneticsurfaces with q < 1 (shown shaded).
It was mentioned in Chapter 7 that Kadomtsev had proposed a model for the sawtooth
instability, and that the collapse phase observed in JET was inconsistent with its predictions. Let
us first look at Kadomtsev’s model.
Density
Time (s)
0.1s
JG99
.303
/11c
JG00.47/73c
(i) (ii) (iii)
(iv) (v) (vi)
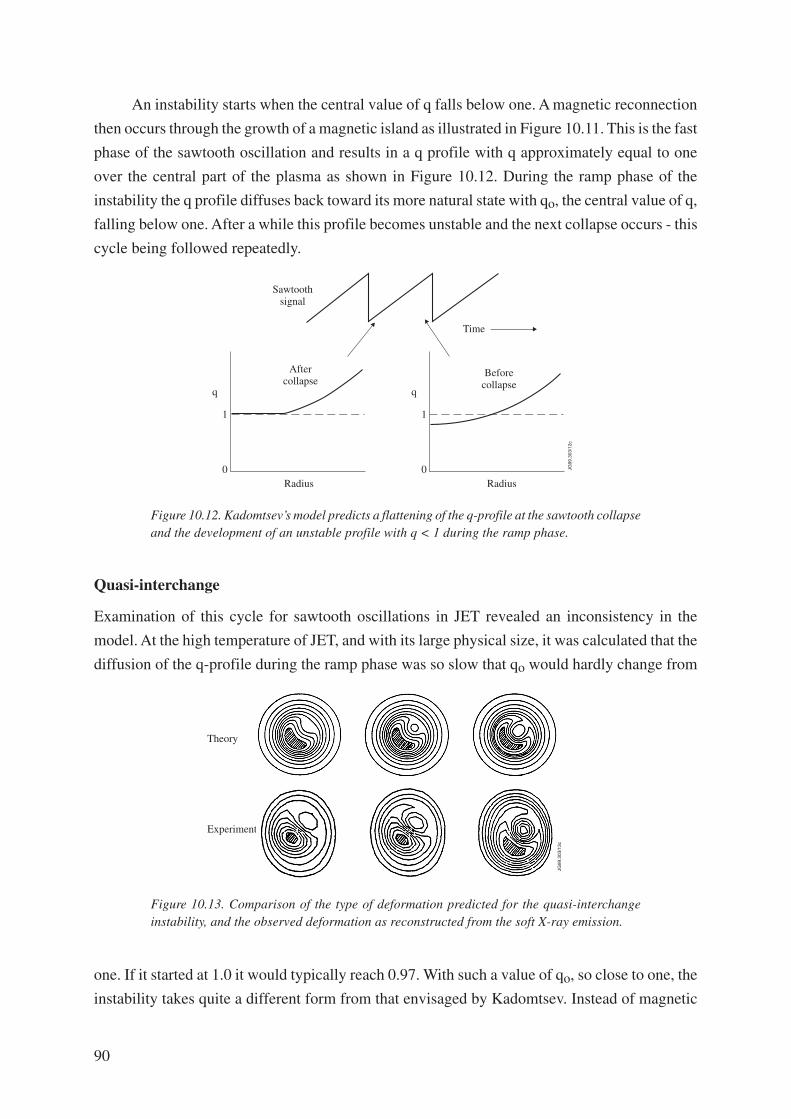
90
An instability starts when the central value of q falls below one. A magnetic reconnection
then occurs through the growth of a magnetic island as illustrated in Figure 10.11. This is the fast
phase of the sawtooth oscillation and results in a q profile with q approximately equal to one
over the central part of the plasma as shown in Figure 10.12. During the ramp phase of the
instability the q profile diffuses back toward its more natural state with qo, the central value of q,
falling below one. After a while this profile becomes unstable and the next collapse occurs - this
cycle being followed repeatedly.
Figure 10.12. Kadomtsev’s model predicts a flattening of the q-profile at the sawtooth collapseand the development of an unstable profile with q < 1 during the ramp phase.
Quasi-interchange
Examination of this cycle for sawtooth oscillations in JET revealed an inconsistency in the
model. At the high temperature of JET, and with its large physical size, it was calculated that the
diffusion of the q-profile during the ramp phase was so slow that qo would hardly change from
Figure 10.13. Comparison of the type of deformation predicted for the quasi-interchangeinstability, and the observed deformation as reconstructed from the soft X-ray emission.
one. If it started at 1.0 it would typically reach 0.97. With such a value of qo, so close to one, the
instability takes quite a different form from that envisaged by Kadomtsev. Instead of magnetic
Aftercollapse
Time
Sawtoothsignal
1
0RadiusRadius
1
q q
0
Beforecollapse
JG99
.303
/12c
Theory
Experiment
JG99
.303
/13c
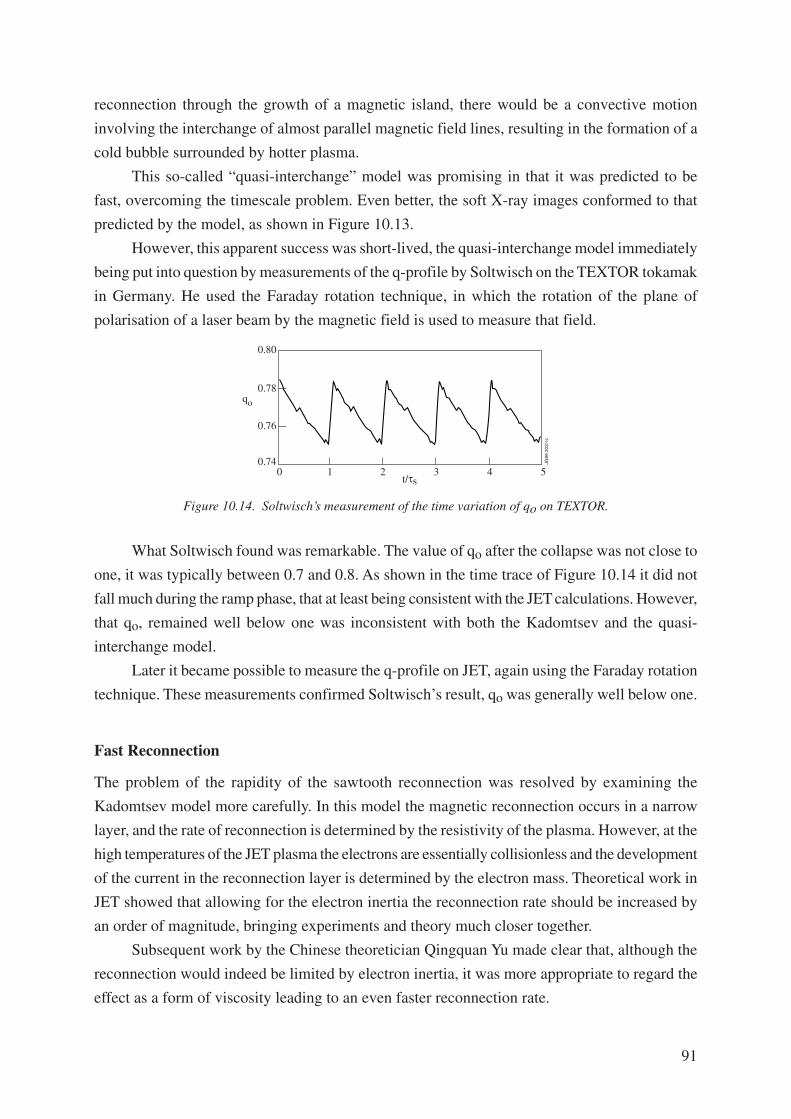
91
reconnection through the growth of a magnetic island, there would be a convective motion
involving the interchange of almost parallel magnetic field lines, resulting in the formation of a
cold bubble surrounded by hotter plasma.
This so-called “quasi-interchange” model was promising in that it was predicted to be
fast, overcoming the timescale problem. Even better, the soft X-ray images conformed to that
predicted by the model, as shown in Figure 10.13.
However, this apparent success was short-lived, the quasi-interchange model immediately
being put into question by measurements of the q-profile by Soltwisch on the TEXTOR tokamak
in Germany. He used the Faraday rotation technique, in which the rotation of the plane of
polarisation of a laser beam by the magnetic field is used to measure that field.
Figure 10.14. Soltwisch’s measurement of the time variation of qo on TEXTOR.
What Soltwisch found was remarkable. The value of qo after the collapse was not close to
one, it was typically between 0.7 and 0.8. As shown in the time trace of Figure 10.14 it did not
fall much during the ramp phase, that at least being consistent with the JET calculations. However,
that qo, remained well below one was inconsistent with both the Kadomtsev and the quasi-
interchange model.
Later it became possible to measure the q-profile on JET, again using the Faraday rotation
technique. These measurements confirmed Soltwisch’s result, qo was generally well below one.
Fast Reconnection
The problem of the rapidity of the sawtooth reconnection was resolved by examining the
Kadomtsev model more carefully. In this model the magnetic reconnection occurs in a narrow
layer, and the rate of reconnection is determined by the resistivity of the plasma. However, at the
high temperatures of the JET plasma the electrons are essentially collisionless and the development
of the current in the reconnection layer is determined by the electron mass. Theoretical work in
JET showed that allowing for the electron inertia the reconnection rate should be increased by
an order of magnitude, bringing experiments and theory much closer together.
Subsequent work by the Chinese theoretician Qingquan Yu made clear that, although the
reconnection would indeed be limited by electron inertia, it was more appropriate to regard the
effect as a form of viscosity leading to an even faster reconnection rate.
0.80
0 1 2t/τs
qo
3 4 5
JG99
.303
/1c
0.76
0.74
0.78
92
More Sawtooth Problems
Despite the progress on the physics of reconnection, the problem of the discrepancy of the
measured q-profile with theory persisted, and remains to this day. And more difficulties arose.
The first of these concerns the onset of the instability which causes the collapse. The
evolution of the q-profile during the ramp phase takes it into an unstable regime. At the point
where the configuration reaches this regime, so-called marginal stability, the growth rate is zero.
As already explained the evolution of the plasma equilibrium is very slow. So slow, in fact, that
during the very short time of the observed collapse the configuration would hardly have moved
from marginal stability, and the instability should have a slow growth, inconsistent with the very
fast growth observed in JET.
This has come to be called the trigger problem. It is unresolved for sawteeth, and is now
seen as a more general problem applying to other instabilities such as ELMs, to which we shall
return later.
The final sawtooth problem is that of the energy loss during the collapse. Since, apparently,
the collapse leaves qo well below one, any reconnection must be partial, and the central core,
then retains its structure of nested magnetic surfaces. This deprives us of Kadomstev’s mechanism
for transporting energy out of the core. But the temperature and density in the core do drop. How
can this be?
The explanation favoured by theoreticians was that the magnetic field lines are perturbed
by the instability in a more subtle way. They are not reconnected in a gross restructuring, but the
magnetic surfaces are broken by a smaller scale “wandering” of the magnetic field lines. As a
field line winds around the torus it wanders away from its original surface. Mathematically the
field line would eventually fill a whole region of space and is said to be ergodic.
It seems possible therefore that during the sawtooth collapse the magnetic field lines in the
core become ergodic and the electrons, with their very high thermal velocity, are then able to
carry their energy along the wandering field lines and out of the core. Theoretically this appears
quite plausible. What is the problem?
There are occasions in JET where a small trace of nickel impurity has made its way to a
region just outside the q = 1 surface which contains the potentially unstable core. The nickel is
readily tracked through its soft X-ray emission. When the next sawtooth collapse occurs it is
found that the nickel is transported into the core on the same short time scale as the electron
temperature collapse. But the thermal velocity of the nickel ions is 330 times smaller than that of
the electrons. If the electron temperature collapse is due to electrons moving along field lines
from the centre to the q = 1 surface, the nickel in this time would only cover 1/330 of the journey.
We see that the nickel could not reach the centre by moving along the supposedly ergodic field
lines, and some other explanation is called for. Although it is not logically necessary, it seems
likely that whatever explanation is found for the convection of the nickel would also explain the
electron temperature collapse - without appeal to ergodicity.
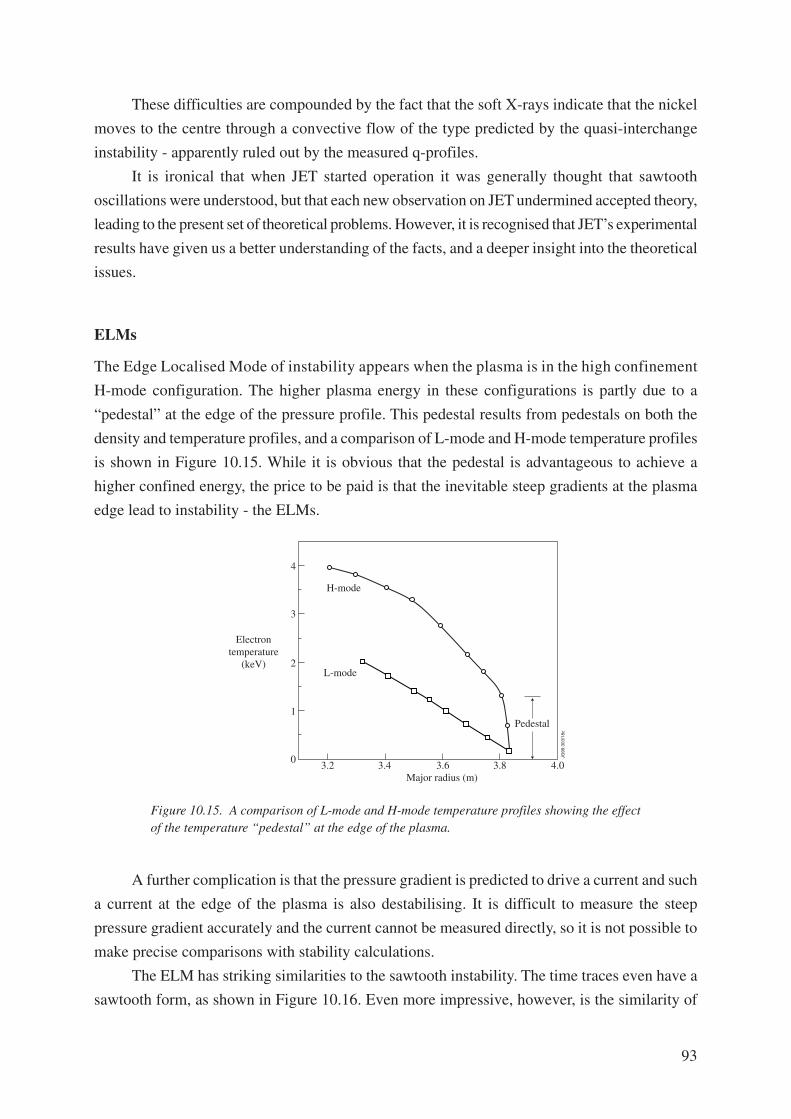
93
These difficulties are compounded by the fact that the soft X-rays indicate that the nickel
moves to the centre through a convective flow of the type predicted by the quasi-interchange
instability - apparently ruled out by the measured q-profiles.
It is ironical that when JET started operation it was generally thought that sawtooth
oscillations were understood, but that each new observation on JET undermined accepted theory,
leading to the present set of theoretical problems. However, it is recognised that JET’s experimental
results have given us a better understanding of the facts, and a deeper insight into the theoretical
issues.
ELMs
The Edge Localised Mode of instability appears when the plasma is in the high confinement
H-mode configuration. The higher plasma energy in these configurations is partly due to a
“pedestal” at the edge of the pressure profile. This pedestal results from pedestals on both the
density and temperature profiles, and a comparison of L-mode and H-mode temperature profiles
is shown in Figure 10.15. While it is obvious that the pedestal is advantageous to achieve a
higher confined energy, the price to be paid is that the inevitable steep gradients at the plasma
edge lead to instability - the ELMs.
Figure 10.15. A comparison of L-mode and H-mode temperature profiles showing the effectof the temperature “pedestal” at the edge of the plasma.
A further complication is that the pressure gradient is predicted to drive a current and such
a current at the edge of the plasma is also destabilising. It is difficult to measure the steep
pressure gradient accurately and the current cannot be measured directly, so it is not possible to
make precise comparisons with stability calculations.
The ELM has striking similarities to the sawtooth instability. The time traces even have a
sawtooth form, as shown in Figure 10.16. Even more impressive, however, is the similarity of
4
3
2
1
Electrontemperature
(keV)
JG99
.303
/18c
03.2 3.4
H-mode
L-mode
3.6Major radius (m)
Pedestal
3.8 4.0
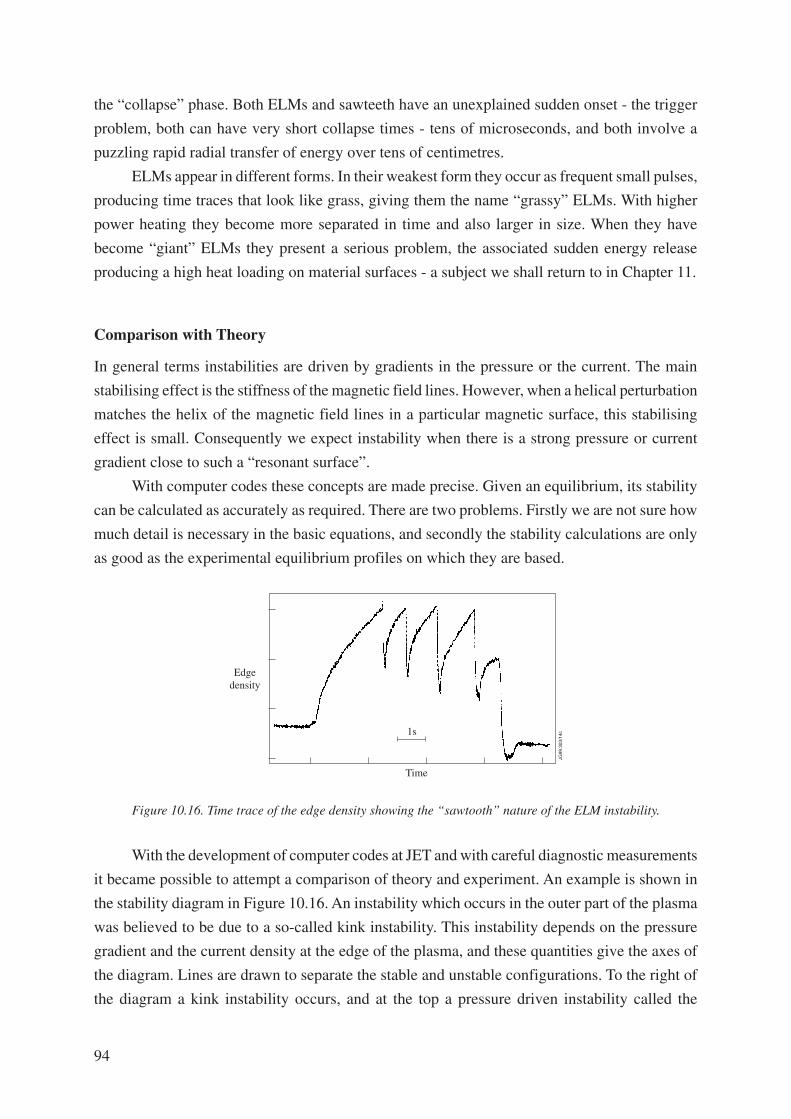
94
the “collapse” phase. Both ELMs and sawteeth have an unexplained sudden onset - the trigger
problem, both can have very short collapse times - tens of microseconds, and both involve a
puzzling rapid radial transfer of energy over tens of centimetres.
ELMs appear in different forms. In their weakest form they occur as frequent small pulses,
producing time traces that look like grass, giving them the name “grassy” ELMs. With higher
power heating they become more separated in time and also larger in size. When they have
become “giant” ELMs they present a serious problem, the associated sudden energy release
producing a high heat loading on material surfaces - a subject we shall return to in Chapter 11.
Comparison with Theory
In general terms instabilities are driven by gradients in the pressure or the current. The main
stabilising effect is the stiffness of the magnetic field lines. However, when a helical perturbation
matches the helix of the magnetic field lines in a particular magnetic surface, this stabilising
effect is small. Consequently we expect instability when there is a strong pressure or current
gradient close to such a “resonant surface”.
With computer codes these concepts are made precise. Given an equilibrium, its stability
can be calculated as accurately as required. There are two problems. Firstly we are not sure how
much detail is necessary in the basic equations, and secondly the stability calculations are only
as good as the experimental equilibrium profiles on which they are based.
Figure 10.16. Time trace of the edge density showing the “sawtooth” nature of the ELM instability.
With the development of computer codes at JET and with careful diagnostic measurements
it became possible to attempt a comparison of theory and experiment. An example is shown in
the stability diagram in Figure 10.16. An instability which occurs in the outer part of the plasma
was believed to be due to a so-called kink instability. This instability depends on the pressure
gradient and the current density at the edge of the plasma, and these quantities give the axes of
the diagram. Lines are drawn to separate the stable and unstable configurations. To the right of
the diagram a kink instability occurs, and at the top a pressure driven instability called the
Edgedensity
Time
1s
JG99
.303
/14c
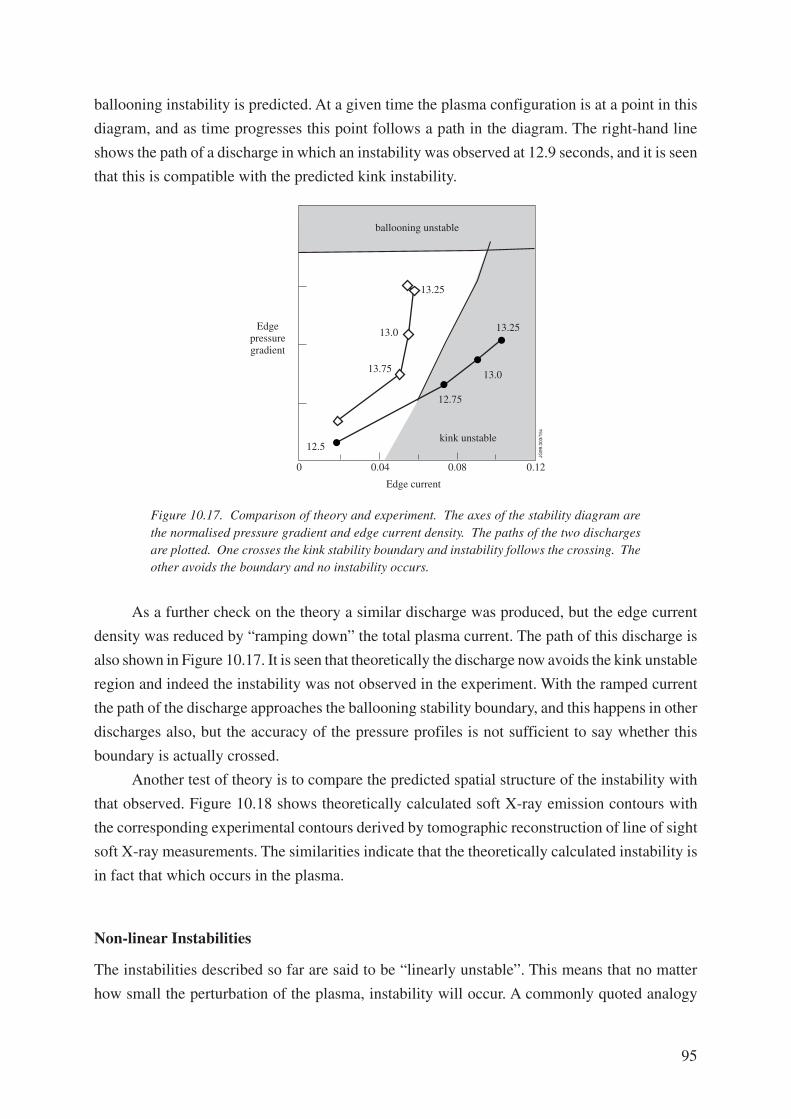
95
ballooning instability is predicted. At a given time the plasma configuration is at a point in this
diagram, and as time progresses this point follows a path in the diagram. The right-hand line
shows the path of a discharge in which an instability was observed at 12.9 seconds, and it is seen
that this is compatible with the predicted kink instability.
Figure 10.17. Comparison of theory and experiment. The axes of the stability diagram arethe normalised pressure gradient and edge current density. The paths of the two dischargesare plotted. One crosses the kink stability boundary and instability follows the crossing. Theother avoids the boundary and no instability occurs.
As a further check on the theory a similar discharge was produced, but the edge current
density was reduced by “ramping down” the total plasma current. The path of this discharge is
also shown in Figure 10.17. It is seen that theoretically the discharge now avoids the kink unstable
region and indeed the instability was not observed in the experiment. With the ramped current
the path of the discharge approaches the ballooning stability boundary, and this happens in other
discharges also, but the accuracy of the pressure profiles is not sufficient to say whether this
boundary is actually crossed.
Another test of theory is to compare the predicted spatial structure of the instability with
that observed. Figure 10.18 shows theoretically calculated soft X-ray emission contours with
the corresponding experimental contours derived by tomographic reconstruction of line of sight
soft X-ray measurements. The similarities indicate that the theoretically calculated instability is
in fact that which occurs in the plasma.
Non-linear Instabilities
The instabilities described so far are said to be “linearly unstable”. This means that no matter
how small the perturbation of the plasma, instability will occur. A commonly quoted analogy
0.040
Edge current
Edgepressuregradient
0.08 0.12
JG99
.303
/15c
ballooning unstable
13.25
13.0
13.75
12.5
12.75
13.0
13.25
kink unstable
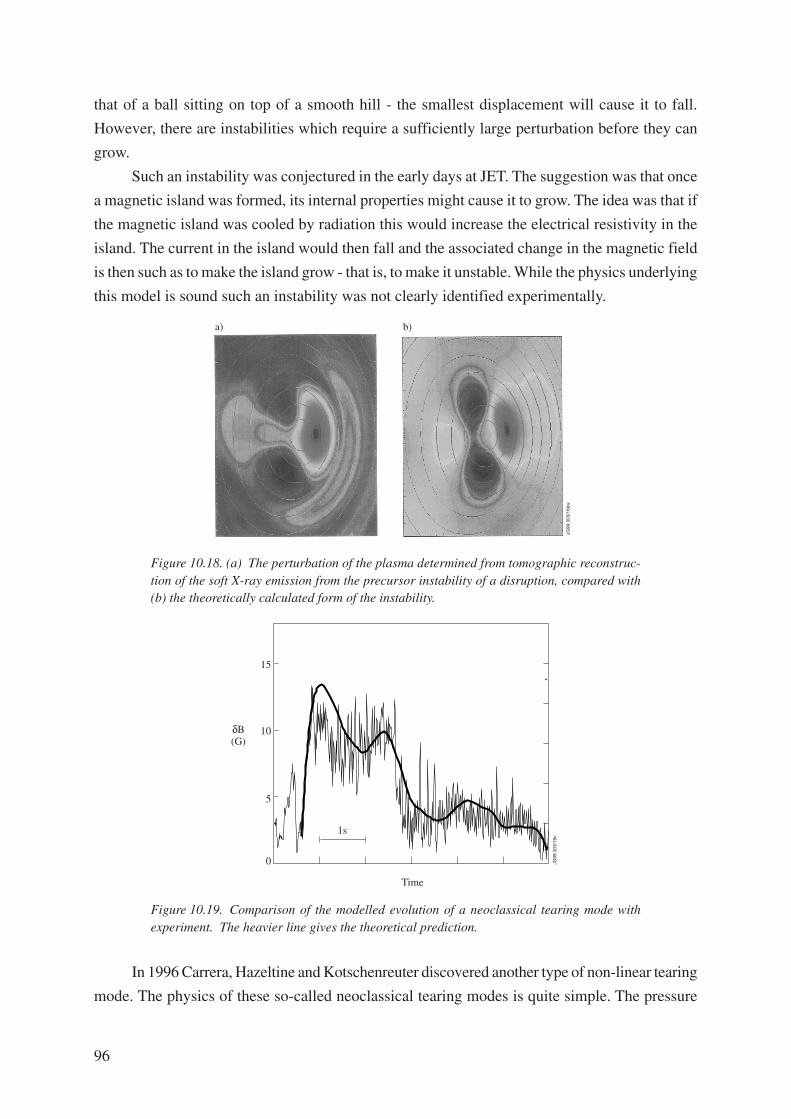
96
that of a ball sitting on top of a smooth hill - the smallest displacement will cause it to fall.
However, there are instabilities which require a sufficiently large perturbation before they can
grow.
Such an instability was conjectured in the early days at JET. The suggestion was that once
a magnetic island was formed, its internal properties might cause it to grow. The idea was that if
the magnetic island was cooled by radiation this would increase the electrical resistivity in the
island. The current in the island would then fall and the associated change in the magnetic field
is then such as to make the island grow - that is, to make it unstable. While the physics underlying
this model is sound such an instability was not clearly identified experimentally.
Figure 10.18. (a) The perturbation of the plasma determined from tomographic reconstruc-tion of the soft X-ray emission from the precursor instability of a disruption, compared with(b) the theoretically calculated form of the instability.
Figure 10.19. Comparison of the modelled evolution of a neoclassical tearing mode withexperiment. The heavier line gives the theoretical prediction.
In 1996 Carrera, Hazeltine and Kotschenreuter discovered another type of non-linear tearing
mode. The physics of these so-called neoclassical tearing modes is quite simple. The pressure
JG99
.303
/19c
15
10
5
0
1s
Time
δB(G)
JG99
.303
/16b
w
a) b)
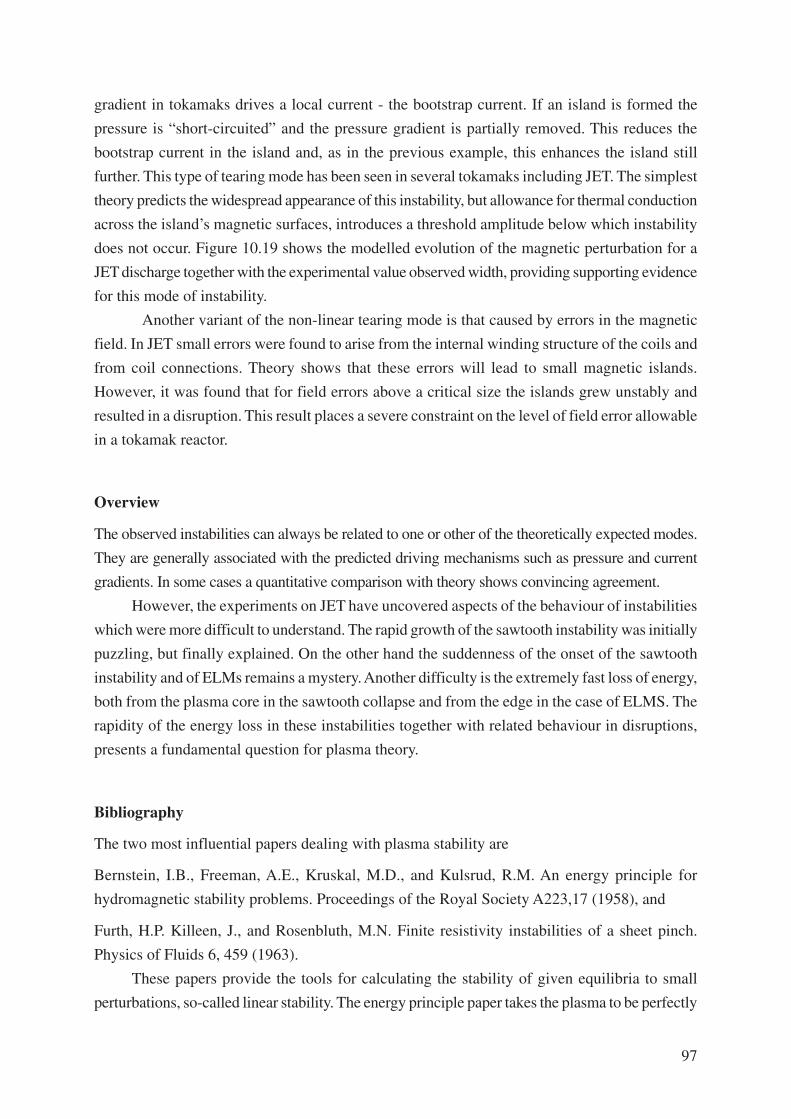
97
gradient in tokamaks drives a local current - the bootstrap current. If an island is formed the
pressure is “short-circuited” and the pressure gradient is partially removed. This reduces the
bootstrap current in the island and, as in the previous example, this enhances the island still
further. This type of tearing mode has been seen in several tokamaks including JET. The simplest
theory predicts the widespread appearance of this instability, but allowance for thermal conduction
across the island’s magnetic surfaces, introduces a threshold amplitude below which instability
does not occur. Figure 10.19 shows the modelled evolution of the magnetic perturbation for a
JET discharge together with the experimental value observed width, providing supporting evidence
for this mode of instability.
Another variant of the non-linear tearing mode is that caused by errors in the magnetic
field. In JET small errors were found to arise from the internal winding structure of the coils and
from coil connections. Theory shows that these errors will lead to small magnetic islands.
However, it was found that for field errors above a critical size the islands grew unstably and
resulted in a disruption. This result places a severe constraint on the level of field error allowable
in a tokamak reactor.
Overview
The observed instabilities can always be related to one or other of the theoretically expected modes.
They are generally associated with the predicted driving mechanisms such as pressure and current
gradients. In some cases a quantitative comparison with theory shows convincing agreement.
However, the experiments on JET have uncovered aspects of the behaviour of instabilities
which were more difficult to understand. The rapid growth of the sawtooth instability was initially
puzzling, but finally explained. On the other hand the suddenness of the onset of the sawtooth
instability and of ELMs remains a mystery. Another difficulty is the extremely fast loss of energy,
both from the plasma core in the sawtooth collapse and from the edge in the case of ELMS. The
rapidity of the energy loss in these instabilities together with related behaviour in disruptions,
presents a fundamental question for plasma theory.
Bibliography
The two most influential papers dealing with plasma stability are
Bernstein, I.B., Freeman, A.E., Kruskal, M.D., and Kulsrud, R.M. An energy principle for
hydromagnetic stability problems. Proceedings of the Royal Society A223,17 (1958), and
Furth, H.P. Killeen, J., and Rosenbluth, M.N. Finite resistivity instabilities of a sheet pinch.
Physics of Fluids 6, 459 (1963).
These papers provide the tools for calculating the stability of given equilibria to small
perturbations, so-called linear stability. The energy principle paper takes the plasma to be perfectly
98
conducting and the “F.K.R.” paper extends this to include the effect of finite resistivity allowing,
for example, tearing modes.
When the merits of tokamaks became apparent their linear stability properties were rapidly
investigated and a summary of the stability theory was given in
Wesson, J.A. Hydromagnetic stability of tokamaks. Nuclear Fusion 18, 87 (1978).
However, as the JET experiments progressed it became apparent that the instabilities observed
displayed features which could not be explained by the available theory. The first reason for this
is that in some cases more complete equations are needed in calculating the linear stability. The
other reason is that the linear approximation is inappropriate and a more general description is
required. A further difficulty is the uncertainty regarding the precise equilibrium configuration
at the time the instability occurs, especially when it is changing in time.
The most destructive instability observed is the disruption and the role of impurity radiation
in producing an unstable configuration was described in Chapter 7. A summary of the studies of
JET disruptions was given in the review
Wesson, J.A., Gill, R.D. Hugon, M. Schüller, F.C., Snipes, J.A., Ward, D.J., Bartlett, D.V.,
Campbell, D.J., Duperrex, P.A., Lopes Cardozo, N., Mast, K.F., Nave, M.F.F., Salmon, N.A.,
Smedulders, P., Thomas, P.R., Tubbing, B.J.D., Turner, M.F., and Weller, A. Disruptions in JET.
Nuclear Fusion 29, 641 (1989).
This article describes the sequence of events in JET and includes evidence for the qa = 2, low q
limit and for the growth of magnetic islands, together with accounts of the production of runaway
electrons and the negative voltage spike.
Two subsequent papers dealing with JET disruptions are
Wesson, J.A., Ward, D.J. and Rosenbluth, M.N. Negative voltage spike in tokamaks. Nuclear
Fusion 30, 1011 (1990).
Ward, D.J. and Wesson J.A. Impurity influx model of fast tokamak disruptions. Nuclear Fusion
32, 1117 (1992).
Evidence for impurity influx and plasma cooling to a few eV is given in
Sawtooth oscillations and disruptions in JET, by the JET team. Plasma Physics and Controlled
Nuclear Fusion Research (Proc. 14th Int. Conf. on Plasma Physics and Controlled Fusion,
Würzburg, 1992) Vol.1, 437, IAEA Vienna 1993.
The numerical simulation of a JET disruption is described in Bondeson, A., Parker, R.D.,
Hugon, M., and Smeulders, P. MHD modelling of density limit disruptions in tokamaks. Nuclear
Fusion 31, 1695 (1995)
99
Kadomtsev’s model of the sawtooth instability is described in
Kadomtsev, B.B. Disruptive instability in Tokamaks. Fizika Plasmy 1, 710 (1975) [Soviet Journal
of Physics 1, 389 (1976)],
and the quasi-interchange model was introduced in
Wesson, J.A. Sawtooth Oscillations. Plasma Physics and Controlled Fusion 28 (1A), 243 (1986),
and further developed in
Wesson, J.A., Kirby, P., and Nave, M.F.F. Sawtooth Oscillations. Plasma Physics and Controlled
Nuclear Fusion Research. (Proc. 11th Int. Conf. Kyoto, 1986) Vol. 2, 3, IAEA Vienna 1987.
Experimental evidence indicating this mode of behaviour was given in
Edwards, A.W., Campbell, D.J., Engelhardt, W.W., Fahrback, H.U., Gill, R.D., Granetz, R.S.
Tsuji, S., Tubbing, B.J., Weller A., Wesson, J., and Zasche, D. Rapid collapse of plasma sawtooth
oscillation in the JET tokamak. Physical Review Letters 57,210(1986).
The linear theory of quasi-interchange stability was given by
Nave, M.F.F. and Wesson, J.A. Stability of the ideal m=1 mode in a tokamak. Nuclear Fusion
28, 297 (1988).
The idea that the extreme rapidity of the sawtooth collapse was related to the role of electron
inertia was proposed by
Wesson, J.A. Sawtooth Reconnection. Plasma Physics and Controlled Nuclear Fusion Research,
(Proc. 13th Int. Conf. Washington, 1990) Vol. 2, 79, I.A.E.A. Vienna 1991, and Nuclear Fusion
30, 2545 (1990).
These papers gave a kinetic non-linear theory, the linear theory was subsequently provided by
Porcelli, F. Collisionless m = 1 tearing mode, Physical Review Letters 66, 425 (1991).
Later non-linear simulations of magnetic reconnection with electron inertia showed a fast growth
in the non-linear phase as seen in JET sawtooth collapses. They were published in
Ottaviani, M. and Porcelli, F. Non-linear collisionless magnetic reconnection. Physical Review
Letters 71, 3802 (1993), and Fast non-linear magnetic reconnection. Physics of Plasmas 2, 4104
(1995).
The importance of electron viscosity was pointed out by
Yu, Q. A new theoretical model for fast sawtooth collapse and confirming its quasi-interchange
structure. Nuclear Fusion 35, 1012 (1995).
The experimental evidence from JET casting doubt on the ergodic field line explanation of
100
energy transport in the sawtooth collapse and confirming the quasi-interchange structure is given
in
Wesson, J.A., Alper, B., Edwards, A.W., and Gill, R.D. Transport in sawtooth collapse. Physical
Review Letters 79, 5018 (1997).
A theory of feedback control of tearing modes was presented in
Lazzaro, E., and Nave, M.F.F. Feedback control of resistive modes. Physics of Fluids 31, 1623
(1988).
The observations on the various forms of mhd activity in JET were described in the following
papers,
Nave, M.F.F., Cambell, D.J., Joffrin, E., Marcus, F.B., Sadler, G., Smeulders, P., and Thomsen,
K. Fishbone-like events in JET. Nuclear Fusion 31, 687 (1991).
Nave, M.F.F., at al. MHD activity in JET hot ion H mode discharges. Nuclear Fusion 35, 409
(1995).
Nave, M.F.F., et al. An overview of MHD activity at the termination JET hot-ion H-modes.
Nuclear Fusion 37, 809 (1997).
Nave, M.F.F. et al. Discharge optimisation and control of MHD modes. Nuclear Fusion 39, 1567
(1999).
The error field instability is described in
Fishpool, G.M. and Haynes, P.S. Field error instabilities in JET. Nuclear Fusion 34, 109 (1994).
101
11. CONFINING THE PLASMA
The requirement on plasma confinement can be readily appreciated by considering the distance
a plasma particle would travel in a tokamak reactor. For example a typical deuteron ion in a
plasma with a temperature of 10 keV has a velocity of 1,000 km per second. Since in a reactor it
would be necessary to confine such particles for several seconds we see that the ion would travel
a distance comparable to the size of Europe.
The effect of the magnetic field is to turn the motion perpendicular to the field into small
circular orbits. Typically the orbit of the plasma ions has a radius of a few millimetres. This
means that the particles perform very many orbits, a deuteron ion completing about 30 orbits per
microsecond. The electrons, being faster and less massive, move in an orbit 60 times smaller at
3672 times the frequency. The particles move freely parallel to the magnetic field, but this takes
them along surfaces which are closed within the tokamak. In JET the particles are confined for
times of around a second, during which time the electrons travel a distance comparable with the
circumference of the earth, demonstrating the basic effectiveness of the magnetic field.
The question naturally arises as to what limits confinement in the magnetic field of a
tokamak. Why would the particles not gyrate about a field line forever? The first answer is that
the particles collide with each other and the collisions cause a displacement of the orbit. These
displacements are random and so the particles diffuse across the magnetic field until they reach
the edge of the plasma. The collisions also lead to a diffusive transfer of heat, as in a gas, the
hotter particles passing energy to their cooler neighbours.
Although calculation of the collisional diffusion is complicated, the simple account given
above implies a straightforward process of particle and energy loss. However, it is not like that.
From the earliest days of fusion research it was recognised that experimental plasmas were not
governed by the rules of collisional transport. The loss rates are higher than calculated, and a
large part of the experimental effort on JET has been devoted to trying to understand this behaviour.
However, before describing these endeavours, we must examine in more detail the basic collisional
transport of particles and energy.
Collisional Transport
In a gas the molecules spend most of their time free of collisions, the collisions being hard and
brief. We recall from Chapter 2 that, unlike gas molecules, the particles of a plasma have long
range interactions with each other. As a result each particle of a plasma is colliding simultaneously
and continuously with many other particles. However, when the effects of all these collisions are
summed it is found that it is possible to describe the behaviour in terms of a characteristic
collision time, τ. The collisional diffusion coefficients can be expressed in terms of this time.
For a particle with an orbit size ρ the diffusion coefficient has the form ρ2/τ. We see that in the
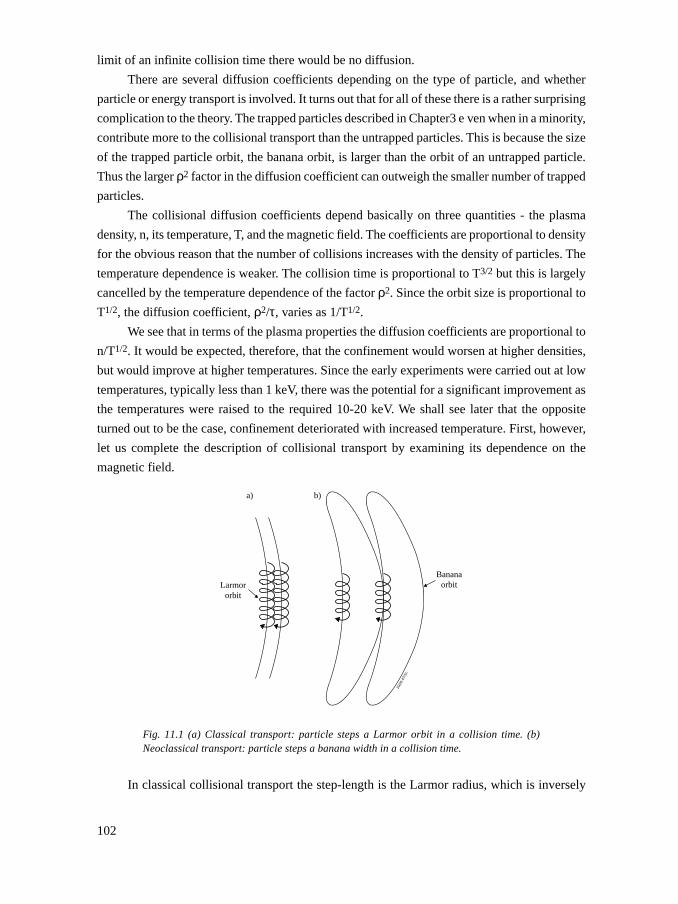
102
limit of an infinite collision time there would be no diffusion.
There are several diffusion coefficients depending on the type of particle, and whether
particle or energy transport is involved. It turns out that for all of these there is a rather surprising
complication to the theory. The trapped particles described in Chapter3 e ven when in a minority,
contribute more to the collisional transport than the untrapped particles. This is because the size
of the trapped particle orbit, the banana orbit, is larger than the orbit of an untrapped particle.
Thus the larger ρ2 factor in the diffusion coefficient can outweigh the smaller number of trapped
particles.
The collisional diffusion coefficients depend basically on three quantities - the plasma
density, n, its temperature, T, and the magnetic field. The coefficients are proportional to density
for the obvious reason that the number of collisions increases with the density of particles. The
temperature dependence is weaker. The collision time is proportional to T3/2 but this is largely
cancelled by the temperature dependence of the factor ρ2. Since the orbit size is proportional to
T1/2, the diffusion coefficient, ρ2/τ, varies as 1/T1/2.
We see that in terms of the plasma properties the diffusion coefficients are proportional to
n/T1/2. It would be expected, therefore, that the confinement would worsen at higher densities,
but would improve at higher temperatures. Since the early experiments were carried out at low
temperatures, typically less than 1 keV, there was the potential for a significant improvement as
the temperatures were raised to the required 10-20 keV. We shall see later that the opposite
turned out to be the case, confinement deteriorated with increased temperature. First, however,
let us complete the description of collisional transport by examining its dependence on the
magnetic field.
Fig. 11.1 (a) Classical transport: particle steps a Larmor orbit in a collision time. (b)Neoclassical transport: particle steps a banana width in a collision time.
In classical collisional transport the step-length is the Larmor radius, which is inversely
JG00
.47/
1c
BananaorbitLarmor
orbit
a) b)
103
proportional to the magnitude, B, of the total magnetic field. So a larger magnetic field means a
smaller orbit and consequently a smaller diffusion coefficient, varying as 1/B2. However as
described above the trapped particle diffusion is dominant in tokamaks and the characteristic
step-length for this process is the width of their banana orbit, as illustrated in Figure 11.1. The
banana width is inversely proportional to the small poloidal component of the magnetic field,
Bp, and the resulting, neoclassical, diffusion coefficients are therefore larger, being proportional
to 1/Bp2.
Because of the need to heat the plasma to reactor temperatures, and for the α-particle heating in
a reactor to sustain such temperatures, most interest attaches to the confinement of energy. In
collisional transport the particles have a thermal diffusion coefficient proportional to ρ2/τ. This
means that the ion thermal diffusion at a given temperature would be much larger than the
electron thermal diffusion. The ratio of ion and electron banana widths is the square root of their
mass ratio, mi/me, and so ρ2 is proportional to mi/me. Counteracting this, the ratio of the ion and
electron collision times is (mi/me)1/2. The result is a collisional ion thermal diffusivity which is
(mi/me)1/2 greater than that for electrons, giving a factor of 60 for deuterons.
Anomalous Transport
Having set the scene by describing the fundamental collisional diffusion process, we now face
the reality that in tokamak experiments it is found that the transport is anomalous, the transport
coefficients being much larger than predicted by collisional transport theory. The ion thermal
transport is typically a few times the collisional value, the precise ratio depending on the
conditions. The electron thermal transport is much more anomalous but, because the electron
collisional transport is very small, the outcome is that experimentally the two types of thermal
transport are comparable in magnitude. The obvious explanation of this anomalous behaviour,
in general terms, is that the plasma is subject to instability. The fluctuations which arise from
such instability would carry particles and energy across the magnetic surfaces and provide an
additional contribution to the transport.
A large number of able theoreticians have, over many years, sought to determine the nature
of the instability and to understand the resulting transport, but these efforts have not yielded a
generally accepted explanation. This has led to the adoption of empirical approaches for the
interpretation of the experimental results. The simplest formulation uses a measure of the quality
of energy confinement in the form of the energy confinement time, τΕ , introduced in Chapter 7,
which measures the time that the supplied energy resides in the plasma. In a steady state with a
total heating power P, and a total plasma energy W, the confinement time is given by.
τE = WP
11.1
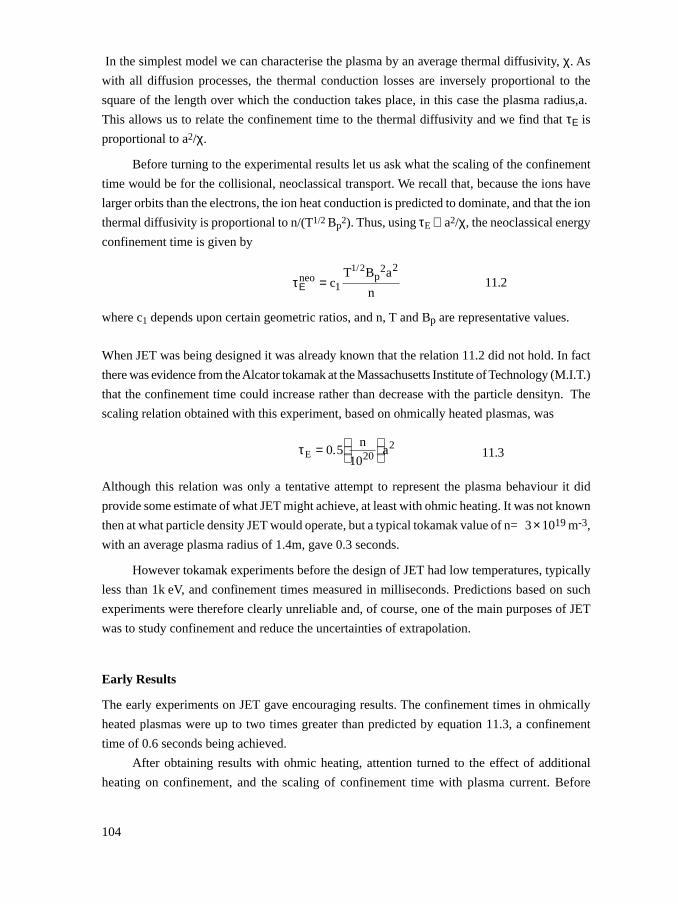
104
In the simplest model we can characterise the plasma by an average thermal diffusivity, χ. As
with all diffusion processes, the thermal conduction losses are inversely proportional to the
square of the length over which the conduction takes place, in this case the plasma radius,a.
This allows us to relate the confinement time to the thermal diffusivity and we find that τΕ is
proportional to a2/χ.
Before turning to the experimental results let us ask what the scaling of the confinement
time would be for the collisional, neoclassical transport. We recall that, because the ions have
larger orbits than the electrons, the ion heat conduction is predicted to dominate, and that the ion
thermal diffusivity is proportional to n/(T1/2 Bp2). Thus, using τE ∝ a2/χ, the neoclassical energy
confinement time is given by
τΕneo = c1
T1/2Bp2a2
n11.2
where c1 depends upon certain geometric ratios, and n, T and Bp are representative values.
When JET was being designed it was already known that the relation 11.2 did not hold. In fact
there was evidence from the Alcator tokamak at the Massachusetts Institute of Technology (M.I.T.)
that the confinement time could increase rather than decrease with the particle densityn. The
scaling relation obtained with this experiment, based on ohmically heated plasmas, was
τE = 0.5n
1020
a2
11.3
Although this relation was only a tentative attempt to represent the plasma behaviour it did
provide some estimate of what JET might achieve, at least with ohmic heating. It was not known
then at what particle density JET would operate, but a typical tokamak value of n= 3× 10¹⁹ m-3,
with an average plasma radius of 1.4m, gave 0.3 seconds.
However tokamak experiments before the design of JET had low temperatures, typically
less than 1k eV, and confinement times measured in milliseconds. Predictions based on such
experiments were therefore clearly unreliable and, of course, one of the main purposes of JET
was to study confinement and reduce the uncertainties of extrapolation.
Early Results
The early experiments on JET gave encouraging results. The confinement times in ohmically
heated plasmas were up to two times greater than predicted by equation 11.3, a confinement
time of 0.6 seconds being achieved.
After obtaining results with ohmic heating, attention turned to the effect of additional
heating on confinement, and the scaling of confinement time with plasma current. Before
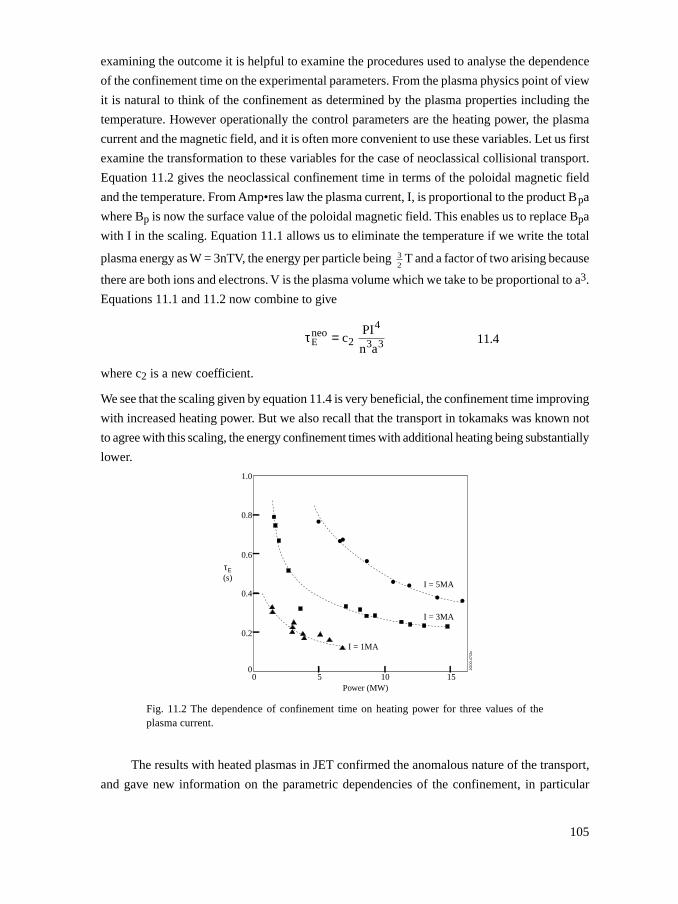
105
examining the outcome it is helpful to examine the procedures used to analyse the dependence
of the confinement time on the experimental parameters. From the plasma physics point of view
it is natural to think of the confinement as determined by the plasma properties including the
temperature. However operationally the control parameters are the heating power, the plasma
current and the magnetic field, and it is often more convenient to use these variables. Let us first
examine the transformation to these variables for the case of neoclassical collisional transport.
Equation 11.2 gives the neoclassical confinement time in terms of the poloidal magnetic field
and the temperature. From Amp•res law the plasma current, I, is proportional to the product Bpa
where Bp is now the surface value of the poloidal magnetic field. This enables us to replace Bpa
with I in the scaling. Equation 11.1 allows us to eliminate the temperature if we write the total
plasma energy as W = 3nTV, the energy per particle being 32
T and a factor of two arising because
there are both ions and electrons. V is the plasma volume which we take to be proportional to a3.
Equations 11.1 and 11.2 now combine to give
τEneo = c2
PI4
n3a3 11.4
where c2 is a new coefficient.
We see that the scaling given by equation 11.4 is very beneficial, the confinement time improving
with increased heating power. But we also recall that the transport in tokamaks was known not
to agree with this scaling, the energy confinement times with additional heating being substantially
lower.
Fig. 11.2 The dependence of confinement time on heating power for three values of theplasma current.
The results with heated plasmas in JET confirmed the anomalous nature of the transport,
and gave new information on the parametric dependencies of the confinement, in particular
1.0
0.8
0.6
0.4
τE(s)
0.2
00 5 10
Power (MW)15
I = 5MA
I = 3MA
I = 1MA
JG00
.47/
2c
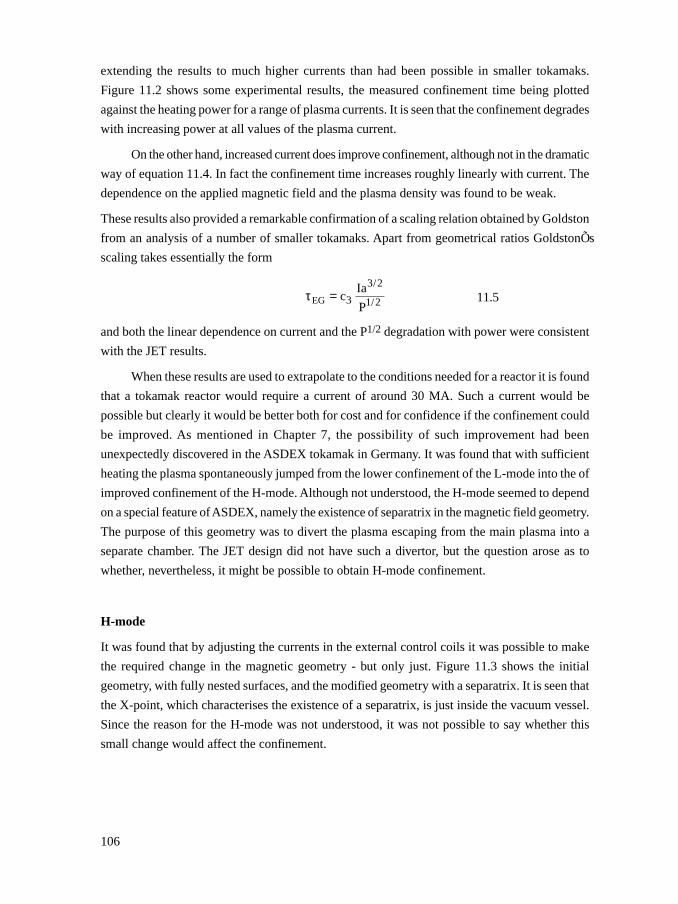
106
extending the results to much higher currents than had been possible in smaller tokamaks.
Figure 11.2 shows some experimental results, the measured confinement time being plotted
against the heating power for a range of plasma currents. It is seen that the confinement degrades
with increasing power at all values of the plasma current.
On the other hand, increased current does improve confinement, although not in the dramatic
way of equation 11.4. In fact the confinement time increases roughly linearly with current. The
dependence on the applied magnetic field and the plasma density was found to be weak.
These results also provided a remarkable confirmation of a scaling relation obtained by Goldston
from an analysis of a number of smaller tokamaks. Apart from geometrical ratios GoldstonÕs
scaling takes essentially the form
τEG = c3Ia3/2
P1/2 11.5
and both the linear dependence on current and the P1/2 degradation with power were consistent
with the JET results.
When these results are used to extrapolate to the conditions needed for a reactor it is found
that a tokamak reactor would require a current of around 30 MA. Such a current would be
possible but clearly it would be better both for cost and for confidence if the confinement could
be improved. As mentioned in Chapter 7, the possibility of such improvement had been
unexpectedly discovered in the ASDEX tokamak in Germany. It was found that with sufficient
heating the plasma spontaneously jumped from the lower confinement of the L-mode into the of
improved confinement of the H-mode. Although not understood, the H-mode seemed to depend
on a special feature of ASDEX, namely the existence of separatrix in the magnetic field geometry.
The purpose of this geometry was to divert the plasma escaping from the main plasma into a
separate chamber. The JET design did not have such a divertor, but the question arose as to
whether, nevertheless, it might be possible to obtain H-mode confinement.
H-mode
It was found that by adjusting the currents in the external control coils it was possible to make
the required change in the magnetic geometry - but only just. Figure 11.3 shows the initial
geometry, with fully nested surfaces, and the modified geometry with a separatrix. It is seen that
the X-point, which characterises the existence of a separatrix, is just inside the vacuum vessel.
Since the reason for the H-mode was not understood, it was not possible to say whether this
small change would affect the confinement.
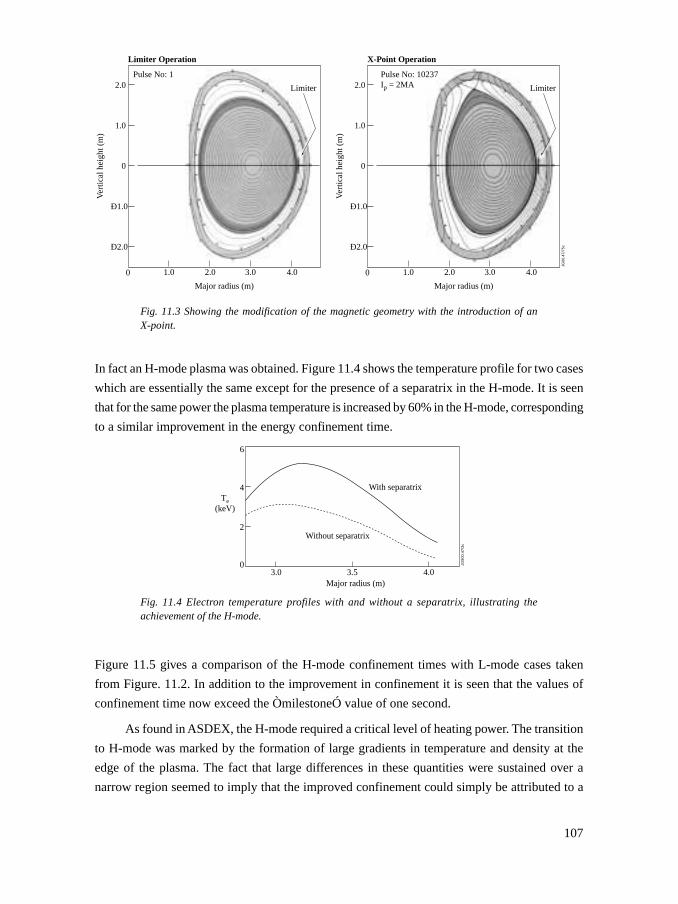
107
Fig. 11.3 Showing the modification of the magnetic geometry with the introduction of anX-point.
In fact an H-mode plasma was obtained. Figure 11.4 shows the temperature profile for two cases
which are essentially the same except for the presence of a separatrix in the H-mode. It is seen
that for the same power the plasma temperature is increased by 60% in the H-mode, corresponding
to a similar improvement in the energy confinement time.
Fig. 11.4 Electron temperature profiles with and without a separatrix, illustrating theachievement of the H-mode.
Figure 11.5 gives a comparison of the H-mode confinement times with L-mode cases taken
from Figure. 11.2. In addition to the improvement in confinement it is seen that the values of
confinement time now exceed the ÒmilestoneÓ value of one second.
As found in ASDEX, the H-mode required a critical level of heating power. The transition
to H-mode was marked by the formation of large gradients in temperature and density at the
edge of the plasma. The fact that large differences in these quantities were sustained over a
narrow region seemed to imply that the improved confinement could simply be attributed to a
6
4Te
(keV)
2
03.0 3.5
Major radius (m)4.0
With separatrix
Without separatrix
JG90
0.47
/3c
2.0Pulse No: 1
1.0
0
Ð1.0
Ð2.0
0 1.0 2.0 3.0 4.0
Major radius (m)
Ver
tical
hei
ght (
m)
Limiter Operation
Limiter 2.0Pulse No: 10237Ip = 2MA
1.0
0
Ð1.0
Ð2.0
0 1.0 2.0 3.0 4.0
Major radius (m)
Ver
tical
hei
ght (
m)
X-Point Operation
Limiter
JG00
.47/
75c
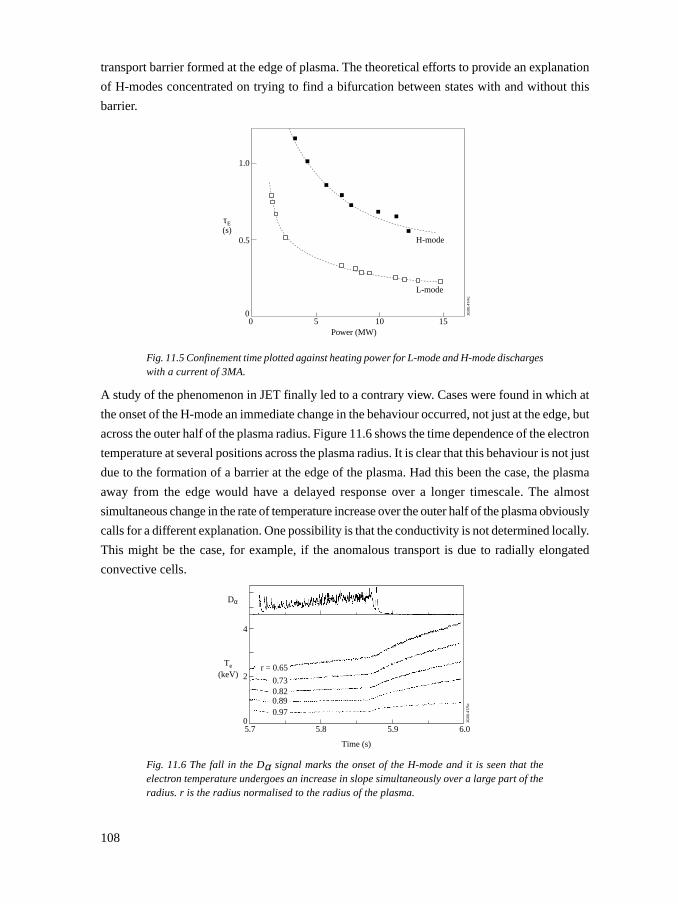
108
transport barrier formed at the edge of plasma. The theoretical efforts to provide an explanation
of H-modes concentrated on trying to find a bifurcation between states with and without this
barrier.
Fig. 11.5 Confinement time plotted against heating power for L-mode and H-mode dischargeswith a current of 3MA.
A study of the phenomenon in JET finally led to a contrary view. Cases were found in which at
the onset of the H-mode an immediate change in the behaviour occurred, not just at the edge, but
across the outer half of the plasma radius. Figure 11.6 shows the time dependence of the electron
temperature at several positions across the plasma radius. It is clear that this behaviour is not just
due to the formation of a barrier at the edge of the plasma. Had this been the case, the plasma
away from the edge would have a delayed response over a longer timescale. The almost
simultaneous change in the rate of temperature increase over the outer half of the plasma obviously
calls for a different explanation. One possibility is that the conductivity is not determined locally.
This might be the case, for example, if the anomalous transport is due to radially elongated
convective cells.
Fig. 11.6 The fall in the Dα signal marks the onset of the H-mode and it is seen that theelectron temperature undergoes an increase in slope simultaneously over a large part of theradius. r is the radius normalised to the radius of the plasma.
1.0
0.5
τE(s)
00
105Power (MW)
15
JG00
.47/
4c
L-mode
H-mode
Time (s)
Te
(keV) 2
4
05.7 5.8 5.9 6.0
Dα
JG00
.47/
5c
0.820.73
0.890.97
r = 0.65
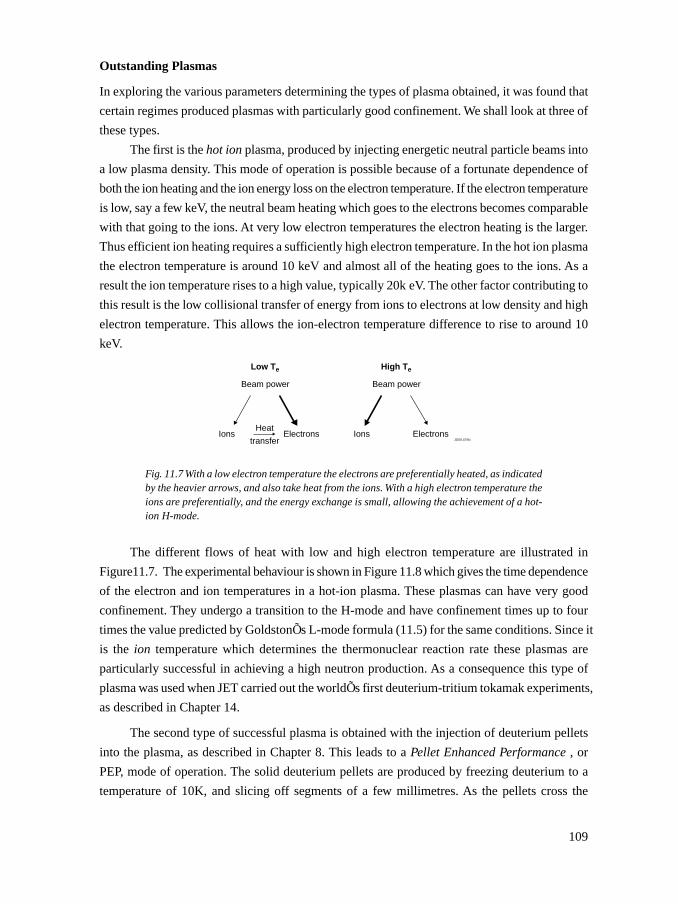
109
Outstanding Plasmas
In exploring the various parameters determining the types of plasma obtained, it was found that
certain regimes produced plasmas with particularly good confinement. We shall look at three of
these types.
The first is the hot ion plasma, produced by injecting energetic neutral particle beams into
a low plasma density. This mode of operation is possible because of a fortunate dependence of
both the ion heating and the ion energy loss on the electron temperature. If the electron temperature
is low, say a few keV, the neutral beam heating which goes to the electrons becomes comparable
with that going to the ions. At very low electron temperatures the electron heating is the larger.
Thus efficient ion heating requires a sufficiently high electron temperature. In the hot ion plasma
the electron temperature is around 10 keV and almost all of the heating goes to the ions. As a
result the ion temperature rises to a high value, typically 20k eV. The other factor contributing to
this result is the low collisional transfer of energy from ions to electrons at low density and high
electron temperature. This allows the ion-electron temperature difference to rise to around 10
keV.
Fig. 11.7 With a low electron temperature the electrons are preferentially heated, as indicatedby the heavier arrows, and also take heat from the ions. With a high electron temperature theions are preferentially, and the energy exchange is small, allowing the achievement of a hot-ion H-mode.
The different flows of heat with low and high electron temperature are illustrated in
Figure11.7. The experimental behaviour is shown in Figure 11.8 which gives the time dependence
of the electron and ion temperatures in a hot-ion plasma. These plasmas can have very good
confinement. They undergo a transition to the H-mode and have confinement times up to four
times the value predicted by GoldstonÕs L-mode formula (11.5) for the same conditions. Since it
is the ion temperature which determines the thermonuclear reaction rate these plasmas are
particularly successful in achieving a high neutron production. As a consequence this type of
plasma was used when JET carried out the worldÕs first deuterium-tritium tokamak experiments,
as described in Chapter 14.
The second type of successful plasma is obtained with the injection of deuterium pellets
into the plasma, as described in Chapter 8. This leads to a Pellet Enhanced Performance , or
PEP, mode of operation. The solid deuterium pellets are produced by freezing deuterium to a
temperature of 10K, and slicing off segments of a few millimetres. As the pellets cross the
Low Te
Beam power
Ions ElectronsHeat
transfer
High Te
Beam power
Ions ElectronsJG00.47/6c
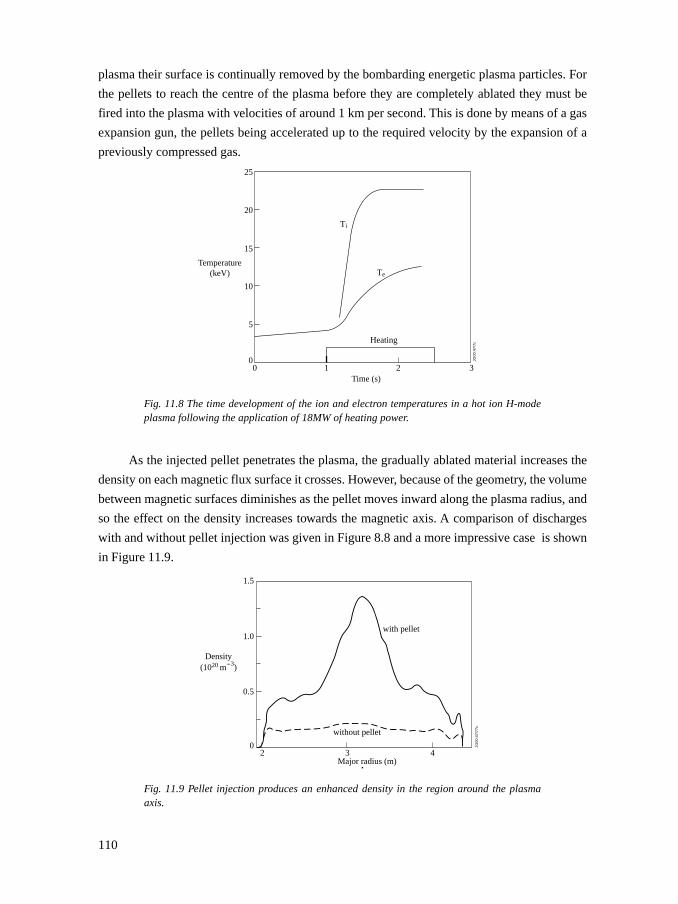
110
plasma their surface is continually removed by the bombarding energetic plasma particles. For
the pellets to reach the centre of the plasma before they are completely ablated they must be
fired into the plasma with velocities of around 1 km per second. This is done by means of a gas
expansion gun, the pellets being accelerated up to the required velocity by the expansion of a
previously compressed gas.
Fig. 11.8 The time development of the ion and electron temperatures in a hot ion H-modeplasma following the application of 18MW of heating power.
As the injected pellet penetrates the plasma, the gradually ablated material increases the
density on each magnetic flux surface it crosses. However, because of the geometry, the volume
between magnetic surfaces diminishes as the pellet moves inward along the plasma radius, and
so the effect on the density increases towards the magnetic axis. A comparison of discharges
with and without pellet injection was given in Figure 8.8 and a more impressive case is shown
in Figure 11.9.
Fig. 11.9 Pellet injection produces an enhanced density in the region around the plasmaaxis.
25
20
15
10
Temperature(keV)
5
00 1 2
Time (s)3
JG00
.47/
7c
Heating
Te
Ti
Density(1020 m-3)
02
Major radius (m)
JG00
.47/
77c
0.5
1.0with pellet
without pellet
1.5
3 4
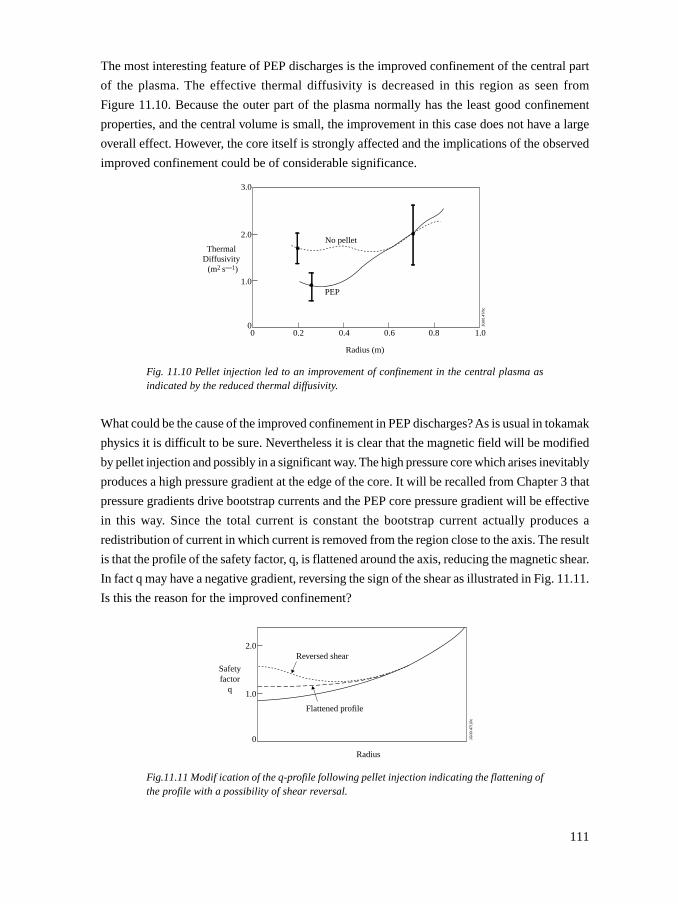
111
The most interesting feature of PEP discharges is the improved confinement of the central part
of the plasma. The effective thermal diffusivity is decreased in this region as seen from
Figure 11.10. Because the outer part of the plasma normally has the least good confinement
properties, and the central volume is small, the improvement in this case does not have a large
overall effect. However, the core itself is strongly affected and the implications of the observed
improved confinement could be of considerable significance.
Fig. 11.10 Pellet injection led to an improvement of confinement in the central plasma asindicated by the reduced thermal diffusivity.
What could be the cause of the improved confinement in PEP discharges? As is usual in tokamak
physics it is difficult to be sure. Nevertheless it is clear that the magnetic field will be modified
by pellet injection and possibly in a significant way. The high pressure core which arises inevitably
produces a high pressure gradient at the edge of the core. It will be recalled from Chapter 3 that
pressure gradients drive bootstrap currents and the PEP core pressure gradient will be effective
in this way. Since the total current is constant the bootstrap current actually produces a
redistribution of current in which current is removed from the region close to the axis. The result
is that the profile of the safety factor, q, is flattened around the axis, reducing the magnetic shear.
In fact q may have a negative gradient, reversing the sign of the shear as illustrated in Fig. 11.11.
Is this the reason for the improved confinement?
Fig.11.11 Modif ication of the q-profile following pellet injection indicating the flattening ofthe profile with a possibility of shear reversal.
2.0
1.0
Safetyfactor
q
0
Radius
JG00
.47/
10c
Reversed shear
Flattened profile
2.0
3.0
1.0
ThermalDiffusivity
(m2 s—1)
00 0.2 0.4 0.6 0.8 1.0
Radius (m)
JG00
.47/
9c
PEP
No pellet
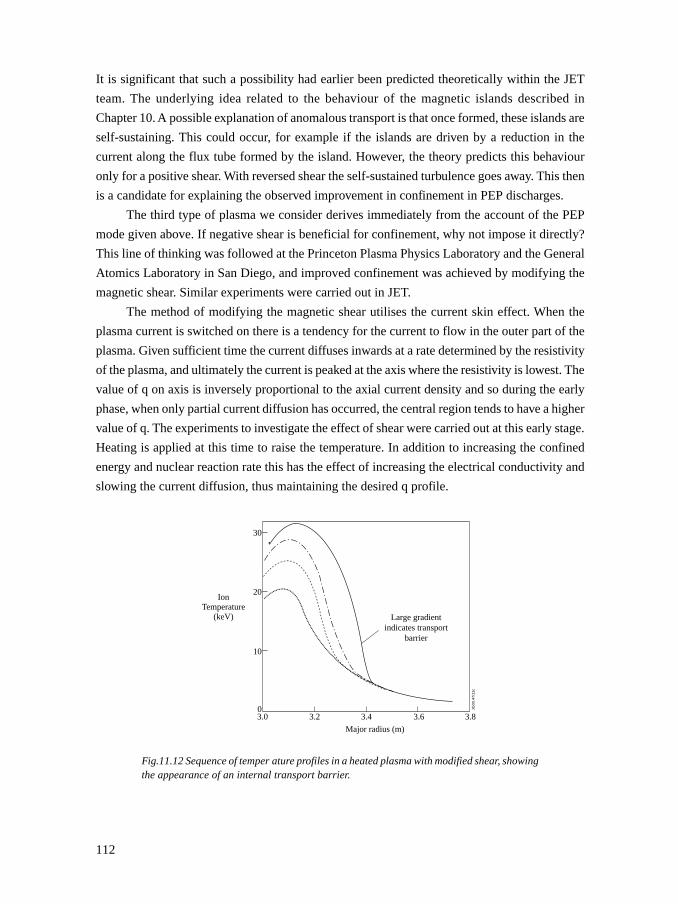
112
It is significant that such a possibility had earlier been predicted theoretically within the JET
team. The underlying idea related to the behaviour of the magnetic islands described in
Chapter 10. A possible explanation of anomalous transport is that once formed, these islands are
self-sustaining. This could occur, for example if the islands are driven by a reduction in the
current along the flux tube formed by the island. However, the theory predicts this behaviour
only for a positive shear. With reversed shear the self-sustained turbulence goes away. This then
is a candidate for explaining the observed improvement in confinement in PEP discharges.
The third type of plasma we consider derives immediately from the account of the PEP
mode given above. If negative shear is beneficial for confinement, why not impose it directly?
This line of thinking was followed at the Princeton Plasma Physics Laboratory and the General
Atomics Laboratory in San Diego, and improved confinement was achieved by modifying the
magnetic shear. Similar experiments were carried out in JET.
The method of modifying the magnetic shear utilises the current skin effect. When the
plasma current is switched on there is a tendency for the current to flow in the outer part of the
plasma. Given sufficient time the current diffuses inwards at a rate determined by the resistivity
of the plasma, and ultimately the current is peaked at the axis where the resistivity is lowest. The
value of q on axis is inversely proportional to the axial current density and so during the early
phase, when only partial current diffusion has occurred, the central region tends to have a higher
value of q. The experiments to investigate the effect of shear were carried out at this early stage.
Heating is applied at this time to raise the temperature. In addition to increasing the confined
energy and nuclear reaction rate this has the effect of increasing the electrical conductivity and
slowing the current diffusion, thus maintaining the desired q profile.
Fig.11.12 Sequence of temper ature profiles in a heated plasma with modified shear, showingthe appearance of an internal transport barrier.
20
30
10
IonTemperature
(keV)
03.0 3.2 3.4 3.6 3.8
Major radius (m)
JG00
.47/
11c
Large gradientindicates transport
barrier
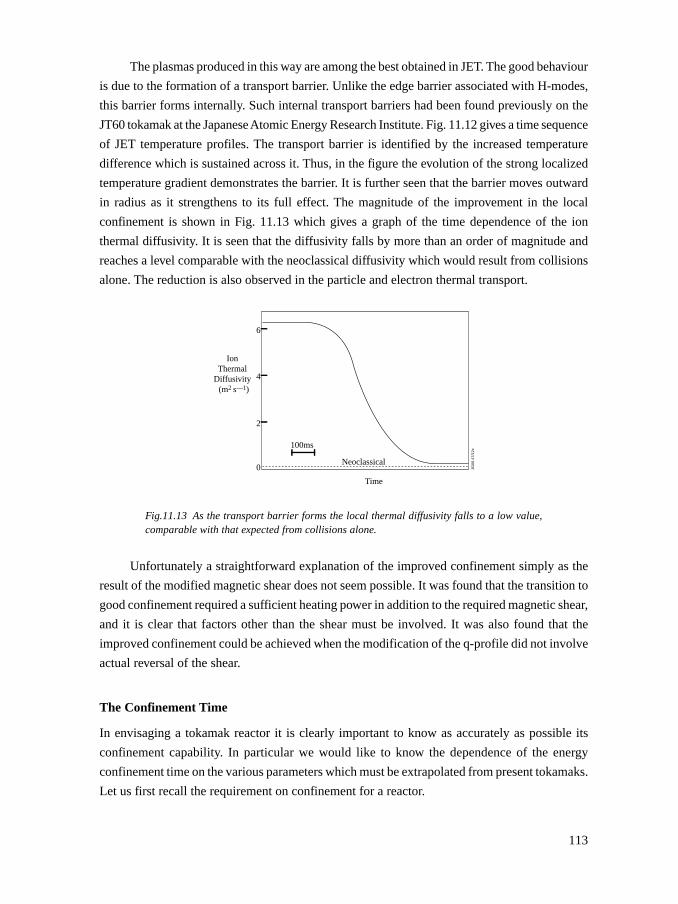
113
The plasmas produced in this way are among the best obtained in JET. The good behaviour
is due to the formation of a transport barrier. Unlike the edge barrier associated with H-modes,
this barrier forms internally. Such internal transport barriers had been found previously on the
JT60 tokamak at the Japanese Atomic Energy Research Institute. Fig. 11.12 gives a time sequence
of JET temperature profiles. The transport barrier is identified by the increased temperature
difference which is sustained across it. Thus, in the figure the evolution of the strong localized
temperature gradient demonstrates the barrier. It is further seen that the barrier moves outward
in radius as it strengthens to its full effect. The magnitude of the improvement in the local
confinement is shown in Fig. 11.13 which gives a graph of the time dependence of the ion
thermal diffusivity. It is seen that the diffusivity falls by more than an order of magnitude and
reaches a level comparable with the neoclassical diffusivity which would result from collisions
alone. The reduction is also observed in the particle and electron thermal transport.
Fig.11.13 As the transport barrier forms the local thermal diffusivity falls to a low value,comparable with that expected from collisions alone.
Unfortunately a straightforward explanation of the improved confinement simply as the
result of the modified magnetic shear does not seem possible. It was found that the transition to
good confinement required a sufficient heating power in addition to the required magnetic shear,
and it is clear that factors other than the shear must be involved. It was also found that the
improved confinement could be achieved when the modification of the q-profile did not involve
actual reversal of the shear.
The Confinement Time
In envisaging a tokamak reactor it is clearly important to know as accurately as possible its
confinement capability. In particular we would like to know the dependence of the energy
confinement time on the various parameters which must be extrapolated from present tokamaks.
Let us first recall the requirement on confinement for a reactor.
4
6
2
IonThermal
Diffusivity(m2 s—1)
0
100ms
Neoclassical
TimeJG
00.4
7/12
c
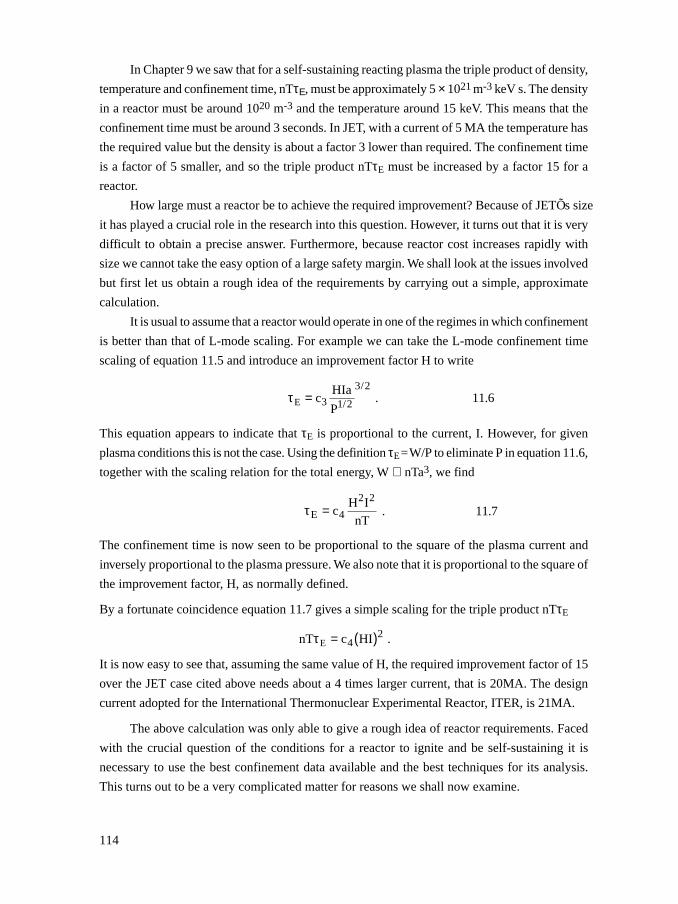
114
In Chapter 9 we saw that for a self-sustaining reacting plasma the triple product of density,
temperature and confinement time, nTτΕ, must be approximately 5 × 10²¹ m-3 keV s. The density
in a reactor must be around 1020 m-3 and the temperature around 15 keV. This means that the
confinement time must be around 3 seconds. In JET, with a current of 5 MA the temperature has
the required value but the density is about a factor 3 lower than required. The confinement time
is a factor of 5 smaller, and so the triple product nTτE must be increased by a factor 15 for a
reactor.
How large must a reactor be to achieve the required improvement? Because of JETÕs size
it has played a crucial role in the research into this question. However, it turns out that it is very
difficult to obtain a precise answer. Furthermore, because reactor cost increases rapidly with
size we cannot take the easy option of a large safety margin. We shall look at the issues involved
but first let us obtain a rough idea of the requirements by carrying out a simple, approximate
calculation.
It is usual to assume that a reactor would operate in one of the regimes in which confinement
is better than that of L-mode scaling. For example we can take the L-mode confinement time
scaling of equation 11.5 and introduce an improvement factor H to write
τE = c3HIa
P1/2
3/2 . 11.6
This equation appears to indicate that τE is proportional to the current, I. However, for given
plasma conditions this is not the case. Using the definition τE = W/P to eliminate P in equation 11.6,
together with the scaling relation for the total energy, W ∝ nTa3, we find
τE = c4H2I2
nT . 11.7
The confinement time is now seen to be proportional to the square of the plasma current and
inversely proportional to the plasma pressure. We also note that it is proportional to the square of
the improvement factor, H, as normally defined.
By a fortunate coincidence equation 11.7 gives a simple scaling for the triple product nTτE
nTτE = c4 HI( )2 .
It is now easy to see that, assuming the same value of H, the required improvement factor of 15
over the JET case cited above needs about a 4 times larger current, that is 20MA. The design
current adopted for the International Thermonuclear Experimental Reactor, ITER, is 21MA.
The above calculation was only able to give a rough idea of reactor requirements. Faced
with the crucial question of the conditions for a reactor to ignite and be self-sustaining it is
necessary to use the best confinement data available and the best techniques for its analysis.
This turns out to be a very complicated matter for reasons we shall now examine.
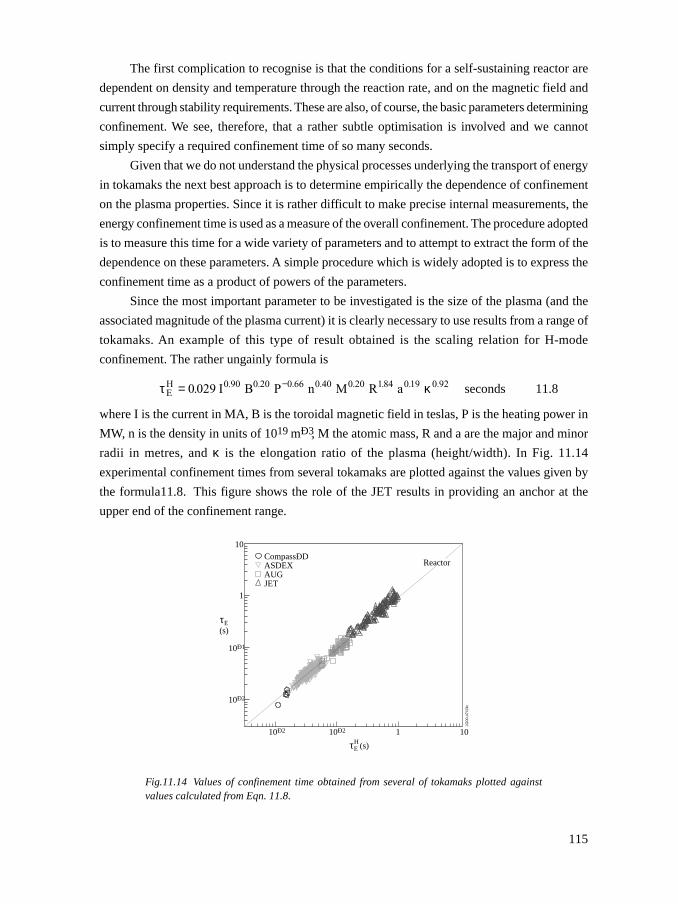
115
The first complication to recognise is that the conditions for a self-sustaining reactor are
dependent on density and temperature through the reaction rate, and on the magnetic field and
current through stability requirements. These are also, of course, the basic parameters determining
confinement. We see, therefore, that a rather subtle optimisation is involved and we cannot
simply specify a required confinement time of so many seconds.
Given that we do not understand the physical processes underlying the transport of energy
in tokamaks the next best approach is to determine empirically the dependence of confinement
on the plasma properties. Since it is rather difficult to make precise internal measurements, the
energy confinement time is used as a measure of the overall confinement. The procedure adopted
is to measure this time for a wide variety of parameters and to attempt to extract the form of the
dependence on these parameters. A simple procedure which is widely adopted is to express the
confinement time as a product of powers of the parameters.
Since the most important parameter to be investigated is the size of the plasma (and the
associated magnitude of the plasma current) it is clearly necessary to use results from a range of
tokamaks. An example of this type of result obtained is the scaling relation for H-mode
confinement. The rather ungainly formula is
τ κEH I B P n M R a= −0 029 0 90 0 20 0 66 0 40 0 20 184 0 19 0 92. . . . . . . . . seconds 11.8
where I is the current in MA, B is the toroidal magnetic field in teslas, P is the heating power in
MW, n is the density in units of 1019 mÐ3, M the atomic mass, R and a are the major and minor
radii in metres, and κ is the elongation ratio of the plasma (height/width). In Fig. 11.14
experimental confinement times from several tokamaks are plotted against the values given by
the formula11.8. This figure shows the role of the JET results in providing an anchor at the
upper end of the confinement range.
Fig.11.14 Values of confinement time obtained from several of tokamaks plotted againstvalues calculated from Eqn. 11.8.
10
1
10Ð1
10Ð2
10Ð2 10Ð2 1 10
τE(s)
τEH
JG00
.47/
13c
CompassÐDASDEXAUGJETITER
Reactor
(s)
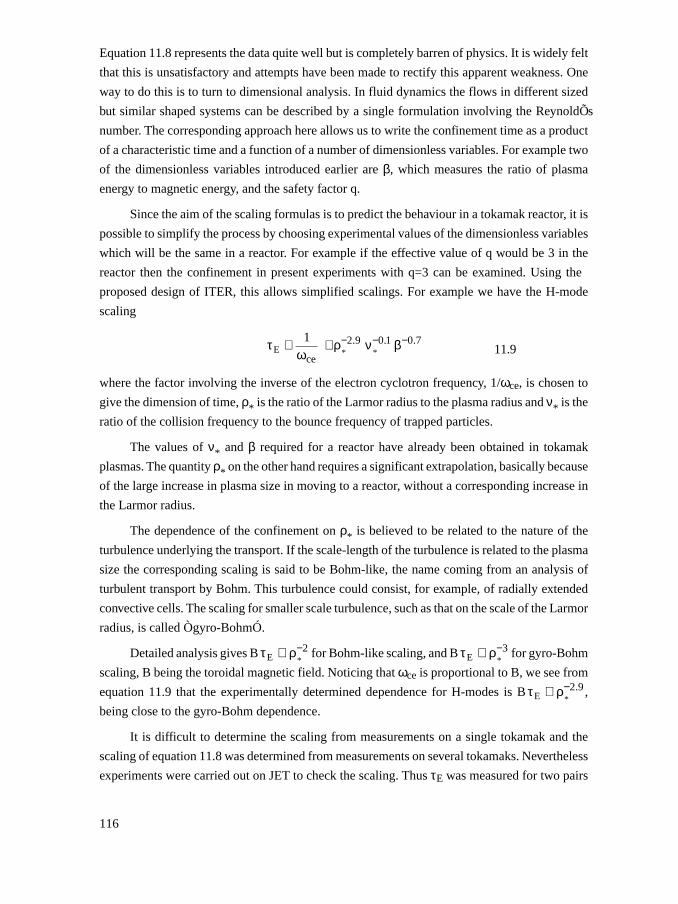
116
Equation 11.8 represents the data quite well but is completely barren of physics. It is widely felt
that this is unsatisfactory and attempts have been made to rectify this apparent weakness. One
way to do this is to turn to dimensional analysis. In fluid dynamics the flows in different sized
but similar shaped systems can be described by a single formulation involving the ReynoldÕs
number. The corresponding approach here allows us to write the confinement time as a product
of a characteristic time and a function of a number of dimensionless variables. For example two
of the dimensionless variables introduced earlier are β, which measures the ratio of plasma
energy to magnetic energy, and the safety factor q.
Since the aim of the scaling formulas is to predict the behaviour in a tokamak reactor, it is
possible to simplify the process by choosing experimental values of the dimensionless variables
which will be the same in a reactor. For example if the effective value of q would be 3 in the
reactor then the confinement in present experiments with q=3 can be examined. Using the
proposed design of ITER, this allows simplified scalings. For example we have the H-mode
scaling
τE ∝ 1ωce
⋅ ρ*−2.9 ν
*−0.1 β−0.7
11.9
where the factor involving the inverse of the electron cyclotron frequency, 1/ωce, is chosen to
give the dimension of time, ρ* is the ratio of the Larmor radius to the plasma radius and ν* is the
ratio of the collision frequency to the bounce frequency of trapped particles.
The values of ν* and β required for a reactor have already been obtained in tokamak
plasmas. The quantity ρ* on the other hand requires a significant extrapolation, basically because
of the large increase in plasma size in moving to a reactor, without a corresponding increase in
the Larmor radius.
The dependence of the confinement on ρ* is believed to be related to the nature of the
turbulence underlying the transport. If the scale-length of the turbulence is related to the plasma
size the corresponding scaling is said to be Bohm-like, the name coming from an analysis of
turbulent transport by Bohm. This turbulence could consist, for example, of radially extended
convective cells. The scaling for smaller scale turbulence, such as that on the scale of the Larmor
radius, is called Ògyro-BohmÓ.
Detailed analysis gives B τE ∝ ρ*−2 for Bohm-like scaling, and B τE ∝ ρ
*−3 for gyro-Bohm
scaling, B being the toroidal magnetic field. Noticing that ωce is proportional to B, we see from
equation 11.9 that the experimentally determined dependence for H-modes is B τE ∝ ρ*−2.9 ,
being close to the gyro-Bohm dependence.
It is difficult to determine the scaling from measurements on a single tokamak and the
scaling of equation 11.8 was determined from measurements on several tokamaks. Nevertheless
experiments were carried out on JET to check the scaling. Thus τE was measured for two pairs
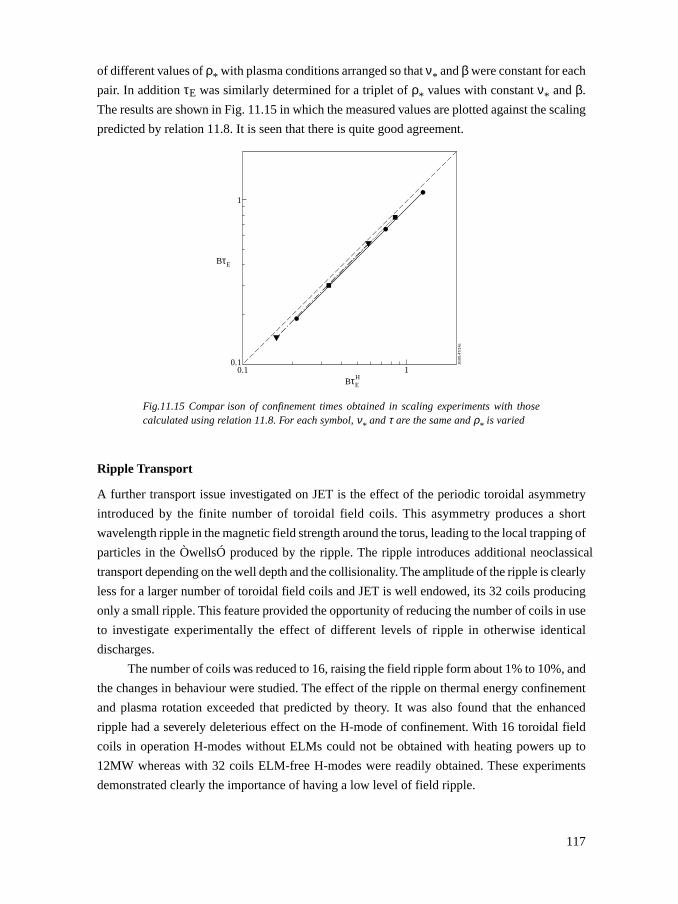
117
of different values of ρ* with plasma conditions arranged so that ν* and β were constant for each
pair. In addition τE was similarly determined for a triplet of ρ* values with constant ν* and β.
The results are shown in Fig. 11.15 in which the measured values are plotted against the scaling
predicted by relation 11.8. It is seen that there is quite good agreement.
Fig.11.15 Compar ison of confinement times obtained in scaling experiments with thosecalculated using relation 11.8. For each symbol, ν* and τ are the same and ρ* is varied
Ripple Transport
A further transport issue investigated on JET is the effect of the periodic toroidal asymmetry
introduced by the finite number of toroidal field coils. This asymmetry produces a short
wavelength ripple in the magnetic field strength around the torus, leading to the local trapping of
particles in the ÒwellsÓ produced by the ripple. The ripple introduces additional neoclassical
transport depending on the well depth and the collisionality. The amplitude of the ripple is clearly
less for a larger number of toroidal field coils and JET is well endowed, its 32 coils producing
only a small ripple. This feature provided the opportunity of reducing the number of coils in use
to investigate experimentally the effect of different levels of ripple in otherwise identical
discharges.
The number of coils was reduced to 16, raising the field ripple form about 1% to 10%, and
the changes in behaviour were studied. The effect of the ripple on thermal energy confinement
and plasma rotation exceeded that predicted by theory. It was also found that the enhanced
ripple had a severely deleterious effect on the H-mode of confinement. With 16 toroidal field
coils in operation H-modes without ELMs could not be obtained with heating powers up to
12MW whereas with 32 coils ELM-free H-modes were readily obtained. These experiments
demonstrated clearly the importance of having a low level of field ripple.
0.1
1
0.1 1BτE
JG00
.47/
14c
BτE
H
118
Anomalies
Under steady operating conditions we would expect the confinement time to depend on the
gross operating parameters. The transport within the plasma would be determined by the internal
conditions such as density and temperature profiles, and these would themselves be determined
by the operating conditions. It is this belief which gives credence to the attempts to determine
the confinement time scaling. There are however experimental results which give cause for
uncertainty and which are certainly puzzling.
Figure 11.16 shows the change of plasma energy with time in a discharge with neutral
beam heating. On a simple model the energy would be expected to rise to a ÒsaturationÓ value at
which the energy loss rate from the plasma balances the power input. It is seen that there is little
or no sign of approaching saturation. In fact, contrary to expectation, the confinement improves
as the plasma energy increases. This behaviour is brought to an abrupt halt by instabilities. In
this discharge the instabilities are a sawtooth collapse and an edge localised mode, both of
which are discussed in Chapter 10. However these instabilities are short-lived transients and
cannot explain the subsequent rapid fall in plasma energy. The lack of understanding of the
sudden change in behaviour has led to its being called the X-event. The global plasma parameters
immediately before and immediately after the X-event are the same and yet the confinement
time is reduced by a factor 3.
Fig.11.16 Time dependence of the plasma energy in a heated plasma showing abrupt changesin confinement.
Perhaps even more surprising is the behaviour at the later time when the heating is switched off.
Without the heating to offset the heat losses the fall in plasma energy should be much more
rapid. It is seen, however, that the rate of fall hardly changes. To explain this result in terms of
the energy confinement time would require an abrupt improvement in the confinement time by
a factor 3 at the time of switch-off without any change in the global plasma properties.
These results are bound to raise questions regarding the scaling of the confinement time.
However the above anomalies occur in non-steady state conditions whereas confinement scaling
is generally carried out using steady state results, and so should therefore be reliable.
0 1 2Time (s)
0
5
10
15
Heating
X-event
Switchoff
Plasmaenergy
W(MJ)
JG00
.47/
15c
119
Overview of Confinement
When JET was being designed in the early 1970s tokamak discharges typically lasted less than
a second and good confinement times were measured in tens of milliseconds. With the operation
of JET it became possible to follow the behaviour of the plasma in real time with discharges
lasting up to a minute. The best confinement times in JET are greater than a second, approaching
to within a factor of two the value required in a reactor.
In designing JET the question of confinement was clearly a key issue. Then, as now, there
was no accepted theory of transport although it was, erroneously, thought that the confinement
of the energy of the ions might be classical. There was so little experience of the confinement of
plasmas with additional heating that the available empirical scaling was virtually useless as a
predictive tool. One of the principal purposes of JET, of course, was to resolve these issues.
The best predictive procedure is still to use empirical scaling, and in this JET has played
an important role, mainly because of its large size and high current. Even empirical scaling has
become highly complex with different types of discharge and different modes of confinement.
There are still unresolved issues but it is now possible to make scientific projections to a reactor
and the research is now dedicated to reducing the band of uncertainty.
Bibliography
The achievement of H-mode confinement in JET was described in
Tanga, A., et al. Magnetic separatrix experiments in JET. Nuclear Fusion 27, 1877 (1987).
The pellet enhanced performance discharges, PEPs, are reported in
Tubbing, B.J.D., et al. H-mode confinement in JET with enhanced performance by pellet peaked
density profiles. Nuclear Fusion 31, 839 (1991),
and further in
Hugon, M., van Milligan, B.Ph., Smeulders, P., et al. Shear reversal and MHD activity during
pellet enhanced performance pulses in JET, Nuclear Fusion 32, 33 (1992).
RebutÕs model of self-sustained turbulence was described in
Rebut, P.-H. and Hugon, M. Magnetic turbulence self-sustainment by finite Larmor radius effect,
Plasma Physics and Controlled Fusion 33, 1085 (1991).
JETÕs contribution to the confinement scaling is brought out in a paper written by the ITER
Confinement and Database and Modelling Working Group, presented by
Cordey, J.G. Energy confinement scaling and the extrapolation to ITER. Plasma Physics and
Controlled Fusion 39, B115 (1997).
120
Impurity transport in ohmic and L-mode plasmas was analysed in
Pasini, D., Mattioli, M., Edwards, A.W., Giannella, R., Gill, R.D., Hawkes, N.C., Magyar, G.,
Saoutic, B., Wang, Z., and Zasche, D. Impurity transport in JET using laser injected impurities
in ohmic and radio-frequency heated plasmas. Nuclear Fusion 30, 2049 (1990), and extended to
include H-mode in
Pasini, D., Giannella, R., Lauro Taroni, L., Mattioli, M., Denne-Hinnov, B., Hawkes, N., Magyar,
G., and Weisen, H. Measurements of impurity transport in JET. Plasma Physics and Controlled
Fusion 34, 677 (1992).
The behaviour of the JET temperature profiles with plasma heating, and the nature of the heat
transport was investigated by
Callen, J.D., Christiansen, J.P., Cordey, J.G., Thomas, P.R., and Thomsen, K. Modelling of
temperature profiles and transport scaling in auxiliary heated tokamaks. Nuclear Fusion 27,
1857 (1987), and
Balet, B., Cordey, J.G., Muir, D.G., and Schmidt, G.L. Heat transport with off-axis heating.
Nuclear Fusion 32, 1261 (1992),
and the ion mass dependence of the transport was shown to be weak in
Tibone, et al. Dependence of L-mode confinement on plasma ion species in JET. Nuclear Fusion
33, 1319 (1993).
The surprising change in the electron thermal conductivity on a millisecond timescale over most
of the plasma in L-H-L mode transitions was recognised by Neudatchin and reported in
Neudatchin, S.V., Cordey, J.G., and Muir, D.G., Sawteeth induced pulse propagation and the
time behaviour of electron conductivity during L-H-L transitions in JET. Proc. 20th Eur. Conf.
on Controlled Fusion and Plasma Physics, Lisbon ,1993, Vol. 1, p83,
and numerical simulations were presented by
Cordey, J.G., Muir, D.F., Neudatchin, S.V., Parail, V.V., Springmann, E., and Taroni, A.
Anumerical simulation of the L-H transition in JET with local and global models. Nuclear
Fusion 35, 1001 (1995).
The study was extended to include other transients in
Parail, V.V., et al. Transport analysis of transient plasmas in JET. Nuclear Fusion 37, 481 (1997).
The determination of the thermal diffusivity from sawtooth heat pulses in JET was first described
by
121
Tubbing, B.J.D., Lopes Cardoso, N.J., and van der Wiel, M.J. Tokamak heat transport - a study
of heat pulse propagation in JET. Nuclear Fusion 27, 1843 (1987),
and a more complete account is given in
Lopes Cordozo, J.J., de Hass, J.C.M., Hogeweij, G.M.D., OÕRourke, J., Sips, A.C.C., and Tubbing,
B.J.D. Tokamak transport studies using perturbation analysis. Plasma Physics and Controlled
Fusion 32, 983 (1990).
An analysis of the edge transport barrier is given in
Breger, P., Flewin, C., Zastrow, K.D., Davies, S.J., Hawkes, N.C., Kšnig, R.W.T., Pietrzyk,
Z.A., Porte, L., Summers, D.D.R., and von Hellermann, M.G. Plasma-edge gradients in L-mode
and ELM-free H-mode JET Plasmas. Plasma Physics and Controlled Fusion 40,347(1998).
An exploration of the application of theory to the transport in JET is made in
Strand, P., Nordman, H., Weiland, J., and Christiansen, J.P. Predictive transport simulations of
JET L and H mode gyro-radius scaling experiments. Nuclear Fusion 38, 545 (1998).
The subjects of transport barriers and optimised shear are dealt with in the following papers
Parail, V.V., Guo, H.Y., and Lingertat, J. Fast particles and the edge transport barrier.Nuclear
Fusion 39, 369 (1999).
Sips, A.C.C., et al. Operation in high performance in optimised shear plasmas. Plasma Physics
and Controlled Fusion, 40, 1171 (1998).
Cottrell, G.A. et al. Transport in JET deuterium plasmas with optimised shear. Plasma Physics
and Controlled Fusion 40, 1251 (1998).
The role of ELMs in energy confinement is discussed in
Fishpool, G.M. Loss of confinement due to reduction of the edge pedestal in JET. Nuclear Fusion
38, 1373 (1998), and
Zhang, W., Tubbing, B.J.D., and Ward, D.J. The effect of ELMs on energy confinement in JET.
Plasma Physics and Controlled Fusion 40, 335 (1998).
The transport behaviour following the X-event is described in
Wesson, J.A. and Balet, B., Abrupt changes in confinement in the JET Tokamak. Physical Review
Letters 77, 5214 (1996).

122
123
12. HANDLING THE POWER
The ultimate purpose of tokamaks is to produce power. Over several decades most of the research
effort has been concentrated on achieving the plasma conditions necessary to yield this power. It
is only in later years that the handling of the power has received its proper attention.
It has been recognised since the earliest days that, although the magnetic field prevents the
hot plasma streaming directly to the surrounding material surfaces, the heat produced in the
plasma will ultimately fall onto such surfaces. In JET this means tens of megawatts of power,
and in a reactor hundreds of megawatts. The surfaces must retain their integrity and must absorb
the heat load without undue damage or erosion, and without the release of impurities to
contaminate the plasma.
In the case of a reactor the problem is ameliorated by the fact that four fifths of the
thermonuclear power is produced in the form of energetic neutrons which pass through the
vacuum vessel to be absorbed by the tokamak blanket. The remaining one fifth of the power
comes from the α-particles produced in the nuclear reactions. These particles, being charged,
are retained in the plasma by the magnetic field. They serve the purpose of heating the plasma
and sustaining the burn conditions, but the heat they produce will leave the plasma and be
loaded onto material surfaces.
It might be thought that the heat from the plasma could be distributed over the large
surrounding material surface area by thermal conduction. Unfortunately this is much more difficult
than might appear. The problem arises from a fundamental piece of plasma physics - the very
large ratio of the thermal conductivities, parallel and perpendicular to the magnetic field. For a
plasma edge temperature of 1k eV this ratio is around 1010. The result is that as the heat is
conducted out across the magnetic field, its first contact with a solid surface at some location
allows a rapid conduction parallel to the magnetic field to that part of the surface, with the
associated localised heating. The precision required to match the magnetic field surfaces to the
material surfaces, and to maintain this relation, seems impossible.
The JET vacuum vessel has a surface area of 200m2 and a reactor would have an area
around ten times larger. If the heat produced in the plasma were uniformly distributed over the
surface the heat load would, in both cases, be less than a megawatt per square metre and would
pose no problem. The heat could be distributed in a more or less uniform way if it could be
released from the plasma in the form of electromagnetic radiation, and furthermore we can
actually envisage such a scheme. If it were arranged that there were sufficient impurity atoms in
the cool edge of the plasma, the plasma electrons could release their energy in exciting these
atoms. This energy would then be emitted as radiation in the spectral lines of the atoms as they
fell back into lower energy states. The problem is that the impurities are unwelcome. Firstly they
contaminate the plasma and secondly, as described in Chapter 7, they are liable to cause the
plasma to disrupt.
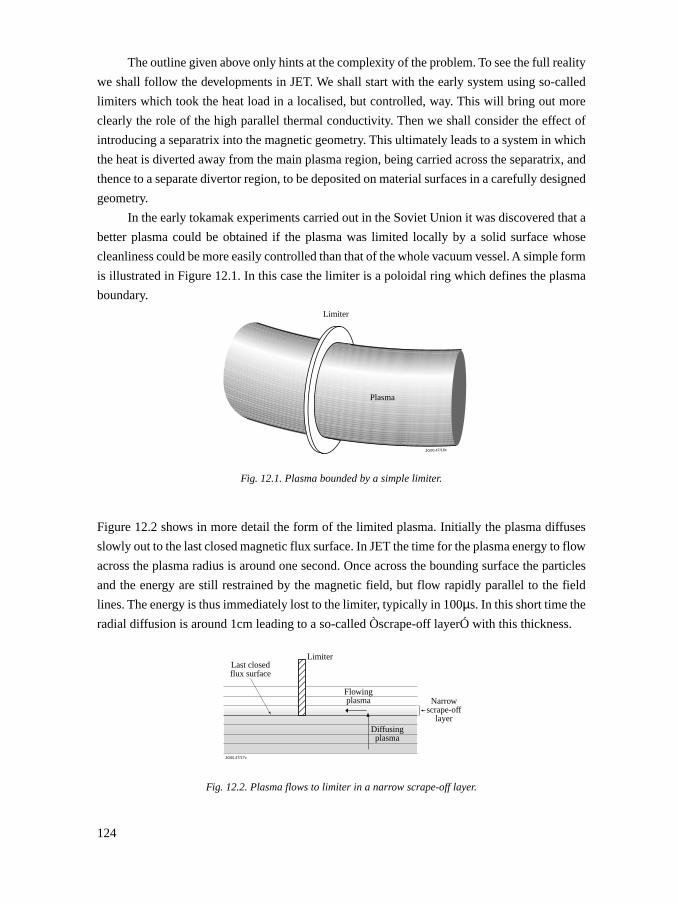
124
The outline given above only hints at the complexity of the problem. To see the full reality
we shall follow the developments in JET. We shall start with the early system using so-called
limiters which took the heat load in a localised, but controlled, way. This will bring out more
clearly the role of the high parallel thermal conductivity. Then we shall consider the effect of
introducing a separatrix into the magnetic geometry. This ultimately leads to a system in which
the heat is diverted away from the main plasma region, being carried across the separatrix, and
thence to a separate divertor region, to be deposited on material surfaces in a carefully designed
geometry.
In the early tokamak experiments carried out in the Soviet Union it was discovered that a
better plasma could be obtained if the plasma was limited locally by a solid surface whose
cleanliness could be more easily controlled than that of the whole vacuum vessel. A simple form
is illustrated in Figure 12.1. In this case the limiter is a poloidal ring which defines the plasma
boundary.
Fig. 12.1. Plasma bounded by a simple limiter.
Figure 12.2 shows in more detail the form of the limited plasma. Initially the plasma diffuses
slowly out to the last closed magnetic flux surface. In JET the time for the plasma energy to flow
across the plasma radius is around one second. Once across the bounding surface the particles
and the energy are still restrained by the magnetic field, but flow rapidly parallel to the field
lines. The energy is thus immediately lost to the limiter, typically in 100µs. In this short time the
radial diffusion is around 1cm leading to a so-called Òscrape-off layerÓ with this thickness.
Fig. 12.2. Plasma flows to limiter in a narrow scrape-off layer.
Plasma
Limiter
JG00.47/16c
Last closedflux surface
Limiter
Flowingplasma
Diffusingplasma
Narrowscrape-off
layer
JG00.47/17c
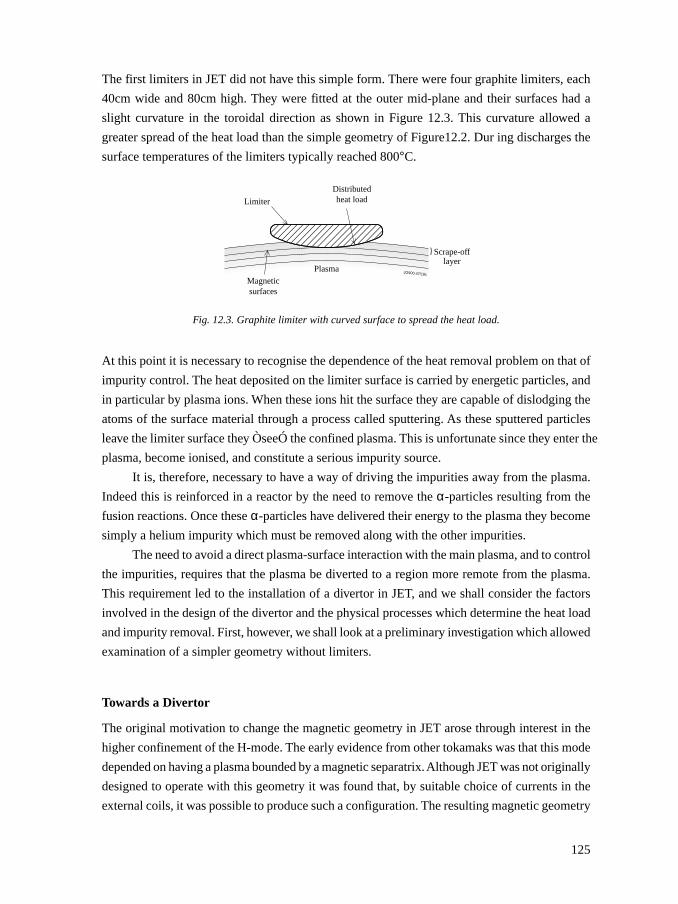
125
The first limiters in JET did not have this simple form. There were four graphite limiters, each
40cm wide and 80cm high. They were fitted at the outer mid-plane and their surfaces had a
slight curvature in the toroidal direction as shown in Figure 12.3. This curvature allowed a
greater spread of the heat load than the simple geometry of Figure12.2. Dur ing discharges the
surface temperatures of the limiters typically reached 800°C.
Fig. 12.3. Graphite limiter with curved surface to spread the heat load.
At this point it is necessary to recognise the dependence of the heat removal problem on that of
impurity control. The heat deposited on the limiter surface is carried by energetic particles, and
in particular by plasma ions. When these ions hit the surface they are capable of dislodging the
atoms of the surface material through a process called sputtering. As these sputtered particles
leave the limiter surface they ÒseeÓ the confined plasma. This is unfortunate since they enter the
plasma, become ionised, and constitute a serious impurity source.
It is, therefore, necessary to have a way of driving the impurities away from the plasma.
Indeed this is reinforced in a reactor by the need to remove the α-particles resulting from the
fusion reactions. Once these α-particles have delivered their energy to the plasma they become
simply a helium impurity which must be removed along with the other impurities.
The need to avoid a direct plasma-surface interaction with the main plasma, and to control
the impurities, requires that the plasma be diverted to a region more remote from the plasma.
This requirement led to the installation of a divertor in JET, and we shall consider the factors
involved in the design of the divertor and the physical processes which determine the heat load
and impurity removal. First, however, we shall look at a preliminary investigation which allowed
examination of a simpler geometry without limiters.
Towards a Divertor
The original motivation to change the magnetic geometry in JET arose through interest in the
higher confinement of the H-mode. The early evidence from other tokamaks was that this mode
depended on having a plasma bounded by a magnetic separatrix. Although JET was not originally
designed to operate with this geometry it was found that, by suitable choice of currents in the
external coils, it was possible to produce such a configuration. The resulting magnetic geometry
Limiter
Distributedheat load
Magneticsurfaces
Plasma JG900.47/18c
Scrape-offlayer
}
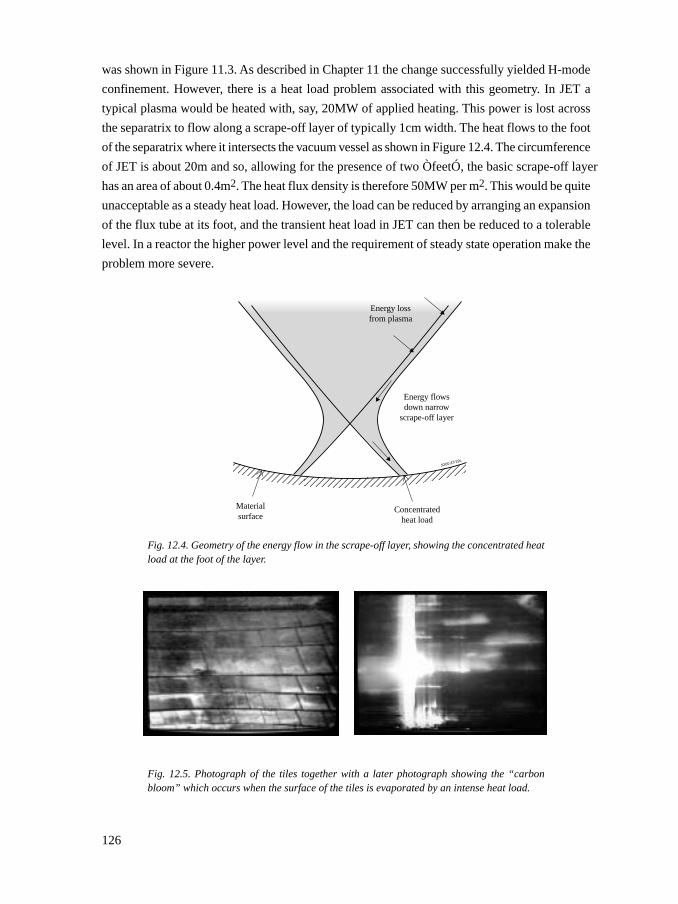
126
was shown in Figure 11.3. As described in Chapter 11 the change successfully yielded H-mode
confinement. However, there is a heat load problem associated with this geometry. In JET a
typical plasma would be heated with, say, 20MW of applied heating. This power is lost across
the separatrix to flow along a scrape-off layer of typically 1cm width. The heat flows to the foot
of the separatrix where it intersects the vacuum vessel as shown in Figure 12.4. The circumference
of JET is about 20m and so, allowing for the presence of two ÒfeetÓ, the basic scrape-off layer
has an area of about 0.4m2. The heat flux density is therefore 50MW per m2. This would be quite
unacceptable as a steady heat load. However, the load can be reduced by arranging an expansion
of the flux tube at its foot, and the transient heat load in JET can then be reduced to a tolerable
level. In a reactor the higher power level and the requirement of steady state operation make the
problem more severe.
Fig. 12.4. Geometry of the energy flow in the scrape-off layer, showing the concentrated heatload at the foot of the layer.
Fig. 12.5. Photograph of the tiles together with a later photograph showing the “carbonbloom” which occurs when the surface of the tiles is evaporated by an intense heat load.
Energy flowsdown narrow
scrape-off layer
Materialsurface
Concentratedheat load
JG00.47/19c
Energy lossfrom plasma
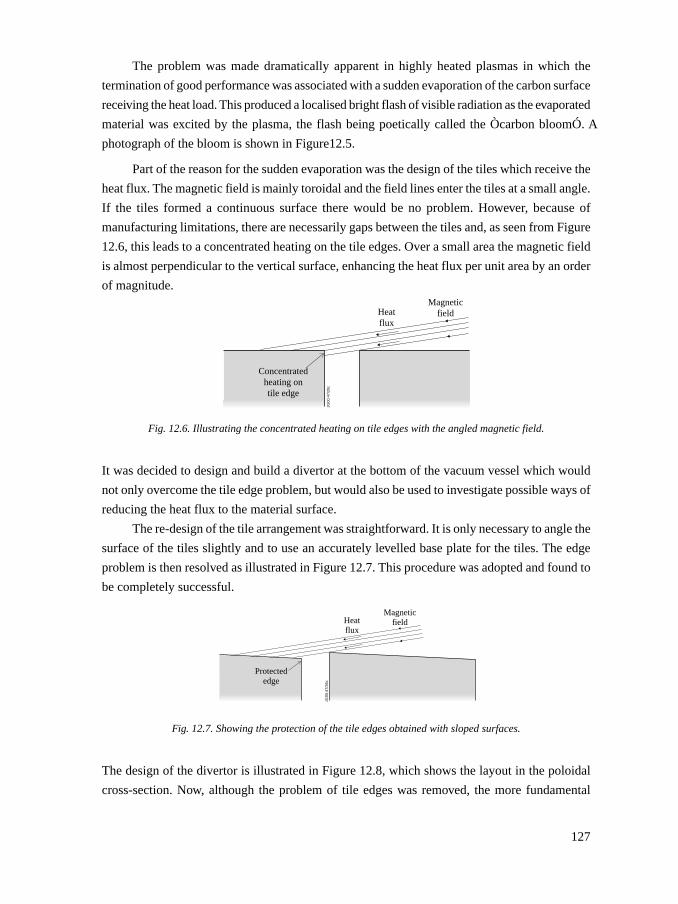
127
The problem was made dramatically apparent in highly heated plasmas in which the
termination of good performance was associated with a sudden evaporation of the carbon surface
receiving the heat load. This produced a localised bright flash of visible radiation as the evaporated
material was excited by the plasma, the flash being poetically called the Òcarbon bloomÓ. A
photograph of the bloom is shown in Figure12.5.
Part of the reason for the sudden evaporation was the design of the tiles which receive the
heat flux. The magnetic field is mainly toroidal and the field lines enter the tiles at a small angle.
If the tiles formed a continuous surface there would be no problem. However, because of
manufacturing limitations, there are necessarily gaps between the tiles and, as seen from Figure
12.6, this leads to a concentrated heating on the tile edges. Over a small area the magnetic field
is almost perpendicular to the vertical surface, enhancing the heat flux per unit area by an order
of magnitude.
Fig. 12.6. Illustrating the concentrated heating on tile edges with the angled magnetic field.
It was decided to design and build a divertor at the bottom of the vacuum vessel which would
not only overcome the tile edge problem, but would also be used to investigate possible ways of
reducing the heat flux to the material surface.
The re-design of the tile arrangement was straightforward. It is only necessary to angle the
surface of the tiles slightly and to use an accurately levelled base plate for the tiles. The edge
problem is then resolved as illustrated in Figure 12.7. This procedure was adopted and found to
be completely successful.
Fig. 12.7. Showing the protection of the tile edges obtained with sloped surfaces.
The design of the divertor is illustrated in Figure 12.8, which shows the layout in the poloidal
cross-section. Now, although the problem of tile edges was removed, the more fundamental
MagneticfieldHeat
flux
Concentratedheating ontile edge
JG00
.47/
20c
MagneticfieldHeat
flux
Protectededge
JG00
.47/
36c
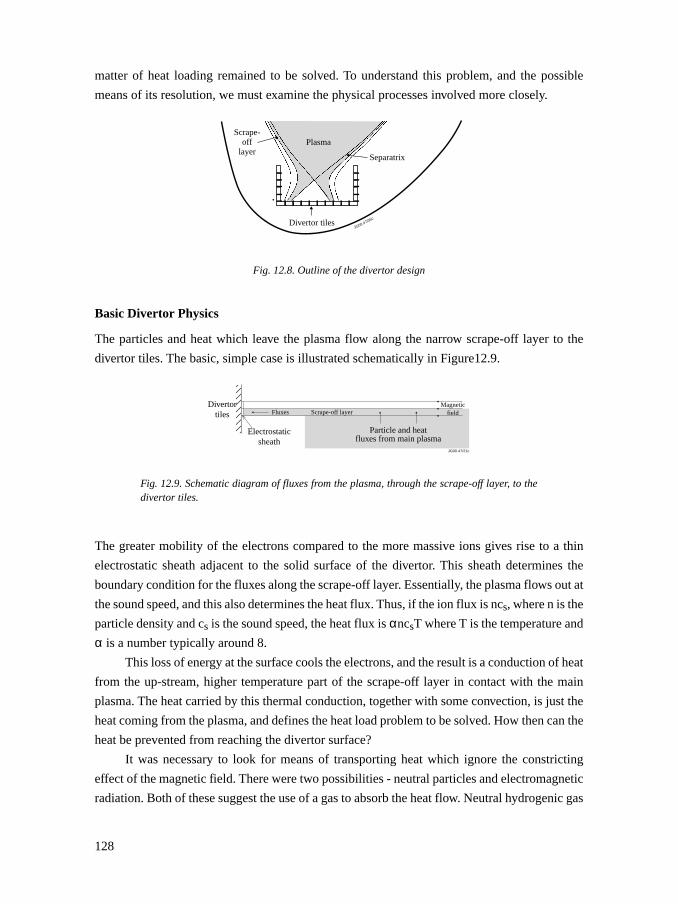
128
matter of heat loading remained to be solved. To understand this problem, and the possible
means of its resolution, we must examine the physical processes involved more closely.
Fig. 12.8. Outline of the divertor design
Basic Divertor Physics
The particles and heat which leave the plasma flow along the narrow scrape-off layer to the
divertor tiles. The basic, simple case is illustrated schematically in Figure12.9.
Fig. 12.9. Schematic diagram of fluxes from the plasma, through the scrape-off layer, to thedivertor tiles.
The greater mobility of the electrons compared to the more massive ions gives rise to a thin
electrostatic sheath adjacent to the solid surface of the divertor. This sheath determines the
boundary condition for the fluxes along the scrape-off layer. Essentially, the plasma flows out at
the sound speed, and this also determines the heat flux. Thus, if the ion flux is ncs, where n is the
particle density and cs is the sound speed, the heat flux is αncsT where T is the temperature and
α is a number typically around 8.
This loss of energy at the surface cools the electrons, and the result is a conduction of heat
from the up-stream, higher temperature part of the scrape-off layer in contact with the main
plasma. The heat carried by this thermal conduction, together with some convection, is just the
heat coming from the plasma, and defines the heat load problem to be solved. How then can the
heat be prevented from reaching the divertor surface?
It was necessary to look for means of transporting heat which ignore the constricting
effect of the magnetic field. There were two possibilities - neutral particles and electromagnetic
radiation. Both of these suggest the use of a gas to absorb the heat flow. Neutral hydrogenic gas
JG00.47/35cDivertor tiles
PlasmaScrape-
offlayer
Separatrix
Magneticfield
Divertortiles
JG00.47/21c
Fluxes Scrape-off layer
Particle and heatfluxes from main plasma
Electrostaticsheath
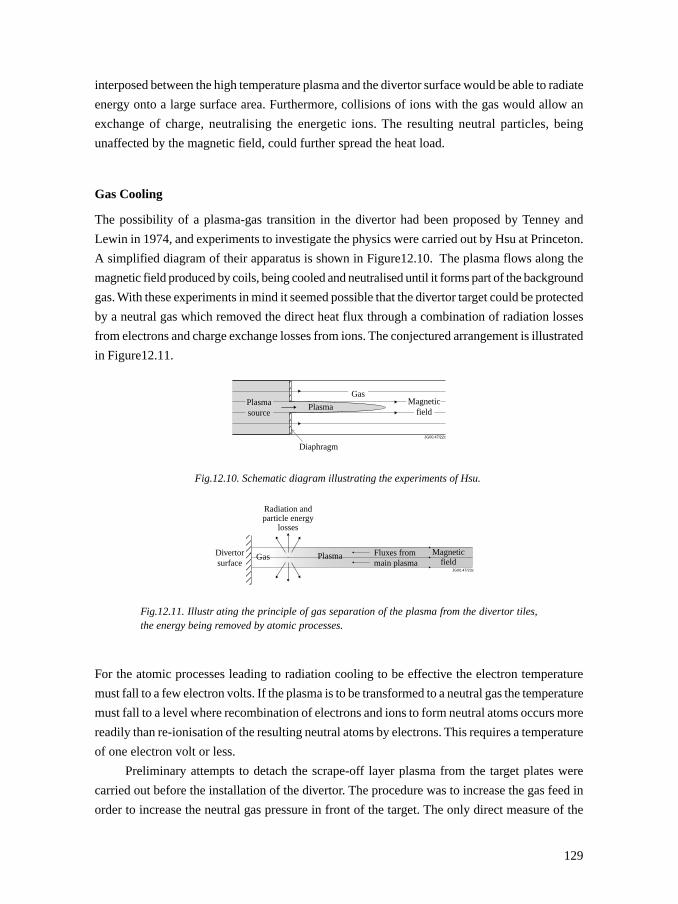
129
interposed between the high temperature plasma and the divertor surface would be able to radiate
energy onto a large surface area. Furthermore, collisions of ions with the gas would allow an
exchange of charge, neutralising the energetic ions. The resulting neutral particles, being
unaffected by the magnetic field, could further spread the heat load.
Gas Cooling
The possibility of a plasma-gas transition in the divertor had been proposed by Tenney and
Lewin in 1974, and experiments to investigate the physics were carried out by Hsu at Princeton.
A simplified diagram of their apparatus is shown in Figure12.10. The plasma flows along the
magnetic field produced by coils, being cooled and neutralised until it forms part of the background
gas. With these experiments in mind it seemed possible that the divertor target could be protected
by a neutral gas which removed the direct heat flux through a combination of radiation losses
from electrons and charge exchange losses from ions. The conjectured arrangement is illustrated
in Figure12.11.
Fig.12.10. Schematic diagram illustrating the experiments of Hsu.
Fig.12.11. Illustr ating the principle of gas separation of the plasma from the divertor tiles,the energy being removed by atomic processes.
For the atomic processes leading to radiation cooling to be effective the electron temperature
must fall to a few electron volts. If the plasma is to be transformed to a neutral gas the temperature
must fall to a level where recombination of electrons and ions to form neutral atoms occurs more
readily than re-ionisation of the resulting neutral atoms by electrons. This requires a temperature
of one electron volt or less.
Preliminary attempts to detach the scrape-off layer plasma from the target plates were
carried out before the installation of the divertor. The procedure was to increase the gas feed in
order to increase the neutral gas pressure in front of the target. The only direct measure of the
Plasma
GasMagnetic
field
DiaphragmJG00.47/22c
Plasmasource
Plasma Fluxes frommain plasma
Magneticfield
Divertorsurface
Radiation andparticle energy
losses
JG00.47/23c
Gas
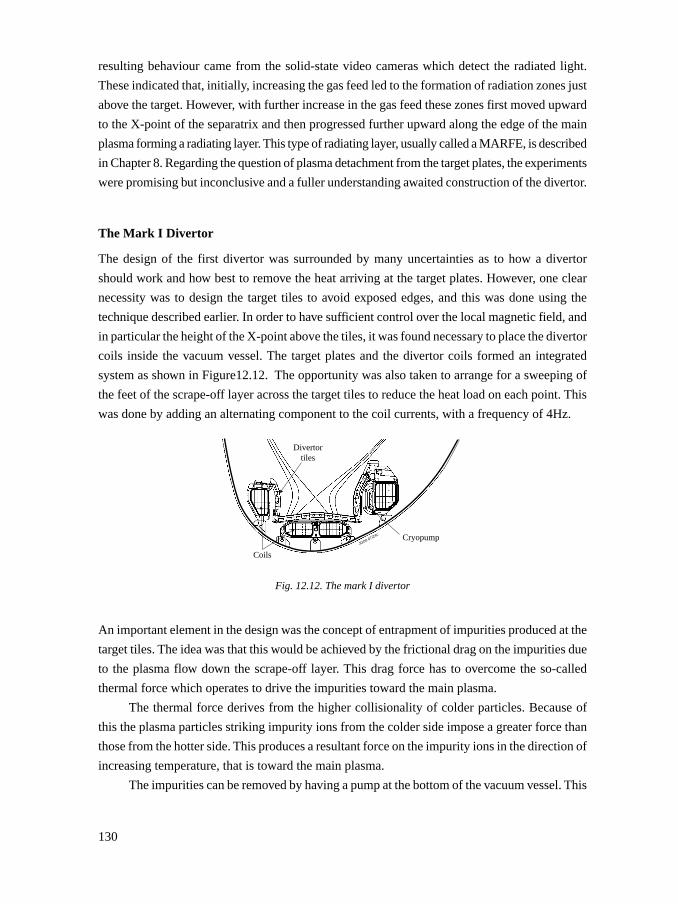
130
resulting behaviour came from the solid-state video cameras which detect the radiated light.
These indicated that, initially, increasing the gas feed led to the formation of radiation zones just
above the target. However, with further increase in the gas feed these zones first moved upward
to the X-point of the separatrix and then progressed further upward along the edge of the main
plasma forming a radiating layer. This type of radiating layer, usually called a MARFE, is described
in Chapter 8. Regarding the question of plasma detachment from the target plates, the experiments
were promising but inconclusive and a fuller understanding awaited construction of the divertor.
The Mark I Divertor
The design of the first divertor was surrounded by many uncertainties as to how a divertor
should work and how best to remove the heat arriving at the target plates. However, one clear
necessity was to design the target tiles to avoid exposed edges, and this was done using the
technique described earlier. In order to have sufficient control over the local magnetic field, and
in particular the height of the X-point above the tiles, it was found necessary to place the divertor
coils inside the vacuum vessel. The target plates and the divertor coils formed an integrated
system as shown in Figure12.12. The opportunity was also taken to arrange for a sweeping of
the feet of the scrape-off layer across the target tiles to reduce the heat load on each point. This
was done by adding an alternating component to the coil currents, with a frequency of 4Hz.
Fig. 12.12. The mark I divertor
An important element in the design was the concept of entrapment of impurities produced at the
target tiles. The idea was that this would be achieved by the frictional drag on the impurities due
to the plasma flow down the scrape-off layer. This drag force has to overcome the so-called
thermal force which operates to drive the impurities toward the main plasma.
The thermal force derives from the higher collisionality of colder particles. Because of
this the plasma particles striking impurity ions from the colder side impose a greater force than
those from the hotter side. This produces a resultant force on the impurity ions in the direction of
increasing temperature, that is toward the main plasma.
The impurities can be removed by having a pump at the bottom of the vacuum vessel. This
JG00.47/24c
Divertortiles
Coils
Cryopump
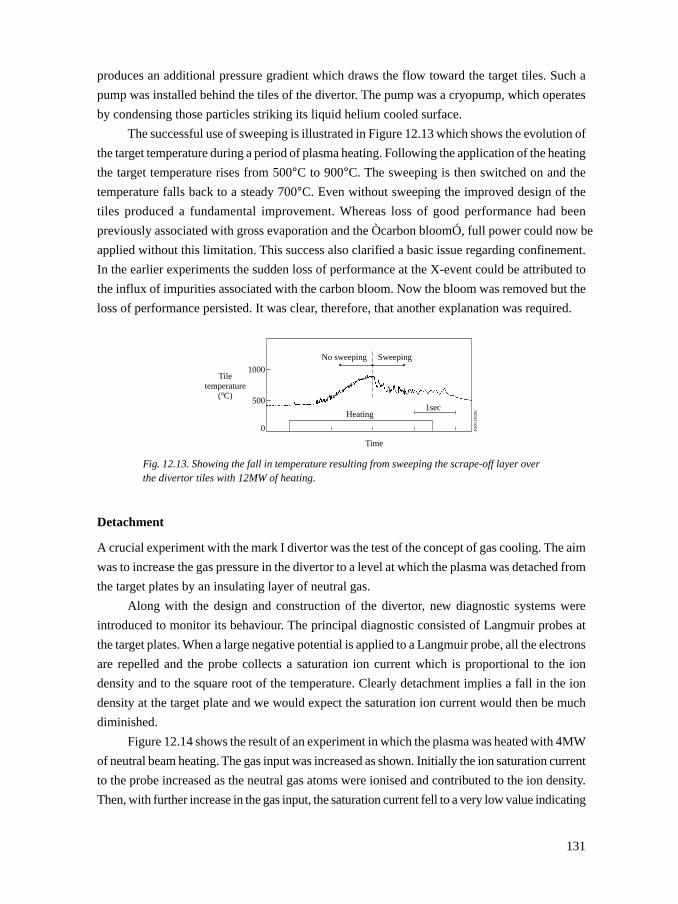
131
produces an additional pressure gradient which draws the flow toward the target tiles. Such a
pump was installed behind the tiles of the divertor. The pump was a cryopump, which operates
by condensing those particles striking its liquid helium cooled surface.
The successful use of sweeping is illustrated in Figure 12.13 which shows the evolution of
the target temperature during a period of plasma heating. Following the application of the heating
the target temperature rises from 500°C to 900°C. The sweeping is then switched on and the
temperature falls back to a steady 700°C. Even without sweeping the improved design of the
tiles produced a fundamental improvement. Whereas loss of good performance had been
previously associated with gross evaporation and the Òcarbon bloomÓ, full power could now be
applied without this limitation. This success also clarified a basic issue regarding confinement.
In the earlier experiments the sudden loss of performance at the X-event could be attributed to
the influx of impurities associated with the carbon bloom. Now the bloom was removed but the
loss of performance persisted. It was clear, therefore, that another explanation was required.
Fig. 12.13. Showing the fall in temperature resulting from sweeping the scrape-off layer overthe divertor tiles with 12MW of heating.
Detachment
A crucial experiment with the mark I divertor was the test of the concept of gas cooling. The aim
was to increase the gas pressure in the divertor to a level at which the plasma was detached from
the target plates by an insulating layer of neutral gas.
Along with the design and construction of the divertor, new diagnostic systems were
introduced to monitor its behaviour. The principal diagnostic consisted of Langmuir probes at
the target plates. When a large negative potential is applied to a Langmuir probe, all the electrons
are repelled and the probe collects a saturation ion current which is proportional to the ion
density and to the square root of the temperature. Clearly detachment implies a fall in the ion
density at the target plate and we would expect the saturation ion current would then be much
diminished.
Figure 12.14 shows the result of an experiment in which the plasma was heated with 4MW
of neutral beam heating. The gas input was increased as shown. Initially the ion saturation current
to the probe increased as the neutral gas atoms were ionised and contributed to the ion density.
Then, with further increase in the gas input, the saturation current fell to a very low value indicating
0
Time
500
1000Tile
temperature(oC)
1secHeating
No sweeping Sweeping
JG00
.25/
25c
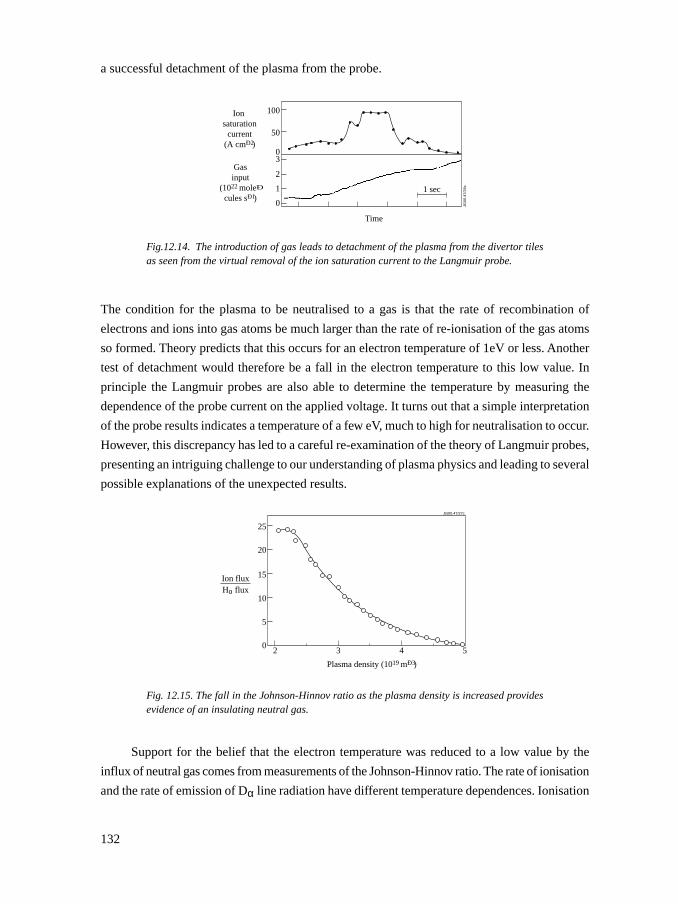
132
a successful detachment of the plasma from the probe.
Fig.12.14. The introduction of gas leads to detachment of the plasma from the divertor tilesas seen from the virtual removal of the ion saturation current to the Langmuir probe.
The condition for the plasma to be neutralised to a gas is that the rate of recombination of
electrons and ions into gas atoms be much larger than the rate of re-ionisation of the gas atoms
so formed. Theory predicts that this occurs for an electron temperature of 1eV or less. Another
test of detachment would therefore be a fall in the electron temperature to this low value. In
principle the Langmuir probes are also able to determine the temperature by measuring the
dependence of the probe current on the applied voltage. It turns out that a simple interpretation
of the probe results indicates a temperature of a few eV, much to high for neutralisation to occur.
However, this discrepancy has led to a careful re-examination of the theory of Langmuir probes,
presenting an intriguing challenge to our understanding of plasma physics and leading to several
possible explanations of the unexpected results.
Fig. 12.15. The fall in the Johnson-Hinnov ratio as the plasma density is increased providesevidence of an insulating neutral gas.
Support for the belief that the electron temperature was reduced to a low value by the
influx of neutral gas comes from measurements of the Johnson-Hinnov ratio. The rate of ionisation
and the rate of emission of Dα line radiation have different temperature dependences. Ionisation
Time
1 sec
0
1
2
30
50
100
Gasinput
(1022 moleÐ
cules sÐ1)
Ion saturation
current(A cmÐ2)
JG00
.47/
26c
25
20
15
10
5
0
Ion fluxHα flux
2 3 4 5
Plasma density (1019 mÐ3)
JG00.47/27c
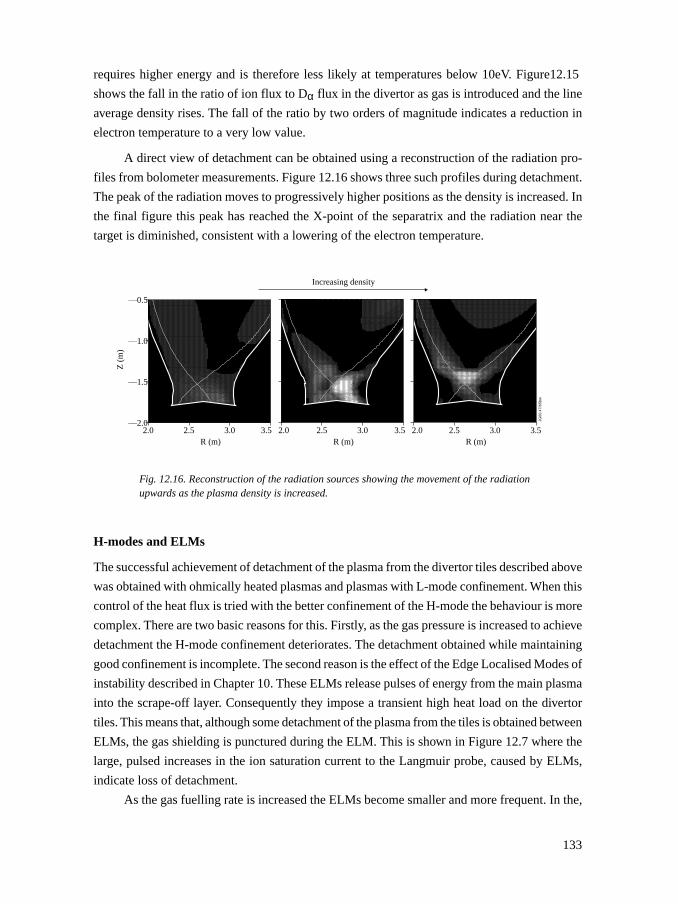
133
requires higher energy and is therefore less likely at temperatures below 10eV. Figure12.15
shows the fall in the ratio of ion flux to Dα flux in the divertor as gas is introduced and the line
average density rises. The fall of the ratio by two orders of magnitude indicates a reduction in
electron temperature to a very low value.
A direct view of detachment can be obtained using a reconstruction of the radiation pro-
files from bolometer measurements. Figure 12.16 shows three such profiles during detachment.
The peak of the radiation moves to progressively higher positions as the density is increased. In
the final figure this peak has reached the X-point of the separatrix and the radiation near the
target is diminished, consistent with a lowering of the electron temperature.
Fig. 12.16. Reconstruction of the radiation sources showing the movement of the radiationupwards as the plasma density is increased.
H-modes and ELMs
The successful achievement of detachment of the plasma from the divertor tiles described above
was obtained with ohmically heated plasmas and plasmas with L-mode confinement. When this
control of the heat flux is tried with the better confinement of the H-mode the behaviour is more
complex. There are two basic reasons for this. Firstly, as the gas pressure is increased to achieve
detachment the H-mode confinement deteriorates. The detachment obtained while maintaining
good confinement is incomplete. The second reason is the effect of the Edge Localised Modes of
instability described in Chapter 10. These ELMs release pulses of energy from the main plasma
into the scrape-off layer. Consequently they impose a transient high heat load on the divertor
tiles. This means that, although some detachment of the plasma from the tiles is obtained between
ELMs, the gas shielding is punctured during the ELM. This is shown in Figure 12.7 where the
large, pulsed increases in the ion saturation current to the Langmuir probe, caused by ELMs,
indicate loss of detachment.
As the gas fuelling rate is increased the ELMs become smaller and more frequent. In the,
—2.0
—1.5
—1.0
—0.5
Z (
m)
2.0 2.5 3.0 3.5R (m)
2.0 2.5 3.0 3.5R (m)
Increasing density
2.0 2.5 3.0 3.5R (m)
JG00
.47/
65bw
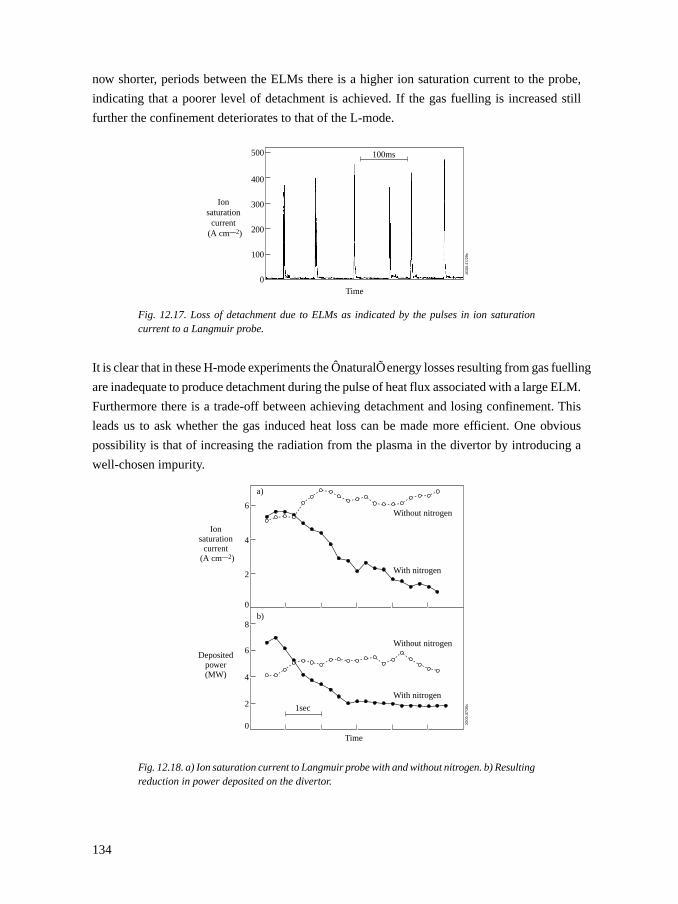
134
now shorter, periods between the ELMs there is a higher ion saturation current to the probe,
indicating that a poorer level of detachment is achieved. If the gas fuelling is increased still
further the confinement deteriorates to that of the L-mode.
Fig. 12.17. Loss of detachment due to ELMs as indicated by the pulses in ion saturationcurrent to a Langmuir probe.
It is clear that in these H-mode experiments the ÔnaturalÕ energy losses resulting from gas fuelling
are inadequate to produce detachment during the pulse of heat flux associated with a large ELM.
Furthermore there is a trade-off between achieving detachment and losing confinement. This
leads us to ask whether the gas induced heat loss can be made more efficient. One obvious
possibility is that of increasing the radiation from the plasma in the divertor by introducing a
well-chosen impurity.
Fig. 12.18. a) Ion saturation current to Langmuir probe with and without nitrogen. b) Resultingreduction in power deposited on the divertor.
Time0
100
200
300
400
500
Ionsaturation
current(A cm—2)
JG00
.47/
29c
100ms
0
2
4
6
6
4
2
0
8
1sec
Ionsaturation
current(A cm—2)
Depositedpower(MW)
JG00
.47/
30c
1sec
Without nitrogen
Without nitrogen
With nitrogen
With nitrogen
Time
a)
b)
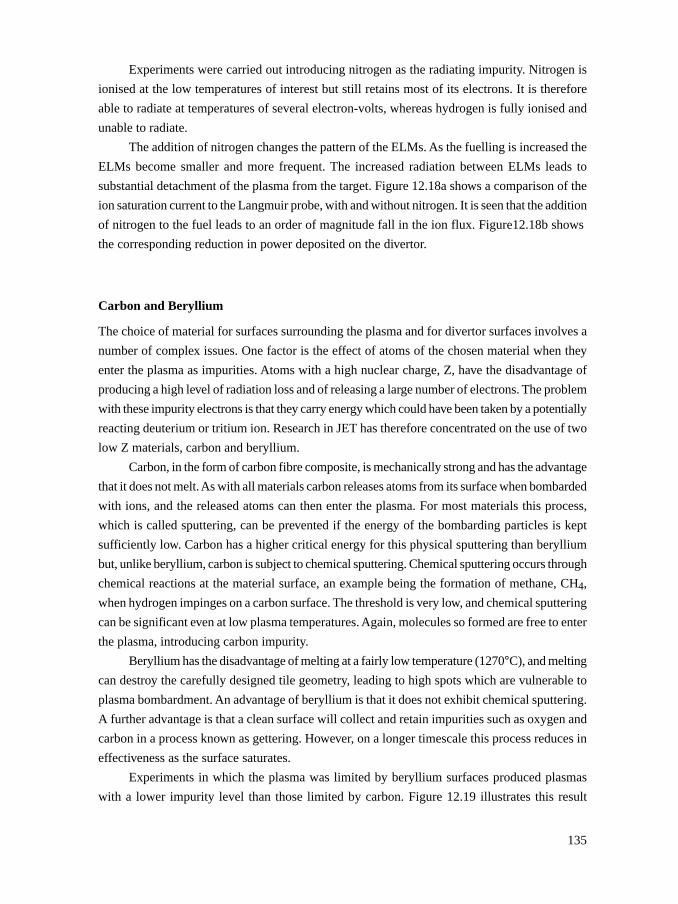
135
Experiments were carried out introducing nitrogen as the radiating impurity. Nitrogen is
ionised at the low temperatures of interest but still retains most of its electrons. It is therefore
able to radiate at temperatures of several electron-volts, whereas hydrogen is fully ionised and
unable to radiate.
The addition of nitrogen changes the pattern of the ELMs. As the fuelling is increased the
ELMs become smaller and more frequent. The increased radiation between ELMs leads to
substantial detachment of the plasma from the target. Figure 12.18a shows a comparison of the
ion saturation current to the Langmuir probe, with and without nitrogen. It is seen that the addition
of nitrogen to the fuel leads to an order of magnitude fall in the ion flux. Figure12.18b shows
the corresponding reduction in power deposited on the divertor.
Carbon and Beryllium
The choice of material for surfaces surrounding the plasma and for divertor surfaces involves a
number of complex issues. One factor is the effect of atoms of the chosen material when they
enter the plasma as impurities. Atoms with a high nuclear charge, Z, have the disadvantage of
producing a high level of radiation loss and of releasing a large number of electrons. The problem
with these impurity electrons is that they carry energy which could have been taken by a potentially
reacting deuterium or tritium ion. Research in JET has therefore concentrated on the use of two
low Z materials, carbon and beryllium.
Carbon, in the form of carbon fibre composite, is mechanically strong and has the advantage
that it does not melt. As with all materials carbon releases atoms from its surface when bombarded
with ions, and the released atoms can then enter the plasma. For most materials this process,
which is called sputtering, can be prevented if the energy of the bombarding particles is kept
sufficiently low. Carbon has a higher critical energy for this physical sputtering than beryllium
but, unlike beryllium, carbon is subject to chemical sputtering. Chemical sputtering occurs through
chemical reactions at the material surface, an example being the formation of methane, CH4,
when hydrogen impinges on a carbon surface. The threshold is very low, and chemical sputtering
can be significant even at low plasma temperatures. Again, molecules so formed are free to enter
the plasma, introducing carbon impurity.
Beryllium has the disadvantage of melting at a fairly low temperature (1270°C), and melting
can destroy the carefully designed tile geometry, leading to high spots which are vulnerable to
plasma bombardment. An advantage of beryllium is that it does not exhibit chemical sputtering.
A further advantage is that a clean surface will collect and retain impurities such as oxygen and
carbon in a process known as gettering. However, on a longer timescale this process reduces in
effectiveness as the surface saturates.
Experiments in which the plasma was limited by beryllium surfaces produced plasmas
with a lower impurity level than those limited by carbon. Figure 12.19 illustrates this result
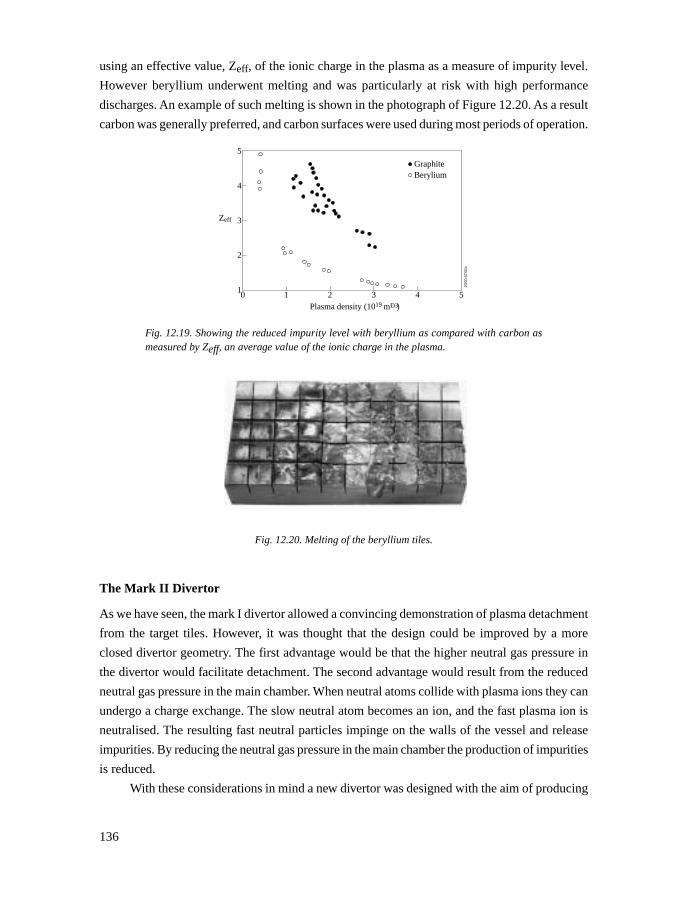
136
using an effective value, Zeff, of the ionic charge in the plasma as a measure of impurity level.
However beryllium underwent melting and was particularly at risk with high performance
discharges. An example of such melting is shown in the photograph of Figure 12.20. As a result
carbon was generally preferred, and carbon surfaces were used during most periods of operation.
Fig. 12.19. Showing the reduced impurity level with beryllium as compared with carbon asmeasured by Zeff, an average value of the ionic charge in the plasma.
Fig. 12.20. Melting of the beryllium tiles.
The Mark II Divertor
As we have seen, the mark I divertor allowed a convincing demonstration of plasma detachment
from the target tiles. However, it was thought that the design could be improved by a more
closed divertor geometry. The first advantage would be that the higher neutral gas pressure in
the divertor would facilitate detachment. The second advantage would result from the reduced
neutral gas pressure in the main chamber. When neutral atoms collide with plasma ions they can
undergo a charge exchange. The slow neutral atom becomes an ion, and the fast plasma ion is
neutralised. The resulting fast neutral particles impinge on the walls of the vessel and release
impurities. By reducing the neutral gas pressure in the main chamber the production of impurities
is reduced.
With these considerations in mind a new divertor was designed with the aim of producing
0 11
2
3
4
5
2 3 4 5
GraphiteBerylium
Plasma density (1019 mÐ3)
Zeff
JG00
.47/
31c
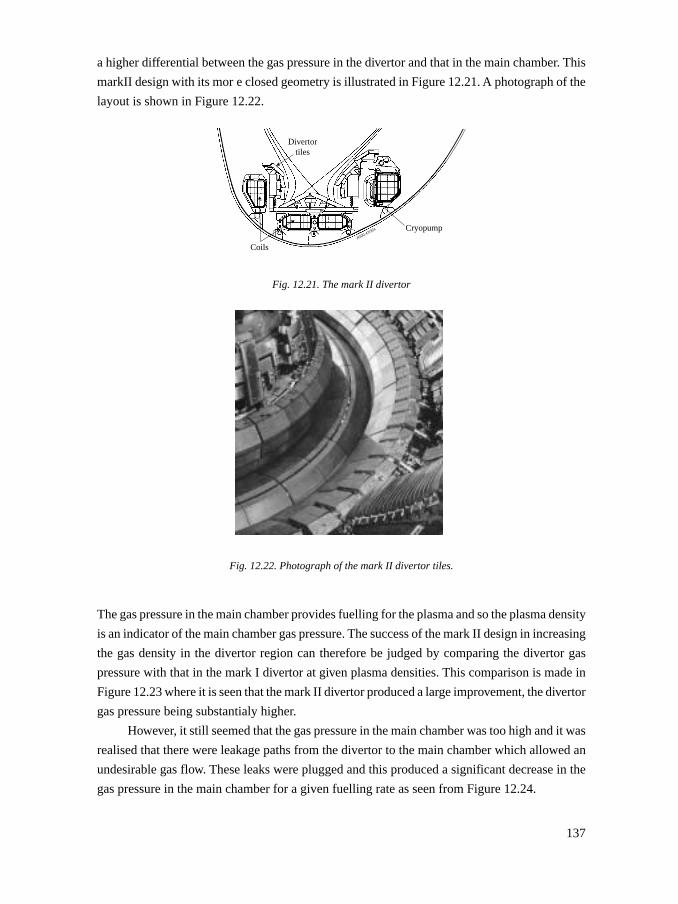
137
a higher differential between the gas pressure in the divertor and that in the main chamber. This
markII design with its mor e closed geometry is illustrated in Figure 12.21. A photograph of the
layout is shown in Figure 12.22.
Fig. 12.21. The mark II divertor
Fig. 12.22. Photograph of the mark II divertor tiles.
The gas pressure in the main chamber provides fuelling for the plasma and so the plasma density
is an indicator of the main chamber gas pressure. The success of the mark II design in increasing
the gas density in the divertor region can therefore be judged by comparing the divertor gas
pressure with that in the mark I divertor at given plasma densities. This comparison is made in
Figure 12.23 where it is seen that the mark II divertor produced a large improvement, the divertor
gas pressure being substantialy higher.
However, it still seemed that the gas pressure in the main chamber was too high and it was
realised that there were leakage paths from the divertor to the main chamber which allowed an
undesirable gas flow. These leaks were plugged and this produced a significant decrease in the
gas pressure in the main chamber for a given fuelling rate as seen from Figure 12.24.
JG00.47/32c
Divertortiles
Coils
Cryopump
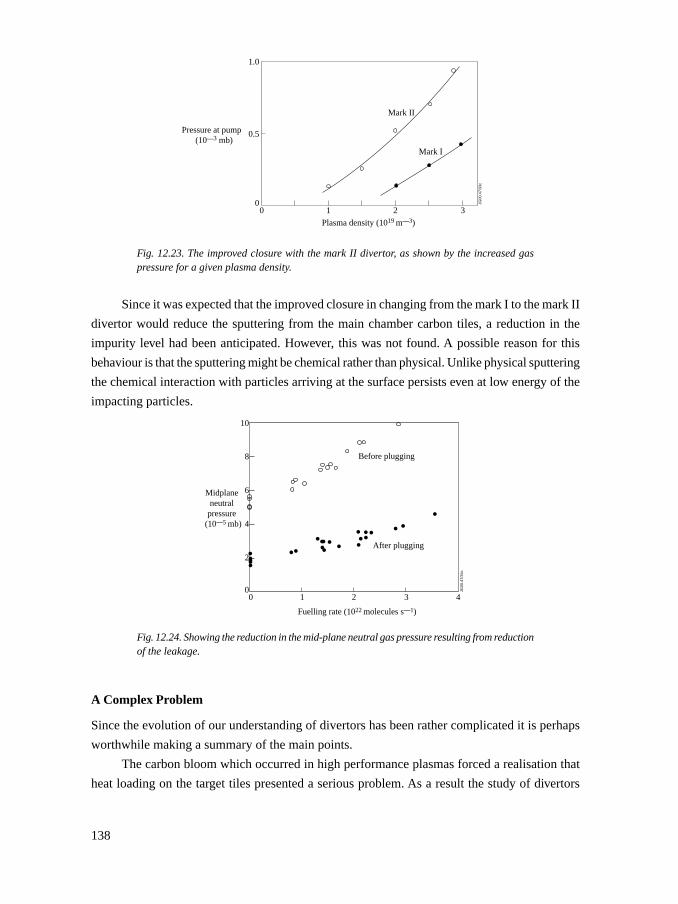
138
Fig. 12.23. The improved closure with the mark II divertor, as shown by the increased gaspressure for a given plasma density.
Since it was expected that the improved closure in changing from the mark I to the mark II
divertor would reduce the sputtering from the main chamber carbon tiles, a reduction in the
impurity level had been anticipated. However, this was not found. A possible reason for this
behaviour is that the sputtering might be chemical rather than physical. Unlike physical sputtering
the chemical interaction with particles arriving at the surface persists even at low energy of the
impacting particles.
Fig. 12.24. Showing the reduction in the mid-plane neutral gas pressure resulting from reductionof the leakage.
A Complex Problem
Since the evolution of our understanding of divertors has been rather complicated it is perhaps
worthwhile making a summary of the main points.
The carbon bloom which occurred in high performance plasmas forced a realisation that
heat loading on the target tiles presented a serious problem. As a result the study of divertors
10
8
6
4
2
00 1 2 3 4
Fuelling rate (1022 molecules s—1)
Midplaneneutral
pressure(10—5 mb)
After plugging
Before pluggingJG
00.4
7/34
c
0
0.5
1.0
0 1 2 3
Plasma density (1019 m—3)
Pressure at pump (10—3 mb)
Mark II
Mark I
JG00
.47/
33c
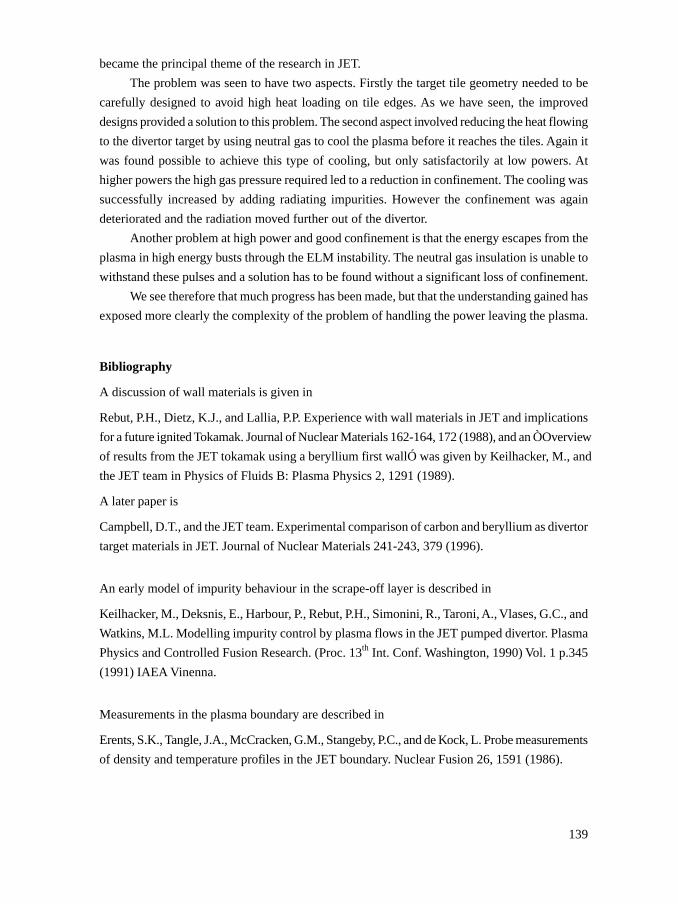
139
became the principal theme of the research in JET.
The problem was seen to have two aspects. Firstly the target tile geometry needed to be
carefully designed to avoid high heat loading on tile edges. As we have seen, the improved
designs provided a solution to this problem. The second aspect involved reducing the heat flowing
to the divertor target by using neutral gas to cool the plasma before it reaches the tiles. Again it
was found possible to achieve this type of cooling, but only satisfactorily at low powers. At
higher powers the high gas pressure required led to a reduction in confinement. The cooling was
successfully increased by adding radiating impurities. However the confinement was again
deteriorated and the radiation moved further out of the divertor.
Another problem at high power and good confinement is that the energy escapes from the
plasma in high energy busts through the ELM instability. The neutral gas insulation is unable to
withstand these pulses and a solution has to be found without a significant loss of confinement.
We see therefore that much progress has been made, but that the understanding gained has
exposed more clearly the complexity of the problem of handling the power leaving the plasma.
Bibliography
A discussion of wall materials is given in
Rebut, P.H., Dietz, K.J., and Lallia, P.P. Experience with wall materials in JET and implications
for a future ignited Tokamak. Journal of Nuclear Materials 162-164, 172 (1988), and an ÒOverview
of results from the JET tokamak using a beryllium first wallÓ was given by Keilhacker, M., and
the JET team in Physics of Fluids B: Plasma Physics 2, 1291 (1989).
A later paper is
Campbell, D.T., and the JET team. Experimental comparison of carbon and beryllium as divertor
target materials in JET. Journal of Nuclear Materials 241-243, 379 (1996).
An early model of impurity behaviour in the scrape-off layer is described in
Keilhacker, M., Deksnis, E., Harbour, P., Rebut, P.H., Simonini, R., Taroni, A., Vlases, G.C., and
Watkins, M.L. Modelling impurity control by plasma flows in the JET pumped divertor. Plasma
Physics and Controlled Fusion Research. (Proc. 13th Int. Conf. Washington, 1990) Vol. 1 p.345
(1991) IAEA Vinenna.
Measurements in the plasma boundary are described in
Erents, S.K., Tangle, J.A., McCracken, G.M., Stangeby, P.C., and de Kock, L. Probe measurements
of density and temperature profiles in the JET boundary. Nuclear Fusion 26, 1591 (1986).
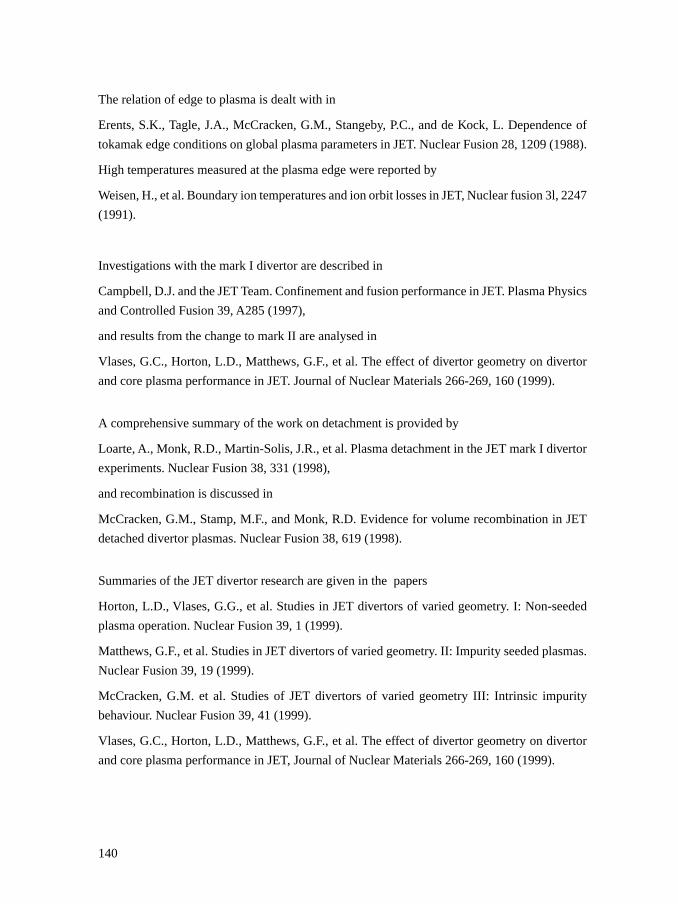
140
The relation of edge to plasma is dealt with in
Erents, S.K., Tagle, J.A., McCracken, G.M., Stangeby, P.C., and de Kock, L. Dependence of
tokamak edge conditions on global plasma parameters in JET. Nuclear Fusion 28, 1209 (1988).
High temperatures measured at the plasma edge were reported by
Weisen, H., et al. Boundary ion temperatures and ion orbit losses in JET, Nuclear fusion 3l, 2247
(1991).
Investigations with the mark I divertor are described in
Campbell, D.J. and the JET Team. Confinement and fusion performance in JET. Plasma Physics
and Controlled Fusion 39, A285 (1997),
and results from the change to mark II are analysed in
Vlases, G.C., Horton, L.D., Matthews, G.F., et al. The effect of divertor geometry on divertor
and core plasma performance in JET. Journal of Nuclear Materials 266-269, 160 (1999).
A comprehensive summary of the work on detachment is provided by
Loarte, A., Monk, R.D., Martin-Solis, J.R., et al. Plasma detachment in the JET mark I divertor
experiments. Nuclear Fusion 38, 331 (1998),
and recombination is discussed in
McCracken, G.M., Stamp, M.F., and Monk, R.D. Evidence for volume recombination in JET
detached divertor plasmas. Nuclear Fusion 38, 619 (1998).
Summaries of the JET divertor research are given in the papers
Horton, L.D., Vlases, G.G., et al. Studies in JET divertors of varied geometry. I: Non-seeded
plasma operation. Nuclear Fusion 39, 1 (1999).
Matthews, G.F., et al. Studies in JET divertors of varied geometry. II: Impurity seeded plasmas.
Nuclear Fusion 39, 19 (1999).
McCracken, G.M. et al. Studies of JET divertors of varied geometry III: Intrinsic impurity
behaviour. Nuclear Fusion 39, 41 (1999).
Vlases, G.C., Horton, L.D., Matthews, G.F., et al. The effect of divertor geometry on divertor
and core plasma performance in JET, Journal of Nuclear Materials 266-269, 160 (1999).
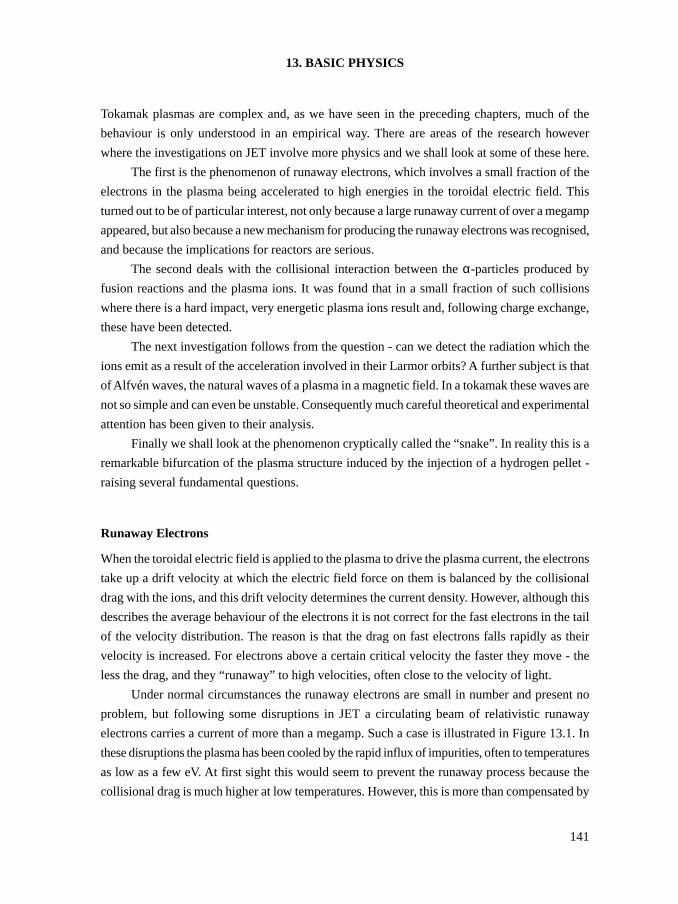
141
13. BASIC PHYSICS
Tokamak plasmas are complex and, as we have seen in the preceding chapters, much of the
behaviour is only understood in an empirical way. There are areas of the research however
where the investigations on JET involve more physics and we shall look at some of these here.
The first is the phenomenon of runaway electrons, which involves a small fraction of the
electrons in the plasma being accelerated to high energies in the toroidal electric field. This
turned out to be of particular interest, not only because a large runaway current of over a megamp
appeared, but also because a new mechanism for producing the runaway electrons was recognised,
and because the implications for reactors are serious.
The second deals with the collisional interaction between the α-particles produced by
fusion reactions and the plasma ions. It was found that in a small fraction of such collisions
where there is a hard impact, very energetic plasma ions result and, following charge exchange,
these have been detected.
The next investigation follows from the question - can we detect the radiation which the
ions emit as a result of the acceleration involved in their Larmor orbits? A further subject is that
of Alfvén waves, the natural waves of a plasma in a magnetic field. In a tokamak these waves are
not so simple and can even be unstable. Consequently much careful theoretical and experimental
attention has been given to their analysis.
Finally we shall look at the phenomenon cryptically called the “snake”. In reality this is a
remarkable bifurcation of the plasma structure induced by the injection of a hydrogen pellet -
raising several fundamental questions.
Runaway Electrons
When the toroidal electric field is applied to the plasma to drive the plasma current, the electrons
take up a drift velocity at which the electric field force on them is balanced by the collisional
drag with the ions, and this drift velocity determines the current density. However, although this
describes the average behaviour of the electrons it is not correct for the fast electrons in the tail
of the velocity distribution. The reason is that the drag on fast electrons falls rapidly as their
velocity is increased. For electrons above a certain critical velocity the faster they move - the
less the drag, and they “runaway” to high velocities, often close to the velocity of light.
Under normal circumstances the runaway electrons are small in number and present no
problem, but following some disruptions in JET a circulating beam of relativistic runaway
electrons carries a current of more than a megamp. Such a case is illustrated in Figure 13.1. In
these disruptions the plasma has been cooled by the rapid influx of impurities, often to temperatures
as low as a few eV. At first sight this would seem to prevent the runaway process because the
collisional drag is much higher at low temperatures. However, this is more than compensated by
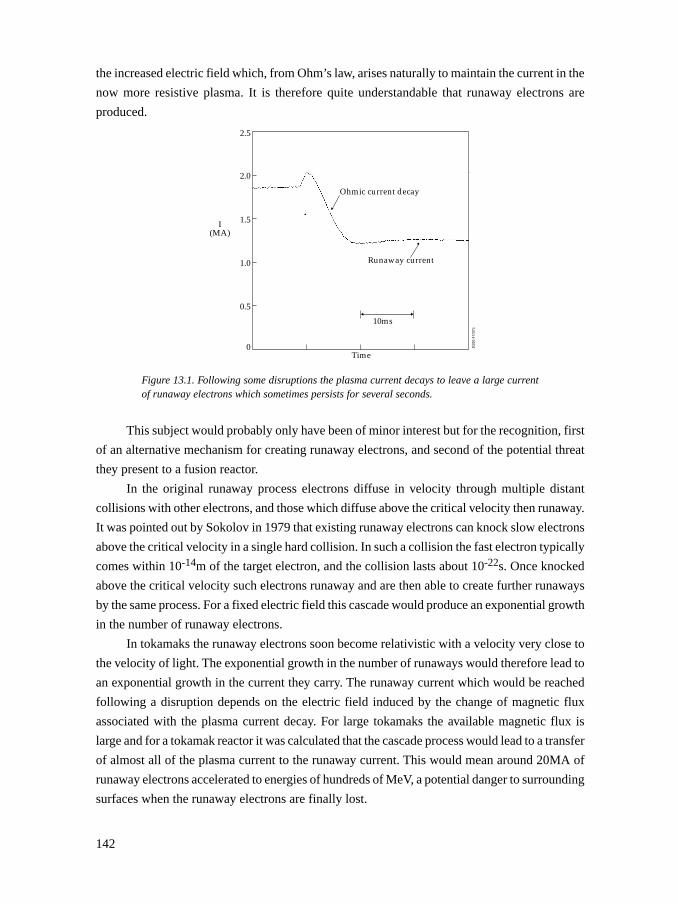
142
the increased electric field which, from Ohm’s law, arises naturally to maintain the current in the
now more resistive plasma. It is therefore quite understandable that runaway electrons are
produced.
Figure 13.1. Following some disruptions the plasma current decays to leave a large currentof runaway electrons which sometimes persists for several seconds.
This subject would probably only have been of minor interest but for the recognition, first
of an alternative mechanism for creating runaway electrons, and second of the potential threat
they present to a fusion reactor.
In the original runaway process electrons diffuse in velocity through multiple distant
collisions with other electrons, and those which diffuse above the critical velocity then runaway.
It was pointed out by Sokolov in 1979 that existing runaway electrons can knock slow electrons
above the critical velocity in a single hard collision. In such a collision the fast electron typically
comes within 10-14m of the target electron, and the collision lasts about 10-22s. Once knocked
above the critical velocity such electrons runaway and are then able to create further runaways
by the same process. For a fixed electric field this cascade would produce an exponential growth
in the number of runaway electrons.
In tokamaks the runaway electrons soon become relativistic with a velocity very close to
the velocity of light. The exponential growth in the number of runaways would therefore lead to
an exponential growth in the current they carry. The runaway current which would be reached
following a disruption depends on the electric field induced by the change of magnetic flux
associated with the plasma current decay. For large tokamaks the available magnetic flux is
large and for a tokamak reactor it was calculated that the cascade process would lead to a transfer
of almost all of the plasma current to the runaway current. This would mean around 20MA of
runaway electrons accelerated to energies of hundreds of MeV, a potential danger to surrounding
surfaces when the runaway electrons are finally lost.
JG00
.47/
37c
2.5
2.0
1.5
1.0
10ms
Runaway current
Ohmic current decay
0.5
0Time
I(MA)
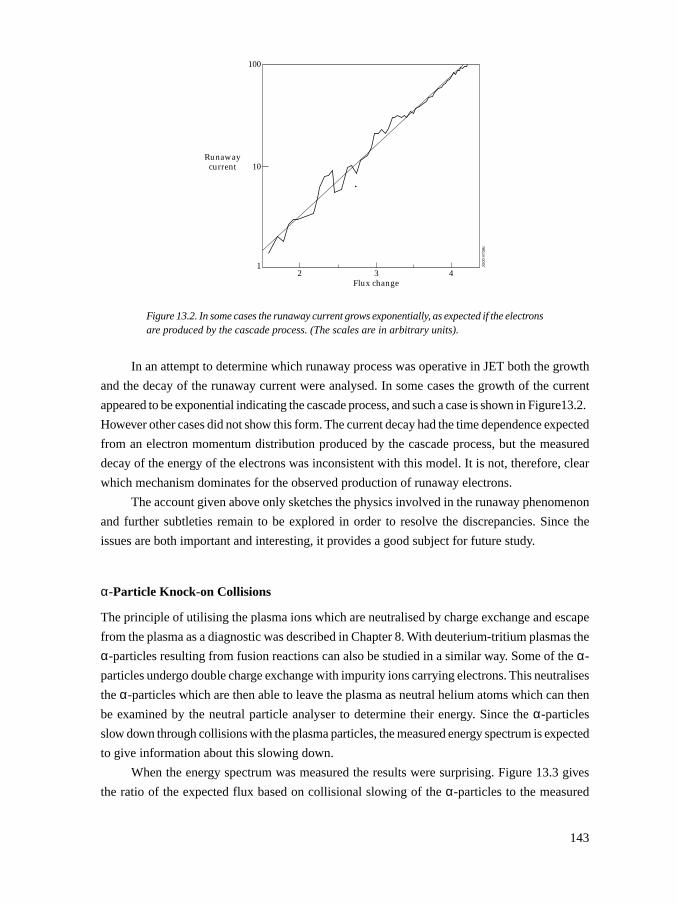
143
Figure 13.2. In some cases the runaway current grows exponentially, as expected if the electronsare produced by the cascade process. (The scales are in arbitrary units).
In an attempt to determine which runaway process was operative in JET both the growth
and the decay of the runaway current were analysed. In some cases the growth of the current
appeared to be exponential indicating the cascade process, and such a case is shown in Figure13.2.
However other cases did not show this form. The current decay had the time dependence expected
from an electron momentum distribution produced by the cascade process, but the measured
decay of the energy of the electrons was inconsistent with this model. It is not, therefore, clear
which mechanism dominates for the observed production of runaway electrons.
The account given above only sketches the physics involved in the runaway phenomenon
and further subtleties remain to be explored in order to resolve the discrepancies. Since the
issues are both important and interesting, it provides a good subject for future study.
α-Particle Knock-on Collisions
The principle of utilising the plasma ions which are neutralised by charge exchange and escape
from the plasma as a diagnostic was described in Chapter 8. With deuterium-tritium plasmas the
α-particles resulting from fusion reactions can also be studied in a similar way. Some of the α-
particles undergo double charge exchange with impurity ions carrying electrons. This neutralises
the α-particles which are then able to leave the plasma as neutral helium atoms which can then
be examined by the neutral particle analyser to determine their energy. Since the α-particles
slow down through collisions with the plasma particles, the measured energy spectrum is expected
to give information about this slowing down.
When the energy spectrum was measured the results were surprising. Figure 13.3 gives
the ratio of the expected flux based on collisional slowing of the α-particles to the measured
100
10
13 42
Flux change
Runawaycurrent
JG00
.47/
38c
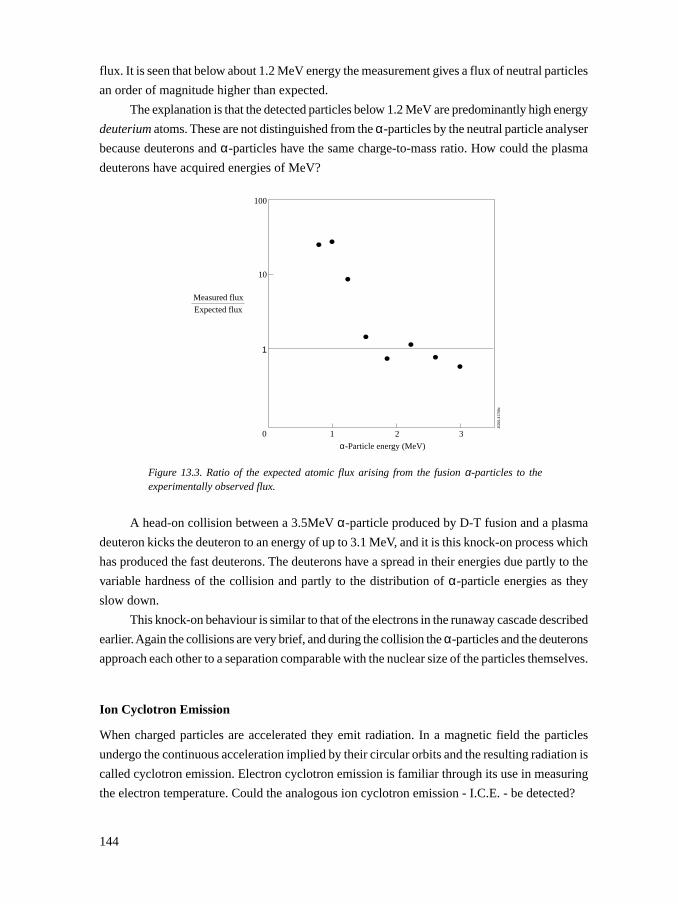
144
flux. It is seen that below about 1.2 MeV energy the measurement gives a flux of neutral particles
an order of magnitude higher than expected.
The explanation is that the detected particles below 1.2 MeV are predominantly high energy
deuterium atoms. These are not distinguished from the α-particles by the neutral particle analyser
because deuterons and α-particles have the same charge-to-mass ratio. How could the plasma
deuterons have acquired energies of MeV?
Figure 13.3. Ratio of the expected atomic flux arising from the fusion α-particles to theexperimentally observed flux.
A head-on collision between a 3.5MeV α-particle produced by D-T fusion and a plasma
deuteron kicks the deuteron to an energy of up to 3.1 MeV, and it is this knock-on process which
has produced the fast deuterons. The deuterons have a spread in their energies due partly to the
variable hardness of the collision and partly to the distribution of α-particle energies as they
slow down.
This knock-on behaviour is similar to that of the electrons in the runaway cascade described
earlier. Again the collisions are very brief, and during the collision the α-particles and the deuterons
approach each other to a separation comparable with the nuclear size of the particles themselves.
Ion Cyclotron Emission
When charged particles are accelerated they emit radiation. In a magnetic field the particles
undergo the continuous acceleration implied by their circular orbits and the resulting radiation is
called cyclotron emission. Electron cyclotron emission is familiar through its use in measuring
the electron temperature. Could the analogous ion cyclotron emission - I.C.E. - be detected?
1
α-Particle energy (MeV)
0
1
Measured flux
Expected flux
10
100
2 3
JG00
.47/
39c
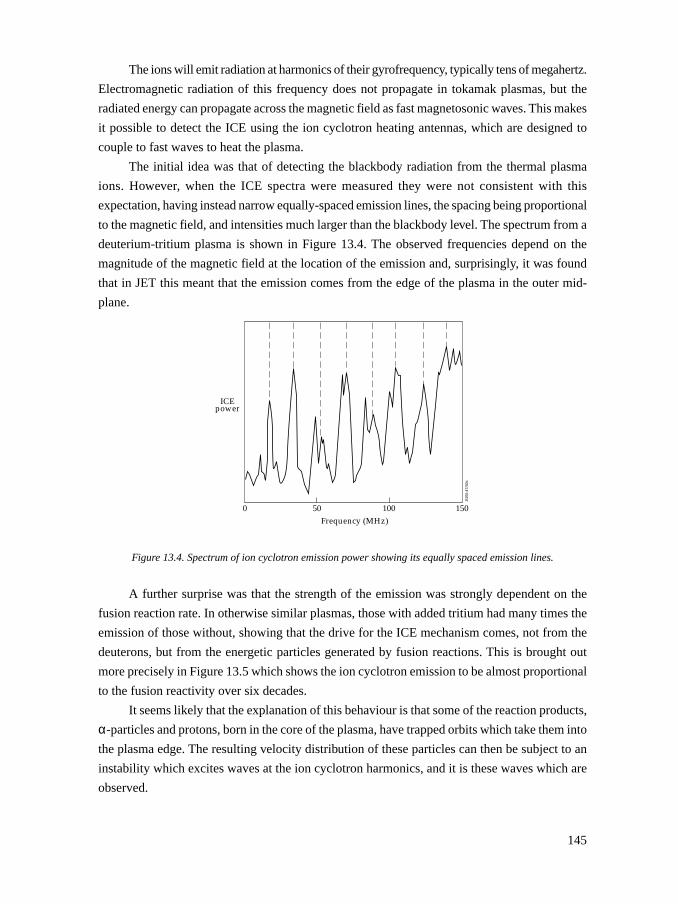
145
The ions will emit radiation at harmonics of their gyrofrequency, typically tens of megahertz.
Electromagnetic radiation of this frequency does not propagate in tokamak plasmas, but the
radiated energy can propagate across the magnetic field as fast magnetosonic waves. This makes
it possible to detect the ICE using the ion cyclotron heating antennas, which are designed to
couple to fast waves to heat the plasma.
The initial idea was that of detecting the blackbody radiation from the thermal plasma
ions. However, when the ICE spectra were measured they were not consistent with this
expectation, having instead narrow equally-spaced emission lines, the spacing being proportional
to the magnetic field, and intensities much larger than the blackbody level. The spectrum from a
deuterium-tritium plasma is shown in Figure 13.4. The observed frequencies depend on the
magnitude of the magnetic field at the location of the emission and, surprisingly, it was found
that in JET this meant that the emission comes from the edge of the plasma in the outer mid-
plane.
Figure 13.4. Spectrum of ion cyclotron emission power showing its equally spaced emission lines.
A further surprise was that the strength of the emission was strongly dependent on the
fusion reaction rate. In otherwise similar plasmas, those with added tritium had many times the
emission of those without, showing that the drive for the ICE mechanism comes, not from the
deuterons, but from the energetic particles generated by fusion reactions. This is brought out
more precisely in Figure 13.5 which shows the ion cyclotron emission to be almost proportional
to the fusion reactivity over six decades.
It seems likely that the explanation of this behaviour is that some of the reaction products,
α-particles and protons, born in the core of the plasma, have trapped orbits which take them into
the plasma edge. The resulting velocity distribution of these particles can then be subject to an
instability which excites waves at the ion cyclotron harmonics, and it is these waves which are
observed.
0
ICEpower
50 100 150Frequency (MHz)
JG00
.47/
40c
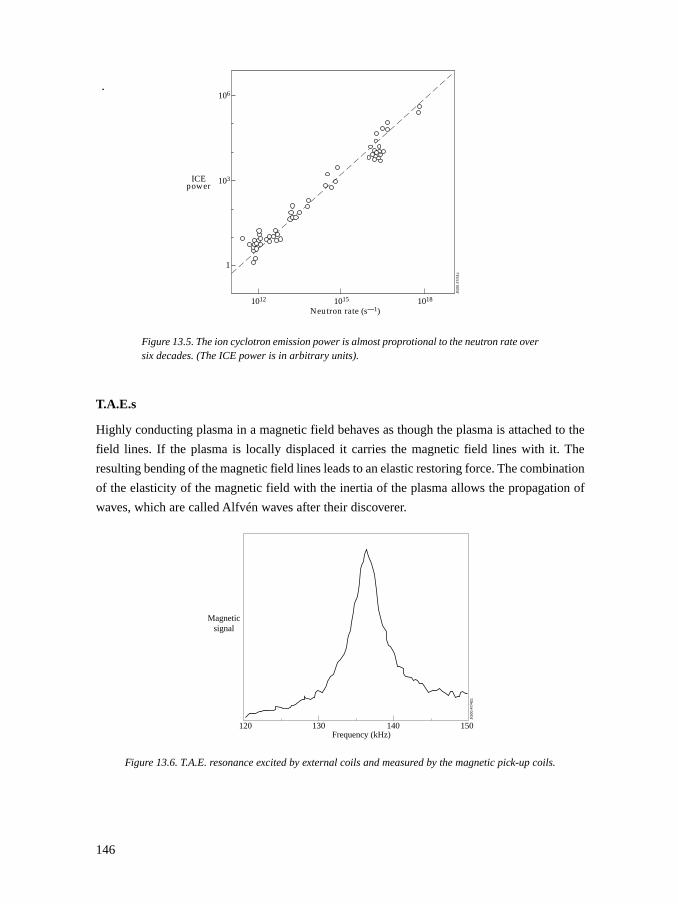
146
Figure 13.5. The ion cyclotron emission power is almost proprotional to the neutron rate oversix decades. (The ICE power is in arbitrary units).
T.A.E.s
Highly conducting plasma in a magnetic field behaves as though the plasma is attached to the
field lines. If the plasma is locally displaced it carries the magnetic field lines with it. The
resulting bending of the magnetic field lines leads to an elastic restoring force. The combination
of the elasticity of the magnetic field with the inertia of the plasma allows the propagation of
waves, which are called Alfvén waves after their discoverer.
Figure 13.6. T.A.E. resonance excited by external coils and measured by the magnetic pick-up coils.
JG00
.47/
41c
106
103
1
Neutron rate (s—1)1012 1015 1018
ICEpower
Magneticsignal
120 130 140 150Frequency (kHz)
JG00
.47/
42c
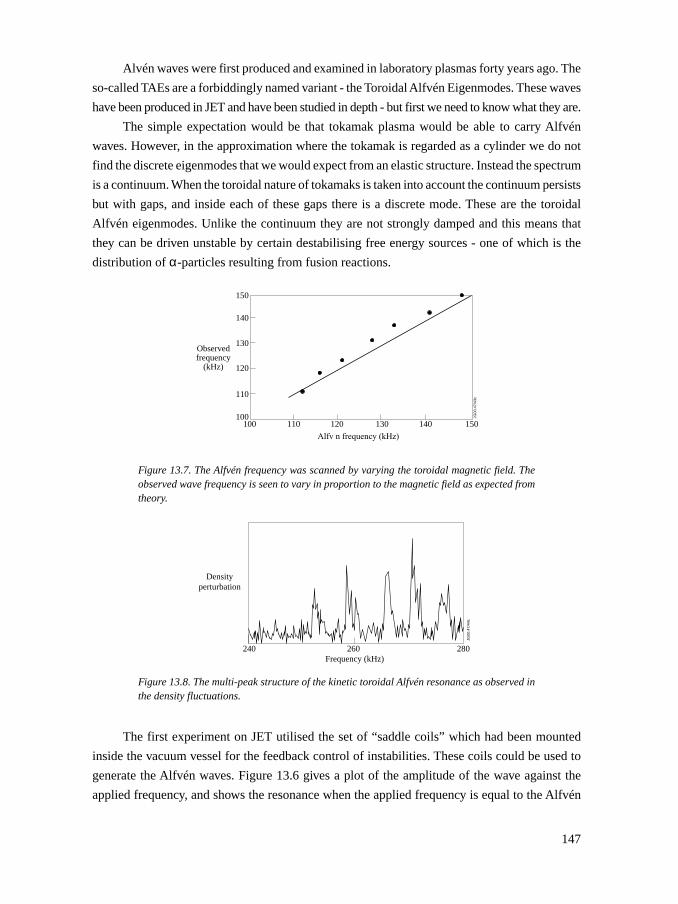
147
Alvén waves were first produced and examined in laboratory plasmas forty years ago. The
so-called TAEs are a forbiddingly named variant - the Toroidal Alfvén Eigenmodes. These waves
have been produced in JET and have been studied in depth - but first we need to know what they are.
The simple expectation would be that tokamak plasma would be able to carry Alfvén
waves. However, in the approximation where the tokamak is regarded as a cylinder we do not
find the discrete eigenmodes that we would expect from an elastic structure. Instead the spectrum
is a continuum. When the toroidal nature of tokamaks is taken into account the continuum persists
but with gaps, and inside each of these gaps there is a discrete mode. These are the toroidal
Alfvén eigenmodes. Unlike the continuum they are not strongly damped and this means that
they can be driven unstable by certain destabilising free energy sources - one of which is the
distribution of α-particles resulting from fusion reactions.
Figure 13.7. The Alfvén frequency was scanned by varying the toroidal magnetic field. Theobserved wave frequency is seen to vary in proportion to the magnetic field as expected fromtheory.
Figure 13.8. The multi-peak structure of the kinetic toroidal Alfvén resonance as observed inthe density fluctuations.
The first experiment on JET utilised the set of “saddle coils” which had been mounted
inside the vacuum vessel for the feedback control of instabilities. These coils could be used to
generate the Alfvén waves. Figure 13.6 gives a plot of the amplitude of the wave against the
applied frequency, and shows the resonance when the applied frequency is equal to the Alfvén
Alfv n frequency (kHz)
100
150
140
130Observedfrequency
(kHz) 120
110
100110 120 130 140 150
JG00
.47/
43c
240
Densityperturbation
260 280Frequency (kHz)
JG00
.47/
44c
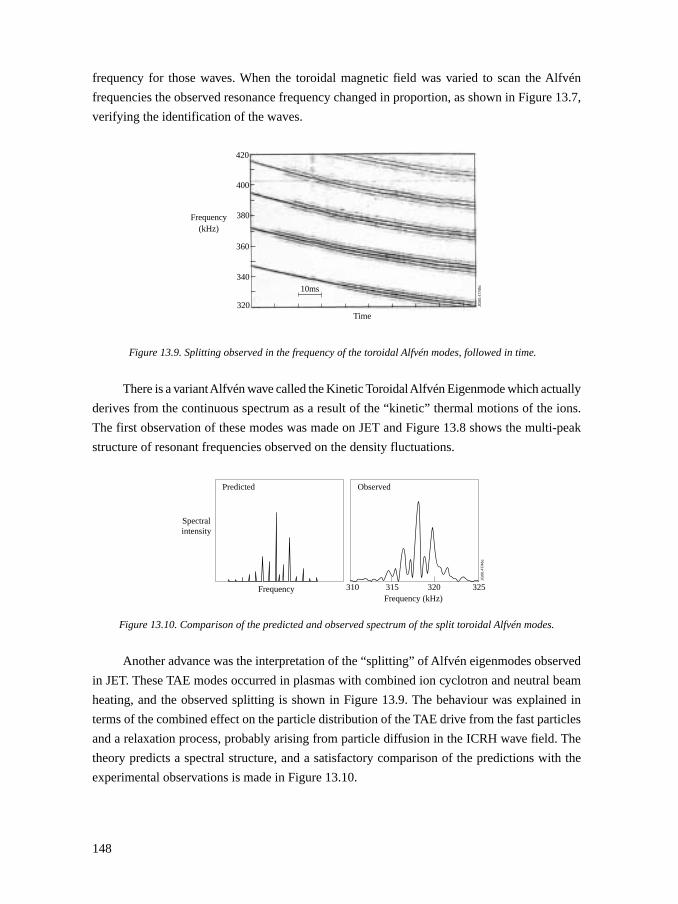
148
frequency for those waves. When the toroidal magnetic field was varied to scan the Alfvén
frequencies the observed resonance frequency changed in proportion, as shown in Figure 13.7,
verifying the identification of the waves.
Figure 13.9. Splitting observed in the frequency of the toroidal Alfvén modes, followed in time.
There is a variant Alfvén wave called the Kinetic Toroidal Alfvén Eigenmode which actually
derives from the continuous spectrum as a result of the “kinetic” thermal motions of the ions.
The first observation of these modes was made on JET and Figure 13.8 shows the multi-peak
structure of resonant frequencies observed on the density fluctuations.
Figure 13.10. Comparison of the predicted and observed spectrum of the split toroidal Alfvén modes.
Another advance was the interpretation of the “splitting” of Alfvén eigenmodes observed
in JET. These TAE modes occurred in plasmas with combined ion cyclotron and neutral beam
heating, and the observed splitting is shown in Figure 13.9. The behaviour was explained in
terms of the combined effect on the particle distribution of the TAE drive from the fast particles
and a relaxation process, probably arising from particle diffusion in the ICRH wave field. The
theory predicts a spectral structure, and a satisfactory comparison of the predictions with the
experimental observations is made in Figure 13.10.
420
400
380
360
340
320Time
10ms
Frequency(kHz)
JG00
.47/
45c
Frequency 310 315Frequency (kHz)
JG00
.47/
46c
ObservedPredicted
Spectralintensity
320 325
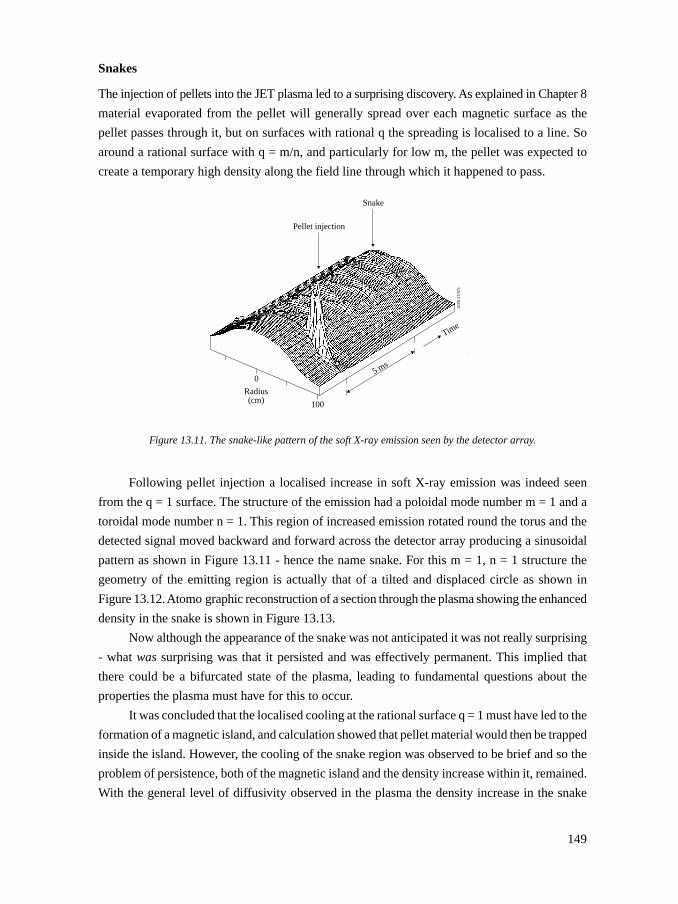
149
Snakes
The injection of pellets into the JET plasma led to a surprising discovery. As explained in Chapter 8
material evaporated from the pellet will generally spread over each magnetic surface as the
pellet passes through it, but on surfaces with rational q the spreading is localised to a line. So
around a rational surface with q = m/n, and particularly for low m, the pellet was expected to
create a temporary high density along the field line through which it happened to pass.
Figure 13.11. The snake-like pattern of the soft X-ray emission seen by the detector array.
Following pellet injection a localised increase in soft X-ray emission was indeed seen
from the q = 1 surface. The structure of the emission had a poloidal mode number m = 1 and a
toroidal mode number n = 1. This region of increased emission rotated round the torus and the
detected signal moved backward and forward across the detector array producing a sinusoidal
pattern as shown in Figure 13.11 - hence the name snake. For this m = 1, n = 1 structure the
geometry of the emitting region is actually that of a tilted and displaced circle as shown in
Figure 13.12. Atomo graphic reconstruction of a section through the plasma showing the enhanced
density in the snake is shown in Figure 13.13.
Now although the appearance of the snake was not anticipated it was not really surprising
- what was surprising was that it persisted and was effectively permanent. This implied that
there could be a bifurcated state of the plasma, leading to fundamental questions about the
properties the plasma must have for this to occur.
It was concluded that the localised cooling at the rational surface q = 1 must have led to the
formation of a magnetic island, and calculation showed that pellet material would then be trapped
inside the island. However, the cooling of the snake region was observed to be brief and so the
problem of persistence, both of the magnetic island and the density increase within it, remained.
With the general level of diffusivity observed in the plasma the density increase in the snake
Pellet injection
Snake
Radius(cm)
5 ms
Time
0
100
JG00
.47/
47c
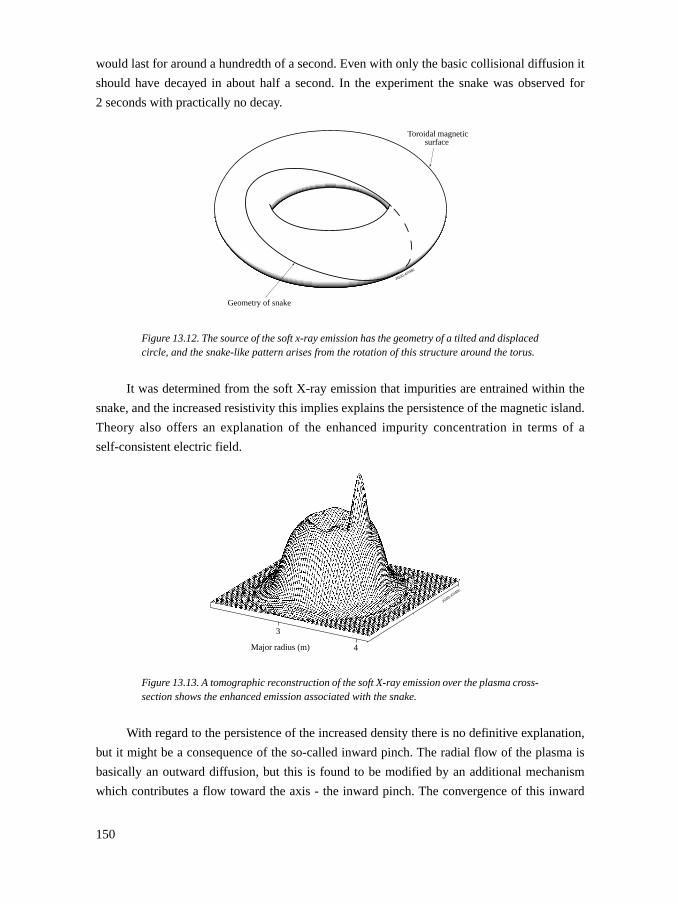
150
would last for around a hundredth of a second. Even with only the basic collisional diffusion it
should have decayed in about half a second. In the experiment the snake was observed for
2 seconds with practically no decay.
Figure 13.12. The source of the soft x-ray emission has the geometry of a tilted and displacedcircle, and the snake-like pattern arises from the rotation of this structure around the torus.
It was determined from the soft X-ray emission that impurities are entrained within the
snake, and the increased resistivity this implies explains the persistence of the magnetic island.
Theory also offers an explanation of the enhanced impurity concentration in terms of a
self-consistent electric field.
Figure 13.13. A tomographic reconstruction of the soft X-ray emission over the plasma cross-section shows the enhanced emission associated with the snake.
With regard to the persistence of the increased density there is no definitive explanation,
but it might be a consequence of the so-called inward pinch. The radial flow of the plasma is
basically an outward diffusion, but this is found to be modified by an additional mechanism
which contributes a flow toward the axis - the inward pinch. The convergence of this inward
Toroidal magneticsurface
Geometry of snake
JG00.47/48c
3
Major radius (m) 4
JG00.47/49c
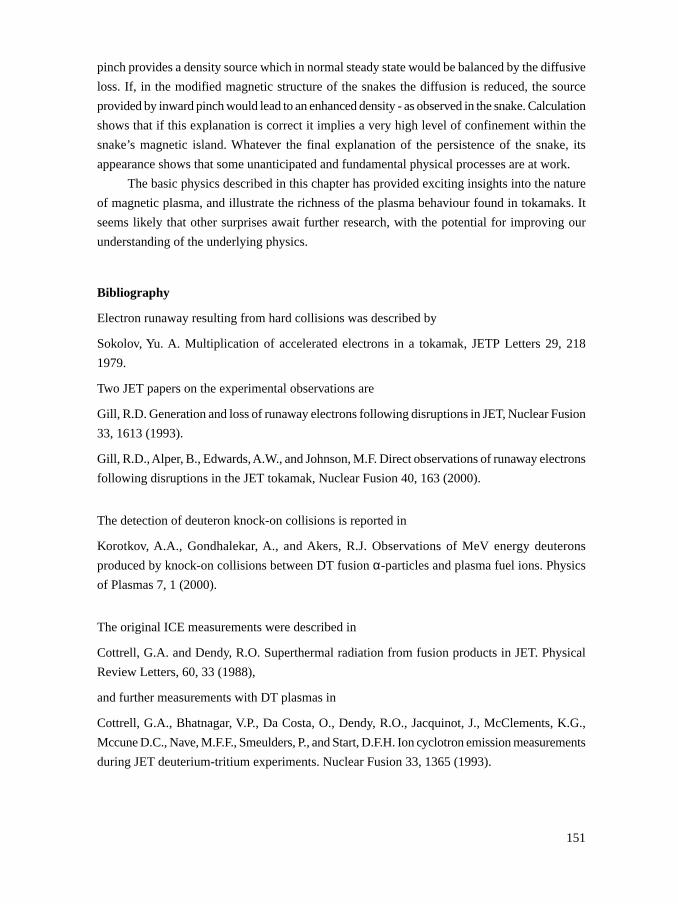
151
pinch provides a density source which in normal steady state would be balanced by the diffusive
loss. If, in the modified magnetic structure of the snakes the diffusion is reduced, the source
provided by inward pinch would lead to an enhanced density - as observed in the snake. Calculation
shows that if this explanation is correct it implies a very high level of confinement within the
snake’s magnetic island. Whatever the final explanation of the persistence of the snake, its
appearance shows that some unanticipated and fundamental physical processes are at work.
The basic physics described in this chapter has provided exciting insights into the nature
of magnetic plasma, and illustrate the richness of the plasma behaviour found in tokamaks. It
seems likely that other surprises await further research, with the potential for improving our
understanding of the underlying physics.
Bibliography
Electron runaway resulting from hard collisions was described by
Sokolov, Yu. A. Multiplication of accelerated electrons in a tokamak, JETP Letters 29, 218
1979.
Two JET papers on the experimental observations are
Gill, R.D. Generation and loss of runaway electrons following disruptions in JET, Nuclear Fusion
33, 1613 (1993).
Gill, R.D., Alper, B., Edwards, A.W., and Johnson, M.F. Direct observations of runaway electrons
following disruptions in the JET tokamak, Nuclear Fusion 40, 163 (2000).
The detection of deuteron knock-on collisions is reported in
Korotkov, A.A., Gondhalekar, A., and Akers, R.J. Observations of MeV energy deuterons
produced by knock-on collisions between DT fusion α-particles and plasma fuel ions. Physics
of Plasmas 7, 1 (2000).
The original ICE measurements were described in
Cottrell, G.A. and Dendy, R.O. Superthermal radiation from fusion products in JET. Physical
Review Letters, 60, 33 (1988),
and further measurements with DT plasmas in
Cottrell, G.A., Bhatnagar, V.P., Da Costa, O., Dendy, R.O., Jacquinot, J., McClements, K.G.,
Mccune D.C., Nave, M.F.F., Smeulders, P., and Start, D.F.H. Ion cyclotron emission measurements
during JET deuterium-tritium experiments. Nuclear Fusion 33, 1365 (1993).
152
The measurement of damping of TAEs excited by external antennas was reported in
Fasoli, A. et al. Direct measurement of the damping of toroidicity-induced Alfvén eigenmodes,
Physical Review Letters, 75, 645 (1995),
and the observation of kinetic TAEs in
Fasoli, A. et al. Observations of multiple kinetic Alfvén eigenmodes. Physical Review Letters
76, 1067 (1996).
The non-linear splitting of TAEs in JET is described in
Fasoli, A., Breizman, B.N., Borba, D., Heeter, R.F., Pekker, M.S., and Sharapov, S.E. Nonlinear
splittng of fast particle driven waves in a plasma: observation and theory. Physical Review
Letters 81, 5564 (1998).
The papers dealing with snakes are
Weller, A., Cheetham, A.D., Edwards, A.W., Gill, R.D., Gondhalekar, A., Granetz, R.S.,
Snipes, J., and Wesson, J. Persistant density perturbations at rational-q surfaces following pellet
injection in the Joint European Torus. Physical Review Letters 59, 2303 (1987).
Gill, R.D., Edwards, A.W., Pasini, D., and Weller, A. Snake-like density perturbations in JET,
Nuclear Fusion 32, 723 (1992).
Wesson, J.A. Snakes, Plasma Physics and Controlled fusion 37, A337 (1995).
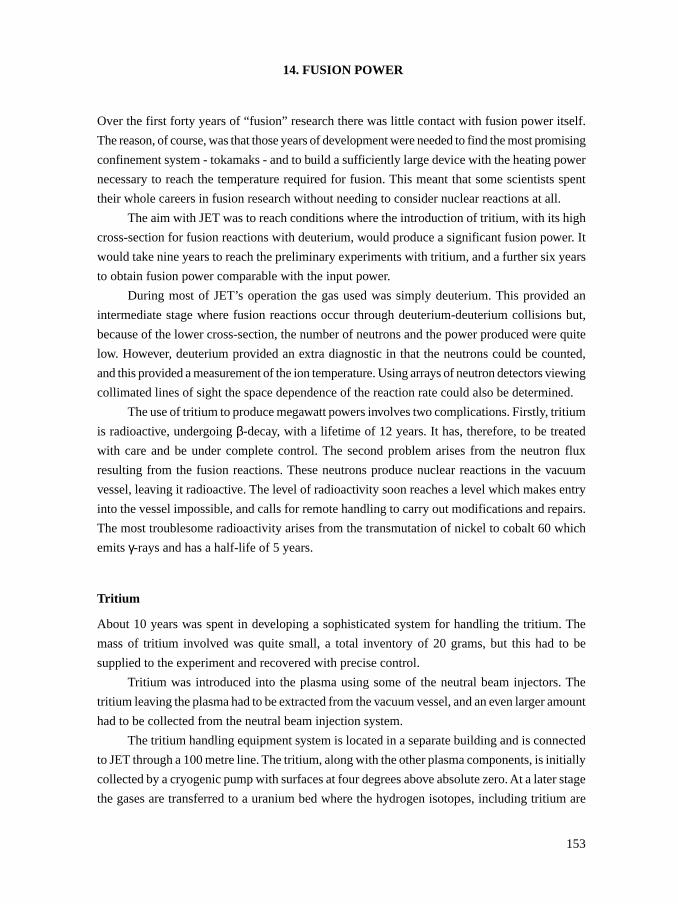
153
14. FUSION POWER
Over the first forty years of “fusion” research there was little contact with fusion power itself.
The reason, of course, was that those years of development were needed to find the most promising
confinement system - tokamaks - and to build a sufficiently large device with the heating power
necessary to reach the temperature required for fusion. This meant that some scientists spent
their whole careers in fusion research without needing to consider nuclear reactions at all.
The aim with JET was to reach conditions where the introduction of tritium, with its high
cross-section for fusion reactions with deuterium, would produce a significant fusion power. It
would take nine years to reach the preliminary experiments with tritium, and a further six years
to obtain fusion power comparable with the input power.
During most of JET’s operation the gas used was simply deuterium. This provided an
intermediate stage where fusion reactions occur through deuterium-deuterium collisions but,
because of the lower cross-section, the number of neutrons and the power produced were quite
low. However, deuterium provided an extra diagnostic in that the neutrons could be counted,
and this provided a measurement of the ion temperature. Using arrays of neutron detectors viewing
collimated lines of sight the space dependence of the reaction rate could also be determined.
The use of tritium to produce megawatt powers involves two complications. Firstly, tritium
is radioactive, undergoing β-decay, with a lifetime of 12 years. It has, therefore, to be treated
with care and be under complete control. The second problem arises from the neutron flux
resulting from the fusion reactions. These neutrons produce nuclear reactions in the vacuum
vessel, leaving it radioactive. The level of radioactivity soon reaches a level which makes entry
into the vessel impossible, and calls for remote handling to carry out modifications and repairs.
The most troublesome radioactivity arises from the transmutation of nickel to cobalt 60 which
emits γ-rays and has a half-life of 5 years.
Tritium
About 10 years was spent in developing a sophisticated system for handling the tritium. The
mass of tritium involved was quite small, a total inventory of 20 grams, but this had to be
supplied to the experiment and recovered with precise control.
Tritium was introduced into the plasma using some of the neutral beam injectors. The
tritium leaving the plasma had to be extracted from the vacuum vessel, and an even larger amount
had to be collected from the neutral beam injection system.
The tritium handling equipment system is located in a separate building and is connected
to JET through a 100 metre line. The tritium, along with the other plasma components, is initially
collected by a cryogenic pump with surfaces at four degrees above absolute zero. At a later stage
the gases are transferred to a uranium bed where the hydrogen isotopes, including tritium are
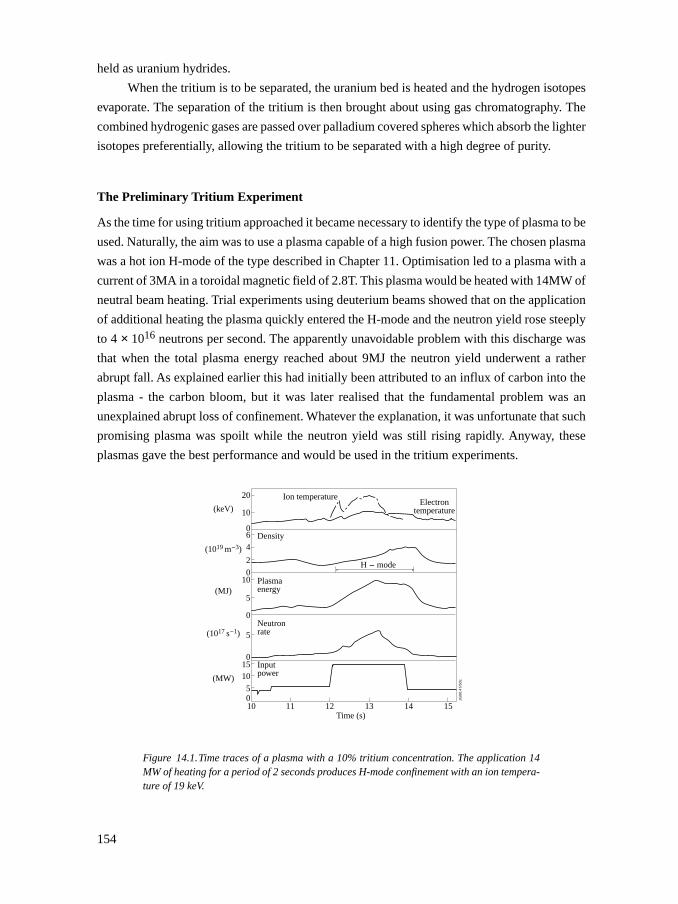
154
held as uranium hydrides.
When the tritium is to be separated, the uranium bed is heated and the hydrogen isotopes
evaporate. The separation of the tritium is then brought about using gas chromatography. The
combined hydrogenic gases are passed over palladium covered spheres which absorb the lighter
isotopes preferentially, allowing the tritium to be separated with a high degree of purity.
The Preliminary Tritium Experiment
As the time for using tritium approached it became necessary to identify the type of plasma to be
used. Naturally, the aim was to use a plasma capable of a high fusion power. The chosen plasma
was a hot ion H-mode of the type described in Chapter 11. Optimisation led to a plasma with a
current of 3MA in a toroidal magnetic field of 2.8T. This plasma would be heated with 14MW of
neutral beam heating. Trial experiments using deuterium beams showed that on the application
of additional heating the plasma quickly entered the H-mode and the neutron yield rose steeply
to 4 × 10¹⁶ neutrons per second. The apparently unavoidable problem with this discharge was
that when the total plasma energy reached about 9MJ the neutron yield underwent a rather
abrupt fall. As explained earlier this had initially been attributed to an influx of carbon into the
plasma - the carbon bloom, but it was later realised that the fundamental problem was an
unexplained abrupt loss of confinement. Whatever the explanation, it was unfortunate that such
promising plasma was spoilt while the neutron yield was still rising rapidly. Anyway, these
plasmas gave the best performance and would be used in the tritium experiments.
Figure 14.1. Time traces of a plasma with a 10% tritium concentration. The application 14MW of heating for a period of 2 seconds produces H-mode confinement with an ion tempera-ture of 19 keV.
20
(keV)
(1019 m-3)
(MJ)
(1017 s-1)
(MW)
10
06
4
2
010
5
0
5
01510
Ion temperatureElectron
temperature
Density
H - mode
Plasmaenergy
Neutronrate
10 11 12Time (s)
13 14 15
JG00
.47/
50c
Inputpower
50
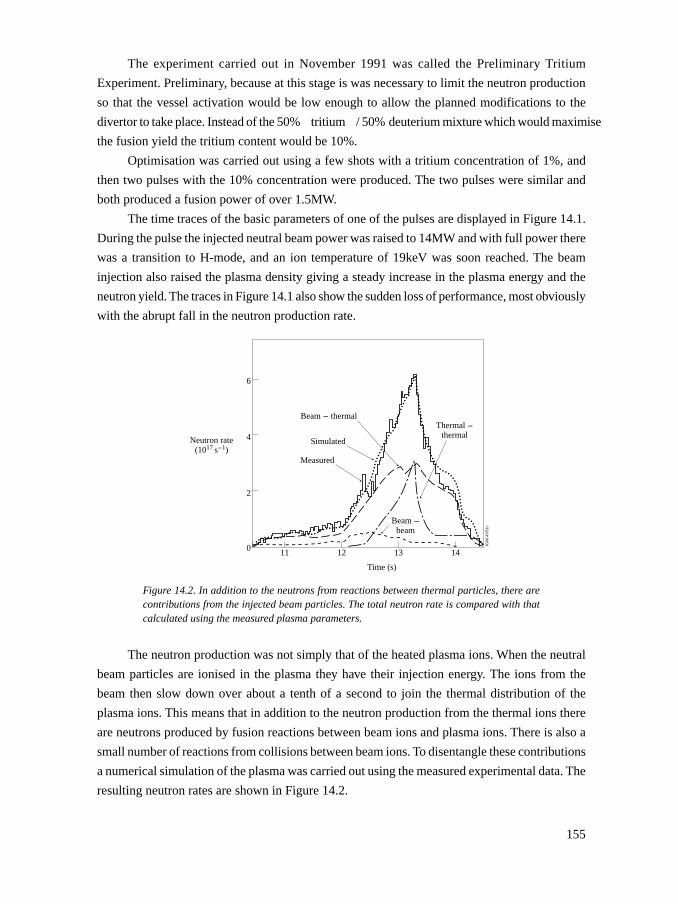
155
The experiment carried out in November 1991 was called the Preliminary Tritium
Experiment. Preliminary, because at this stage is was necessary to limit the neutron production
so that the vessel activation would be low enough to allow the planned modifications to the
divertor to take place. Instead of the 50% tritium / 50% deuterium mixture which would maximise
the fusion yield the tritium content would be 10%.
Optimisation was carried out using a few shots with a tritium concentration of 1%, and
then two pulses with the 10% concentration were produced. The two pulses were similar and
both produced a fusion power of over 1.5MW.
The time traces of the basic parameters of one of the pulses are displayed in Figure 14.1.
During the pulse the injected neutral beam power was raised to 14MW and with full power there
was a transition to H-mode, and an ion temperature of 19keV was soon reached. The beam
injection also raised the plasma density giving a steady increase in the plasma energy and the
neutron yield. The traces in Figure 14.1 also show the sudden loss of performance, most obviously
with the abrupt fall in the neutron production rate.
Figure 14.2. In addition to the neutrons from reactions between thermal particles, there arecontributions from the injected beam particles. The total neutron rate is compared with thatcalculated using the measured plasma parameters.
The neutron production was not simply that of the heated plasma ions. When the neutral
beam particles are ionised in the plasma they have their injection energy. The ions from the
beam then slow down over about a tenth of a second to join the thermal distribution of the
plasma ions. This means that in addition to the neutron production from the thermal ions there
are neutrons produced by fusion reactions between beam ions and plasma ions. There is also a
small number of reactions from collisions between beam ions. To disentangle these contributions
a numerical simulation of the plasma was carried out using the measured experimental data. The
resulting neutron rates are shown in Figure 14.2.
6
4
2
0 11 12 13 14
Neutron rate(1017 s-1)
Time (s)
JG00
.47/
51c
Simulated
Beam - thermal
Measured
Thermal -thermal
Beam -beam
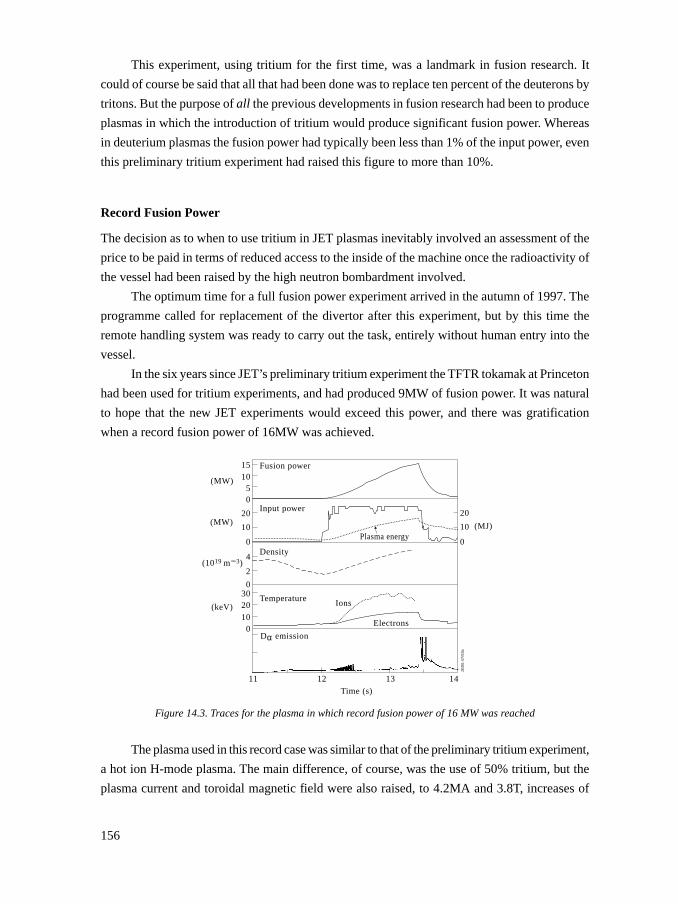
156
This experiment, using tritium for the first time, was a landmark in fusion research. It
could of course be said that all that had been done was to replace ten percent of the deuterons by
tritons. But the purpose of all the previous developments in fusion research had been to produce
plasmas in which the introduction of tritium would produce significant fusion power. Whereas
in deuterium plasmas the fusion power had typically been less than 1% of the input power, even
this preliminary tritium experiment had raised this figure to more than 10%.
Record Fusion Power
The decision as to when to use tritium in JET plasmas inevitably involved an assessment of the
price to be paid in terms of reduced access to the inside of the machine once the radioactivity of
the vessel had been raised by the high neutron bombardment involved.
The optimum time for a full fusion power experiment arrived in the autumn of 1997. The
programme called for replacement of the divertor after this experiment, but by this time the
remote handling system was ready to carry out the task, entirely without human entry into the
vessel.
In the six years since JET’s preliminary tritium experiment the TFTR tokamak at Princeton
had been used for tritium experiments, and had produced 9MW of fusion power. It was natural
to hope that the new JET experiments would exceed this power, and there was gratification
when a record fusion power of 16MW was achieved.
Figure 14.3. Traces for the plasma in which record fusion power of 16 MW was reached
The plasma used in this record case was similar to that of the preliminary tritium experiment,
a hot ion H-mode plasma. The main difference, of course, was the use of 50% tritium, but the
plasma current and toroidal magnetic field were also raised, to 4.2MA and 3.8T, increases of
10
05
15
20 20
10
0
Fusion power
Input power
Density
Temperature
Electrons
Ions
Dα emission
10
0
4
2
0
0102030
11 12 13 14
(keV)
(1019 m-3)
(MW) (MJ)
(MW)
Time (s)
Plasma energy
JG0
0.4
7/5
3c
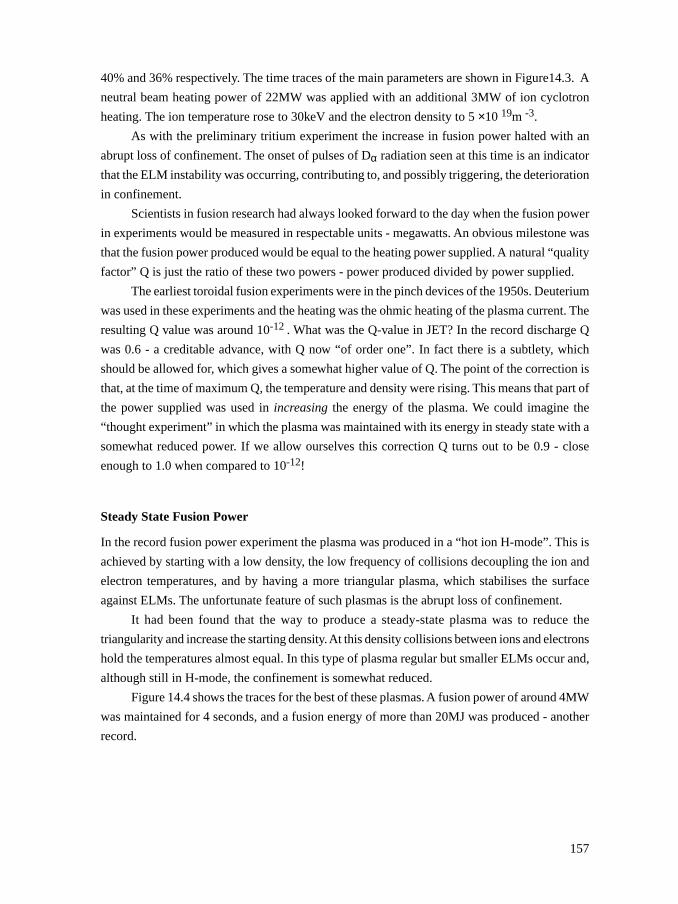
157
40% and 36% respectively. The time traces of the main parameters are shown in Figure14.3. A
neutral beam heating power of 22MW was applied with an additional 3MW of ion cyclotron
heating. The ion temperature rose to 30keV and the electron density to 5 ×10 19m -3.
As with the preliminary tritium experiment the increase in fusion power halted with an
abrupt loss of confinement. The onset of pulses of Dα radiation seen at this time is an indicator
that the ELM instability was occurring, contributing to, and possibly triggering, the deterioration
in confinement.
Scientists in fusion research had always looked forward to the day when the fusion power
in experiments would be measured in respectable units - megawatts. An obvious milestone was
that the fusion power produced would be equal to the heating power supplied. A natural “quality
factor” Q is just the ratio of these two powers - power produced divided by power supplied.
The earliest toroidal fusion experiments were in the pinch devices of the 1950s. Deuterium
was used in these experiments and the heating was the ohmic heating of the plasma current. The
resulting Q value was around 10-12 . What was the Q-value in JET? In the record discharge Q
was 0.6 - a creditable advance, with Q now “of order one”. In fact there is a subtlety, which
should be allowed for, which gives a somewhat higher value of Q. The point of the correction is
that, at the time of maximum Q, the temperature and density were rising. This means that part of
the power supplied was used in increasing the energy of the plasma. We could imagine the
“thought experiment” in which the plasma was maintained with its energy in steady state with a
somewhat reduced power. If we allow ourselves this correction Q turns out to be 0.9 - close
enough to 1.0 when compared to 10-12!
Steady State Fusion Power
In the record fusion power experiment the plasma was produced in a “hot ion H-mode”. This is
achieved by starting with a low density, the low frequency of collisions decoupling the ion and
electron temperatures, and by having a more triangular plasma, which stabilises the surface
against ELMs. The unfortunate feature of such plasmas is the abrupt loss of confinement.
It had been found that the way to produce a steady-state plasma was to reduce the
triangularity and increase the starting density. At this density collisions between ions and electrons
hold the temperatures almost equal. In this type of plasma regular but smaller ELMs occur and,
although still in H-mode, the confinement is somewhat reduced.
Figure 14.4 shows the traces for the best of these plasmas. A fusion power of around 4MW
was maintained for 4 seconds, and a fusion energy of more than 20MJ was produced - another
record.
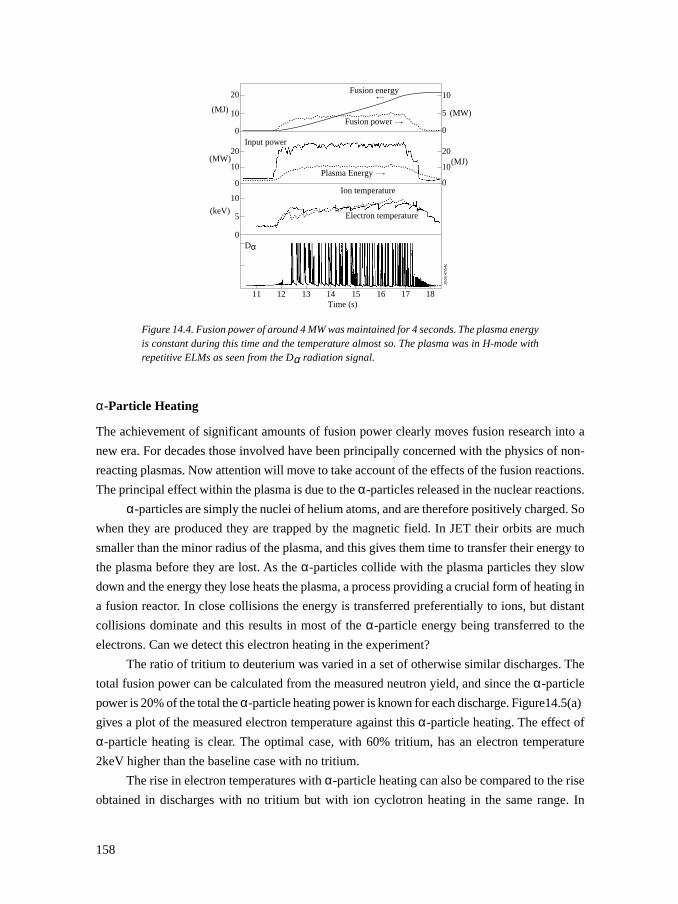
158
Figure 14.4. Fusion power of around 4 MW was maintained for 4 seconds. The plasma energyis constant during this time and the temperature almost so. The plasma was in H-mode withrepetitive ELMs as seen from the Dα radiation signal.
α-Particle Heating
The achievement of significant amounts of fusion power clearly moves fusion research into a
new era. For decades those involved have been principally concerned with the physics of non-
reacting plasmas. Now attention will move to take account of the effects of the fusion reactions.
The principal effect within the plasma is due to the α-particles released in the nuclear reactions.
α-particles are simply the nuclei of helium atoms, and are therefore positively charged. So
when they are produced they are trapped by the magnetic field. In JET their orbits are much
smaller than the minor radius of the plasma, and this gives them time to transfer their energy to
the plasma before they are lost. As the α-particles collide with the plasma particles they slow
down and the energy they lose heats the plasma, a process providing a crucial form of heating in
a fusion reactor. In close collisions the energy is transferred preferentially to ions, but distant
collisions dominate and this results in most of the α-particle energy being transferred to the
electrons. Can we detect this electron heating in the experiment?
The ratio of tritium to deuterium was varied in a set of otherwise similar discharges. The
total fusion power can be calculated from the measured neutron yield, and since the α-particle
power is 20% of the total the α-particle heating power is known for each discharge. Figure14.5(a)
gives a plot of the measured electron temperature against this α-particle heating. The effect of
α-particle heating is clear. The optimal case, with 60% tritium, has an electron temperature
2keV higher than the baseline case with no tritium.
The rise in electron temperatures with α-particle heating can also be compared to the rise
obtained in discharges with no tritium but with ion cyclotron heating in the same range. In
20
10
0
10
5
0
20
Fusion energy
Electron temperature
Fusion power
Ion temperature
Plasma Energy10
0
10
5
0
11 12 13 14Time (s)
15 16 17 18
(keV)
(MW)
(MJ) (MW)
Input power
Dα
20
10(MJ)
JG00
.47/
54c
0
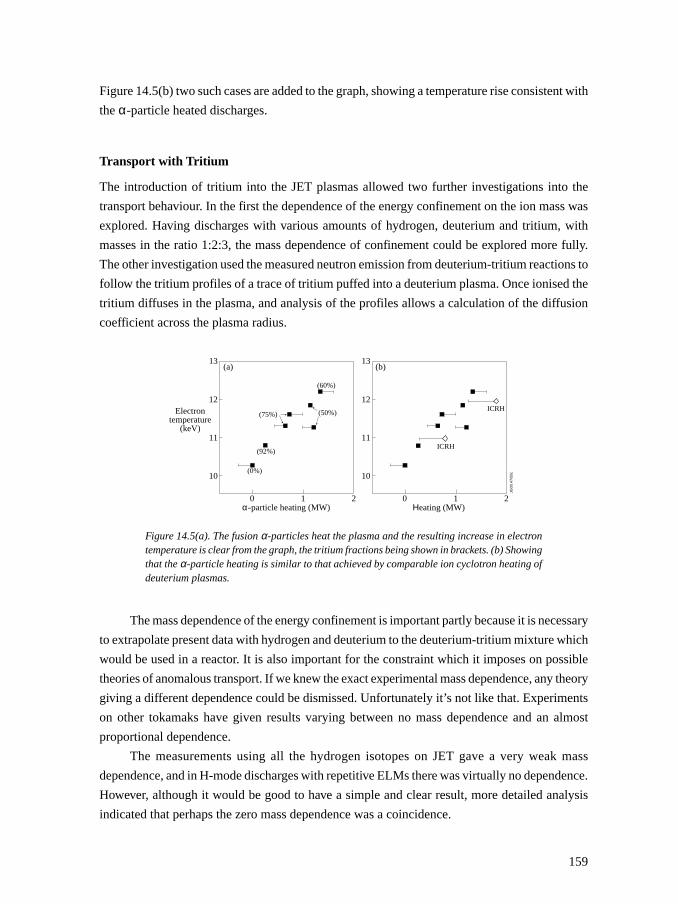
159
Figure 14.5(b) two such cases are added to the graph, showing a temperature rise consistent with
the α-particle heated discharges.
Transport with Tritium
The introduction of tritium into the JET plasmas allowed two further investigations into the
transport behaviour. In the first the dependence of the energy confinement on the ion mass was
explored. Having discharges with various amounts of hydrogen, deuterium and tritium, with
masses in the ratio 1:2:3, the mass dependence of confinement could be explored more fully.
The other investigation used the measured neutron emission from deuterium-tritium reactions to
follow the tritium profiles of a trace of tritium puffed into a deuterium plasma. Once ionised the
tritium diffuses in the plasma, and analysis of the profiles allows a calculation of the diffusion
coefficient across the plasma radius.
Figure 14.5(a). The fusion α-particles heat the plasma and the resulting increase in electrontemperature is clear from the graph, the tritium fractions being shown in brackets. (b) Showingthat the α-particle heating is similar to that achieved by comparable ion cyclotron heating ofdeuterium plasmas.
The mass dependence of the energy confinement is important partly because it is necessary
to extrapolate present data with hydrogen and deuterium to the deuterium-tritium mixture which
would be used in a reactor. It is also important for the constraint which it imposes on possible
theories of anomalous transport. If we knew the exact experimental mass dependence, any theory
giving a different dependence could be dismissed. Unfortunately it’s not like that. Experiments
on other tokamaks have given results varying between no mass dependence and an almost
proportional dependence.
The measurements using all the hydrogen isotopes on JET gave a very weak mass
dependence, and in H-mode discharges with repetitive ELMs there was virtually no dependence.
However, although it would be good to have a simple and clear result, more detailed analysis
indicated that perhaps the zero mass dependence was a coincidence.
ICRH
ICRH
Electrontemperature
(keV)
JG00
.47/
55c
(60%)
(50%)(75%)
(92%)
(0%)
0 1α-particle heating (MW)
2
13(a)
12
11
10
0 1Ηeating (MW)
2
13(b)
12
11
10
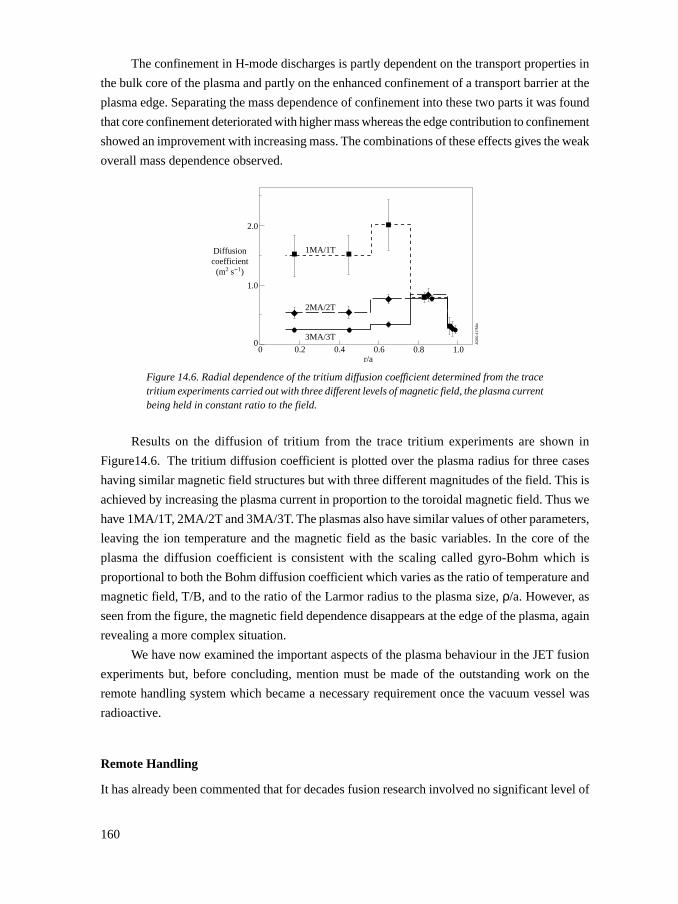
160
The confinement in H-mode discharges is partly dependent on the transport properties in
the bulk core of the plasma and partly on the enhanced confinement of a transport barrier at the
plasma edge. Separating the mass dependence of confinement into these two parts it was found
that core confinement deteriorated with higher mass whereas the edge contribution to confinement
showed an improvement with increasing mass. The combinations of these effects gives the weak
overall mass dependence observed.
Figure 14.6. Radial dependence of the tritium diffusion coefficient determined from the tracetritium experiments carried out with three different levels of magnetic field, the plasma currentbeing held in constant ratio to the field.
Results on the diffusion of tritium from the trace tritium experiments are shown in
Figure14.6. The tritium diffusion coefficient is plotted over the plasma radius for three cases
having similar magnetic field structures but with three different magnitudes of the field. This is
achieved by increasing the plasma current in proportion to the toroidal magnetic field. Thus we
have 1MA/1T, 2MA/2T and 3MA/3T. The plasmas also have similar values of other parameters,
leaving the ion temperature and the magnetic field as the basic variables. In the core of the
plasma the diffusion coefficient is consistent with the scaling called gyro-Bohm which is
proportional to both the Bohm diffusion coefficient which varies as the ratio of temperature and
magnetic field, T/B, and to the ratio of the Larmor radius to the plasma size, ρ/a. However, as
seen from the figure, the magnetic field dependence disappears at the edge of the plasma, again
revealing a more complex situation.
We have now examined the important aspects of the plasma behaviour in the JET fusion
experiments but, before concluding, mention must be made of the outstanding work on the
remote handling system which became a necessary requirement once the vacuum vessel was
radioactive.
Remote Handling
It has already been commented that for decades fusion research involved no significant level of
0 0.2 0.4 0.6 0.8 1.00
1.0
2.0
Diffusioncoefficient
(m2 s-1)
r/a
JG00
.47/
56c
1MA/1T
2MA/2T
3MA/3T
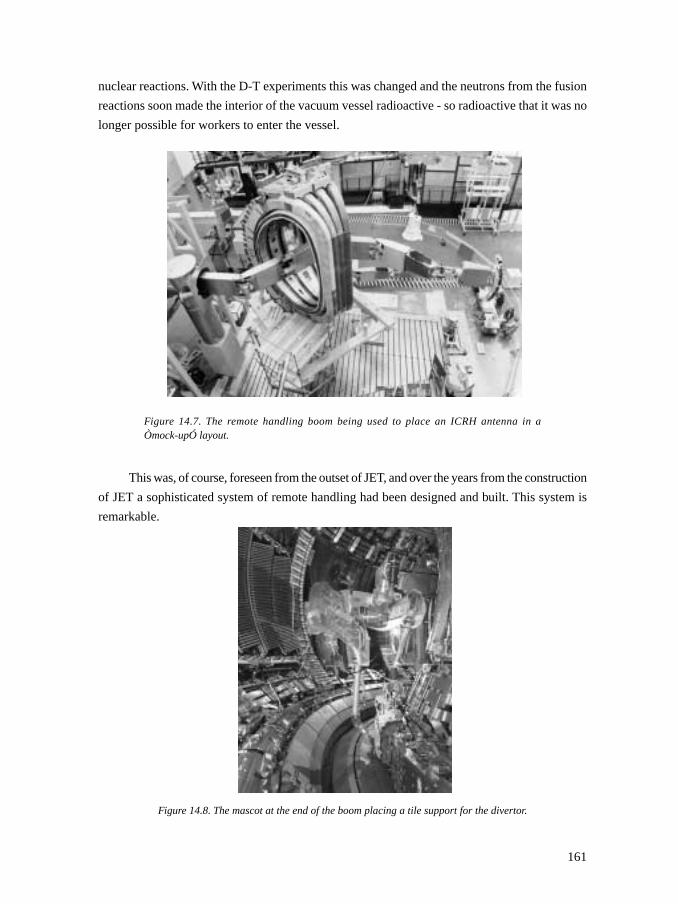
161
nuclear reactions. With the D-T experiments this was changed and the neutrons from the fusion
reactions soon made the interior of the vacuum vessel radioactive - so radioactive that it was no
longer possible for workers to enter the vessel.
Figure 14.7. The remote handling boom being used to place an ICRH antenna in aÒmock-upÓ layout.
This was, of course, foreseen from the outset of JET, and over the years from the construction
of JET a sophisticated system of remote handling had been designed and built. This system is
remarkable.
Figure 14.8. The mascot at the end of the boom placing a tile support for the divertor.
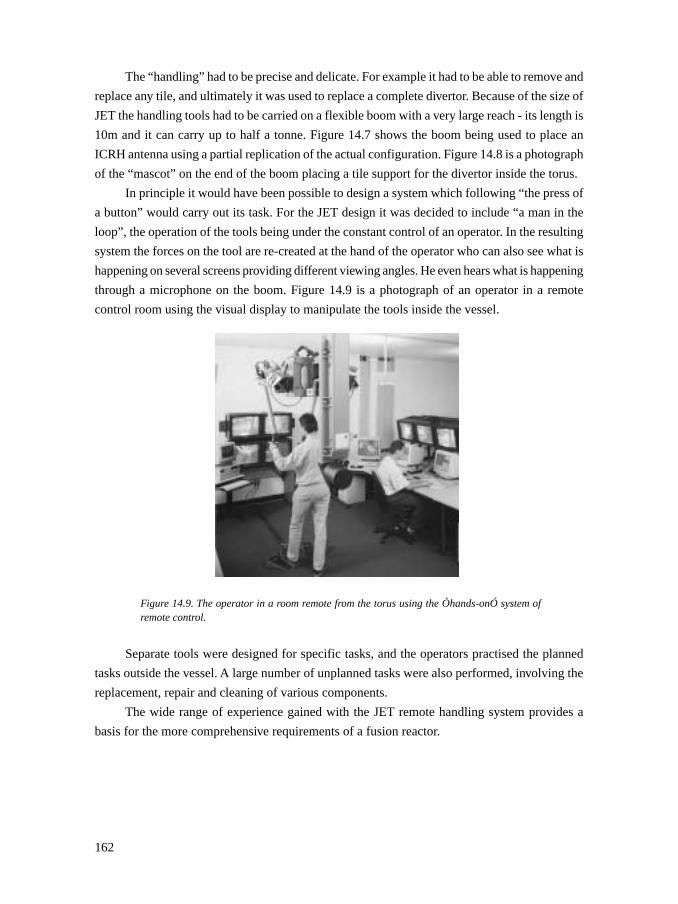
162
The “handling” had to be precise and delicate. For example it had to be able to remove and
replace any tile, and ultimately it was used to replace a complete divertor. Because of the size of
JET the handling tools had to be carried on a flexible boom with a very large reach - its length is
10m and it can carry up to half a tonne. Figure 14.7 shows the boom being used to place an
ICRH antenna using a partial replication of the actual configuration. Figure 14.8 is a photograph
of the “mascot” on the end of the boom placing a tile support for the divertor inside the torus.
In principle it would have been possible to design a system which following “the press of
a button” would carry out its task. For the JET design it was decided to include “a man in the
loop”, the operation of the tools being under the constant control of an operator. In the resulting
system the forces on the tool are re-created at the hand of the operator who can also see what is
happening on several screens providing different viewing angles. He even hears what is happening
through a microphone on the boom. Figure 14.9 is a photograph of an operator in a remote
control room using the visual display to manipulate the tools inside the vessel.
Figure 14.9. The operator in a room remote from the torus using the Òhands-onÓ system ofremote control.
Separate tools were designed for specific tasks, and the operators practised the planned
tasks outside the vessel. A large number of unplanned tasks were also performed, involving the
replacement, repair and cleaning of various components.
The wide range of experience gained with the JET remote handling system provides a
basis for the more comprehensive requirements of a fusion reactor.
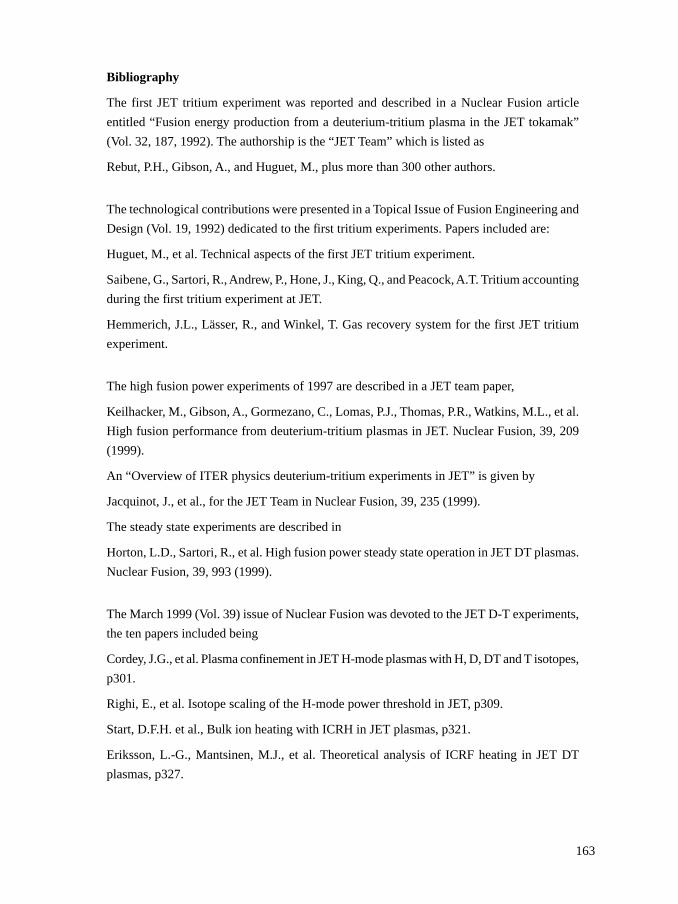
163
Bibliography
The first JET tritium experiment was reported and described in a Nuclear Fusion article
entitled “Fusion energy production from a deuterium-tritium plasma in the JET tokamak”
(Vol. 32, 187, 1992). The authorship is the “JET Team” which is listed as
Rebut, P.H., Gibson, A., and Huguet, M., plus more than 300 other authors.
The technological contributions were presented in a Topical Issue of Fusion Engineering and
Design (Vol. 19, 1992) dedicated to the first tritium experiments. Papers included are:
Huguet, M., et al. Technical aspects of the first JET tritium experiment.
Saibene, G., Sartori, R., Andrew, P., Hone, J., King, Q., and Peacock, A.T. Tritium accounting
during the first tritium experiment at JET.
Hemmerich, J.L., Lässer, R., and Winkel, T. Gas recovery system for the first JET tritium
experiment.
The high fusion power experiments of 1997 are described in a JET team paper,
Keilhacker, M., Gibson, A., Gormezano, C., Lomas, P.J., Thomas, P.R., Watkins, M.L., et al.
High fusion performance from deuterium-tritium plasmas in JET. Nuclear Fusion, 39, 209
(1999).
An “Overview of ITER physics deuterium-tritium experiments in JET” is given by
Jacquinot, J., et al., for the JET Team in Nuclear Fusion, 39, 235 (1999).
The steady state experiments are described in
Horton, L.D., Sartori, R., et al. High fusion power steady state operation in JET DT plasmas.
Nuclear Fusion, 39, 993 (1999).
The March 1999 (Vol. 39) issue of Nuclear Fusion was devoted to the JET D-T experiments,
the ten papers included being
Cordey, J.G., et al. Plasma confinement in JET H-mode plasmas with H, D, DT and T isotopes,
p301.
Righi, E., et al. Isotope scaling of the H-mode power threshold in JET, p309.
Start, D.F.H. et al., Bulk ion heating with ICRH in JET plasmas, p321.
Eriksson, L.-G., Mantsinen, M.J., et al. Theoretical analysis of ICRF heating in JET DT
plasmas, p327.
164
Bhatnagar, V.P., Lingertat, J., et al. Edge localised modes and edge pedestal in NBI and ICRF
heated H, D and T plasmas in JET, p353.
Parail, V.V., Guo, H.Y., and Lingertat, J. Fast particles and the edge transport barriers, p369.
Sharapov, S.E., et al. Stability of alpha particle driven Alfvén eigenmodes in high performance
JET DT plasmas, p373.
Cottrell, G.A., et al. Approach to steady state high performance in DD and DT plasmas with
optimised shear in JET, p407.
Parail, V.V., et al. Predictive modelling of JET optimised shear discharges, p429.
Further papers on the D-T experiments are
Thomas, P.R., et al. Observation of alpha heating in JET DT plasmas. Physical Review Letters
80, 5548 (1998)
Maggi, C.F., Monk, R.D., Horton, L.D., Borrass, K., Corrigan, G., Ingesson, L.C., König, R.W.T.,
Saibene, G., Smith, R.J., and Stamp, M.F. The isotope effect on the L-mode density limit in JET
hydrogen, deuterium and tritium divertor plasmas. Nuclear Fusion 39, 979 (1999).
Saibene, G., Horton, L.D., Sartori, R., et al. The influence of isotope mass, edge magnetic shear
and input power on high density ELMy H-modes in JET. Nuclear Fusion 39, 1157 (1999).
165
15. SUCCESS
It is now time to assess the JET experiment. We shall first review the achievements in terms of
the stated aims of JET listed in Chapter 4 and then take a broader view. We shall see that the
enormous advance in understanding that has been made over the years, both by JET and the
world’s other tokamaks, means that practically every area of the subject now involves issues
which were not even contemplated when the JET aims were specified.
First we look at the original aims of JET in turn, starting with the scaling of the plasma
behaviour with parameters approaching the reactor range.
Scaling of Plasma Behaviour
The central issue here was, and is, the energy-confinement time. The best tokamak in operation
when JET was proposed had a confinement time of tens of milliseconds. The step up to JET was
so large that JET’s confinement time was an open question, a very wide range of outcomes being
possible. It was then conceivable that the confinement time could be close to the neoclassical
value with the energy loss being determined simply by collisions - giving the best possible
confinement. In the other direction there was almost no limit to how bad the confinement might
turn out to be.
In the absence of knowledge, the simplest assumption was that confinement is determined
by a diffusive process and that the diffusion coefficients would be unchanged. The confinement
time would then scale as the cross-sectional area of the plasma. This assumption gave a
confinement time for JET of around one second. Given the enormous range of uncertainty this
estimate was remarkably good, the best confinement time in JET turning out to be 1.8 seconds.
However, one of the principal aims of JET was to replace such “back of envelope” estimates
by as much precision as could be extracted from the experiments. It is obvious that to obtain the
most reliable scaling law, results from as many tokamaks as possible should be included in the
analysis. This was carried out as an international collaborative effort, with the results from JET,
being the tokamak nearest to a reactor, playing a crucial role in the procedure. The results of this
massive endeavour were described in Chapter 11. Over the years the situation has been transformed
to one in which quite detailed features of the scaling laws are now debated.
Another role of JET has been to determine the scaling of the threshold power required for
transition to H-mode confinement. Since it is envisaged that a reactor will operate in H-mode it
is clearly important to know how much power would be needed to reach this mode. The existence
of H-mode confinement was unknown when the aims of JET were specified, this area of research
has been one of many which were unforeseen when JET was designed.
It is the reward of imaginative projects such as JET that they allow the exploration of such
unanticipated discoveries. Attention has now turned to the nature of the improved core confinement
166
which seems to be created by modifying the magnetic shear in the plasma, as described in
Chapter 11. This investigation clearly needs an accurate measurement of the magnetic field to
determine the magnetic shear and this has led to another development, the installation of a
system to measure the field using the motional Stark effect.
Plasma-Wall Interaction
The fact that this part of JET’s aims is given the name plasma-wall interaction indicates the way
the problem was seen during the design phase. The plasma would be bounded by limiters, and
there would be recycling of neutral particles between the plasma and the wall. The problem
would be to limit the influx of impurities arising from these interactions.
The actual outcome was that JET would dispense with limiters and concentrate on the
development of divertors. It should be mentioned, however, that even in the JET design report of
1975 it was intended that the effect of a divertor would be examined at some stage.
During the early phase of JET, studies with limiter discharges led to an understanding of
the scaling of the edge density and temperature with the plasma density in ohmically-heated
discharges. Studies were also made of the erosion and redisposition of the limiter surface material
and of the adsorbed deuterium.
The persistence of impurities in plasmas with limiters led to the conclusion that the flow
of particles and energy out of the plasma must be led to a surface more remote from the plasma,
where the impurities would be better controlled. There followed several years of divertor research
and development, during which a much deeper understanding of the requirements, and options,
for a reactor became clear.
The increasing level of understanding gave rise to three successive divertors in JET as
described in Chapter 12. The design finally settled on a divertor structure which confined the
neutral gas and impurities, and used the neutral gas to radiate the power flowing from the plasma,
preventing localised deposition of the heat. This meant that the heat load requirements on the
material surfaces was much reduced, making this a possible design for a reactor.
A crucial question raised in the original JET design report was the choice of materials for
the plasma facing surfaces. The metal beryllium offered the lowest possible nuclear charge Z.
Beryllium atoms have only four electrons, with the potential advantage of minimising the dilution
of the plasma. However, researchers had shied away from beryllium, largely because of its
toxicity. Nevertheless, such difficulties were overcome and beryllium was introduced into JET
both as tile material and by evaporation onto the other non-beryllium surfaces. The hoped for
improvement in the average Z value of the plasma was found, but surface melting of the beryllium
was also observed.
The other low-Z competitor was carbon. Carbon sublines rather than melts, and so the
problem of melting does not arise. It was possible to consider using carbon in a reactor if the
problem of releasing atoms from its surface under bombardment from the plasma could be
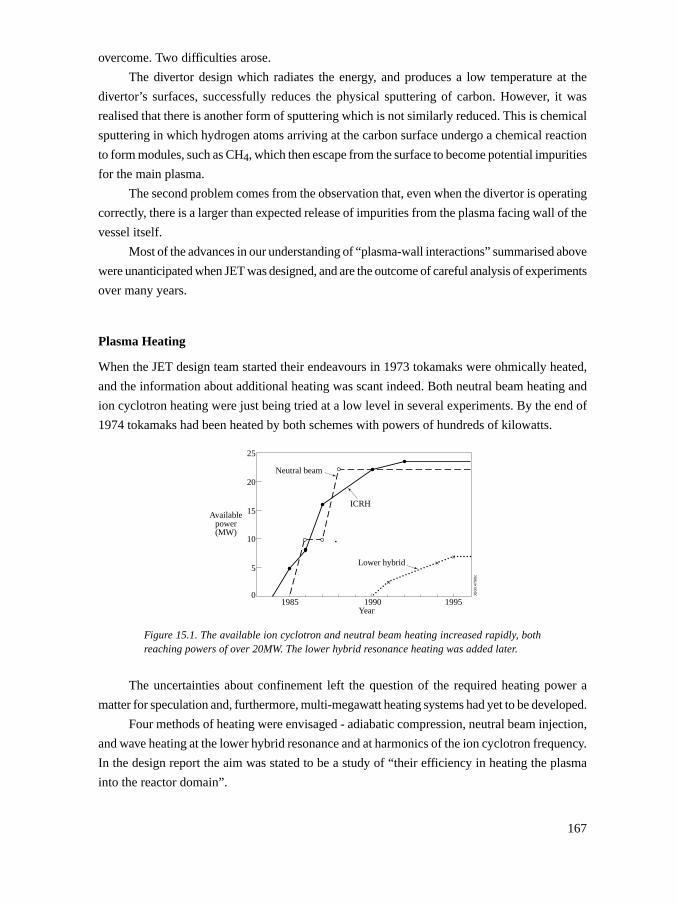
167
overcome. Two difficulties arose.
The divertor design which radiates the energy, and produces a low temperature at the
divertor’s surfaces, successfully reduces the physical sputtering of carbon. However, it was
realised that there is another form of sputtering which is not similarly reduced. This is chemical
sputtering in which hydrogen atoms arriving at the carbon surface undergo a chemical reaction
to form modules, such as CH4, which then escape from the surface to become potential impurities
for the main plasma.
The second problem comes from the observation that, even when the divertor is operating
correctly, there is a larger than expected release of impurities from the plasma facing wall of the
vessel itself.
Most of the advances in our understanding of “plasma-wall interactions” summarised above
were unanticipated when JET was designed, and are the outcome of careful analysis of experiments
over many years.
Plasma Heating
When the JET design team started their endeavours in 1973 tokamaks were ohmically heated,
and the information about additional heating was scant indeed. Both neutral beam heating and
ion cyclotron heating were just being tried at a low level in several experiments. By the end of
1974 tokamaks had been heated by both schemes with powers of hundreds of kilowatts.
Figure 15.1. The available ion cyclotron and neutral beam heating increased rapidly, bothreaching powers of over 20MW. The lower hybrid resonance heating was added later.
The uncertainties about confinement left the question of the required heating power a
matter for speculation and, furthermore, multi-megawatt heating systems had yet to be developed.
Four methods of heating were envisaged - adiabatic compression, neutral beam injection,
and wave heating at the lower hybrid resonance and at harmonics of the ion cyclotron frequency.
In the design report the aim was stated to be a study of “their efficiency in heating the plasma
into the reactor domain”.
JG00
.47/
60c
19850
25
20
15
10
5
Year19951990
Availablepower(MW)
ICRH
Neutral beam
Lower hybrid
+
++
168
The experiments on compression heating were unfruitful, and significant lower-hybrid
heating was only introduced after ten years of JET operation. The development of the other two
schemes - neutral beam injection and ion cyclotron heating - was very successful, the power
available increasing rapidly. The first heating was 5 megawatts by ICRH in 1985 and 10 megawatts
of neutral beam heating in 1986. By 1988 both systems could supply about 20 megawatts. A
graph showing how the available power developed is given in Figure 15.1.
In addition to providing powerful heating, the ion cyclotron system led to the discovery of
fast particle stabilisation of the sawtooth instability. Its capability to drive plasma current, and to
do this in a controlled way, also allowed sawtooth stabilisation by local modification of the
current profile. The ability to control the location of the deposition with ion cyclotron heating is
one of its assets. However, the requirement of achieving efficient coupling to the plasma makes
it less flexible than neutral beam injection.
The neutral beam heating system turned out to be extremely reliable, and it became the
basic work-horse of plasma heating. The system achieved an unanticipated success when it was
used to inject the tritium in the two sets of deuterium - tritium experiments.
The heating systems transformed plasmas with ion temperatures of a few keV to plasmas
producing megawatts of thermonuclear power at temperatures up to 30keV. Because their
development went so well this achievement tends to be taken for granted. We must remember
that success was not guaranteed, and depended on the solution of many complex design problems.
α-particle Production, Confinement and Plasma Heating
The studies of the behaviour of α-particles produced by fusion reactions in JET mark the early
steps in the understanding of this crucial aspect of fusion reactors.
The rate of α-particle production in the deuterium - tritium experiments is easily measured
by counting the 14 MeV neutrons which are produced at the same rate. Calculation of the expected
rate is, however, more complex. The injected fast ions undergo fusion reactions before they are
thermalised and so, in addition to the neutrons from the thermal plasma, there are neutrons from
reactions between the fast ions and the plasma, and from reactions between the fast ions
themselves.
Calculations taking account of the ion temperature, the beam injection and the beam slowing
are found to give a neutron, and therefore α-particle, production rate which is consistent with
that measured. A time trace of the calculated and observed neutron rate for a discharge with peak
fusion power of 16MW is shown in Figure 15.2.
In the high fusion power plasmas, heating of the plasma by the α-particles was observed
as described in Chapter 14. The level of heating is not accurately known but comparison with
similar discharges using deuterium alone, with ion cyclotron heating substituted for α-particle
heating, indicated that the energy of the α-particles is transferred mainly to the plasma. This is
encouraging because it implies that the α-particles are confined for a time at least long enough
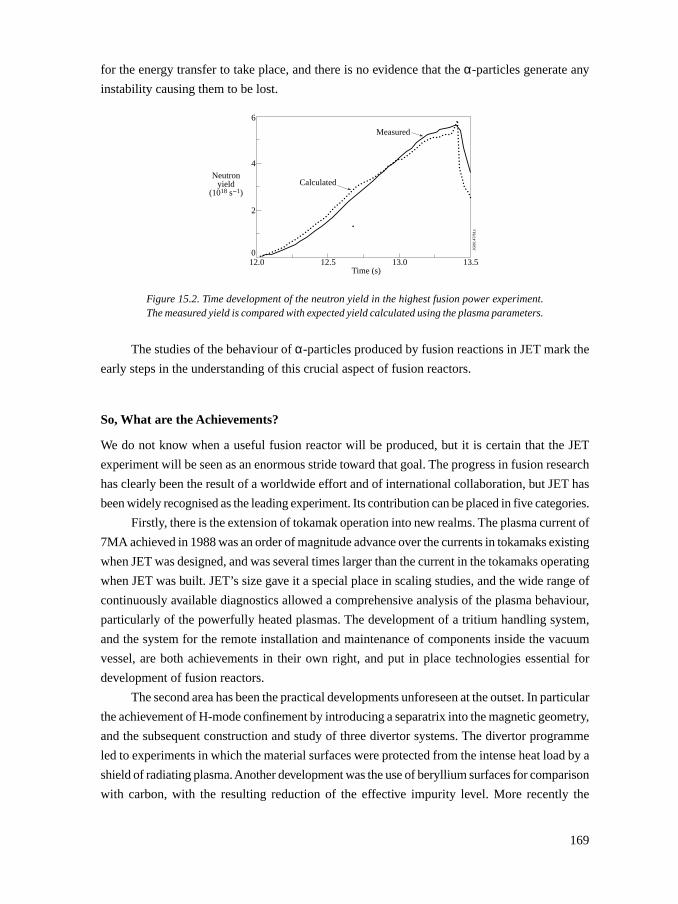
169
for the energy transfer to take place, and there is no evidence that the α-particles generate any
instability causing them to be lost.
Figure 15.2. Time development of the neutron yield in the highest fusion power experiment.The measured yield is compared with expected yield calculated using the plasma parameters.
The studies of the behaviour of α-particles produced by fusion reactions in JET mark the
early steps in the understanding of this crucial aspect of fusion reactors.
So, What are the Achievements?
We do not know when a useful fusion reactor will be produced, but it is certain that the JET
experiment will be seen as an enormous stride toward that goal. The progress in fusion research
has clearly been the result of a worldwide effort and of international collaboration, but JET has
been widely recognised as the leading experiment. Its contribution can be placed in five categories.
Firstly, there is the extension of tokamak operation into new realms. The plasma current of
7MA achieved in 1988 was an order of magnitude advance over the currents in tokamaks existing
when JET was designed, and was several times larger than the current in the tokamaks operating
when JET was built. JET’s size gave it a special place in scaling studies, and the wide range of
continuously available diagnostics allowed a comprehensive analysis of the plasma behaviour,
particularly of the powerfully heated plasmas. The development of a tritium handling system,
and the system for the remote installation and maintenance of components inside the vacuum
vessel, are both achievements in their own right, and put in place technologies essential for
development of fusion reactors.
The second area has been the practical developments unforeseen at the outset. In particular
the achievement of H-mode confinement by introducing a separatrix into the magnetic geometry,
and the subsequent construction and study of three divertor systems. The divertor programme
led to experiments in which the material surfaces were protected from the intense heat load by a
shield of radiating plasma. Another development was the use of beryllium surfaces for comparison
with carbon, with the resulting reduction of the effective impurity level. More recently the
JG00
.47/
61c
12.00
6
4
2
12.5Time (s)
13.0 13.5
Neutronyield
(1018 s-1)Calculated
Measured
170
appearance of regions of high confinement within the plasma under conditions of low magnitude
shear has led to a massive and continuing effort, both to understand and to utilise this unexpected
good fortune.
The third area is perhaps best described as “learning by doing”. The most dramatic example
was the discovery of the effect of the loss of control of the so-called vertical instability. The
plasma is normally held rigidly in place by a feedback system, but when this system was fooled
by the instability a force of hundreds of tons was unleashed, and a complex of new problems had
to be resolved. A careful study was also made of the pattern and mechanism of the disruptive
instability, demonstrating the role of radiation in producing an unstable configuration. The most
severe collapse of the plasma current in disruptions was shown to be due, not to plasma turbulence
as had been previously assumed but rather to the, more mundane, sudden influx of impurities.
Another, somewhat surprising, cause of disruptions was the presence of very small “errors” in
the magnetic field arising from slight asymmetries in the field coils. All of these discoveries
have implications for reactors, and it was important that they be uncovered at this stage.
The fourth category of achievements consists of the many experimental results which
were unexpected and which have a clear scientific content. Among these results, those connected
with the confinement and transport of plasma energy are quite mysterious and unexplained. One
example is the H-mode onset, which was thought to occur through the sudden appearance of a
transport barrier at the plasma edge. The discovery that, at the onset, the transport can be affected
simultaneously over a large part of the plasma was unexpected and still not explained. Another
unexplained phenomenon is the sudden change in the thermal conductivity by a factor three
over the whole plasma at the time of the “X-event”. The careful analysis of sawtooth oscillations
on JET has transformed our understanding of the subject. The measured soft X-ray emission has
shown that the geometry of the instability and its growth rate are quite different from those
expected. The observation that the suddenness of the onset of the sawtooth collapse, as with the
ELM instability, was completely contrary to existing theory has led to the recognition of this
“trigger problem” as a fundamental challenge to plasma theory. The discovery of the motional
Stark effect in the spectrum emitted from JET led to its use in measuring the magnetic field, and
the analysis of neutral particles leaving the plasma led to the identification of highly energetic
deuterons produced in collisions with fusion α-particles. These examples are just some of the
highlights of scientific study of the JET plasmas which has been pursued in parallel with the
performance oriented programme.
Finally the major success has been the fulfilment of the stated aim of obtaining and studying
plasma in conditions and dimensions approaching those needed in a thermonuclear reactor - as
summarised above under the headings ‘scaling of plasma behaviour’, ‘plasma-wall interaction’,
‘plasma heating’, and ‘α-particle production, confinement, and plasma heating’. This work,
with the achievement of plasma conditions which produce fusion power comparable to the heating
power, has enabled us to envisage what at reactor would be like and how it would behave.
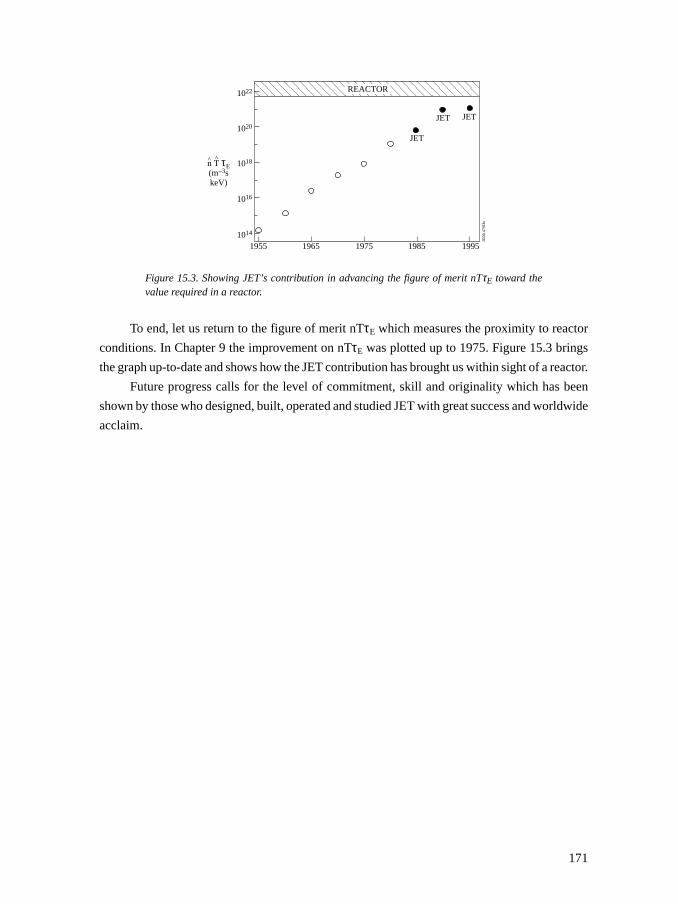
171
REACTOR1022
1020
1018
1016
1014
1955 1965 1985 19951975
JET
JET JET
JG00
.47/
63c
n T τE(m–3skeV)
^^
Figure 15.3. Showing JET’s contribution in advancing the figure of merit nTτE toward thevalue required in a reactor.
To end, let us return to the figure of merit nTτE which measures the proximity to reactor
conditions. In Chapter 9 the improvement on nTτE was plotted up to 1975. Figure 15.3 brings
the graph up-to-date and shows how the JET contribution has brought us within sight of a reactor.
Future progress calls for the level of commitment, skill and originality which has been
shown by those who designed, built, operated and studied JET with great success and worldwide
acclaim.
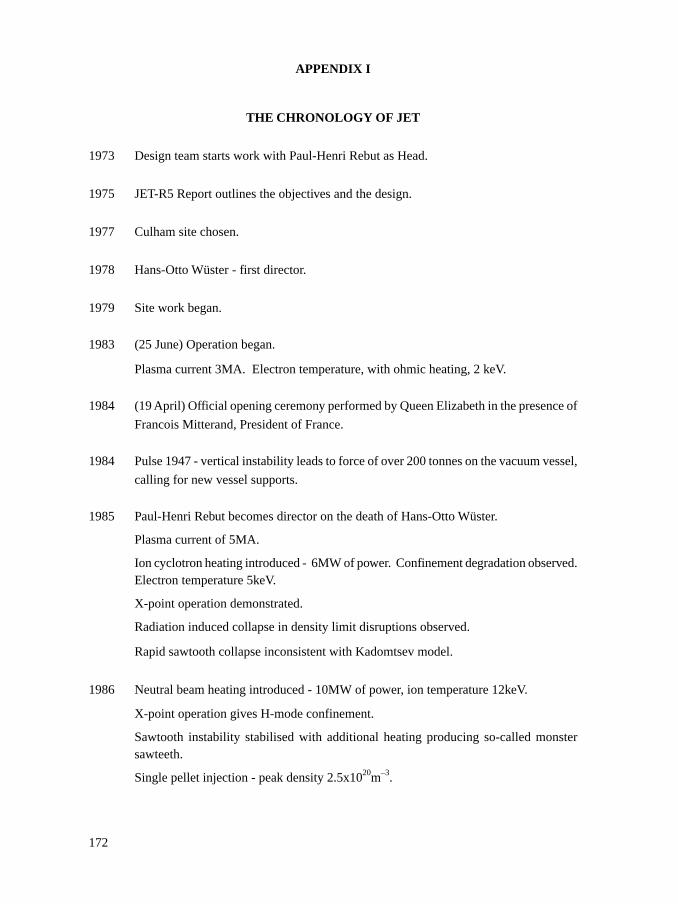
172
APPENDIX I
THE CHRONOLOGY OF JET
1973 Design team starts work with Paul-Henri Rebut as Head.
1975 JET-R5 Report outlines the objectives and the design.
1977 Culham site chosen.
1978 Hans-Otto Wüster - first director.
1979 Site work began.
1983 (25 June) Operation began.
Plasma current 3MA. Electron temperature, with ohmic heating, 2 keV.
1984 (19 April) Official opening ceremony performed by Queen Elizabeth in the presence of
Francois Mitterand, President of France.
1984 Pulse 1947 - vertical instability leads to force of over 200 tonnes on the vacuum vessel,
calling for new vessel supports.
1985 Paul-Henri Rebut becomes director on the death of Hans-Otto Wüster.
Plasma current of 5MA.
Ion cyclotron heating introduced - 6MW of power. Confinement degradation observed.Electron temperature 5keV.
X-point operation demonstrated.
Radiation induced collapse in density limit disruptions observed.
Rapid sawtooth collapse inconsistent with Kadomtsev model.
1986 Neutral beam heating introduced - 10MW of power, ion temperature 12keV.
X-point operation gives H-mode confinement.
Sawtooth instability stabilised with additional heating producing so-called monstersawteeth.
Single pellet injection - peak density 2.5x10²⁰m–3.
173
1987 Plasma current of 6MA, exceeding the design specification.
Electron temperature 10keV.
q = 2 disruption limit verified.
Experiments with multi-pellet injection system.
LIDAR system installed.
1988 Plasma current of 7MA.
Neutral beam injection reaches full power 21MW - ion temperature 20keV.
With combined neutral beam and ion cyclotron heating a total heating power of 35MWachieved.
Pellet enhanced performance (PEP) - first internal transport barrier observed.
Confinement time of 1 second in ohmically heated plasma.
1989 Introduction of beryllium tiles and beryllium evaporation.
Plasma temperature and neutron yield observed to collapse at “carbon bloom”.
Ion temperature exceeds 20keV.
1990 Ion cyclotron heating up-graded to 21MW.
Prototype lower-hybrid current drive introduced - current drive up to 1MA.
1991 (9 November) Preliminary tritium experiment - 1.7MW peak fusion power, 2MJ fusionenergy.
Problem of sudden loss of performance - the X-event - recognised. Possible implicationof “carbon bloom”.
Ion cyclotron current drive demonstrated, leading to sawtooth stabilisation by currentprofile modification.
AC operation demonstrated.
Plasma maintained for 1 minute.
Confinement time of 1.8 seconds in ohmically heated plasma.
Steady state H-modes for 18 seconds.
1992 Martin Keilhacker becomes director when Paul-Henri Rebut leaves to become directorof ITER.
Toroidal field ripple experiments.
Shut-down for installation of divertor.
174
1993 Installation of mark I divertor.
1994 Plasma detachment in divertor.
New target tile arrangement eliminates carbon bloom, but sudden loss of performancein high performance plasmas remains.
7MW of lower-hybrid power.
Saddle coils used for TAE experiments.
Steady-state ELMy H-modes (20secs) with density and impurity control achieved with
mark I divertor.
1995 Installation of mark II divertor.
Closed geometry raises divertor neutral pressure and so particle exhaust.
H-modes at 6MA.
1996 Recognition that abrupt change of global of confinement state underlies the X-event.
Optimised shear plasmas developed with internal transport barriers.
Study of dimensionless scaling of confinement.
Ion temperature exceeds 30keV.
1997 The deuterium-tritium experiments - 16MW of fusion power, 13.8MJ fusion energy,α-particle heating demonstrated, steady fusion power of 4MW maintained for
4seconds, ion temperature 40keV.
1998 Divertor replaced by gas-box divertor using fully remote handling.
1999 Jean Jacquinot becomes director on the retirement of Martin Keilhacker.
Study of physics of internal transport barriers.
Inside-launch pellet injector installed and enhanced fuelling demonstrated.
Joint Undertaking ends - JET to continue.
175
APPENDIX II
The success of JET was the result of the dedicated efforts of a large number of scientists and
engineers. Many of their names appear in the bibliographies of the various chapters, but often
the author lists were too long and required truncation. To put this right three complete lists of
the JET team are appended below. They are taken from particularly significant papers published
by the team at different stages of the project. The first is the list from the London IAEA Conference
of 1984, the first such conference after JET came into operation. The second is from the Nuclear
Fusion article (Vol. 32, p187, 1992) reporting the first tritium experiment. The third is the team
list from the Nuclear Fusion article (Vol. 39, p209, 1999) describing the record high fusion
power experiments.
1984 - THE FIRST EXPERIMENTS IN JET
P.-H.REBUT, D.V.BARTLETT, G.BÄUMEL, K.BEHRINGER, R.BEHRISCH1, E.BERTOLINI, C.BEST,
R.J.BICKERTON, F.BOMBI, J.L.BONNERUE, A.BOSCHI, G.BRACCO2, M.L.BROWNE, M.BRUSATI,
A.BULLIARD, D.J.CAMPBELL, P.G.CAROLAN3, J.CHRISTIANSEN, P.CHUILON, J.G.CORDEY, S.CORTI,
A.E.COSTLEY, G.DECKER4, K.J.DIETZ, D.F.DUCHS, G.DUESING, R.K.F.EMERY, W.W.ENGELHARDT ,
T.ERIKSSON, J.FESSEY, M.J.FORREST3, C.FROGER, K.FULLARD, M.GADEBERG5, A.GIBSON, R.GILL,
A.GONDHALEKAR, C.GOWERS, B.J.GREEN, G.GROSSO6, N.C.HAWKES3, J.HEMMERICH, M.HUART,
A.HUBBARD7, C.A.HUGENHOLTZ8, M.HUGUET, 0.N.JARVIS, B.E.JENSEN, E.M.JONES, G.E.KÄLLNE,
J.C.KÄLLNE, L.de KOCK, H.KRAUSE1, P.KUPSCHUS, J.R.LAST, E.LAZZARO, P.LOMAS,
G.M.McCRACKEN3, G.MAGYAR, F.K.MAST1, M.MEAD , P.L.MONDINO, P.MORGAN, A.W.MORRIS3,
L.NICKESSON, H.NIEDERMEYER1, P.NIELSEN, P.NOLL, J.PAILLÈRE, N.J.PEACOCK3, M.PICK, J.P.POFFÉ,
R.PRENTICE, C.RAYMOND, D.C.ROBINSON3, R.ROSS, G.SADLER, J.SAFFERT, V.SCHMIDT,
F.C.SCHÜLLER, K.SONNENBERG, M.F.STAMP. C.A.STEED, A.STELLA, P.E.STOTT, D.SUMMERS.
A.TANGA, P.R.THOMAS, G.TONETTI9, E.USSELMANN. P.VANBELLE, H.VANDERBEKEN ,
J.E.VANMONTFOORT, M.L.WATKINS. J.A.WESSON, T.WINKEL, V.ZANZA2, J.ZWART.
1. Euratom-IPP Association, Institut für Plasmaphysik, Garching, Federal Republic of Germany.
2. Euratom-ENEA Association, Centro di Frascati. Italy.
3. Euratom-UKAEA Association, Culham Laboratory, Abingdon, Oxfordshire, UnitedKingdom.
4. University of Düsseldorf, Düsseldorf, Federal Republic of Germany.
5. Euratom-Riso Association, Riso National Laboratory, Roskilde, Denmark.
6. Euratom-CNR Associaion, Istituto di Fisica del Plasma, Milan, Italy.
7. Imperial College of Science and Technology, University of London, London,
8. Euratom-FOM Association. FOM Instituut voor Plasmafysica, Nieuwegein, Netherlands.
9. Euratom-Suisse Association, Centre de Recherches en Physique des Plasmas, Lausanne, Switzerland.

176
1992 - FUSION ENERGY PRODUCTION FROM A DEUTERIUM-TRITIUM
PLASMA IN THE JET TOKAMAK
P.-H.REBUT, A.GIBSON, M.HUGUET, J.M.ADAMS1, B.ALPER. H.ALTMANN, A.ANDERSEN2, P.ANDREW3,
M.ANGELONE4, S.ALI-ARSHAD, P.BAIGGER, W.BAILEY,B .BALET, P.BARABASCHI, P.BARKER,
R.BARNSLEY5, M.BARONIAN, D.V.BARTLETT, L.BAYLOR6, A.C.BELL, G.BENALI, P.BERTOLDI,
E.BERTOLINI, V.BHATNAGAR, A.J.BICKLEY, D.BINDER, H.BINDSLEV2, T.BONICELLI, S.J.BOOTH,
G.BOSIA, M.BOTMAN, D.BOUCHER, P.BOUCQUEY, P.BREGER, H.BRELEN, H.BRINKSCHULTE,
D.BROOKS, A.BROWN, T.BROWN, M.BRUSATI, S.BR YAN, J.BRZOZOWSKI7, R.BUCHSE22, T.BUDD,
M.BURES, T.BUSINARO, P.B UTCHER, H.BUTTGEREIT, C.CALDWELL-NICHOLS, D.J.CAMPBELL,
P.CARD, G.CELENTANO, C.D.CHALLIS, A.V.CHANKIN8, A.CHERUBINI, D.CHIRON, J.P.CHRISTIANSEN,
P.CHUILON, R.CLAESEN, S.CLEMENT, E.CLIPSHAM, J.P.COAD, I.H.COFFEY9, A.COLTON,
M.COMISKEY10, S.CONROY, M.COOKE, D.COOPER, S.COOPER, J.G.CORDEY, W.CORE, G.CORRIGAN,
S.CORTI, A.E.COSTLEY, G.COTTRELL, M.COX11, P.CRIPWELL12, 0.Da COSTA, J.DAVIES, N.D AVIES,
H.de BLANK, H.deESCH, L.deK OCK, E.DEKSNIS, F.DELVART, G.B.DENNE-HINNOV, G.DESCHAMPS,
W.J.DICKSON13, K.J.DIETZ, S.L.DMITRENKO, M.DMITRIEVA14, J.DOBBING, A.DOGLIO, N.DOLGETTA,
S.E.DORLING. P.G.DOYLE, D.F.DOCHS, H.DUQUENOY, A.EDWARDS, J.EHRENBERG, A.EKEDAHL,
T.ELEVANT7, S.K.ERENTS 11, L.-G.ERIKSSON, H.FAJEMIROKUN12, H.FALTER, J.FREILING15,
F.FREVILLE, C.FROGER, P.FROISSARD, K.FULLARD, M.GADEBERG, A.GALETSAS, T.GALLAGHER,
D.GAMBIER, M.GARRIBBA, P.GAZE, R.GIANNELLA, R.D.GILL, A.GIRARD, A.GONDHALEKAR,
D.GOODALL11, C.GORMEZANO, N.A.GOTTARDI, C.GOWERS, B.J.GREEN, B.GRIEVSON, R.HAANGE,
A.HAIGH, C.J.HANCOCK, P.J.HARBOUR, T.HARTRAMPF, N.C.HAWKES11, P.HAYNES11,
L.L.HEMMERICH, T.HENDER11, J.HOEKZEMA, D.HOLLAND, M.HONE, L.HORTON, J.HOW, M.HUART,
I.HUGHES, T.P.HUGHES10, M.HUGON, Y.HUO16, K.IDA17, B.INGRAM, M.IRVING, J.JACQUINOT,
H.JAECKEL, L.F.JAEGER, G.JANESCHITZ, Z.JANKOVICZ18, 0.N.JARVIS, F.JENSEN, E.M.JONES,
H.D.JONES, L.P.D.F.JONES, S.JONES19, T.T.C.JONES, LF .JUNGER, F.JUNIQUE, A.KAYE, B.E.KEEN,
M.KEILHACKER, G.J.KELLY, W.KERNER, A.KHUDOLEEV21, R.KONIG, A.KONSTANTELLOS,
M.KOVANEN20, G.KRAMER15, P.KUPSCHUS, R.LASSER, J.R.LAST, B.LAUNDY, L.LAURO-TARONI,
M.LAVEYRY, K.LAWSON11, M.LENNHOLM, J.LINGERTAT22, R.N.LITUNOVSKI, A.LOARTE, R.LOBEL,
P LOMAS , MLOUGHLIN , C.LOWRY, J LUPO , A.C.MAAS15, J.MACHUZAC19, B.MACKLIN,
G.MADDISON11, C.F.MAGGI23, G.MAGYAR, W.MANDL22, V.MARCHESE, G.MARCON, F.MARCUS,
J.MART, D.MARTIN, E.MARTIN, R.MARTIN-SOLIS24, P.MASSMANN, G.MATTHEWS, H.McBRYAN,
G.McCRACKEN11, J.McKIVITT, P.MERIGUET, P.MIELE, A.MILLER, J.MILLS, S.F.MILLS, P.MILLWARD,
P.MILVERTON, E.MINARDI4, R.MOHANT121, P.L.MONDINO, D.MONTGOMERY26, A.MONTVAI27,
P.MORGAN, H.MORSI, D.MUIR, G.MURPHY, R.MYRNAS28, F.NAVE, G.NEWBERT, M.NEWMAN,
P.NIELSEN, P.NOLL, W.OBERT, D.O’BRIEN, J.ORCHARD, J.W.ROURKE, R.OSTROM, M.OTTAVIANI,
M.PAIN, F.PAOLETTI, S.PAPASTERGIOU, W.PARSONS, D.PASINI, D.PATEL, A.PEACOCK, N.PEACOCK11,
R.LM.PEARCE, D.PEARSON12, J.F.PENG16, R.PEPEDESIL VA, G.PERINIC, C.PERRY, M.PETROV21,
177
M.A.PICK, J.PLANCOULAINE, J-P.POFFÉ, R.PÖHLCHEN, F.PORCELLI, L.PORTE13, R.PRENTICE,
S.PUPPIN, S.PUTVINSKI8, G.RADFORD30, T.RAIMONDI, M.C.RAMOSDEANDRADE, R.REICHLE,
J.REID, S.RICHARDS, E.RIGHI, F.RIMINI, D.ROBINSON11, A.ROLFE, R.T.ROSS, L.ROSSI, R.RUSS,
P.RUTTER, H.C.SACK, G.SADLER, G.SAIBENE, L.L.SALANAVE, G.SANAZZARO, A.SANTAGIUSTINA,
R.SARTORI, C.SBORCHIA, P.SCHILD, M.SCHMID, G.SCHMIDT31, B.SCHUNKE, S.M.SCOTT, LSERIO ,
A.SIBLEY, R.SIMONINI, A.C.C.SIPS, P.SMEULDERS, R.SMITH, R.STAGG, M.STAMP, P.STANGEBY3,
R.STANKIEWICZ32, D.F.START, C.A.STEED, D.STORK, P.E.STOTT, P.STUBBERFIELD, D.SUMMERS,
H.SUMMERS13, L.SVENSSON, J.A.TAGLE33, M.TALBOT, A.TANGA, A.TARONI, C.TERELLA,
A.TERRINGTON, A.TESINI, P.R.THOMAS, E.THOMPSON, K.THOMSEN, F.TIBONE, A.TISCORNIA,
P.TREVALION, B.TUBBING, P.VANBELLE, H.VANDERBEKEN , G.VLASES, M.VONHELLERMANN ,
T.WADE, C.WALKER, R.WALTON31, D.WARD, M.L.WATKINS, N.WATKINS, J.WATSON, S.WEBER34,
J.WESSON, T.J.WUNANDS, J.WILKS, D.WILSON, T.WINKEL, R.WOLF, D.WONG, C.WOODWARD, Y.WU35,
M.WYKES, D.YOUNG, I.D.YOUNG, L.ZANNELLI, A.ZOLFAGHARI19, W.ZWINGMANN.
1. Harwell Laboratory, UKAEA, Harwell, Didcot, Oxfordshire, UK.
2. Riso National Laboratory, Roskilde, Denmark.
3. Institute for Aerospace Studies, University of Toronto, Downsview, Ontario, Canada.
4. ENEA Frascati Energy Research Centre, Frascati, Rome, Italy.
5. University of Leicester, Leicester, UK.
6. Oak Ridge National Laboratory, Oak Ridge, TN, USA.
7. Royal Institute of Technology, Stockholm, Sweden.
8. I.V. Kurchatov Institute of Atomic Energy, Moscow, Russian Federation.
9. Queens University, Belfast, UK.
10. University of Essex, Colchester, UK.
11. Culham Laboratory, UKAEA, Abingdon, Oxfordshire, UK.
12. Imperial College of Science, Technology and Medicine, University of London, London, UK.
13. University of Strathclyde, Glasgow, UK.
14. Keldysh Institute of Applied Mathematics, Moscow, Russian Federation.
15. FOM-Institute for Plasma Physics “Rijnhuizen”, Nieuwegein, Netherlands.
16. Institute of Plasma Physics, Academia Sinica, Hefei, Anhui Province, China.
17. National Institute for Fusion Science, Nagoya, Japan.
18. Soltan Institute for Nuclear Studies, Otwock/Swierk, Poland.
19. Plasma Fusion Center, Massachusetts Institute of Technology, Boston, MA, USA.
20. Nuclear Engineering Laboratory, Lappeenranta University, Finland.
21. A.F. Ioffe Physico-Technical Institute, St. Petersburg, Russian Federation.
22. Max-PlanckInstitut ffir Plasmaphysik, Garching, Germany.
23. Department of Physics, University of Milan, Milan, Italy.
24. Universidad Complutense de Madrid, Madrid, Spain.
178
25. North Carolina State University, Raleigh. NC, USA.
26. Dartmouth College, Hanover, NH, USA.
27. Central Research Institute for Physics, Budapest, Hungary.
28. University of Lund, Lund, Sweden.
29. Laboratorio Nacional de Engenharia e Tecnologia Industrial, Sacavem, Portugal.
30. Institute of Mathematics, University of Oxford, Oxford, UK.
31. Princeton Plasma Physics Laboratory, Princeton University, Princeton, NJ, USA.
32. RCC Cyfronet, Otwock/Swierk, Poland,
33. Centro de Investigaciones Energdticas, Medioambientales y Tecnologicas, Madrid, Spain.
34. Freie Universitat. Berlin. Germany.
35. Insitute for Mechanics, Academia Sinica. Beijing, China.
1999 - HIGH FUSION PERFORMANCE FROM DEUTERIUM - TRITIUM PLASMAS
IN JET.
S.ARSHAD, D.BAILEV, N.BAINBRIDGE., B.BALET. Y.BARANOV4, P.BARKER, R.BARNSLEY5,
M.BARONIAN, D.V.BARTLETT, A.C.BELL, L.BERTALOT, E.BERTOLINI, V.BHATNAGAR, A.J.BICKLEY,
H.BINDSLEV, K.BLACKLER, D.BOND, T.BONICELLI, D.BORBA7, M.BRANDON, P.BREGER, H.BRELEN,
P.BRENNAN, W.J.BREWERTON, M.L.BROWNE, T.BUDD, R.V.BUDNY8, A.BURT, T.BUSINARO, M.BUZIO,
C.CALDWELL-NICHOLS, D.CAMPLING, P.CARD, C.D.CHALLIS, A.V.CHANKIN, D.CHIRON.
J.P.CHRISTIANSEN, P.CHUILON, D.CIRIC, R.CLAESEN, H.E.CLARKE, S.CLEMENT, I.COFFEY9,
S.CONROY10, G.CONWAY11, S.COOPER, J.G.CORDEY, G.CORRIGAN, G.COTTRELL, M.COX9, S.J.COX,
R.CUSACK, N.DAVIES, S.J.DAVIES, J.J.DAVIS, M.DEBENEDETTI. H.DEESCH, J.DEHAAS , E.DEKSNIS,
N.DELIANAKIS, A.DINES, S.L.DMITRENKO, J.DOBBING. N.DOLETTA. S.E.DORLING. P.G.DOYLE,
H.DUQUENOY, A.M.EDWARDS9 A.W.EDWARDS, J.EGEDAL, J.EHRENBERG, A.EKEDAHL12,
T.ELEVANT12, J.ELLIS, M.ENDLER13, S.K.ERENTS9, G.ERICSSON10, L.-G.ERIKSSON, B ESPOSITO6,
HFAL TER, J.FARTHING, M.FICHTMÜLLER, G.M.FISHPOOL, K.FULLARD, M.GADEBER, L.GALBIATI,
A.GIBSON, R.D.GILL, D.GODDEN, A.GONDHALEKAR, D.GOODALL9, C.GORMEZANO, C.GOWERS,
M.GROTH14, K.GUENTHER, H.GUO, A.HAIGH, B.HAIST15, C.J.HANCOCK, P.J.HARBOUR,
N.C.HAWKES9, N.P.HAWKES1, J.L.HEMMERICH, T.HENDER9, J.HOEKZEMA, L.HORTON, A.HOWMAN,
M.HUART, T.P.HUGHES, F.HURD, G.T.A.HUYSMANS, C.INGESSON16, B.INRAM, M.IRVING,
J.JACQUINOT, H.JAECKEL, J.F.JAEGER, 0.N.JARVIS, M.JOHNSON, E.M.JONES, T.T.C.JONES,
J.-F.JUNGER, F.JUNIQUE, C.JUPEN, J.KALLNE10, A.KAYE, B.E.KEEN, M.KEILHACKER, W.KERNER,
N.G.KIDD, S.KNIPE, R.KONIG, A.KOROTKOV, A.KRASILNIK OV2, J.G.KROM, P.KUPSCHUS , R.LÄSSER,
J.R.LAST, L.LAURO-TARONI, K.LAWSON9, M.LENNHOLM, J.LINGERTAT, X.LITAUDON17, T.LOARER,
P.J.LOMAS, M.LOUGHLIN, C.LOWRY, A.C.MAAS16, B.MACKLIN, C.F.MAGGI, M.MANTSINEN18,
V.MARCHESE, F.MARCUS, J.MART, D.MARTIN, G.MATTHEWS, H.McBRYAN, G.McCRACKEN,
179
P.A.McCULLEN, A.MEIGS, R.MIDDLETON, P.MIELE, F.MILANI, J.MILLS, R.MOHANTI, R.MONK,
P.MORGAN, G.MURPHY, M.F.NAVE7, G.NEWBERT, P.NIELSEN, P.NOLL, W.OBERT, D.O’BRIEN,
M.O’MULLANE, E.OORD, R.OSTROM, S.PAPASTERGIOU, V.V.PARAIL, R.PARKINSON, W.PARSONS,
B.PATEL, A.PAYNTER, A.PEACOCK, R.J.H.PEARCE, A.PEREVERENTSEV, M.A.PICK, J.PLANCOULAINE,
0.POGUTSE, R.PRENTICE, S.PUPPIN, G.RADFORD19, R.REICHLE, V.RICCARDO, F.G.RIMINI,
F.ROCHARD17, A.ROLFE, A.L.ROQUEMORE8, R.T.ROSS, A.ROSSI, G.SADLER, G.SAIBENE,
A.SANTAGIUSTINA, R.SARTORI, R.SAUDERS, P.SCHILD, M.SCHMID, V.SCHMIDT, B.SCHOKKER16,
B.SCHUNKE, S.M.SCOTT, S.SHARAPOV, A.SIBLEY, M.SIMON, R.SIMONINI, A.C.C.SIPS, P.SMEULDERS,
P.SMITH, R.SMITH, F.SÖLDNER, J.SPENCE, E.SPRINGMANN, R.STAGG, M.STAMP, P.STANGEBY20,
D.F.START, D.STORK, P.E.STOTT, J.D.STRACHAN8, P.STUBBERFIELD, D.SUMMERS, L.SVENSSON,
P.SVENSSON, A.TABASSO3, M.TABELLINI, J.TAIT, A.TANGA, A.TARONI, C.TERELLA, P.R.THOMAS,
K.THOMSEN, E.TRANEUS10, B.TUBBING, P.TWYMAN, A.VADGAMA, P.VANBELLE, G.C.VLASES,
M.VON HELLERMANN, T.WADE, R.WALTON, D.WARD, M.L.WATKINS, N.WATKINS, M.J.WATSON,
M.WHEATLEY, D.WILSON, T.WINKEL, D.YOUNG, I.D.YOUNG, Q.YU21, K.-D.ZASTROW,
W.ZWINGMANN.
1. UKAEA. Harwell. Didcot. Oxfordshire. UK.
2. TRINITI, Troitsk. Moscow, Russian Federation.
3. Imperial College, University of London, UK.
4. A.F. loffe Institute, St. Petersburg, Russian Federation.
5. University of Leicester, Leicester. UK.
6. ENEA, CRE Frascati, Rome, Italy.
7. IST, Centro de Fusao Nuclear, Lisbon, Portugal.
8. Princeton Plasma Physics Laboratory, Princeton, New Jersey, USA.
9. UKAEA Culham Laboratory, Abingdon, Oxfordshire, UK.
10. Department of Neutron Research, Uppsala University, Sweden.
11. University of Saskatchewan, Saskatoon, Canada.
12. Royal Institute of Technology, Stockholm, Sweden.
13. Max-Planck-Institut für Plasmaphysik, Garching, Germany.
14. University of Manchester Institute of Science and Technology, Manchester, Lancashire, UK.
15. FZ, Jullich, Germany.
16. FOM Instituut voor Plasmafysica, Nieuwegein, Netherlands.
17. CEA Cadarache, St. Paul-lez-Durance, France.
18. Helsinki University of Technology, Espoo, Finland.
19. Institute of Theoretical Physics, University of Oxford, Oxfordshire, UK.
20. Institute for Aerospace Studies, University of Toronto, Ontario, Canada.
21. Institute of Plasma Physics, Hefei, China.